tryCatch({ plots <-list()for (station_name inunique(cruise_df$station)) { subset_df <-filter(cruise_df, station == station_name) plots[[station_name]] <-ggplot(subset_df, aes(x = time_elapsed)) +geom_point(aes(y = depth), color ="blue") +# Plot depth in bluegeom_line(aes(y = sea_water_pressure), color ="red") +# Plot sea water pressure in redggtitle(glue("{station_name}")) +theme(axis.title.x =element_blank(),axis.title.y =element_blank(),axis.text.x =element_blank(),axis.text.y =element_blank(),axis.ticks.x =element_blank(),axis.ticks.y =element_blank() ) # Remove individual axis titles and text }# drop nulls plots <- purrr::compact(plots)# Combine all plots into a grid combined_plot <-wrap_plots(plots) +plot_layout(ncol =4) +# Adjust ncol to set number of columns in the gridplot_annotation(title ="Depth (blue) and Pressure (red)",subtitle ="Each panel represents a different station",caption ="Time Elapsed (x-axis) vs Depth & Pressure (y-axis)" ) +theme(plot.tag =element_text(size =12, face ="bold"),plot.tag.position ="topleft",axis.title.x =element_text(margin =margin(t =10)),axis.title.y =element_text(margin =margin(r =10)) )print(combined_plot)}, error =function(er){print(er)});
Warning: Removed 1 row containing missing values or values outside the scale range
(`geom_point()`).
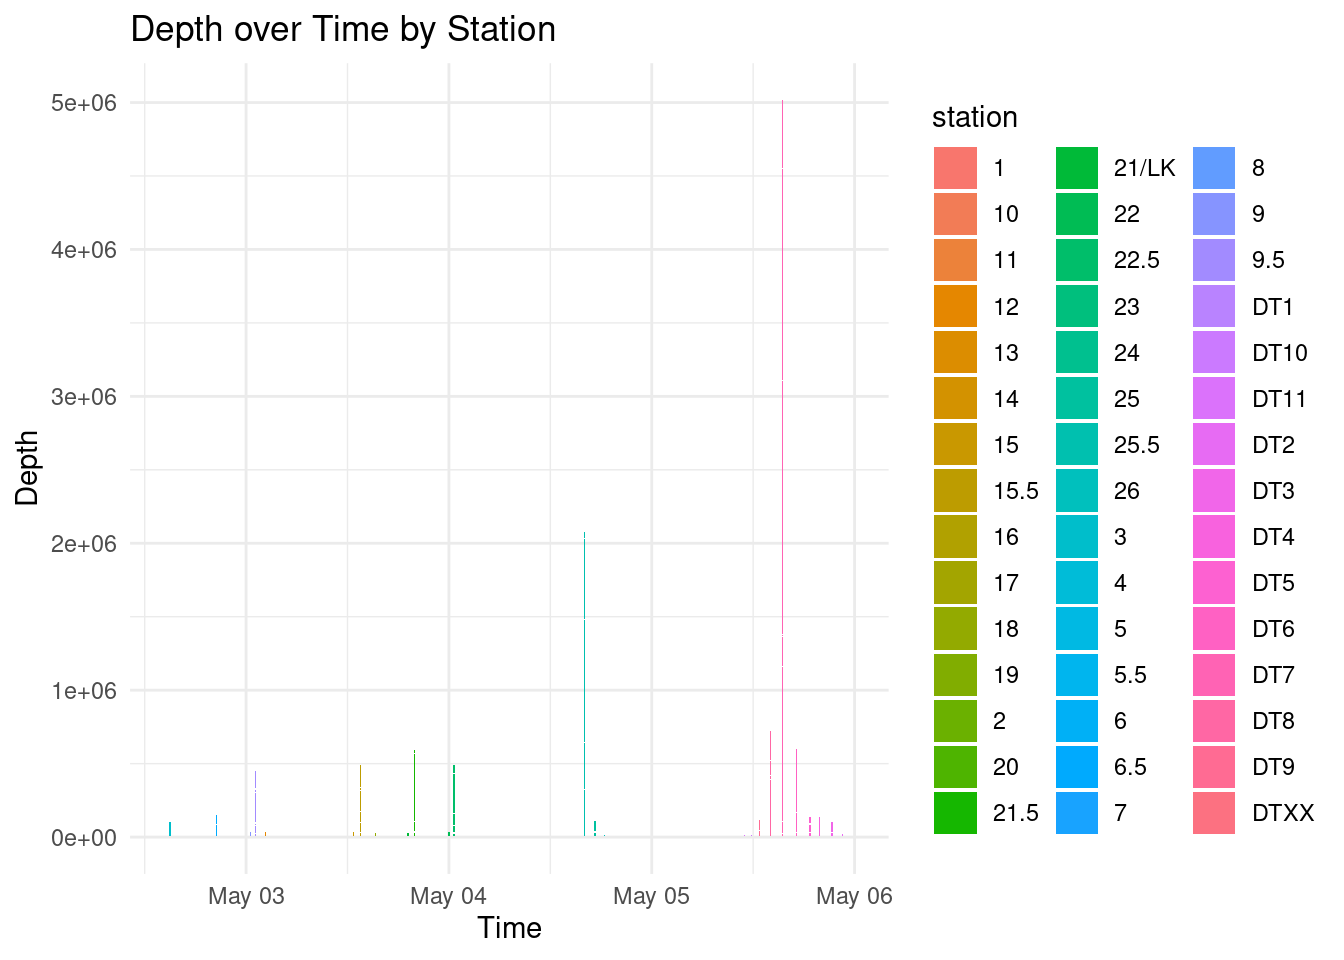
plot across all stations
p <-ggplot(cruise_df, aes(x = time, y = depth, fill = station)) +geom_col() +# This creates the bars# geom_text(aes(label = station), vjust = -0.3) + # This adds labels to each bar, adjust vjust for positionlabs(x ="Time", y ="Depth", title ="Depth over Time by Station") +# Set labels and titletheme_minimal() # Use a minimal themeprint(p)
Warning: Removed 1 row containing missing values or values outside the scale range
(`geom_col()`).
create oce.ctd objects from dataframes
ctd_load <-function(data, other_params =NULL) {# create csv into ctd object test_ctd <-as.ctd(salinity = data$sea_water_salinity,temperature = data$sea_water_temperature,pressure = data$sea_water_pressure,station = data$station )# add additional columns to ctd objectif (!is.null(other_params)) {for (param_name in other_params) { test_ctd <-oceSetData(object = test_ctd,name = param_name,value = data[[param_name]] ) } }print(glue("{data$station[1]}:\t{length(test_ctd@data$scan)} scans"))return(test_ctd)}# Define other parameters to addother_params <-c("cruise_id", "station", "time", "time_elapsed", "latitude", "longitude", "sea_water_electrical_conductivity", "CDOM", "dissolved_oxygen","oxygen_saturation", "chlorophyll_concentration", "chlorophyll_fluorescence", "photosynthetically_available_radiation", "beam_attenuation","beam_transmission", "depth", "sea_water_sigma_t","descent_rate", "sound_velocity","altimeter")# Split data by station and create data listctd_FK <- cruise_df %>%split(.$station) %>%map(~ctd_load(.x, other_params = other_params)) # ~ is a lambda(x)
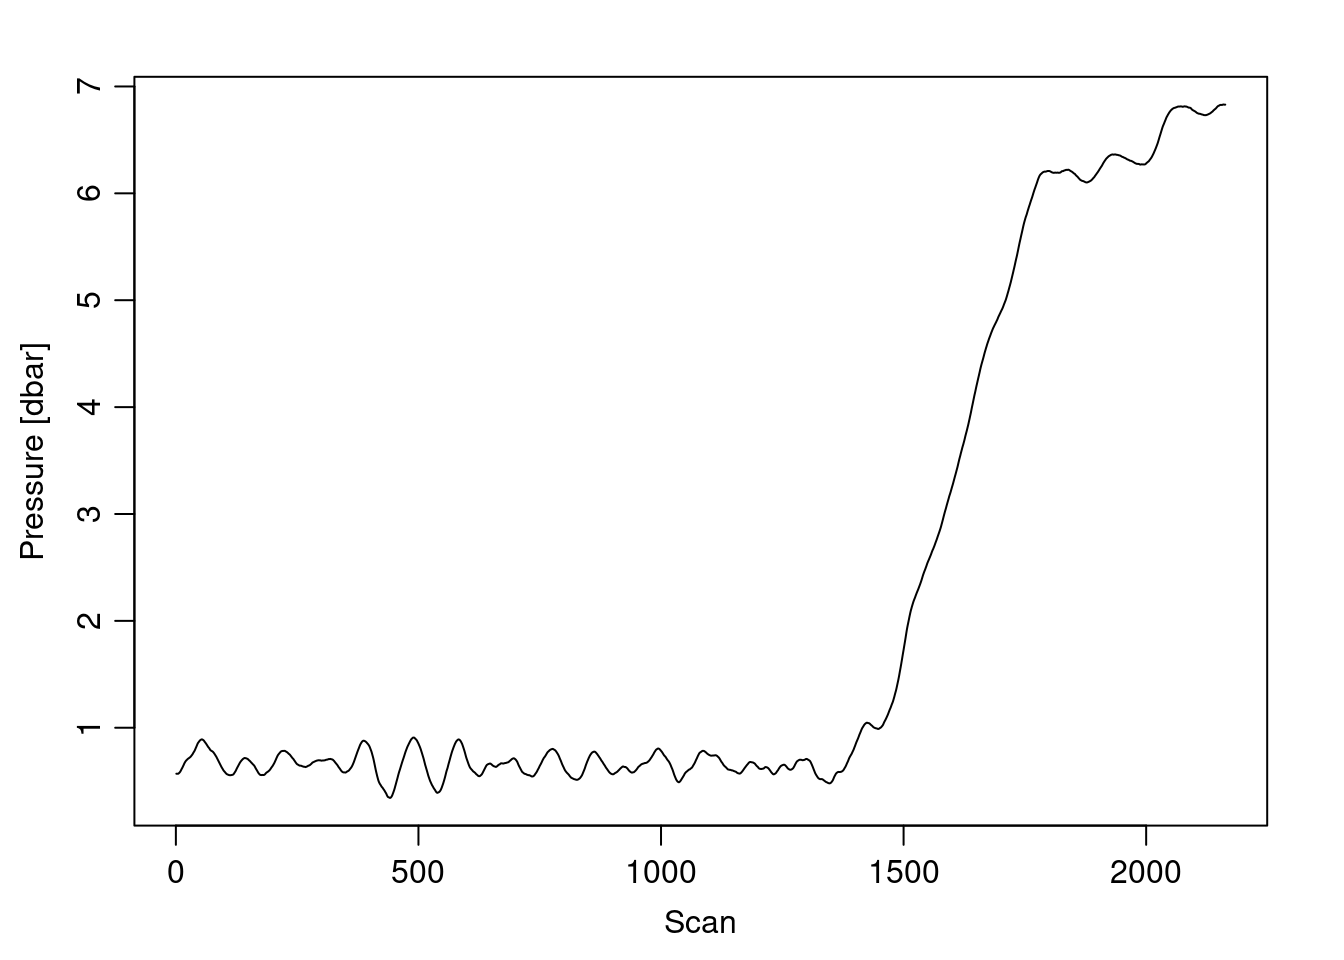
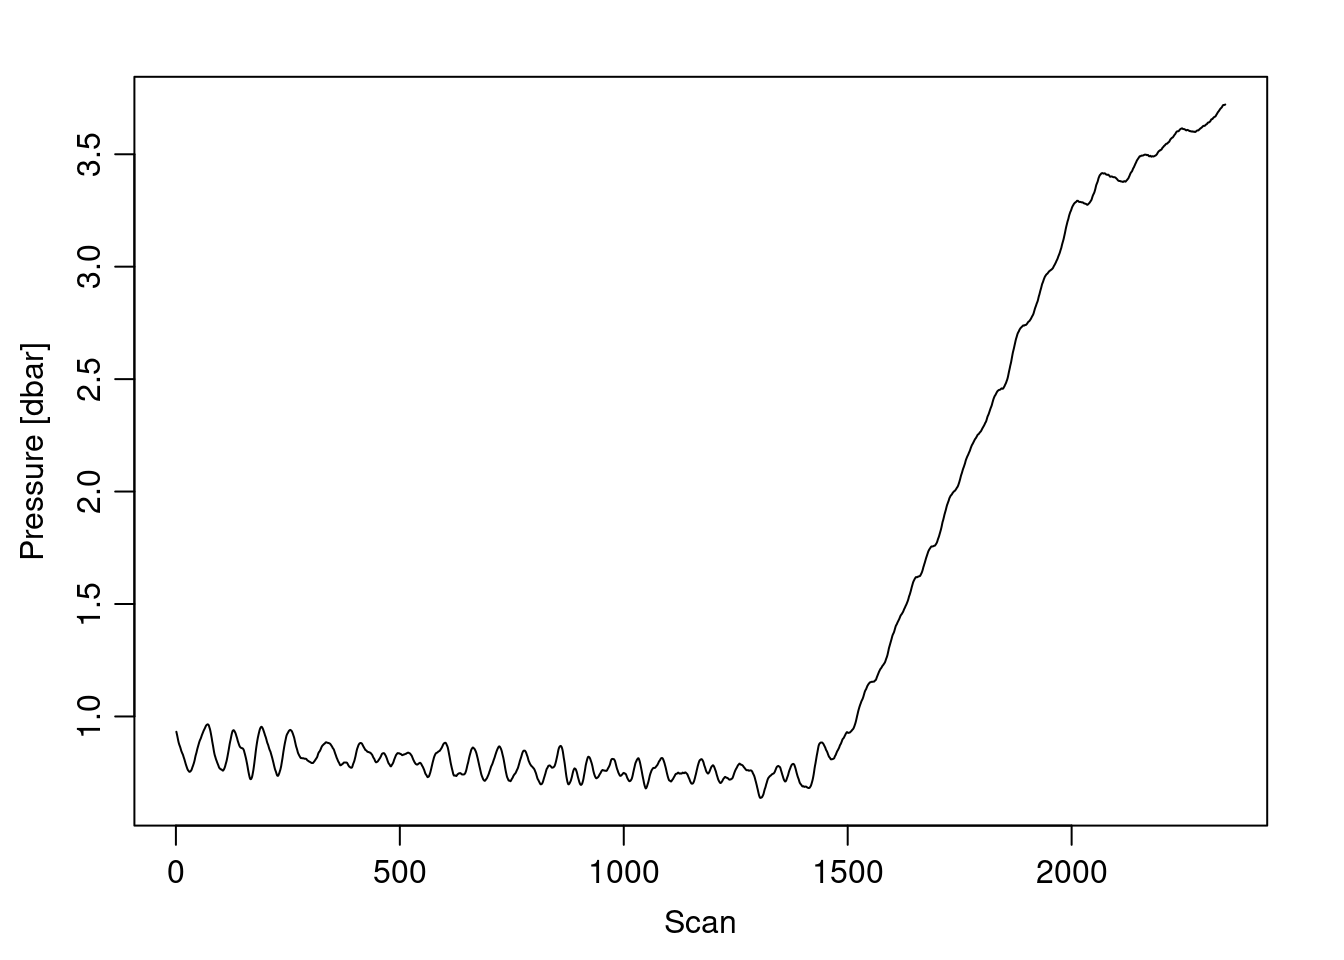
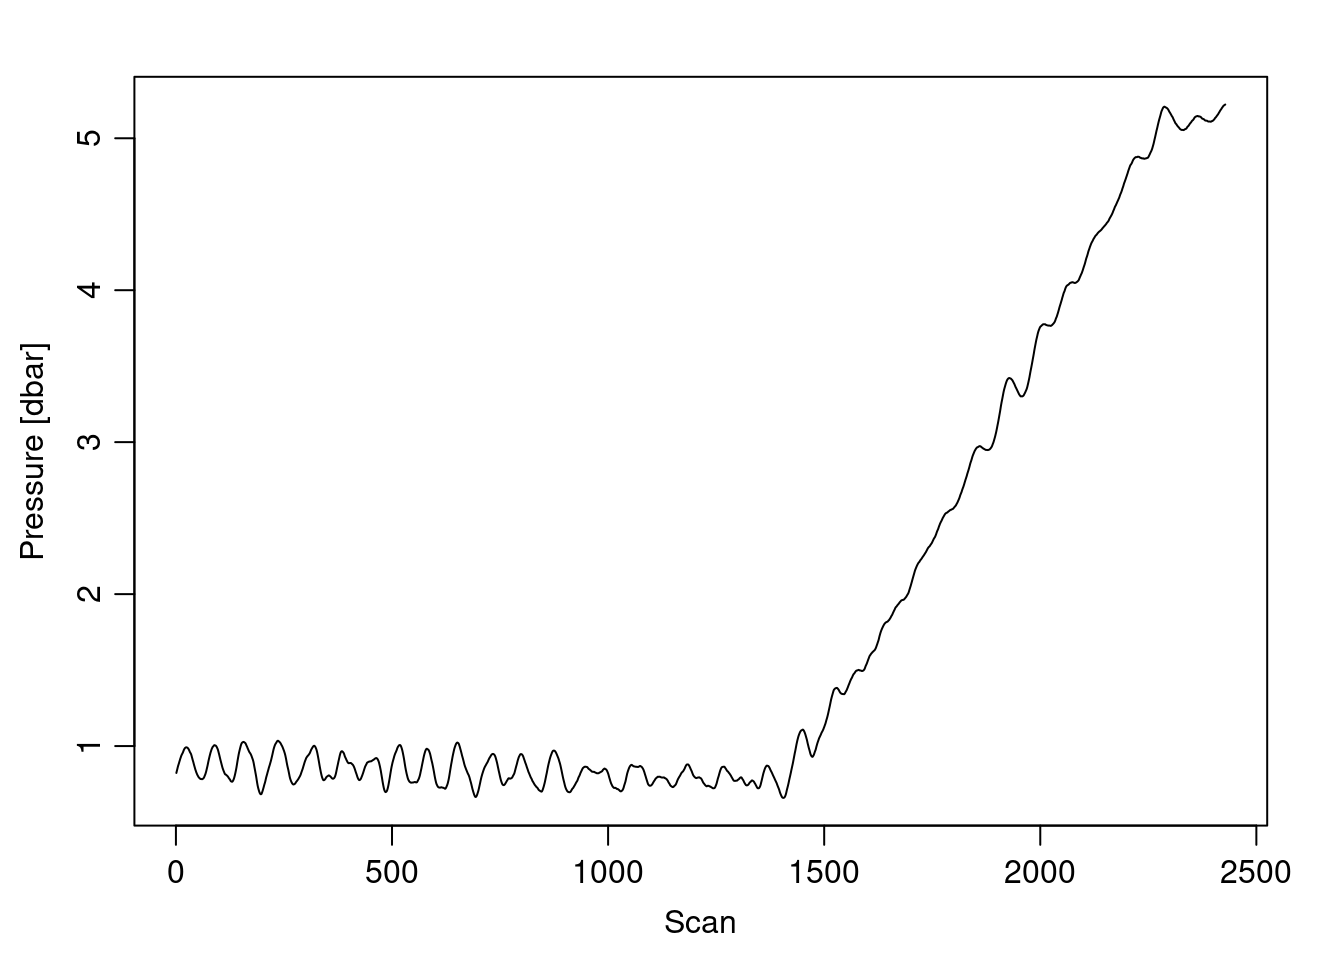
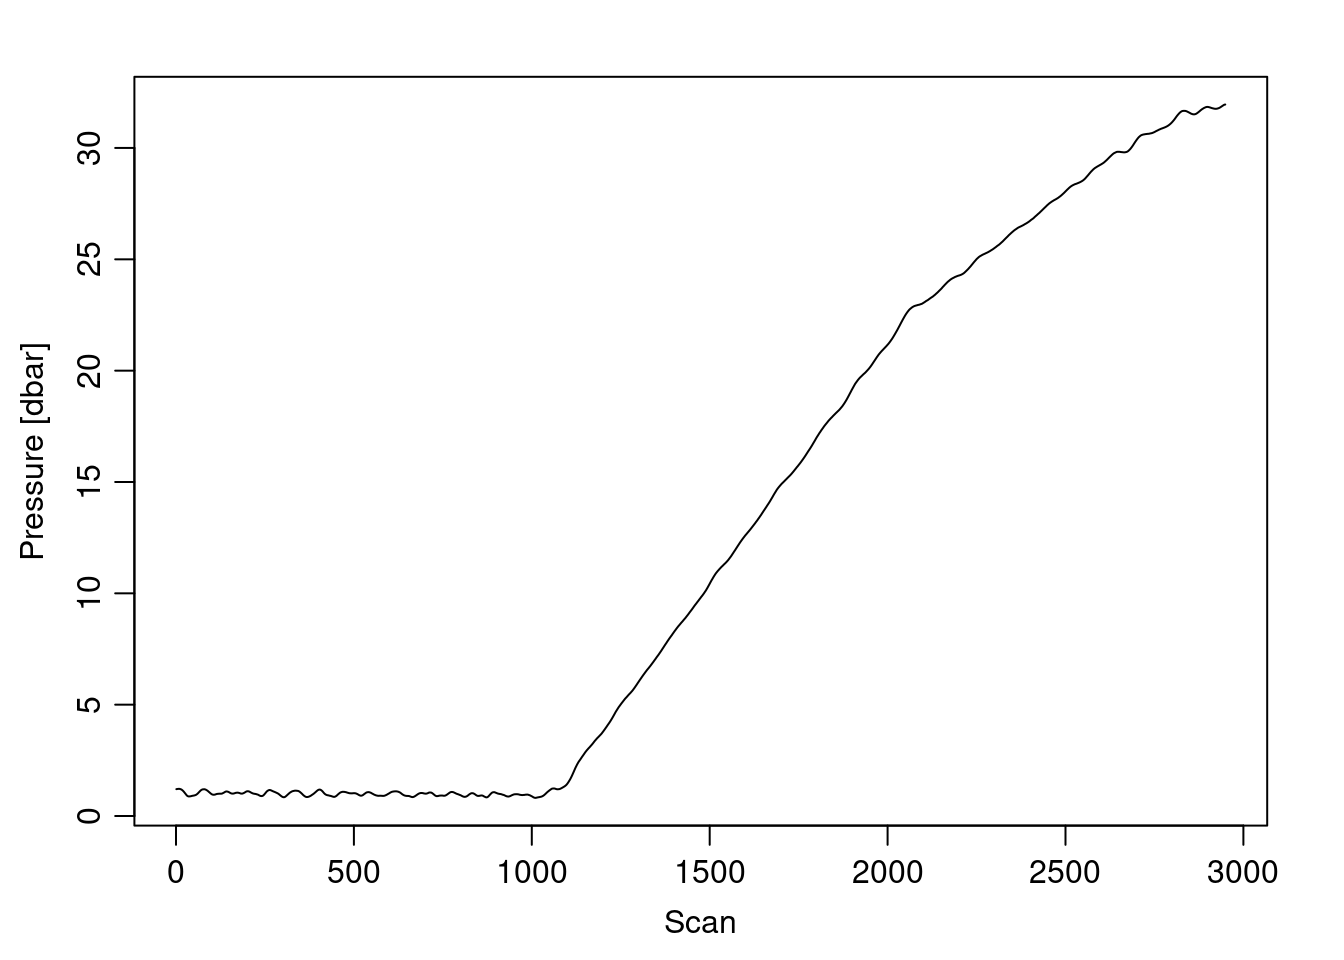
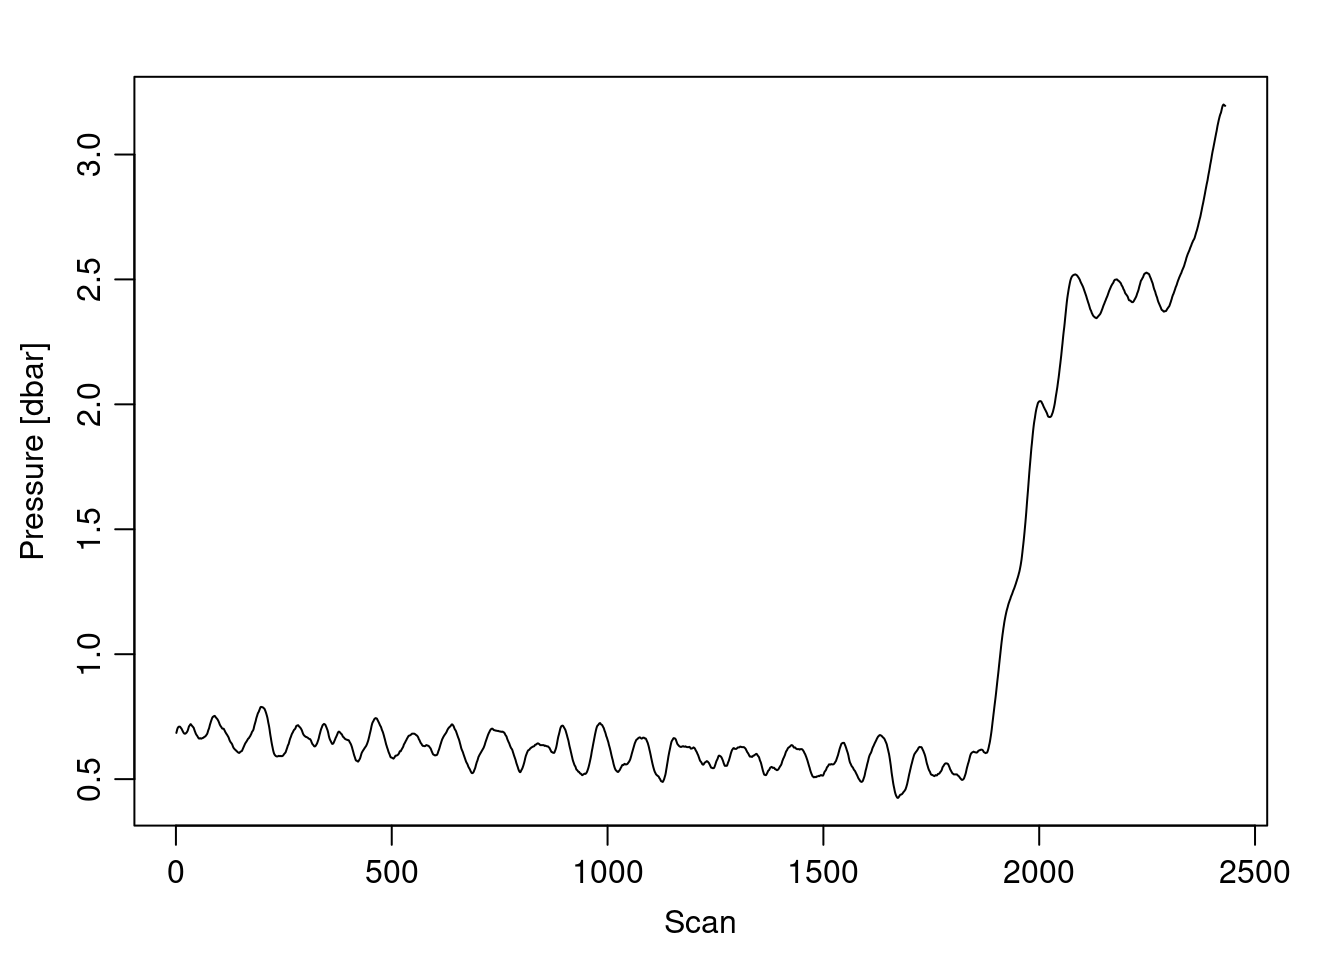
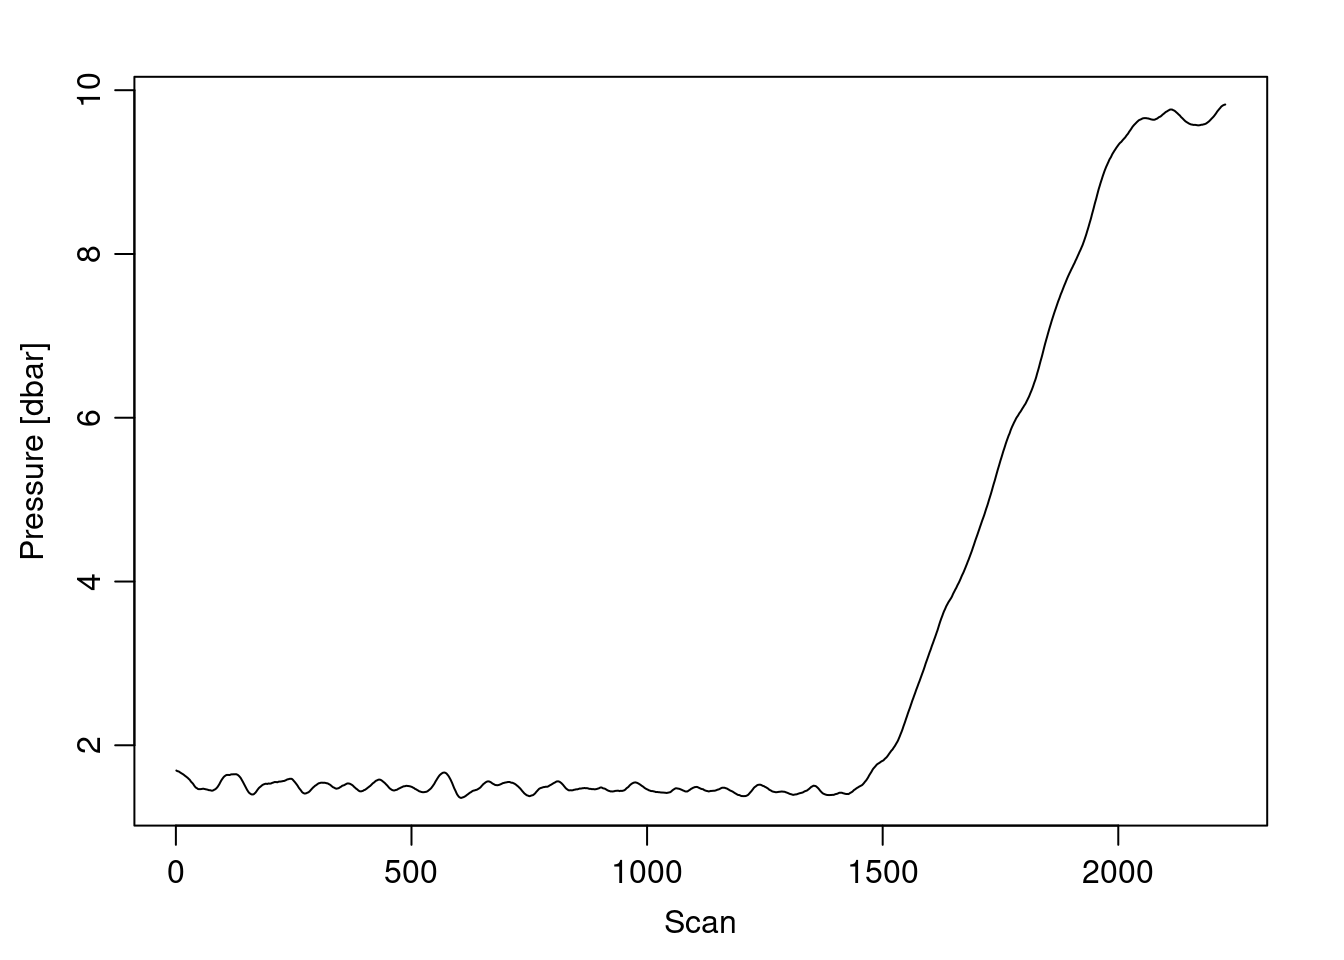
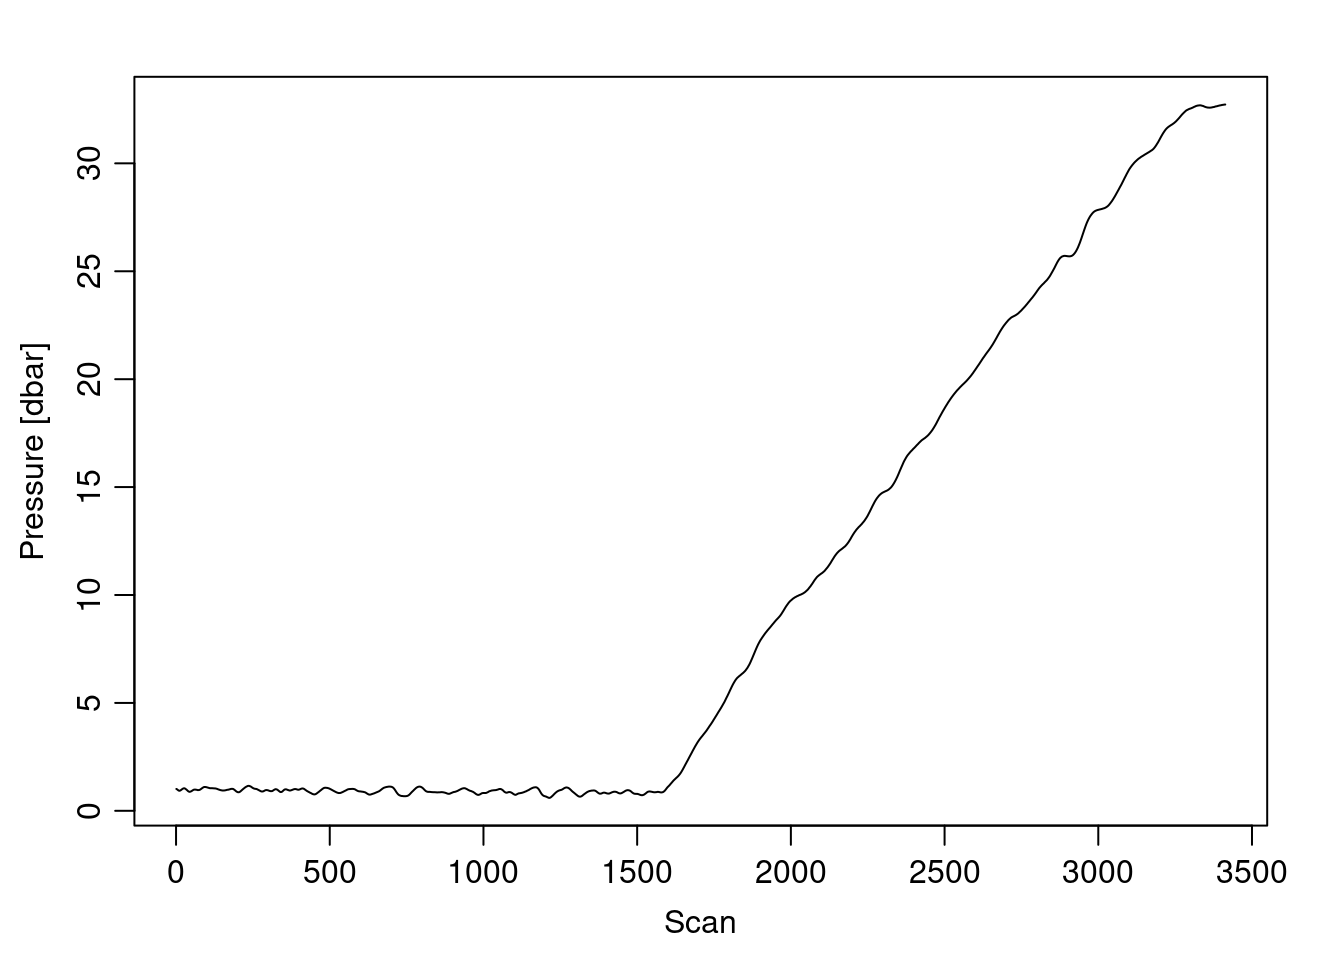
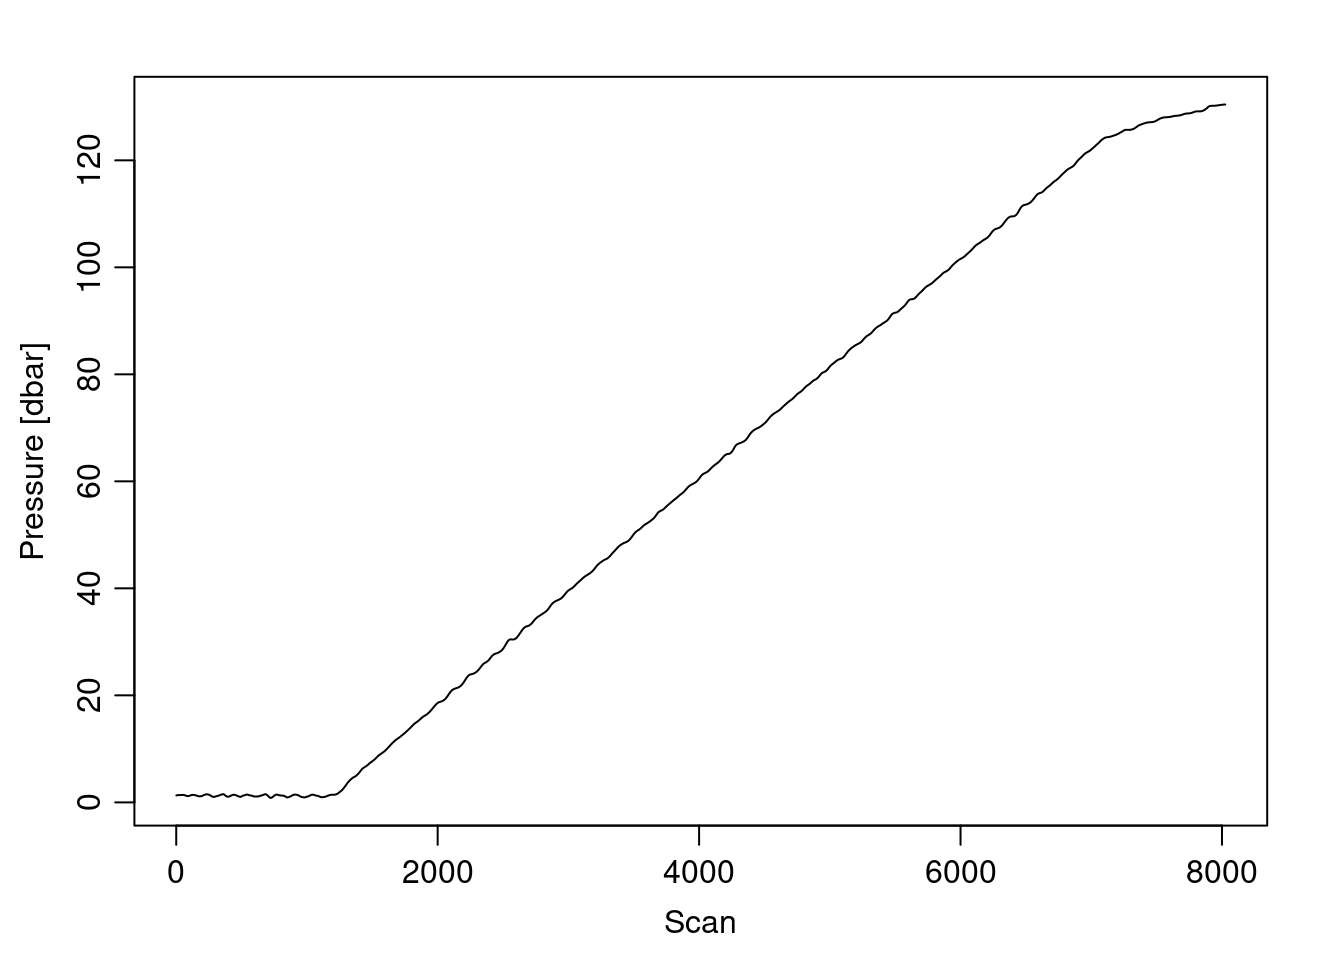
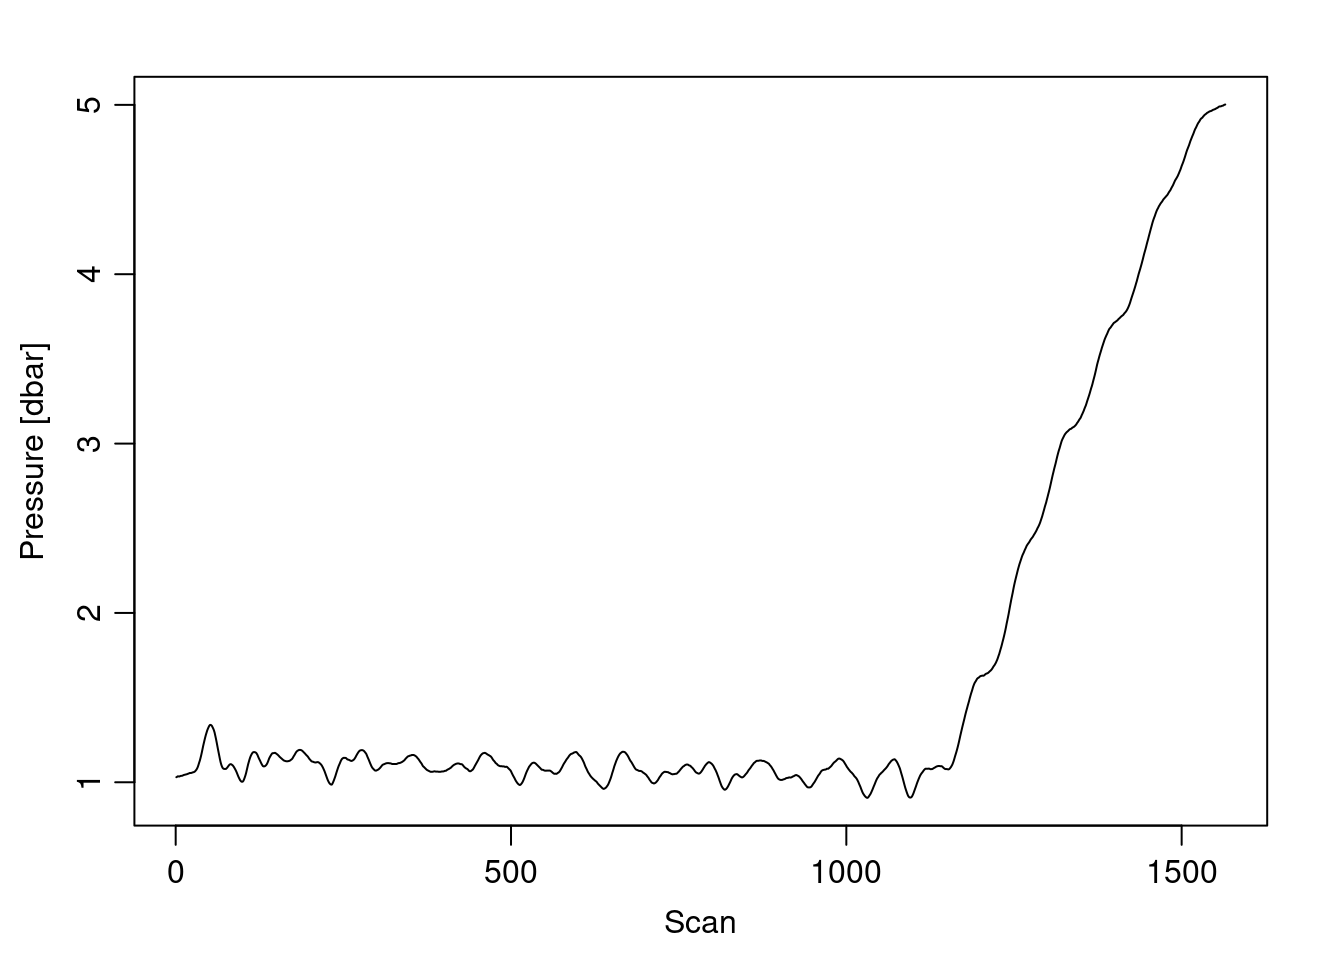
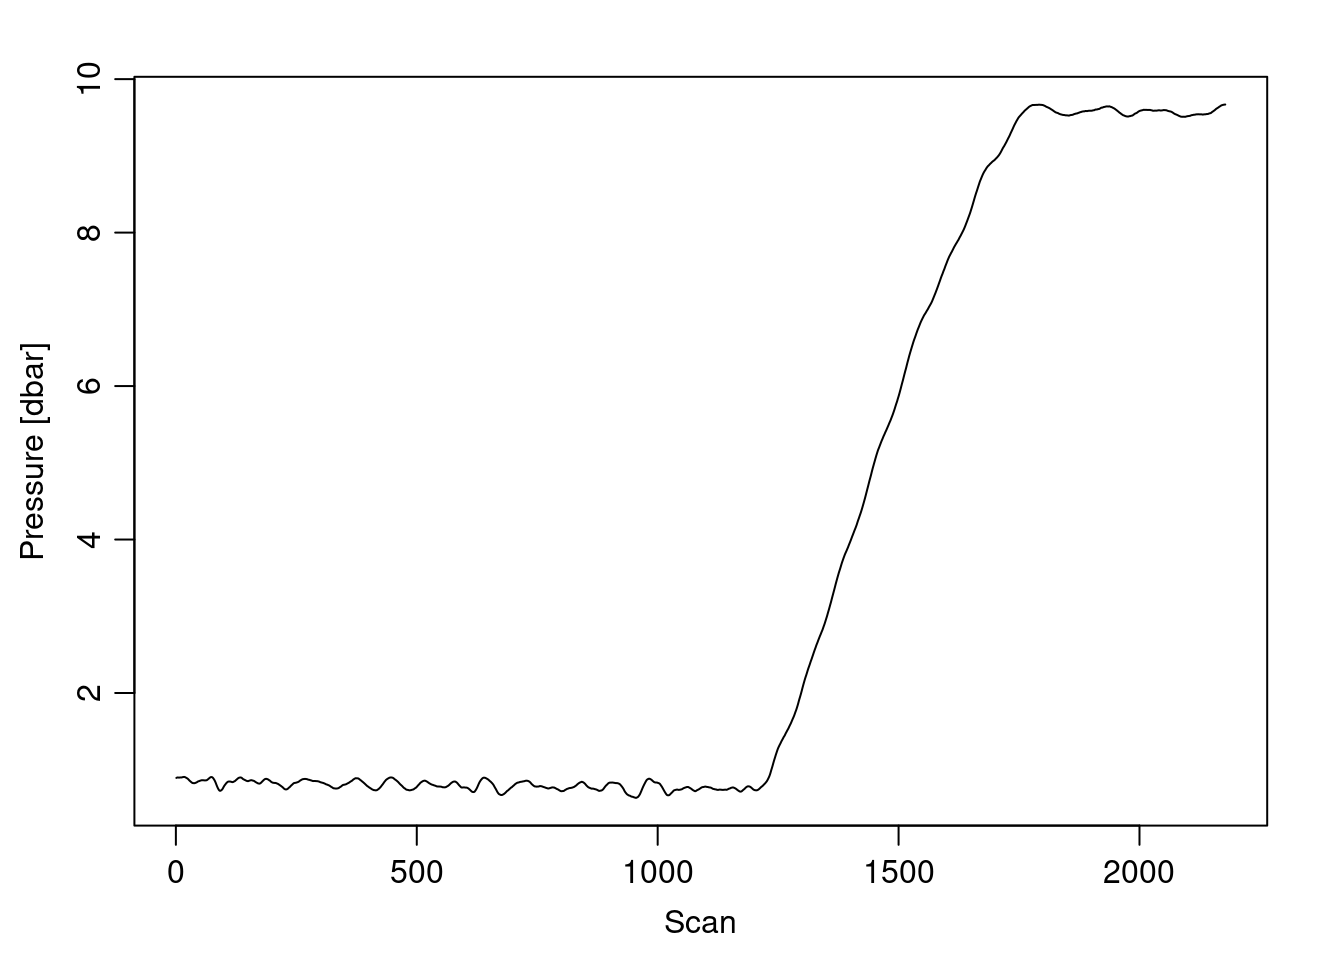
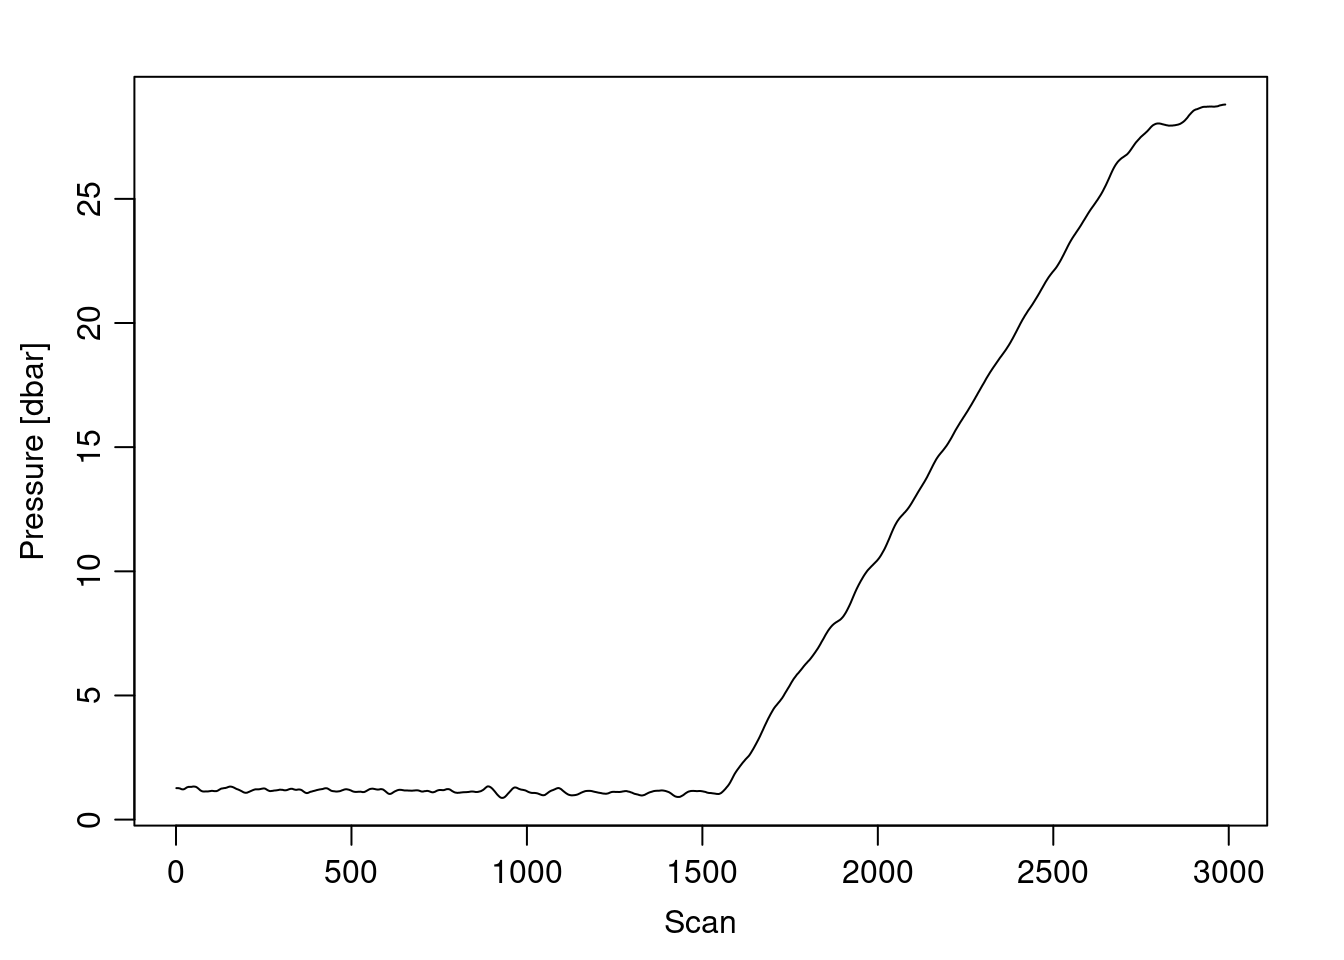
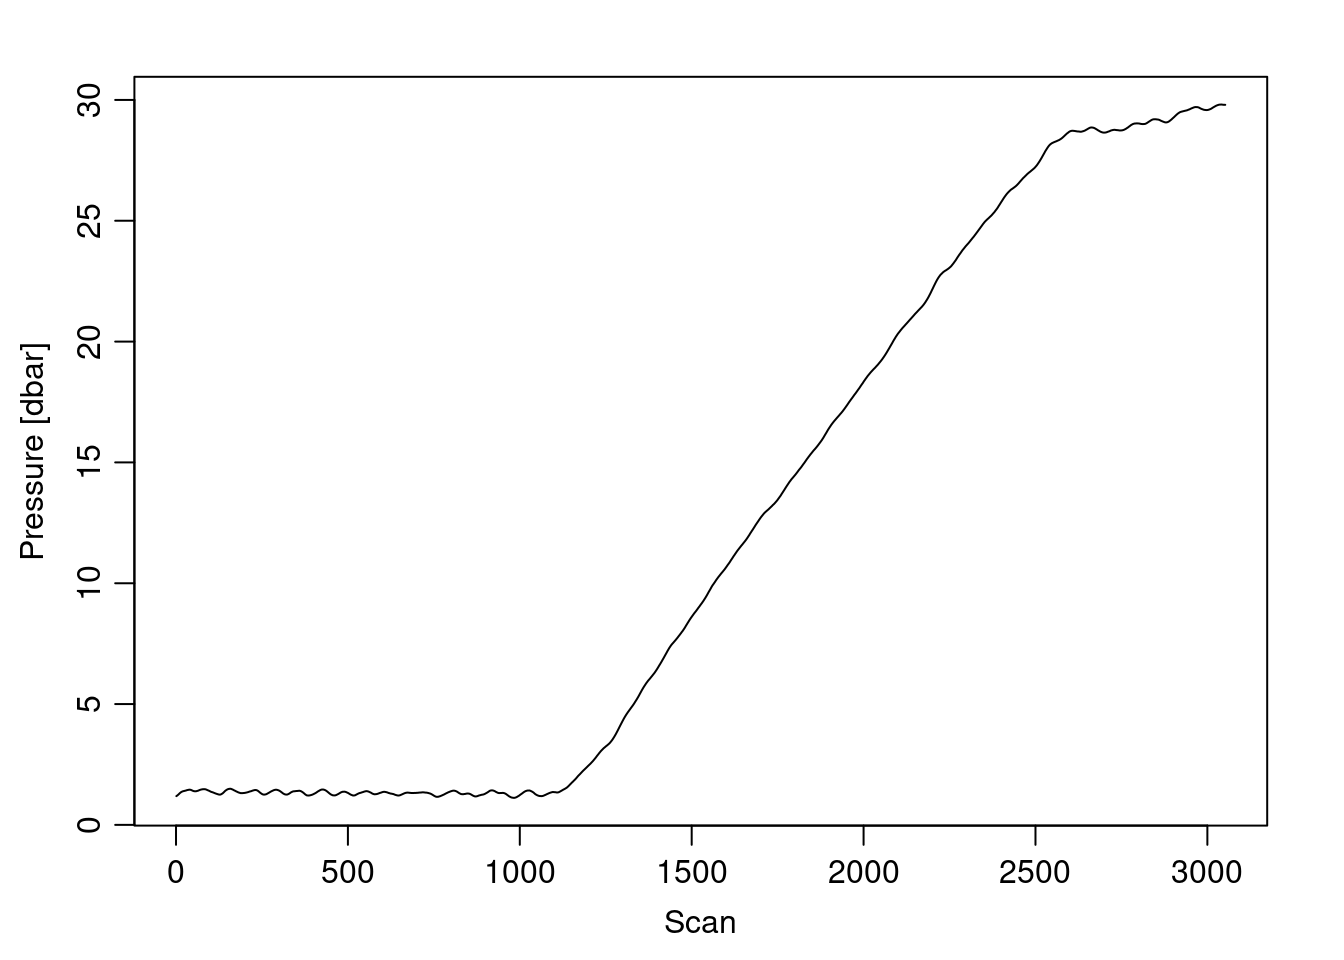
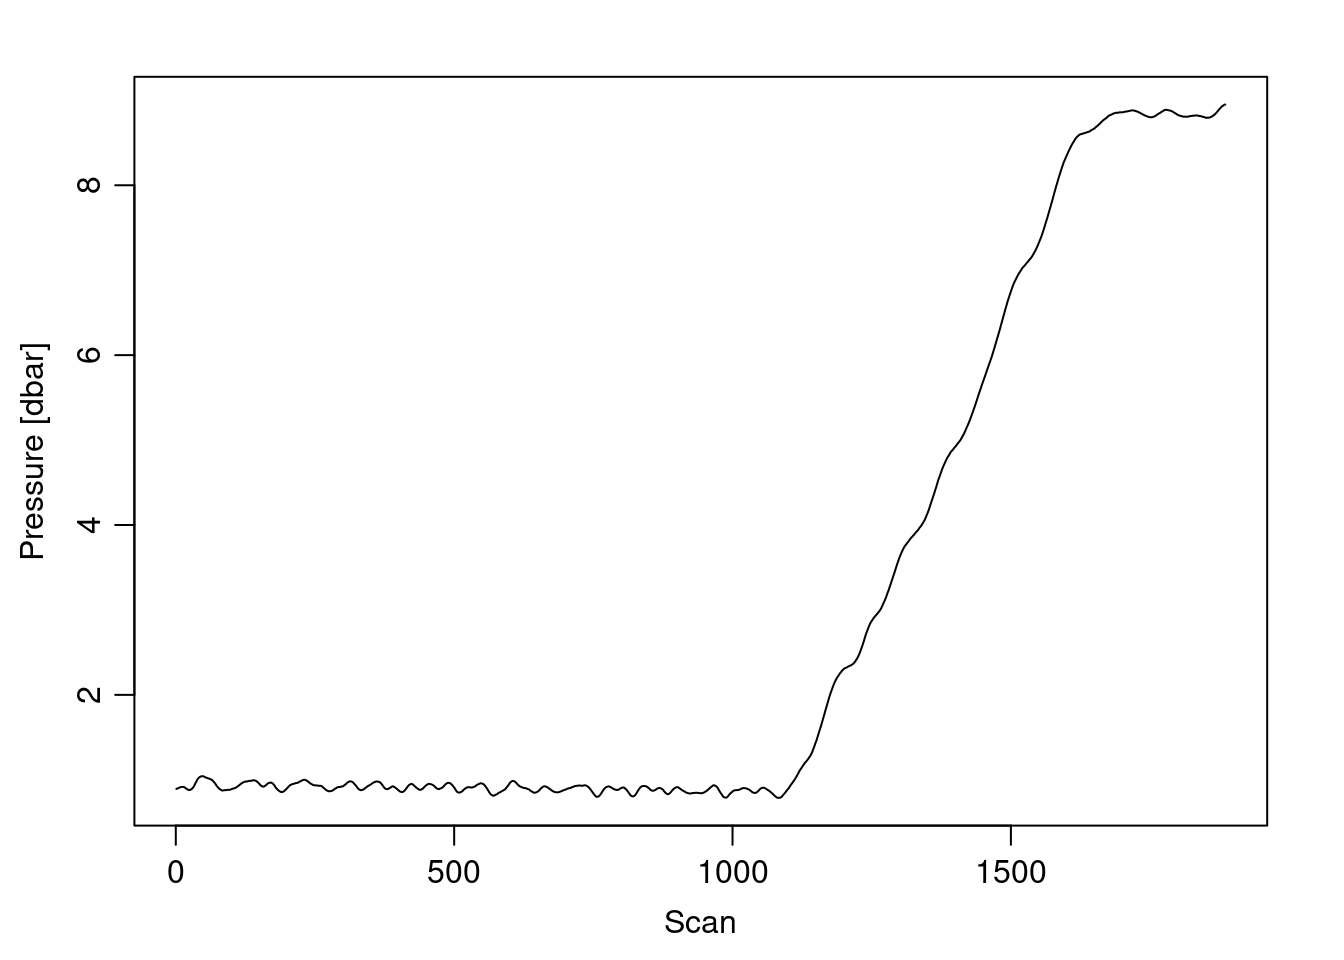
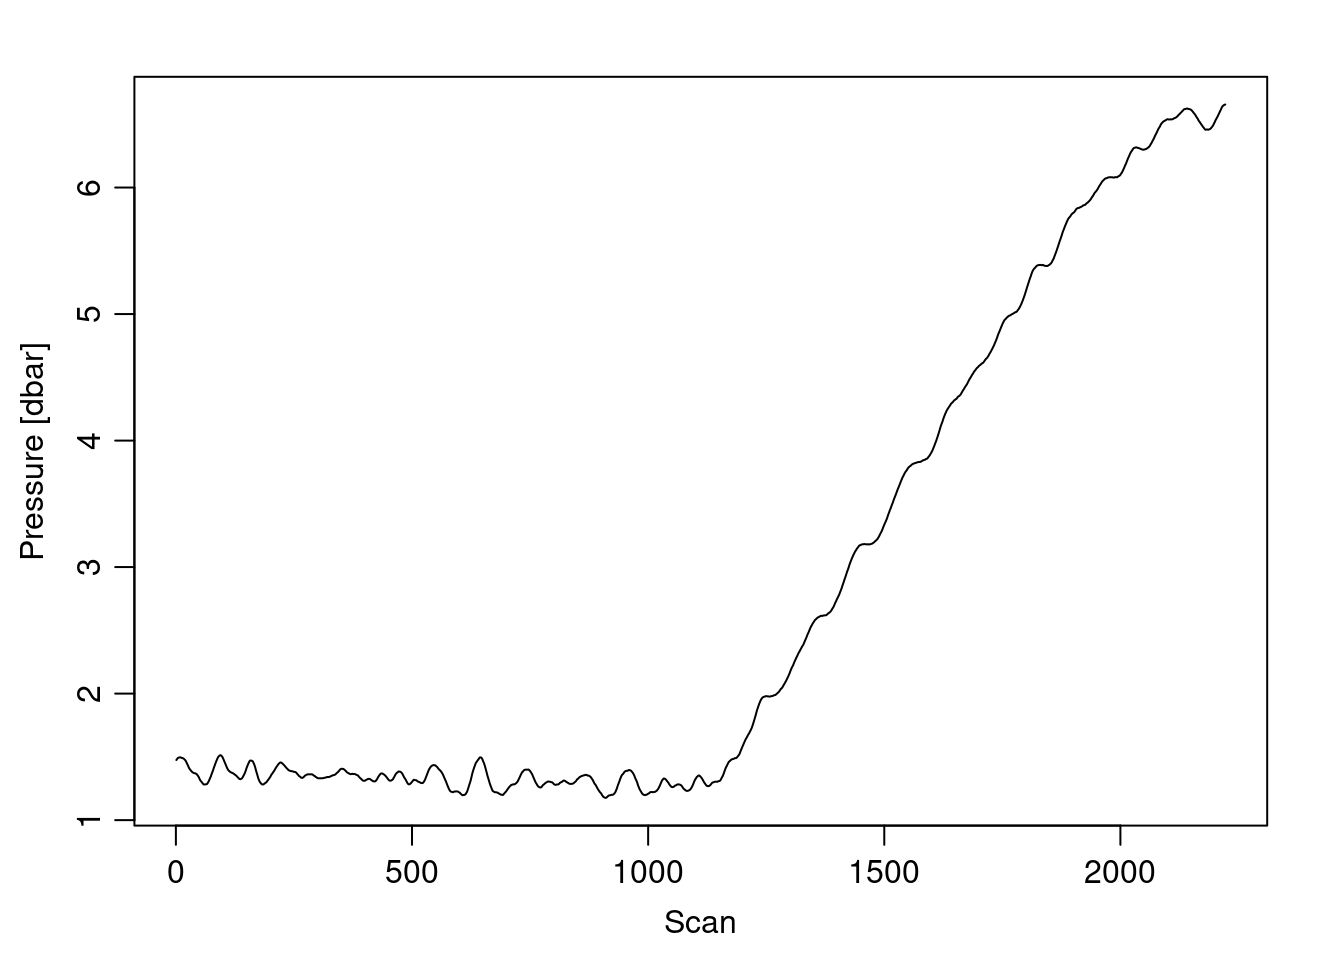
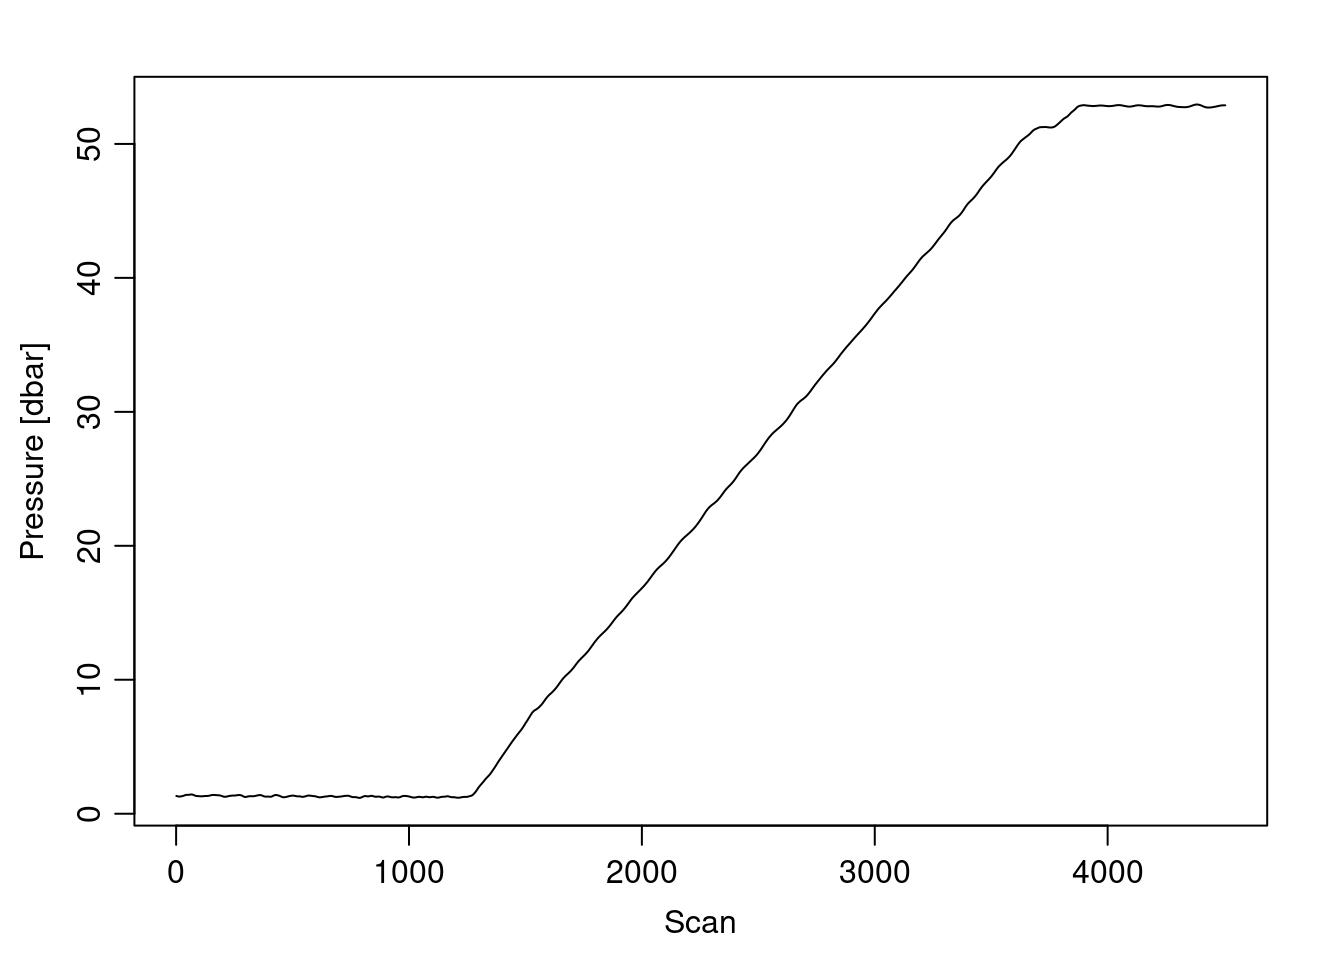
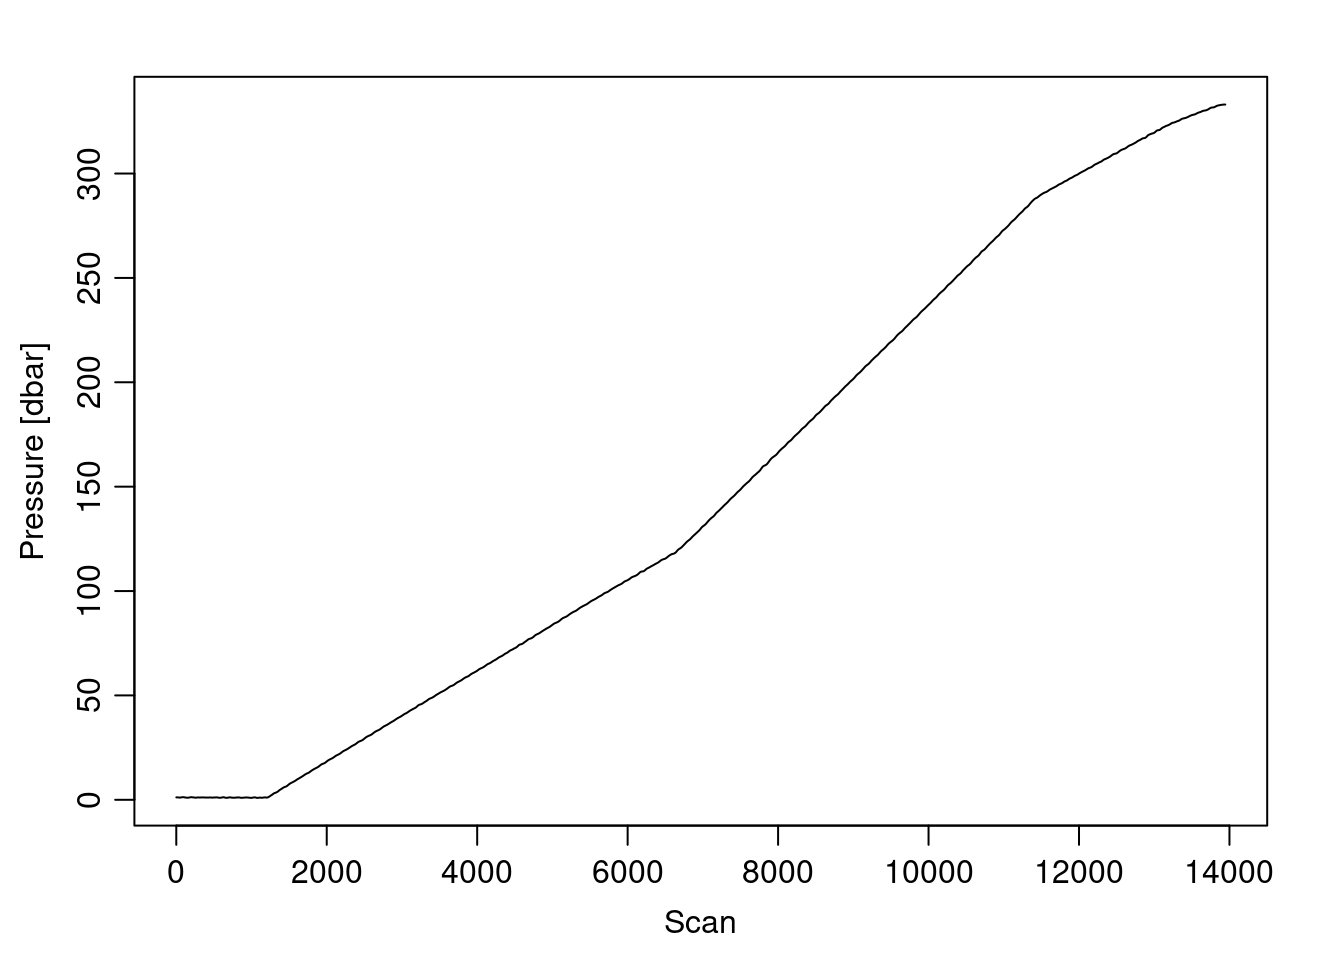
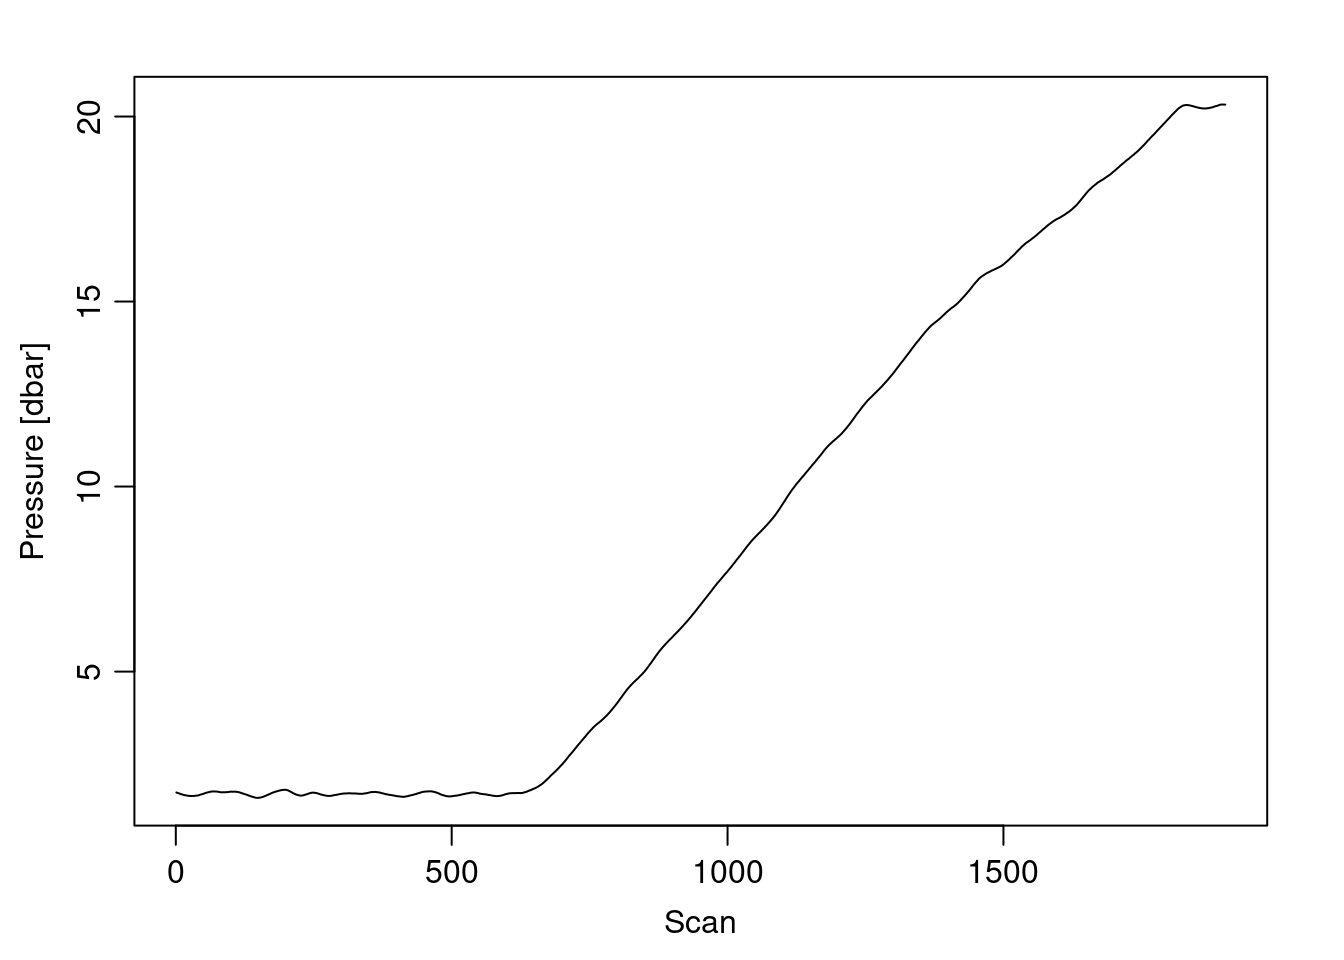
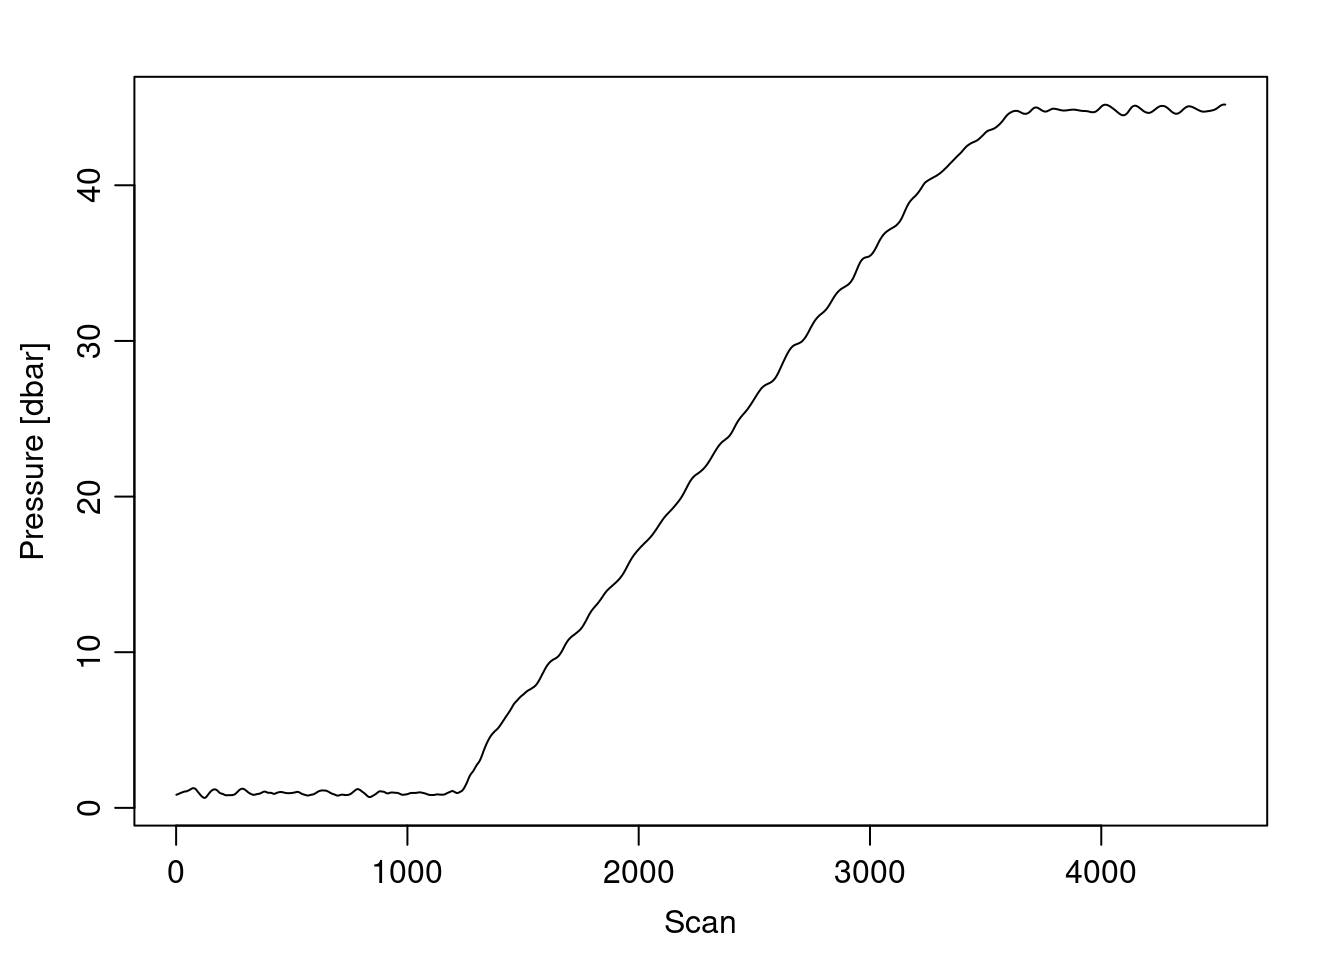
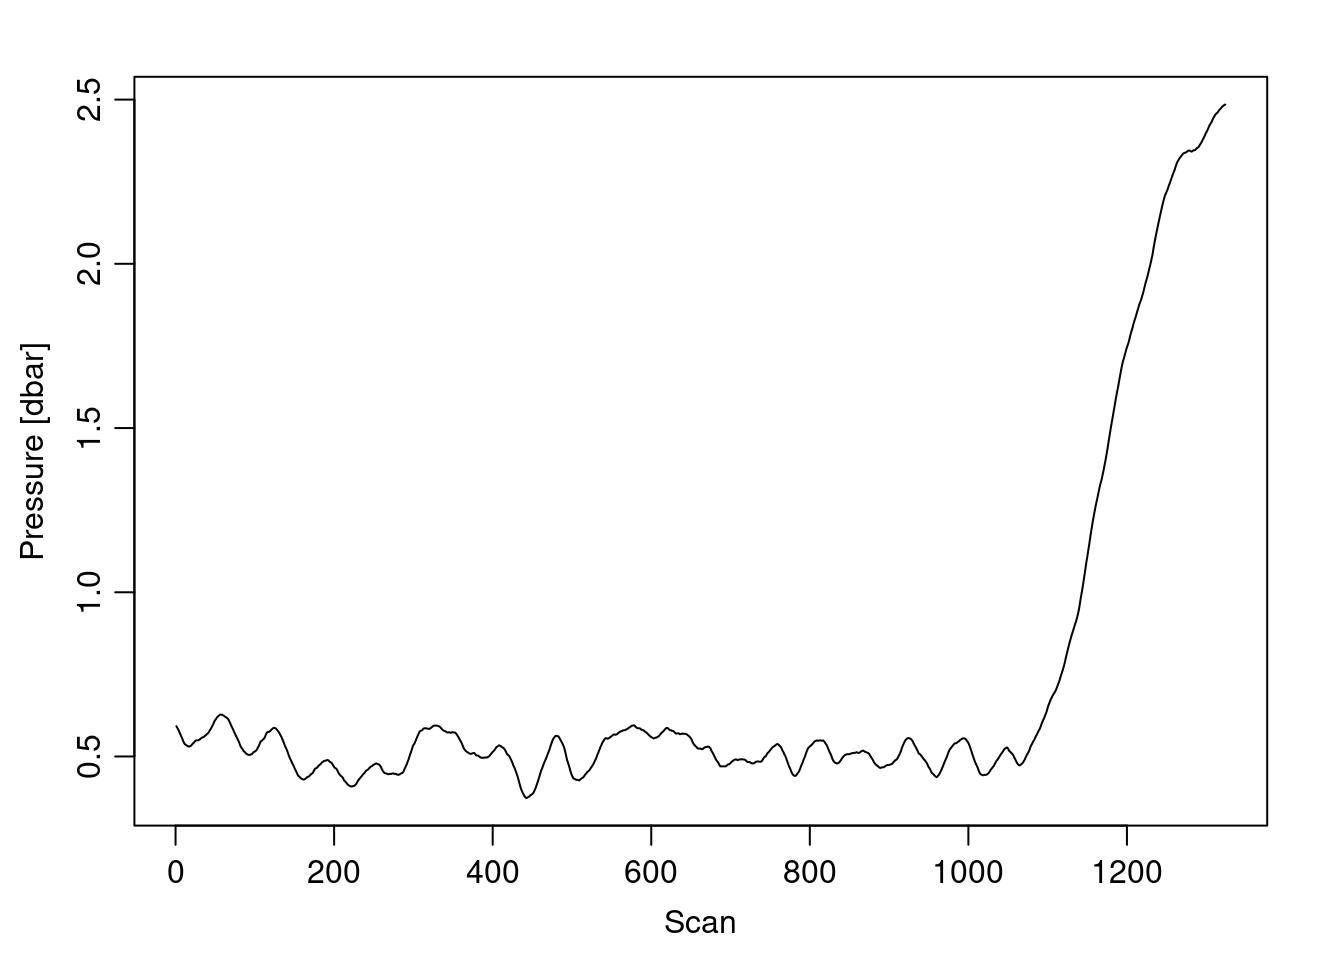
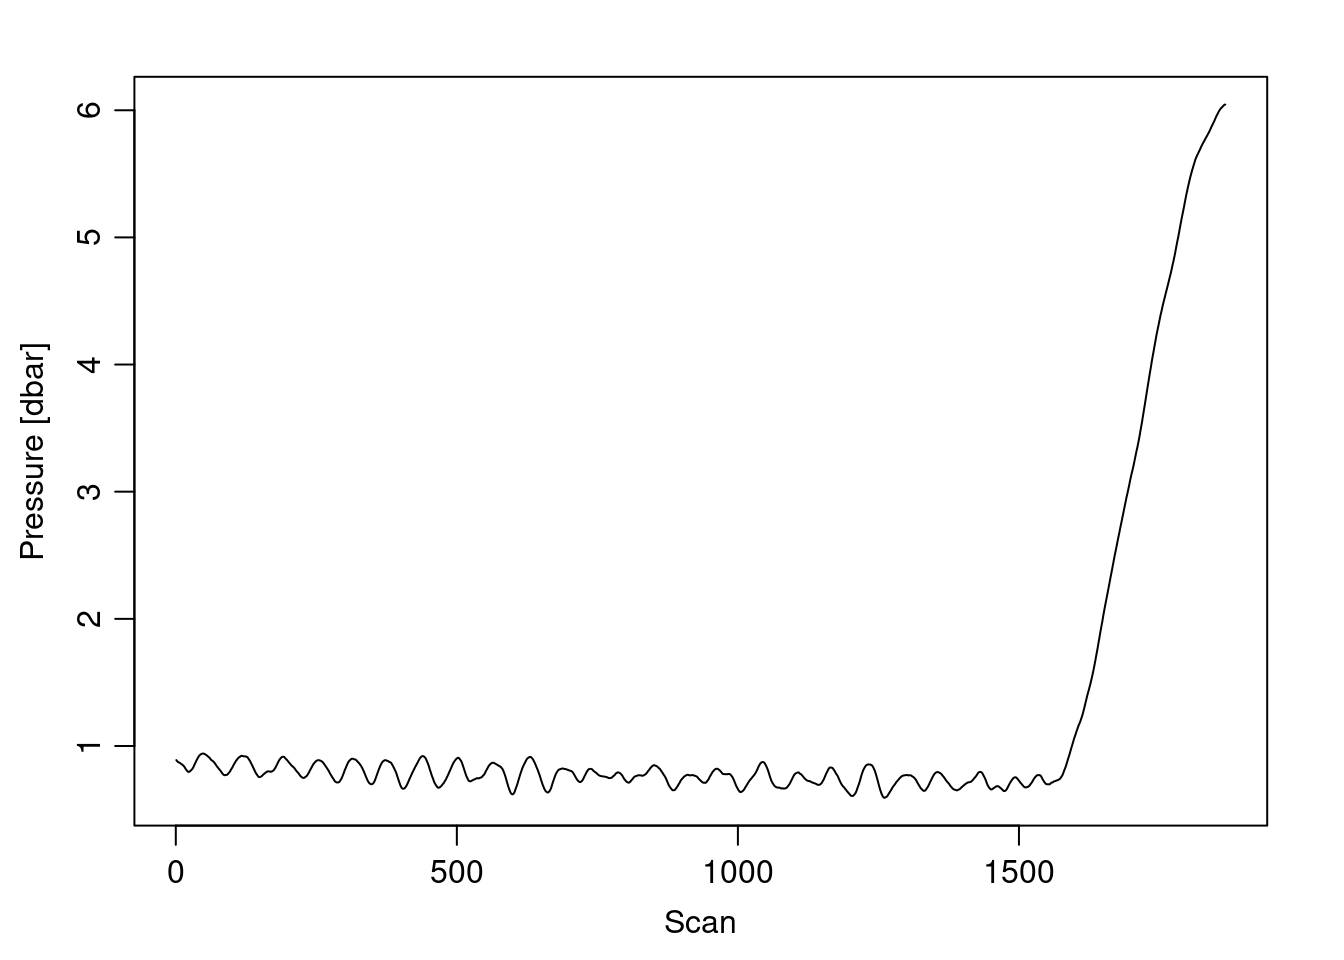
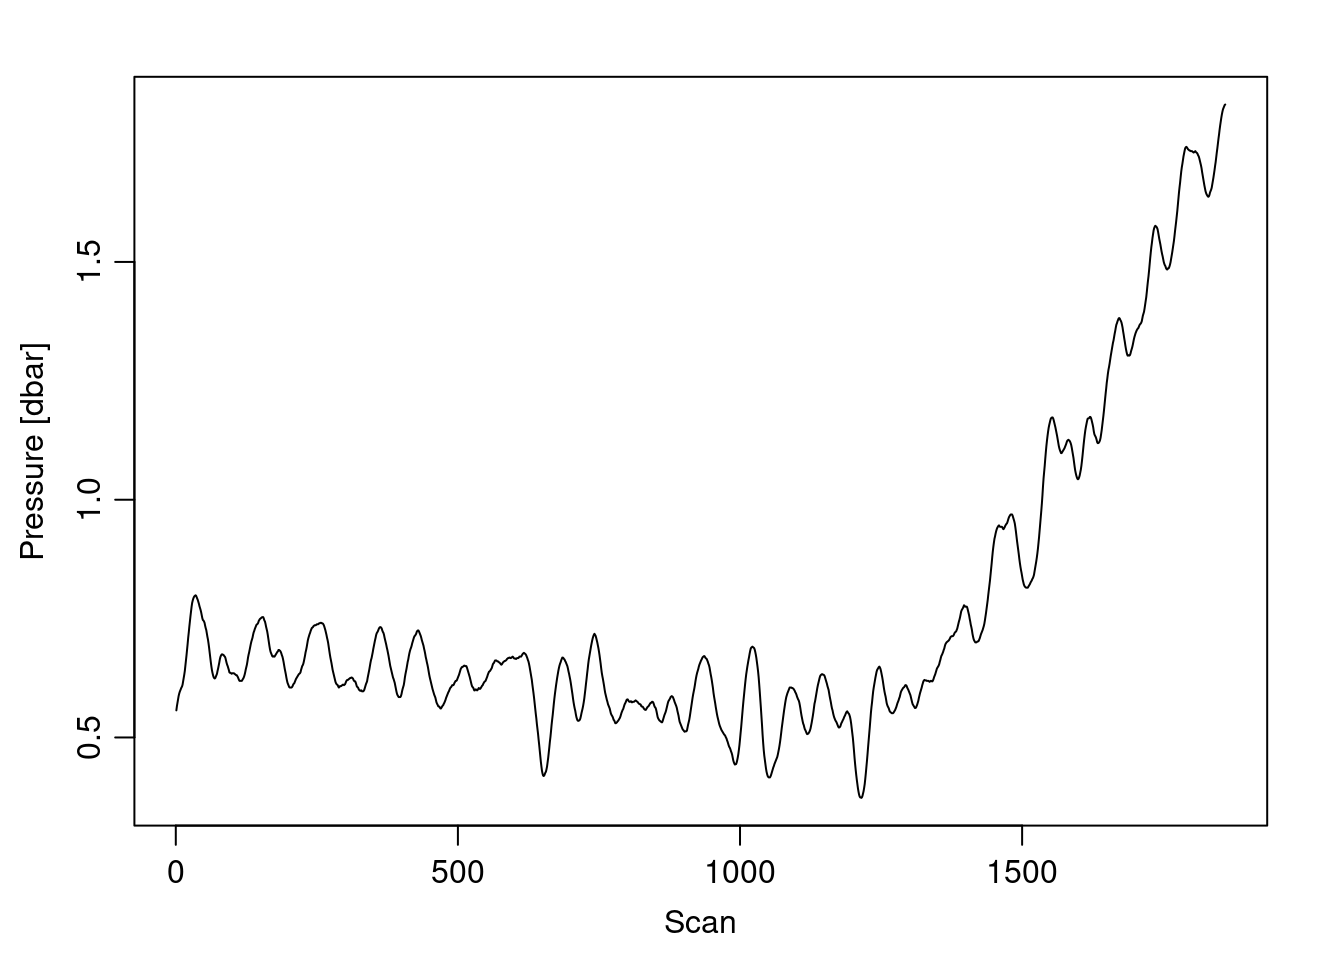
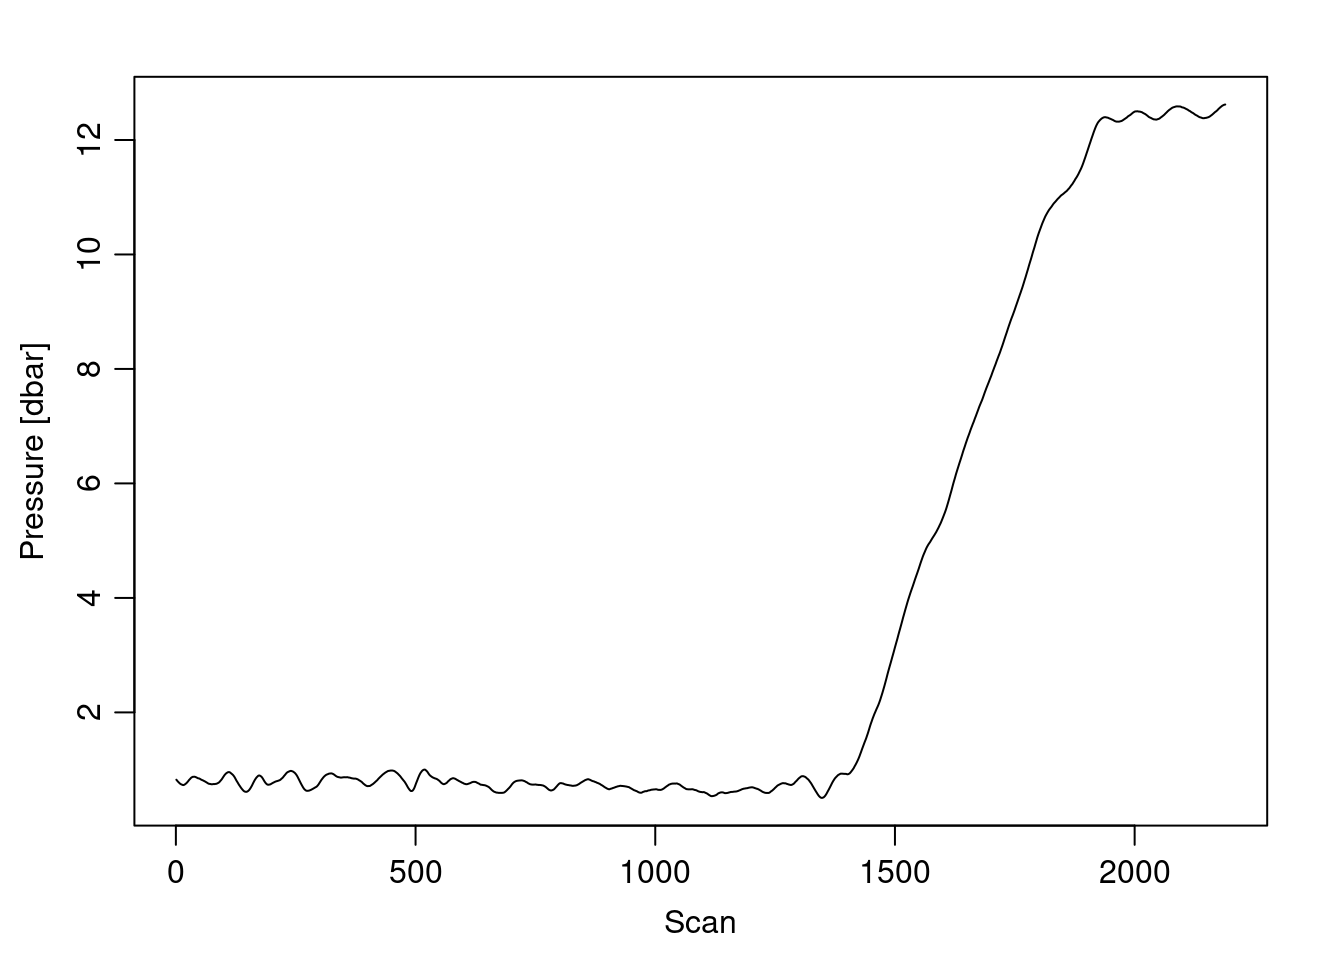
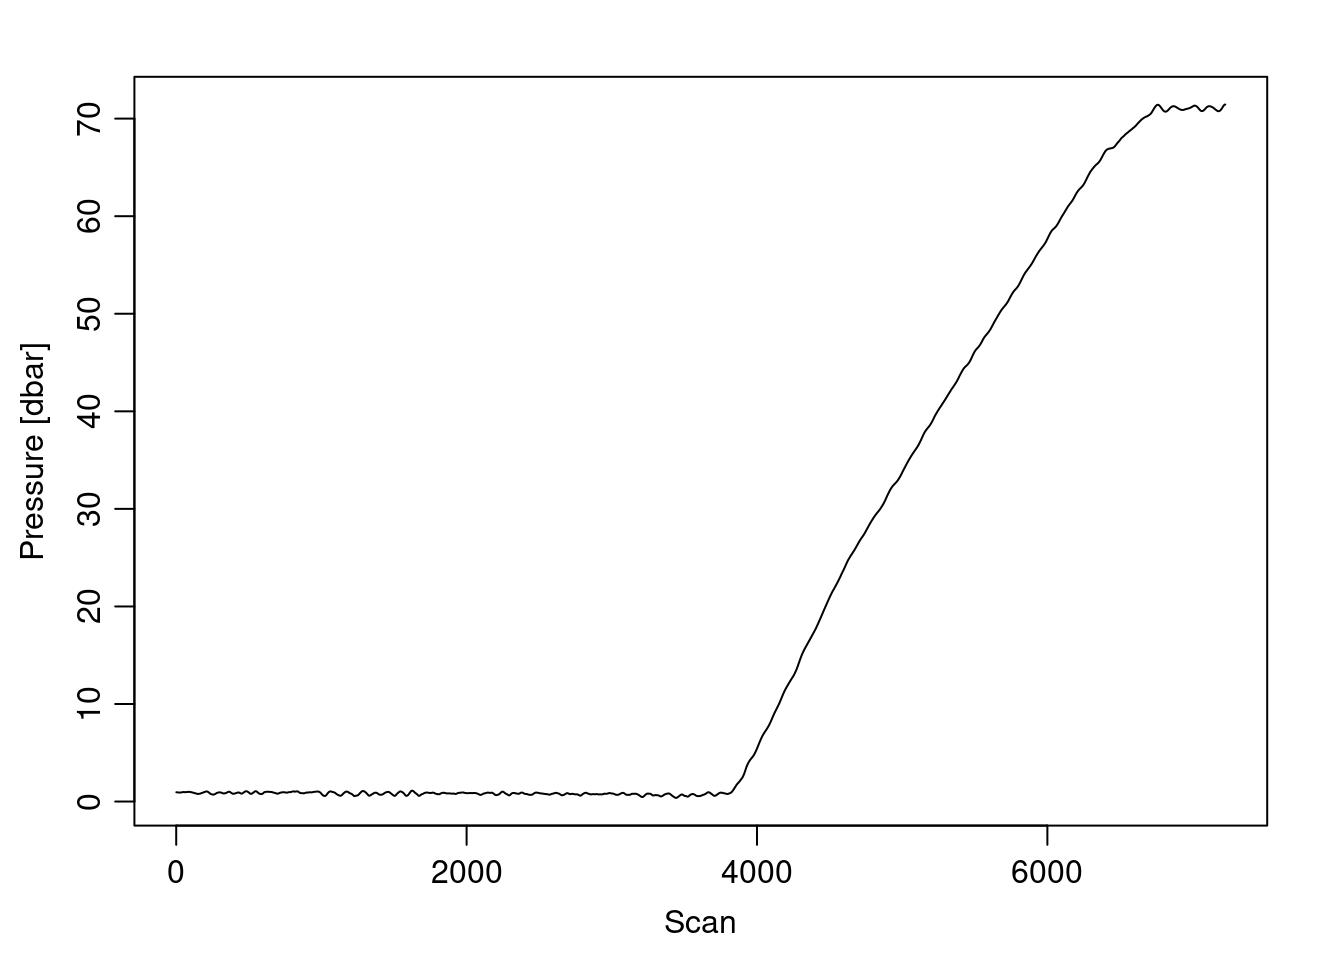
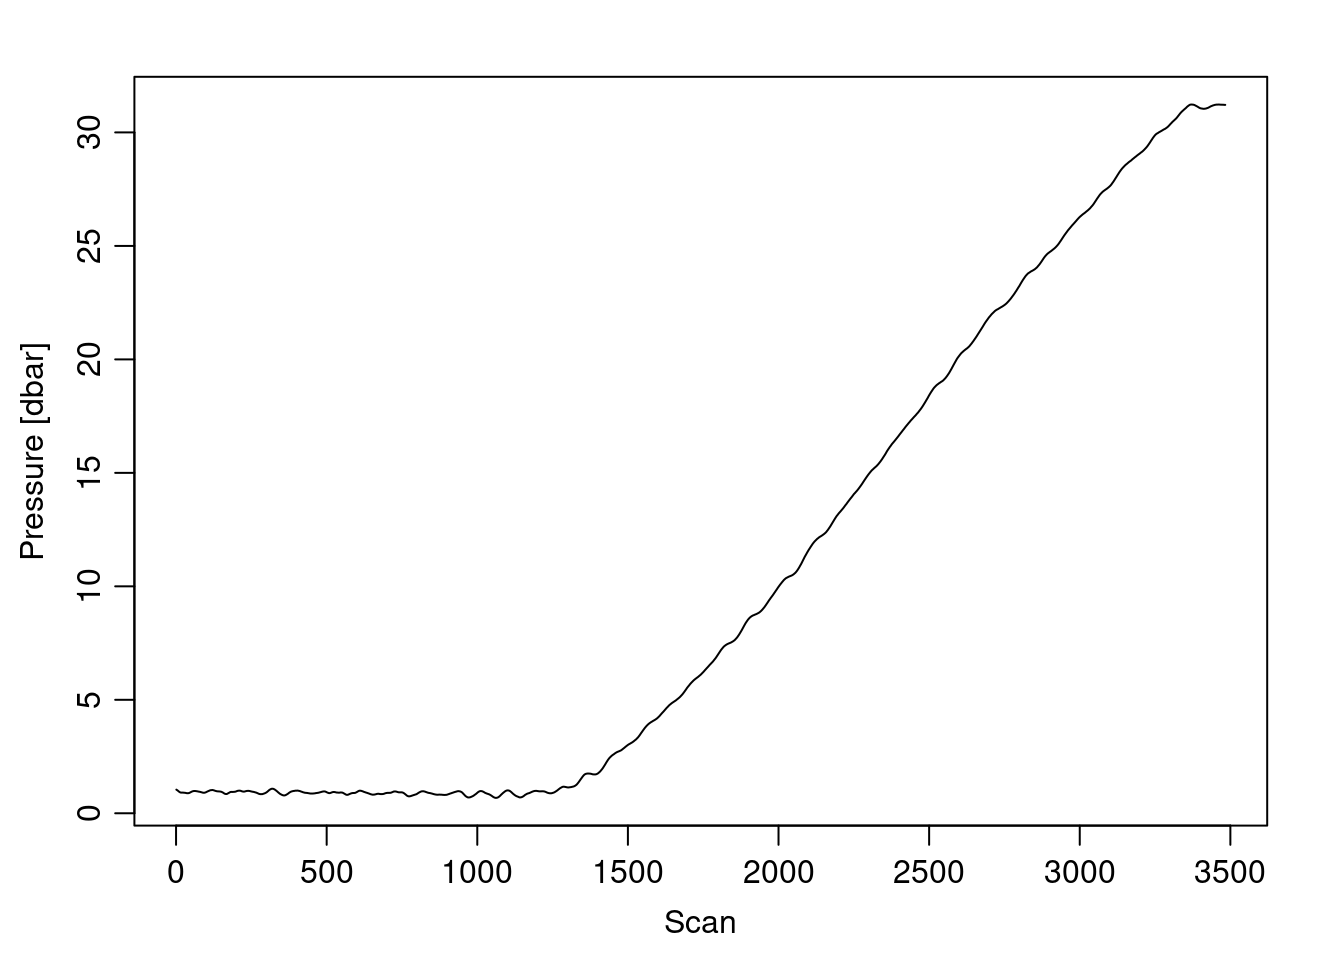
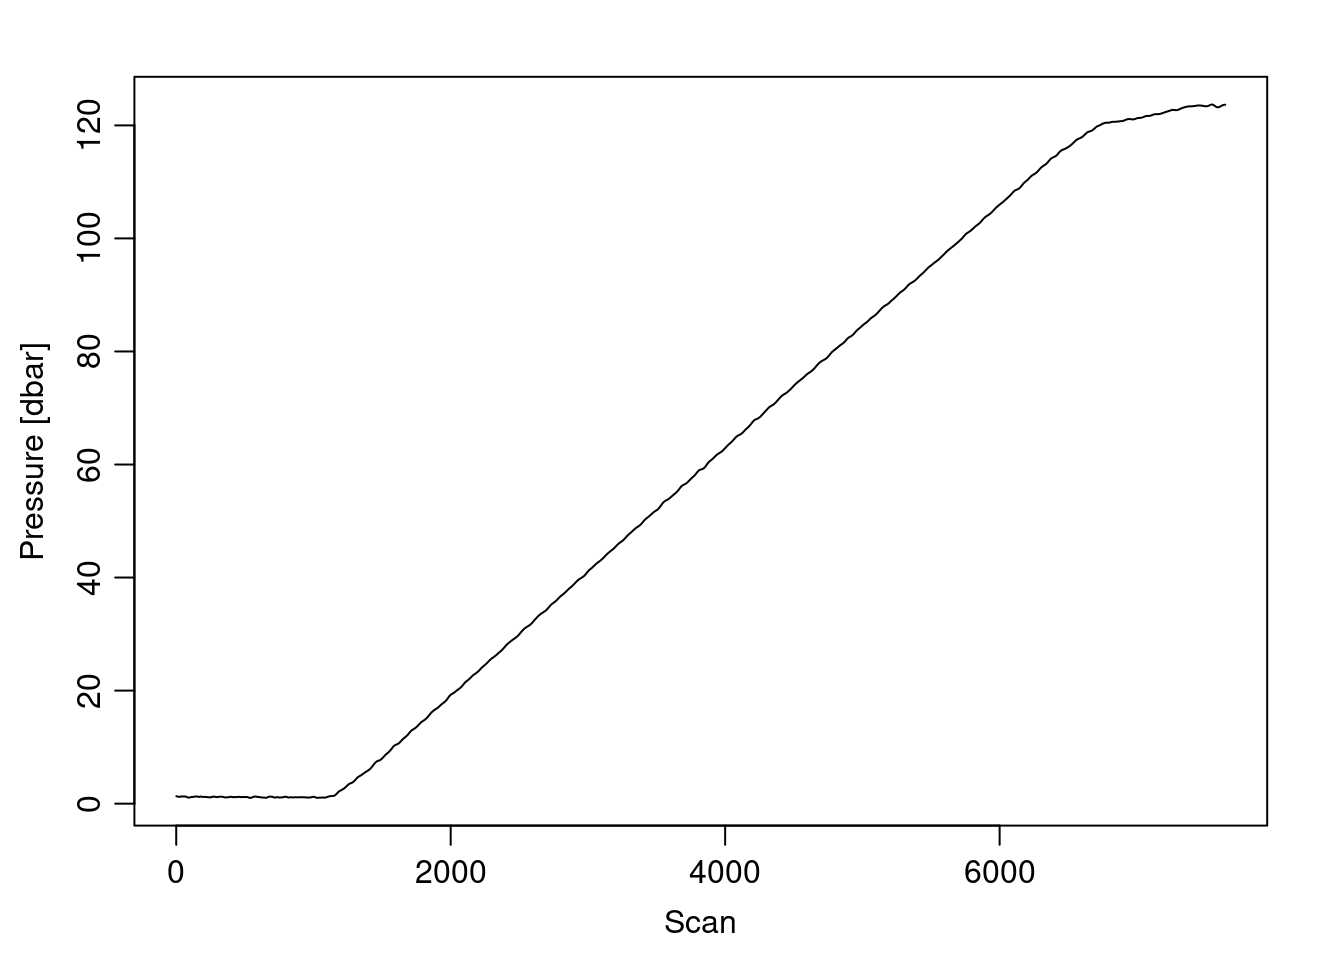
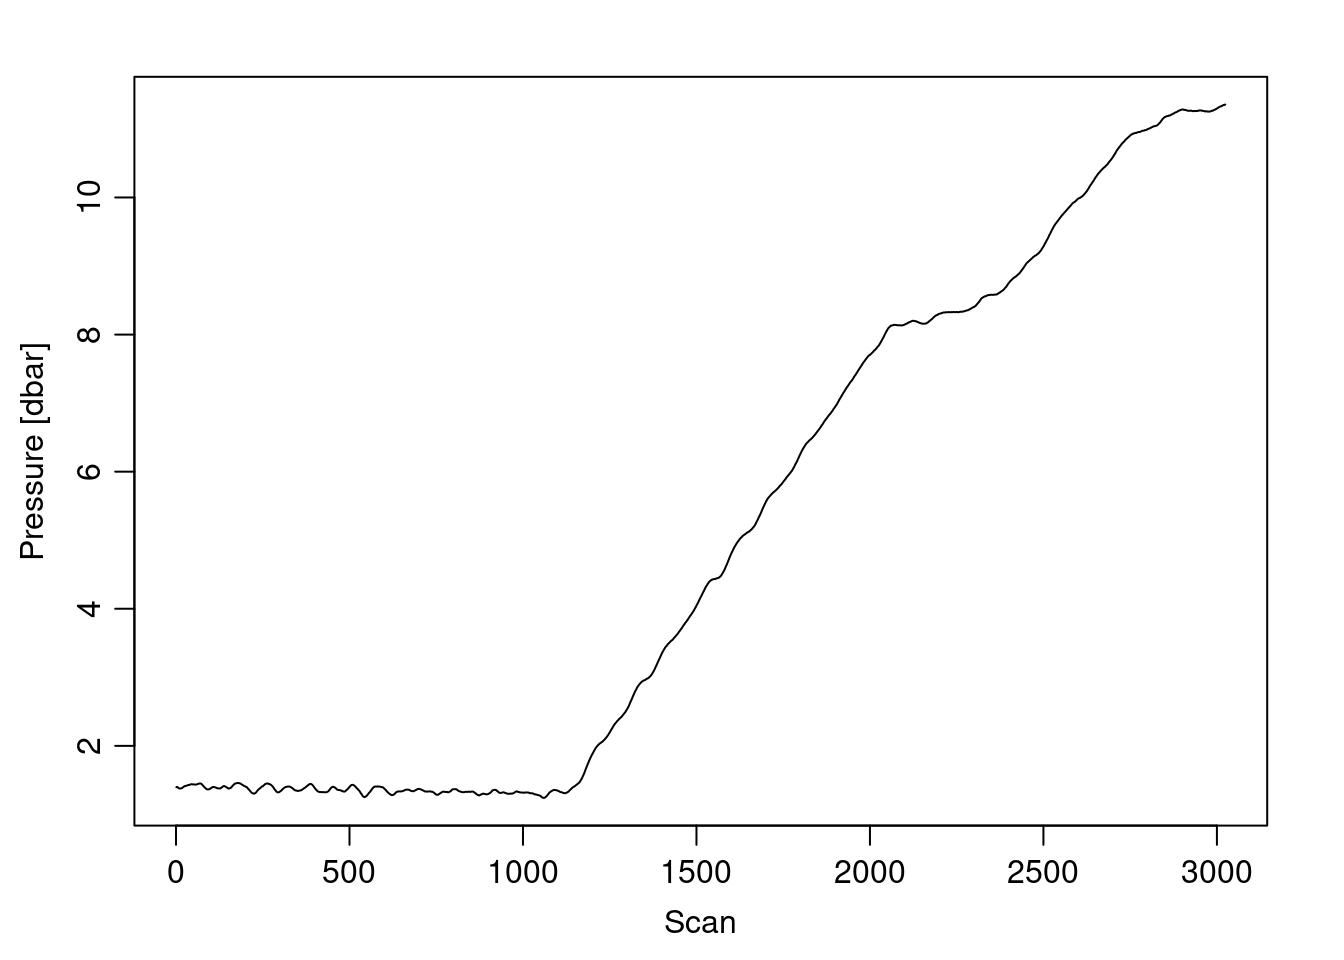
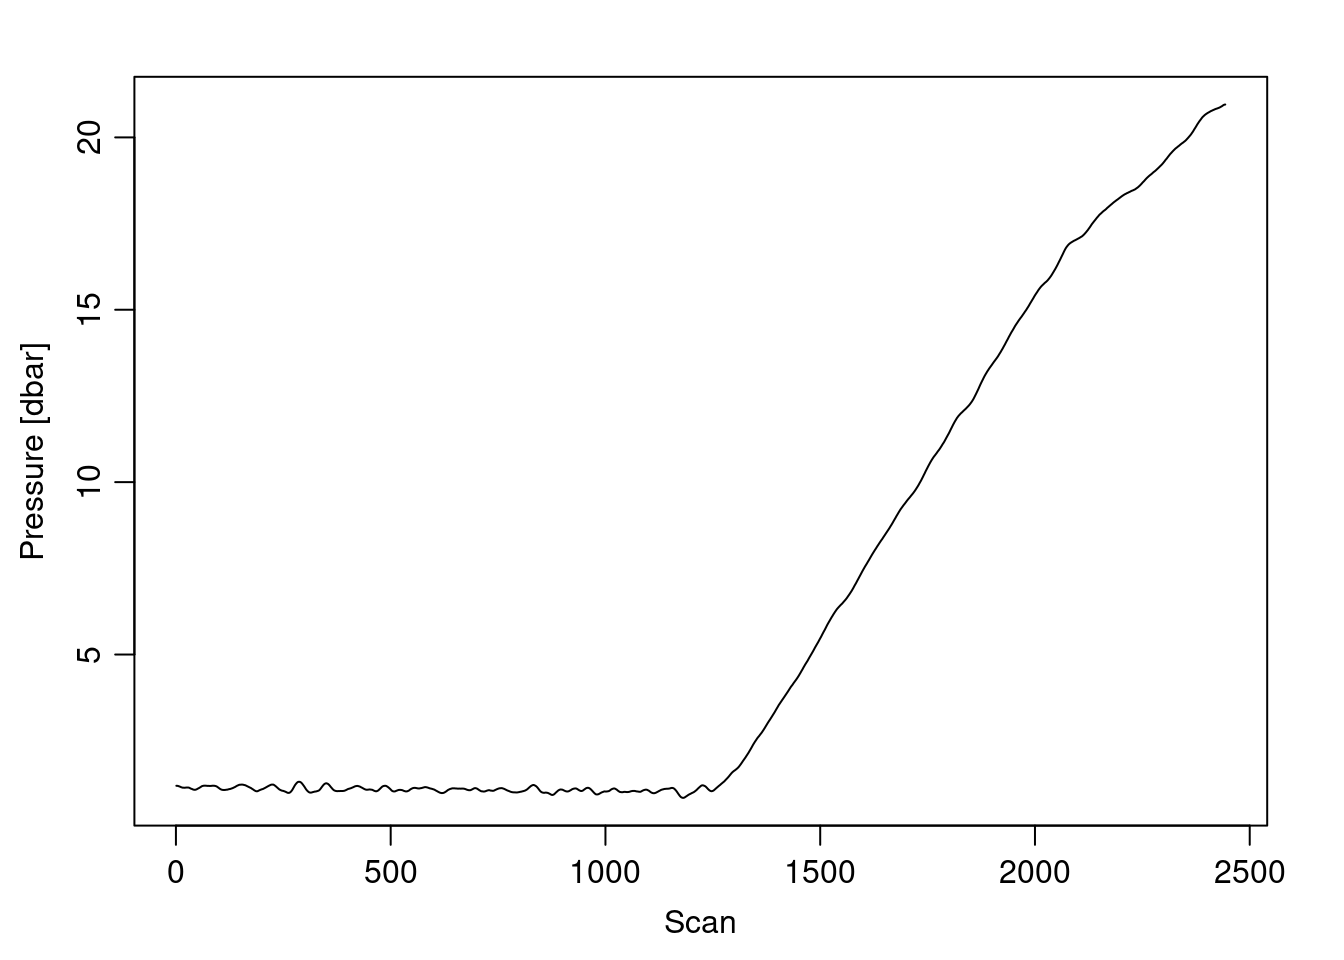
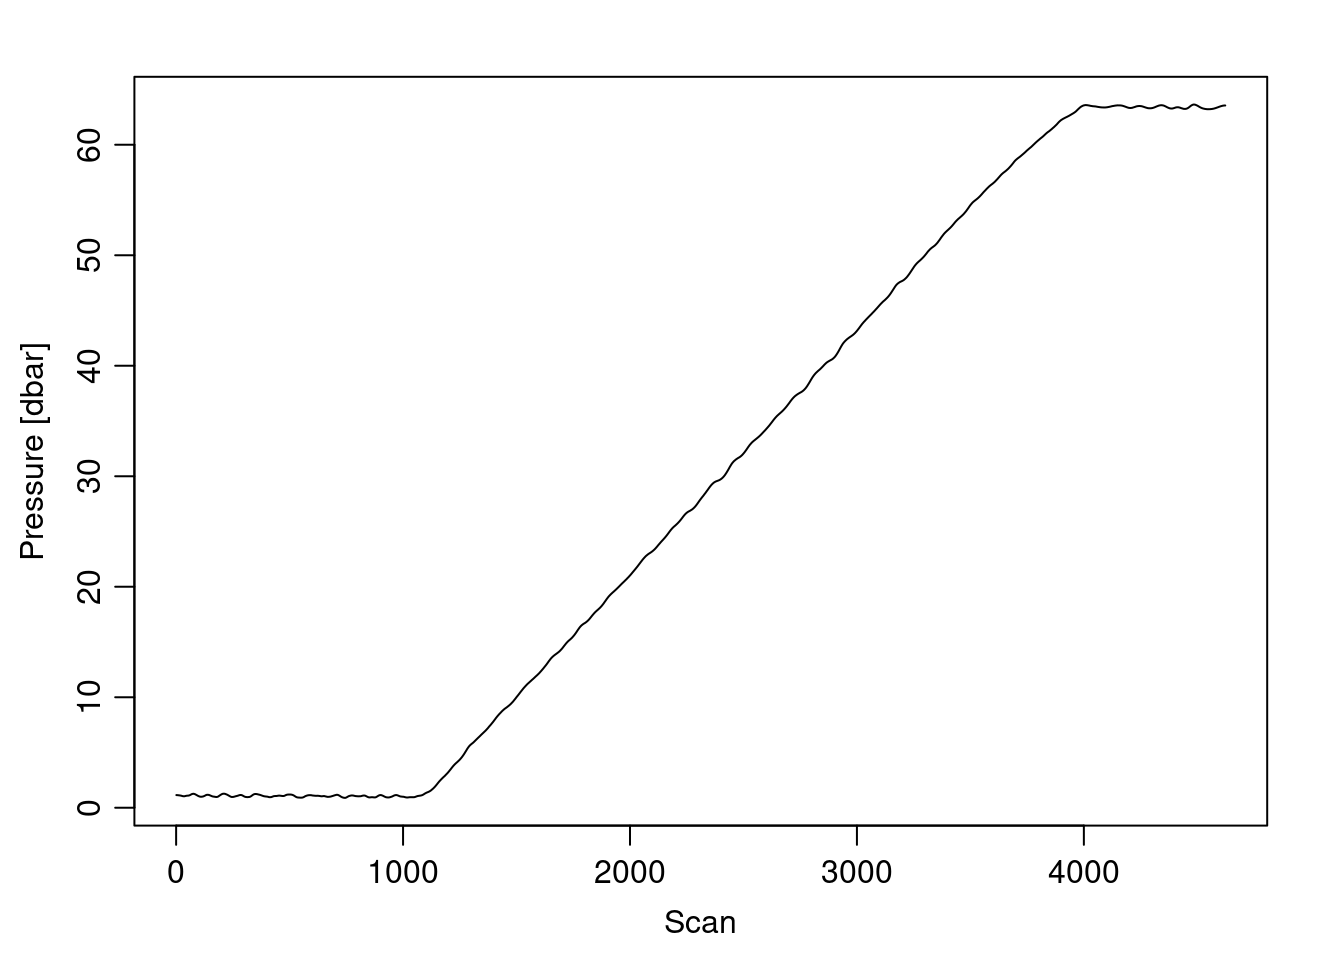
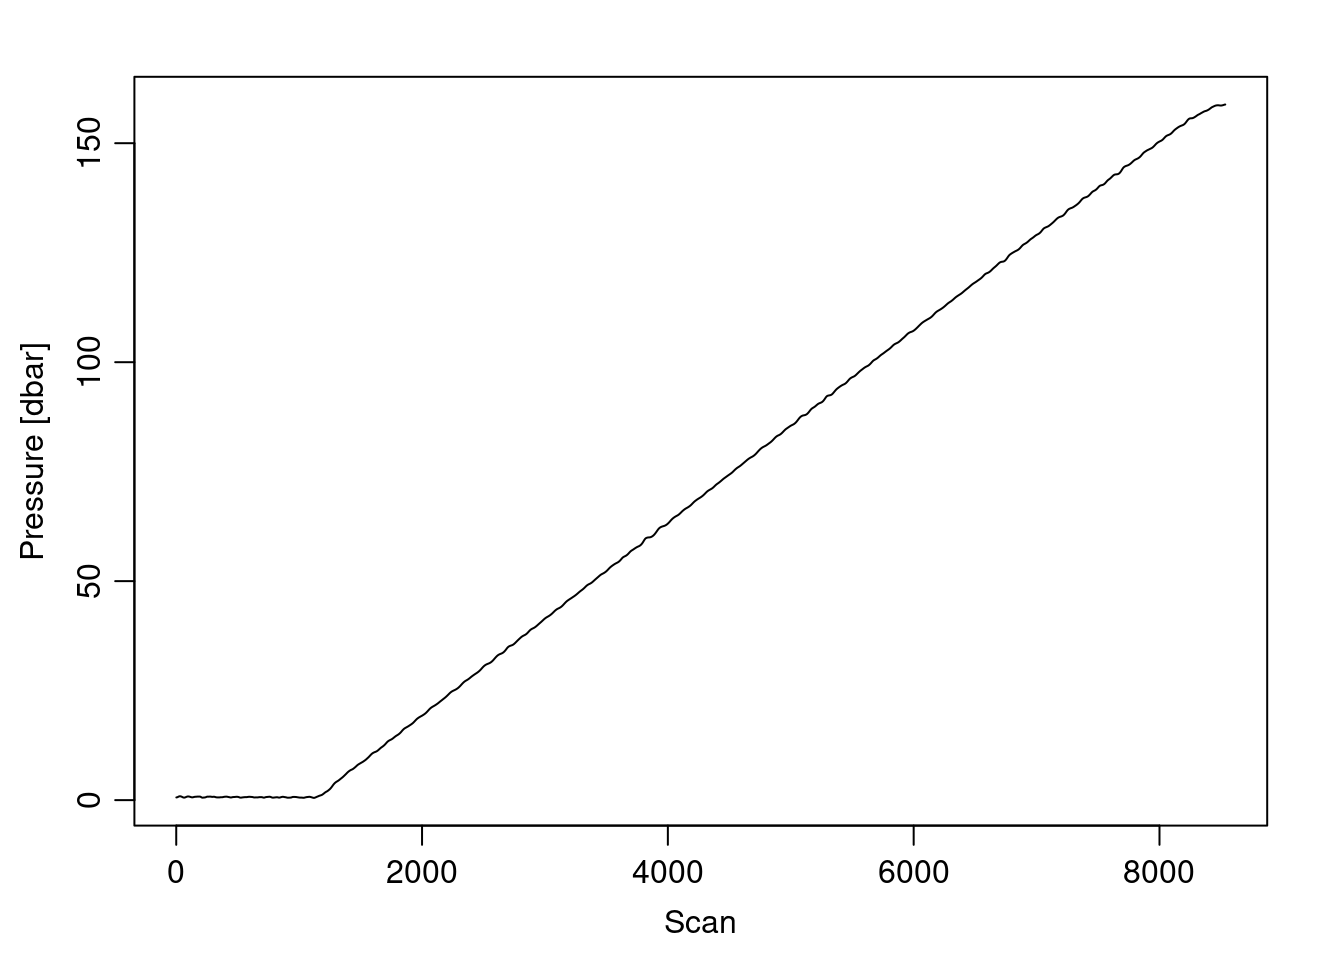
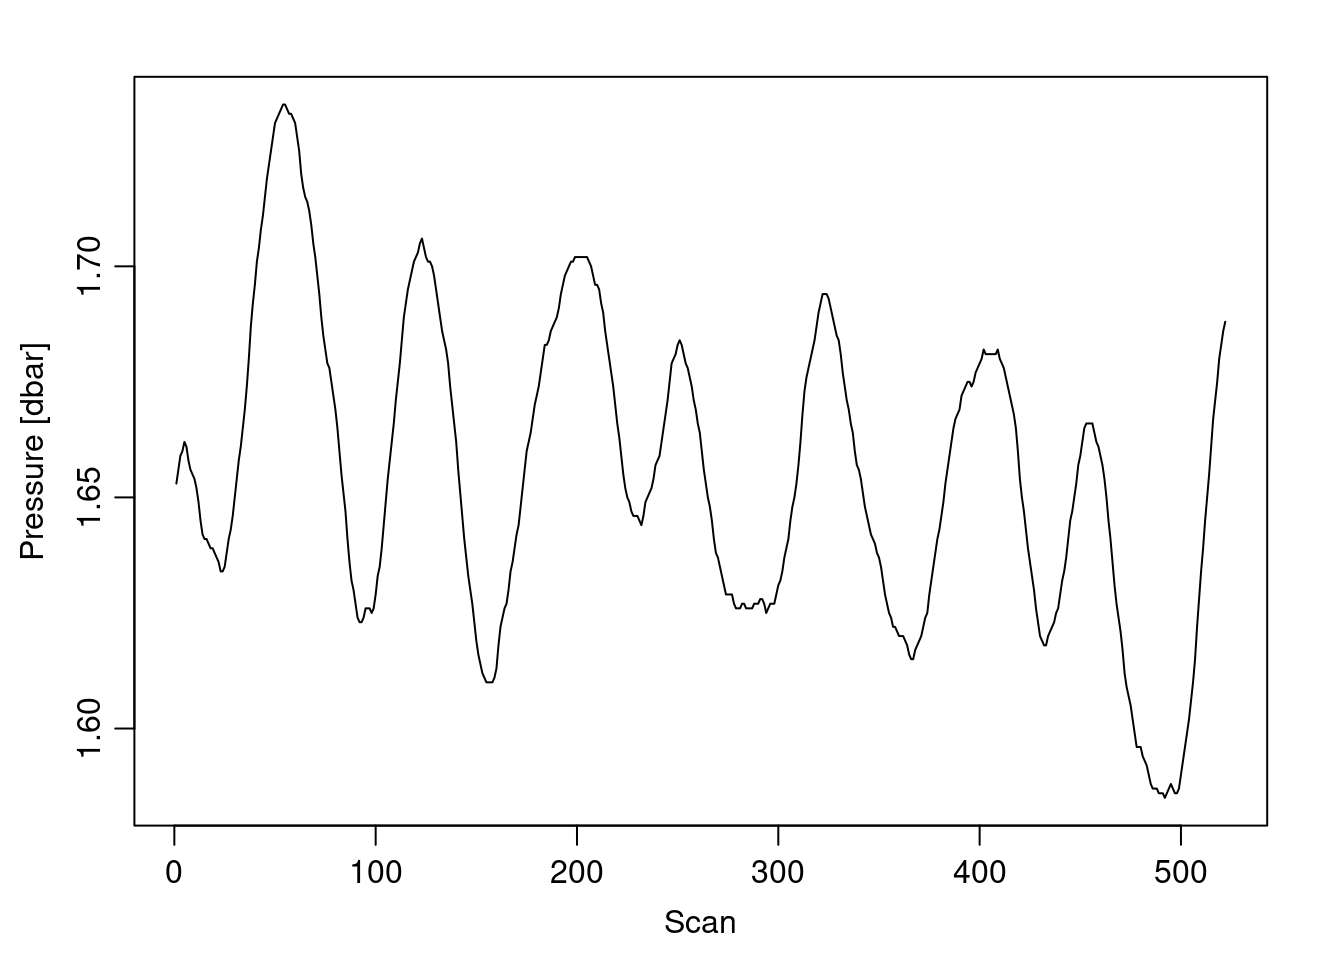
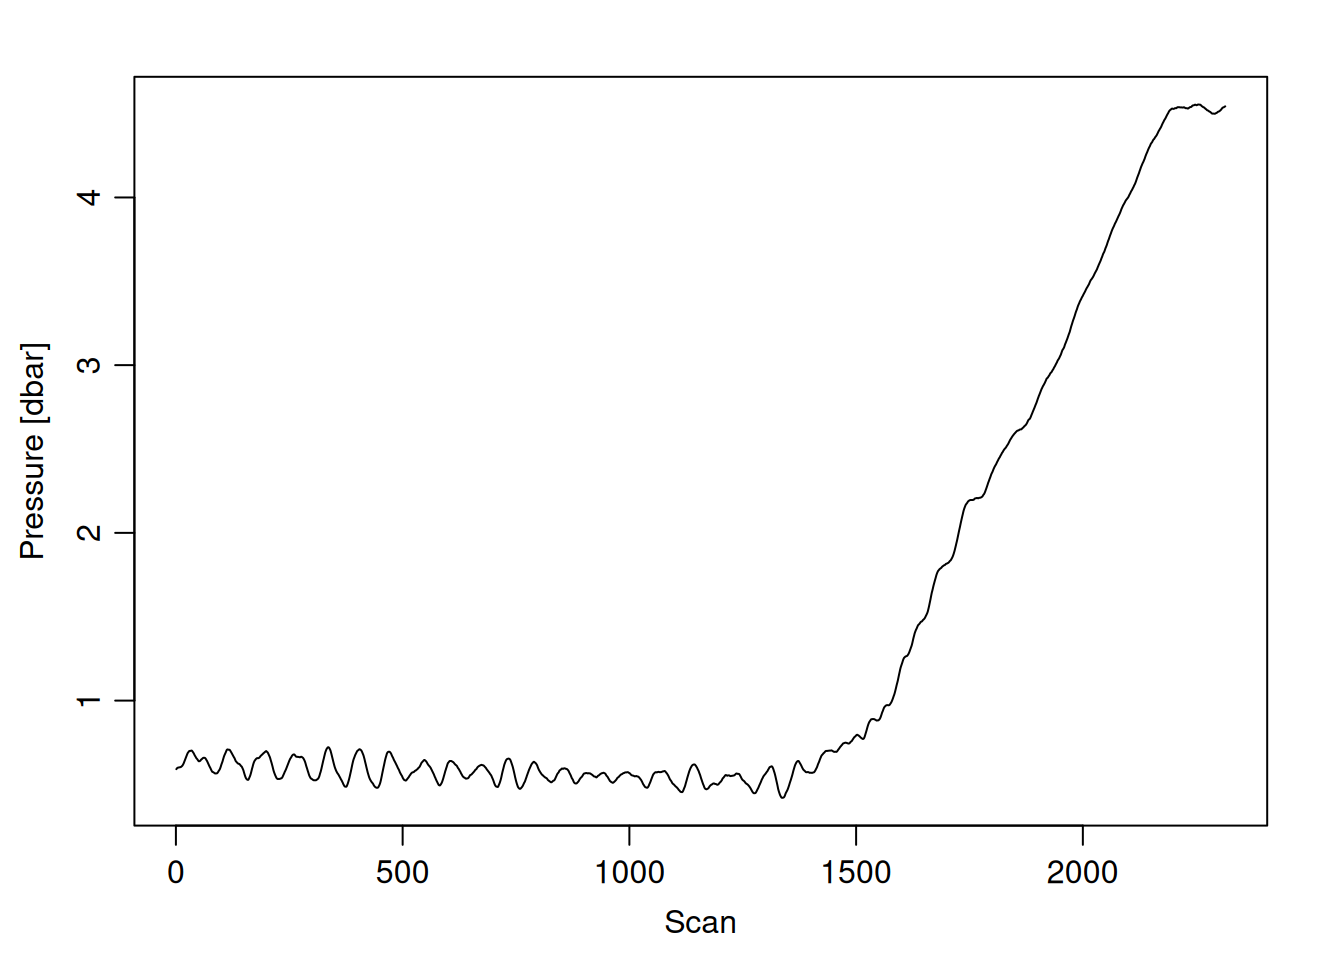
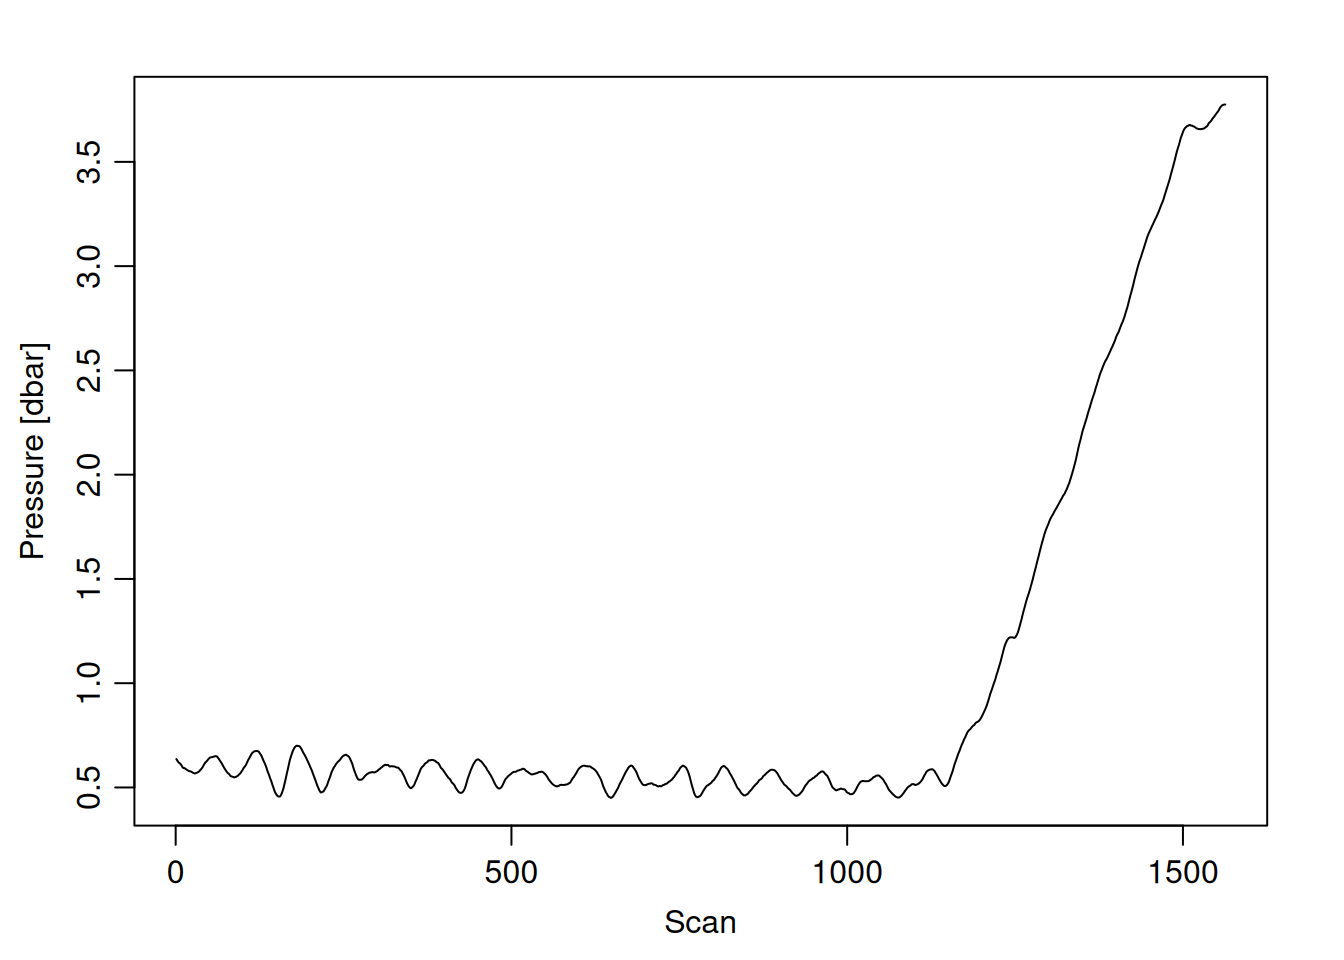
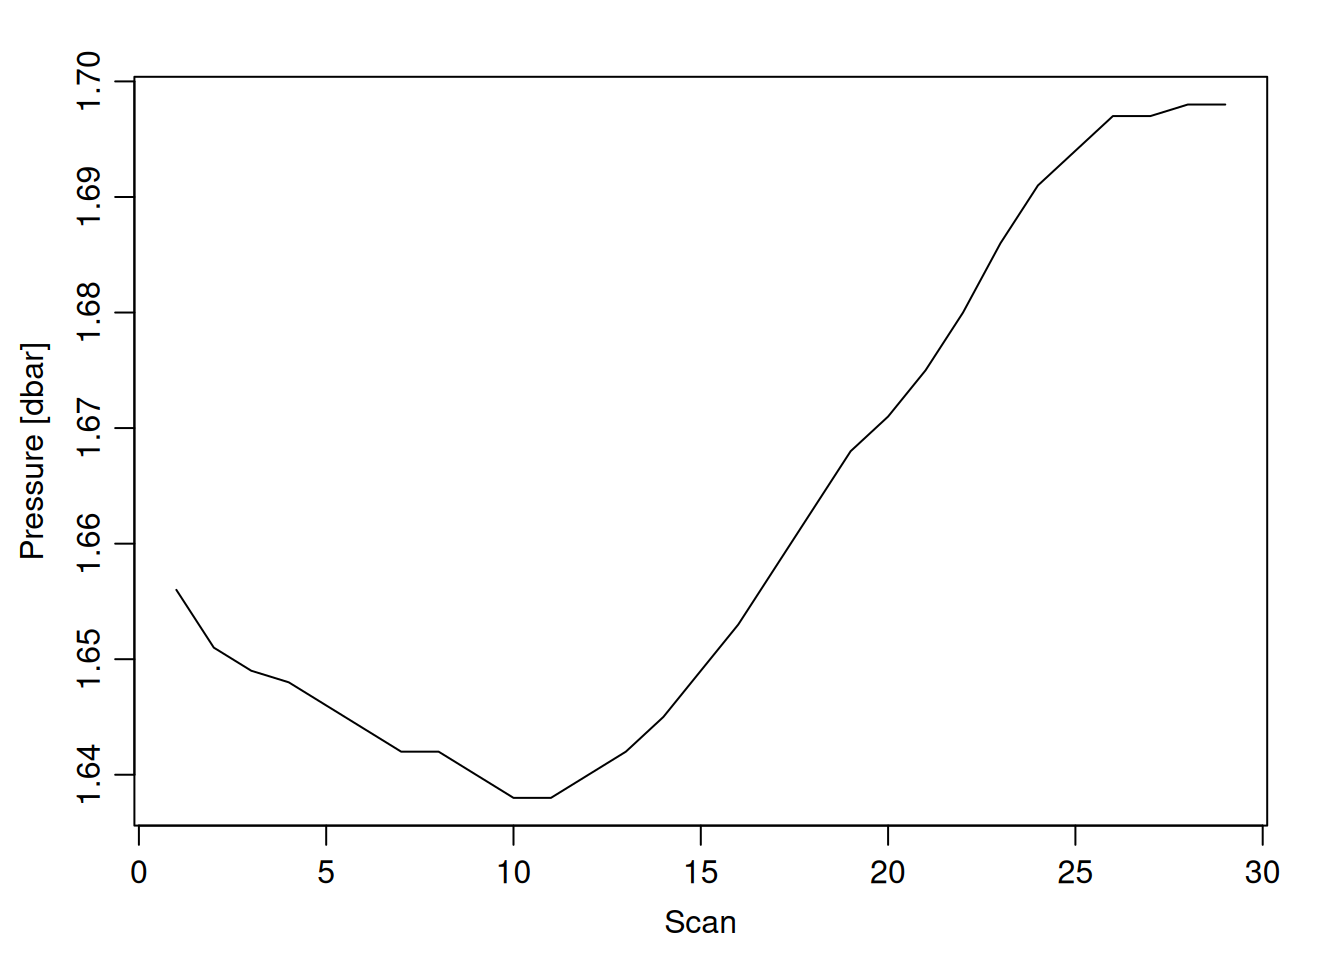
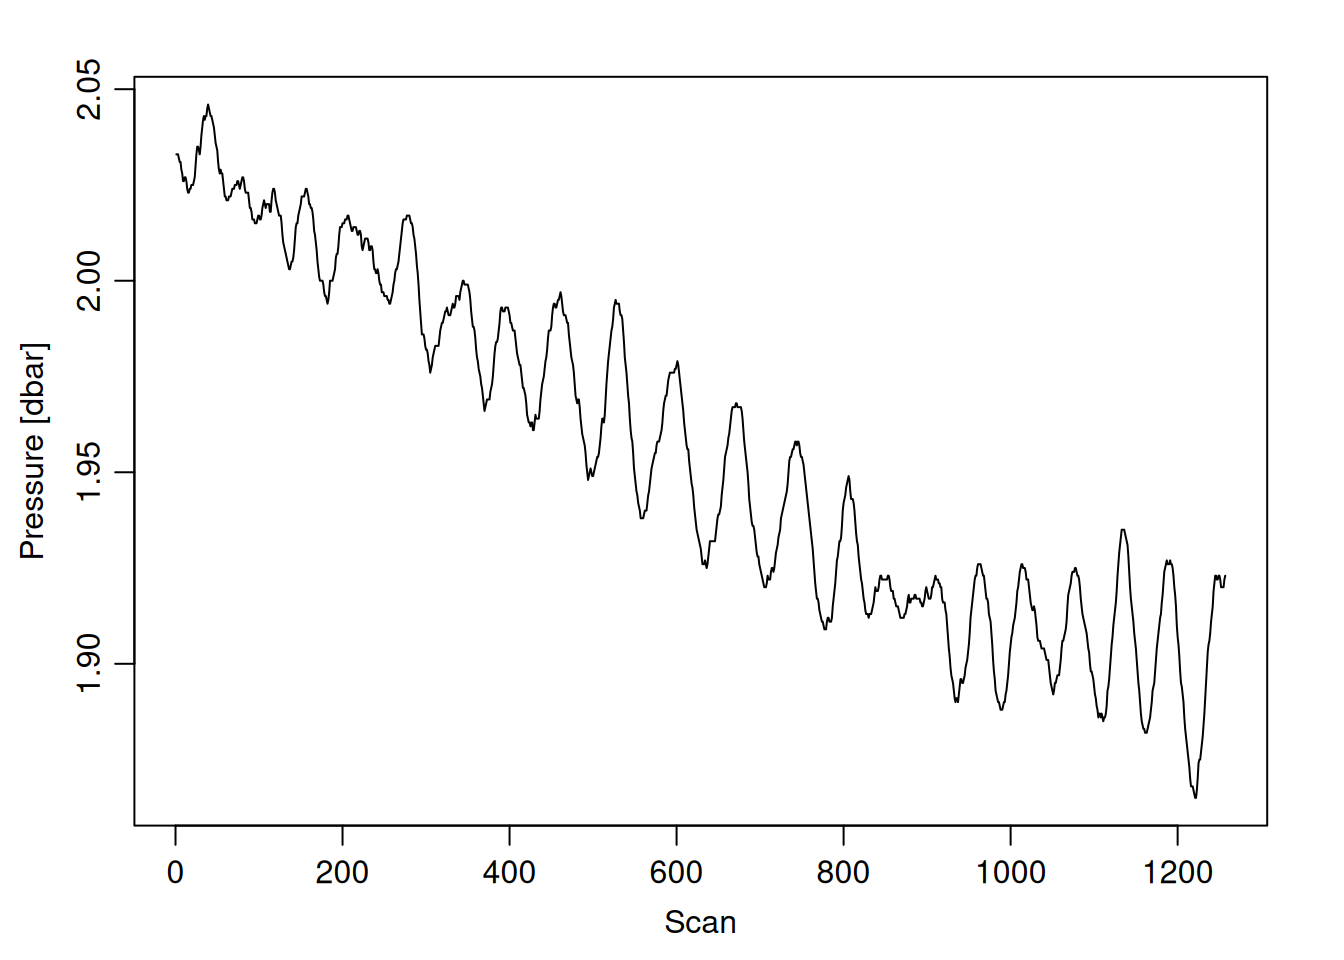
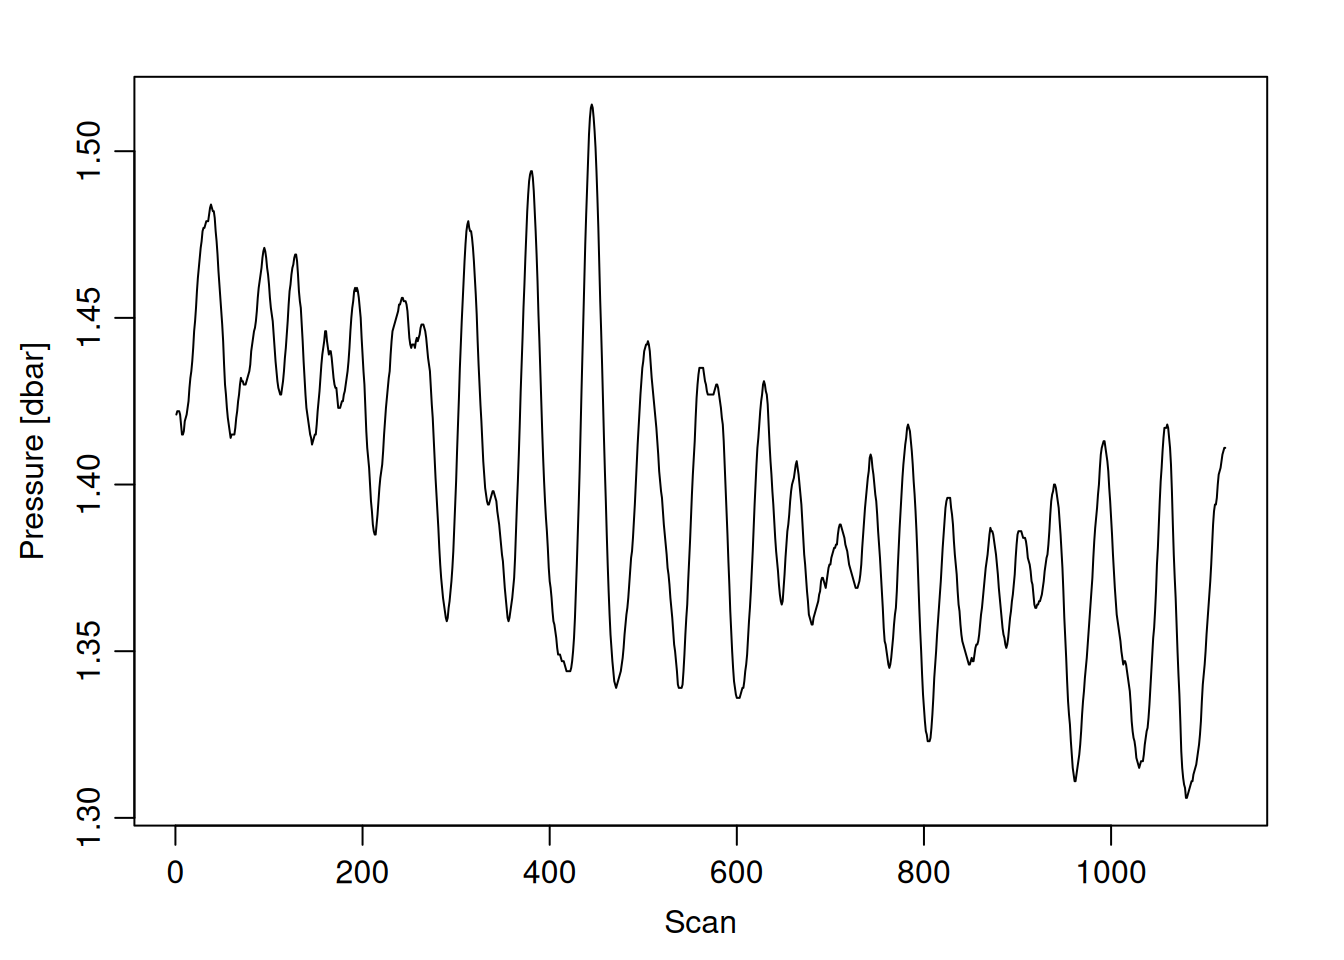
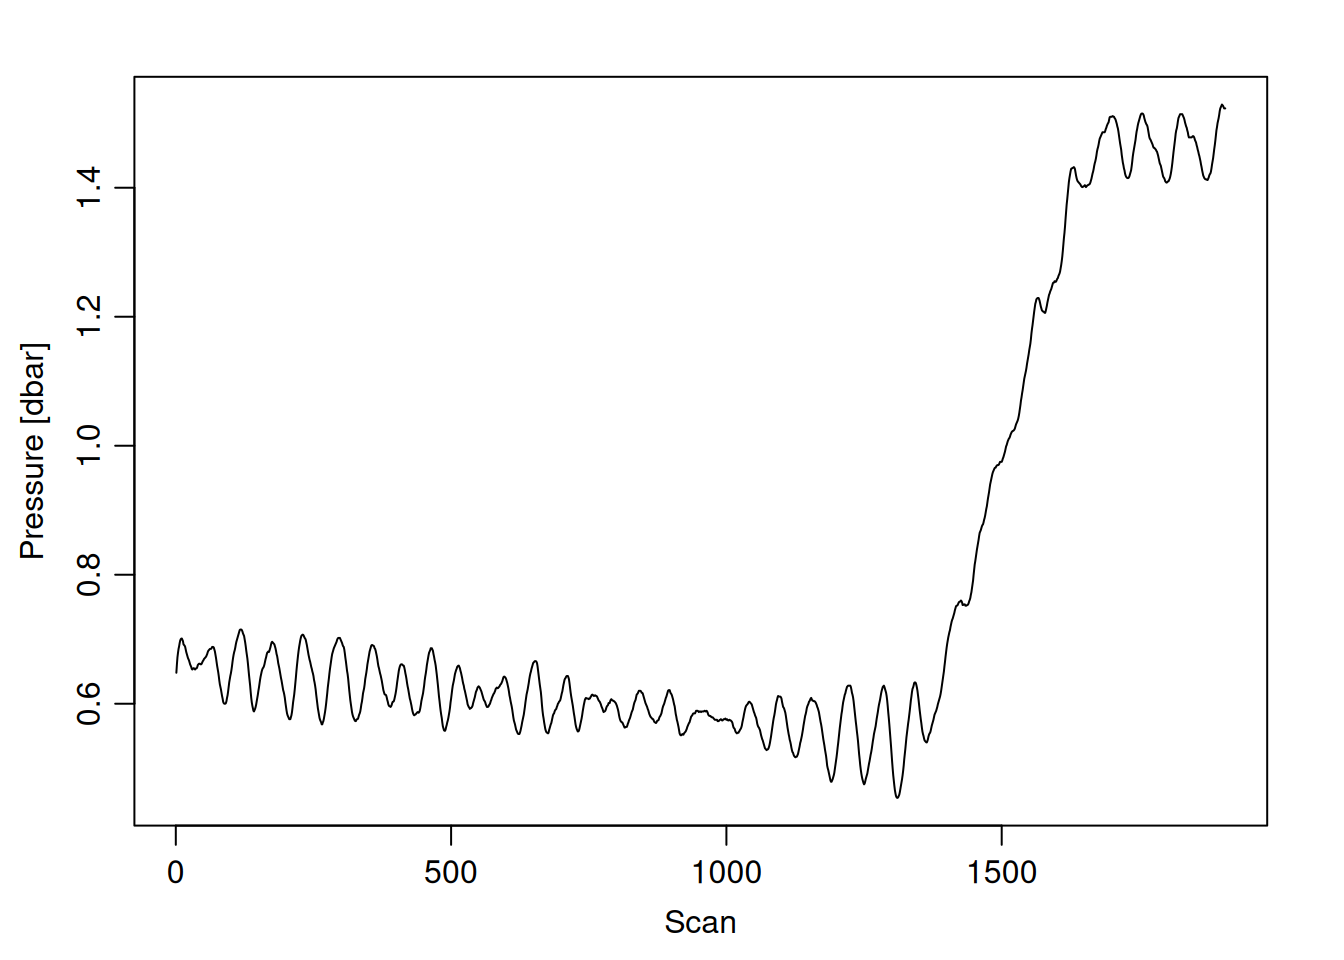
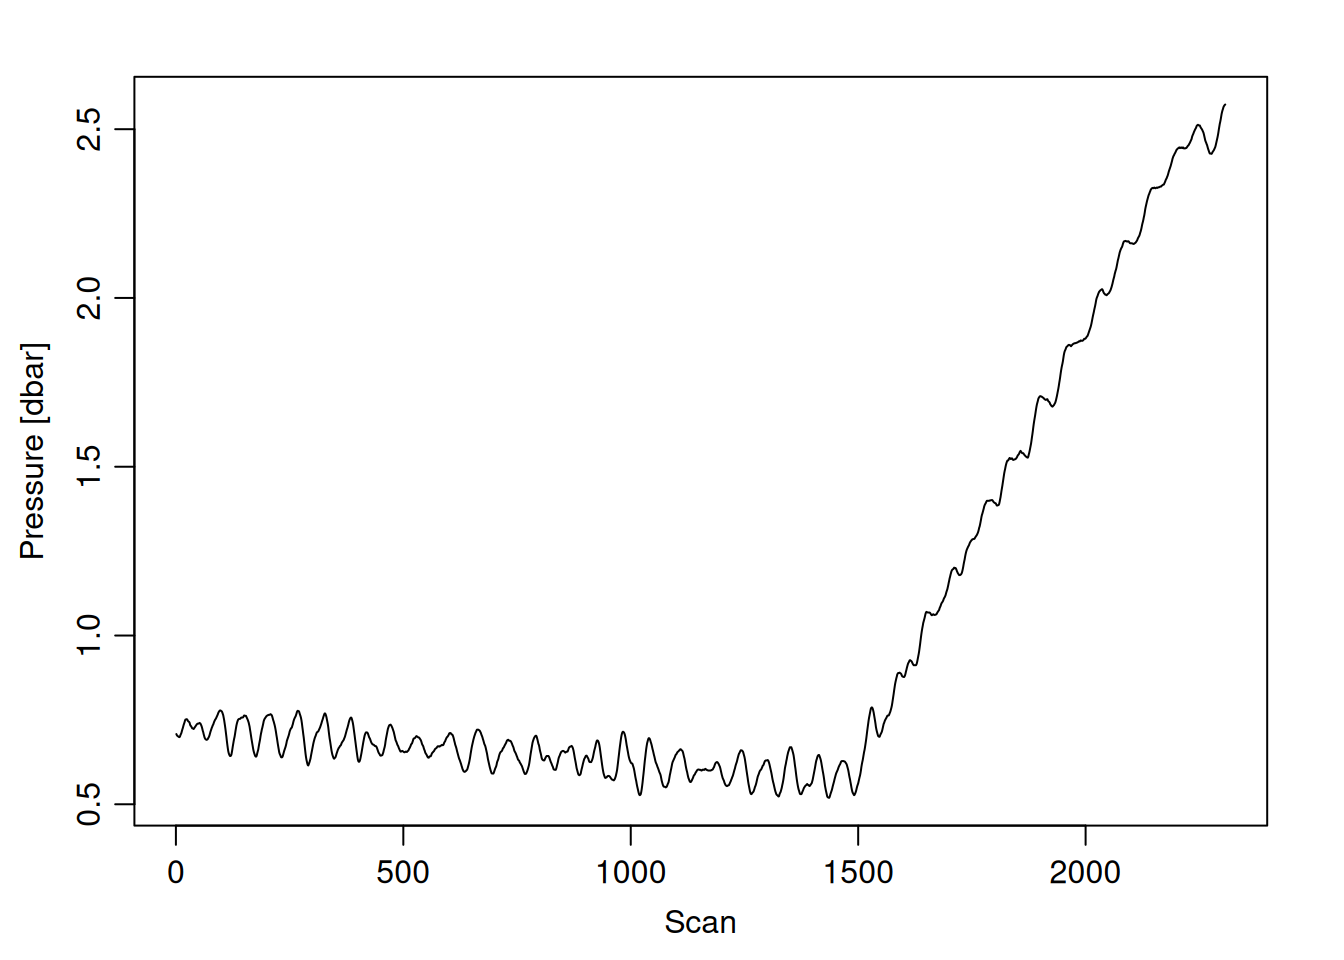
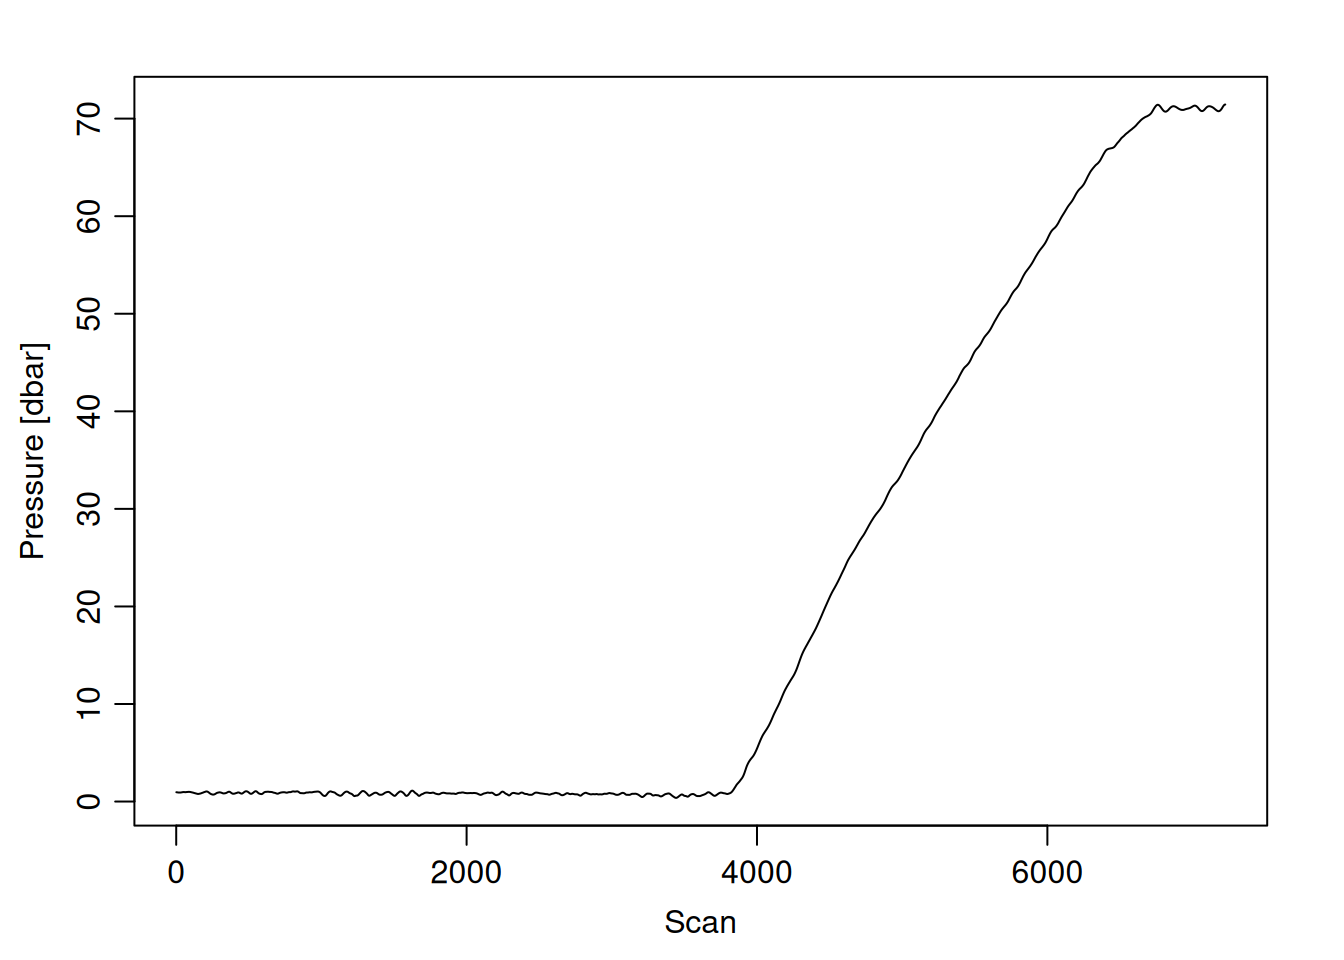
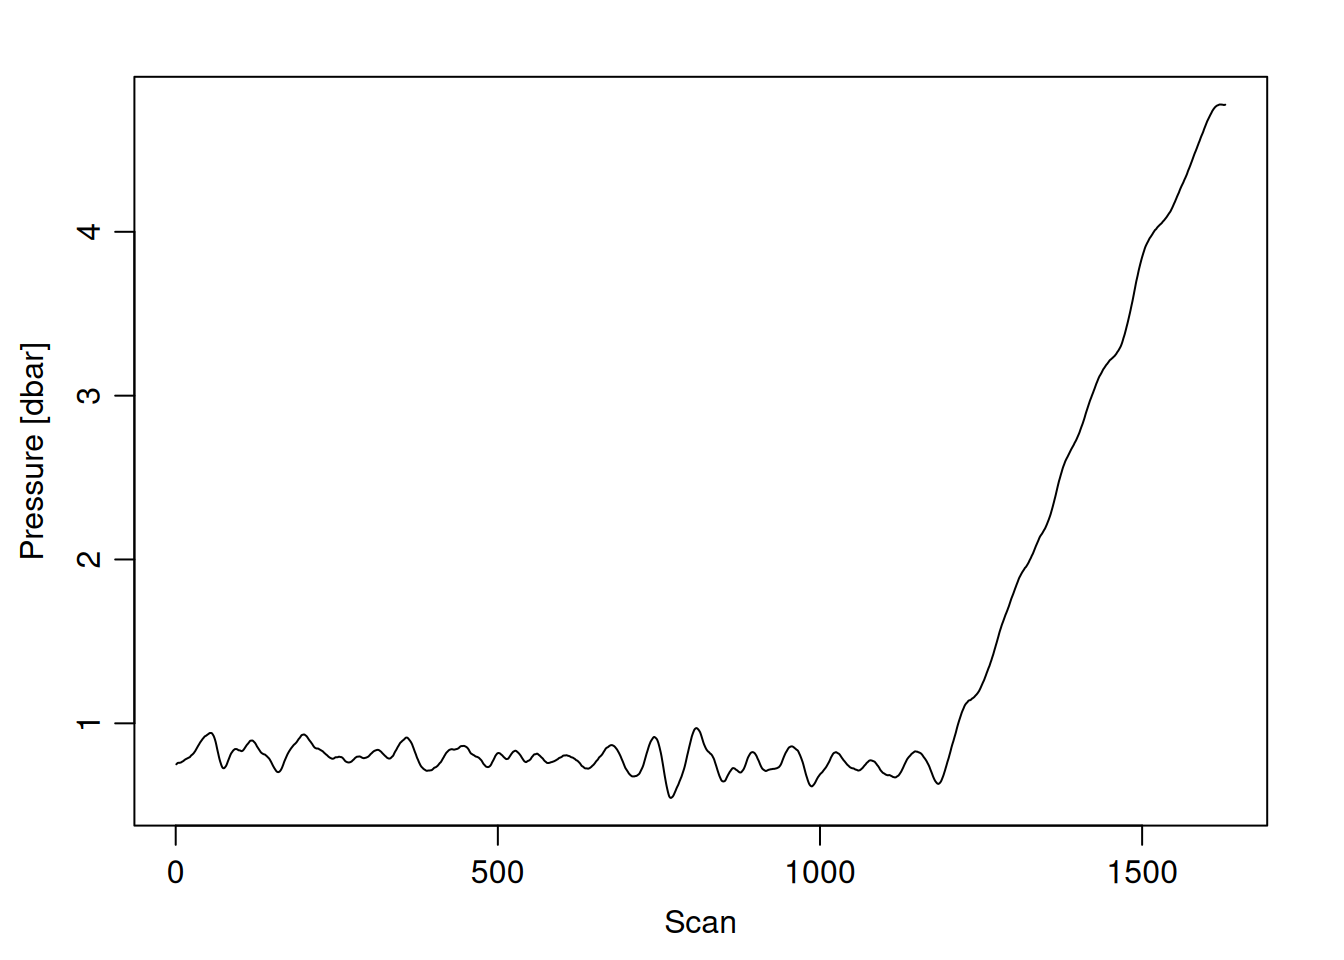
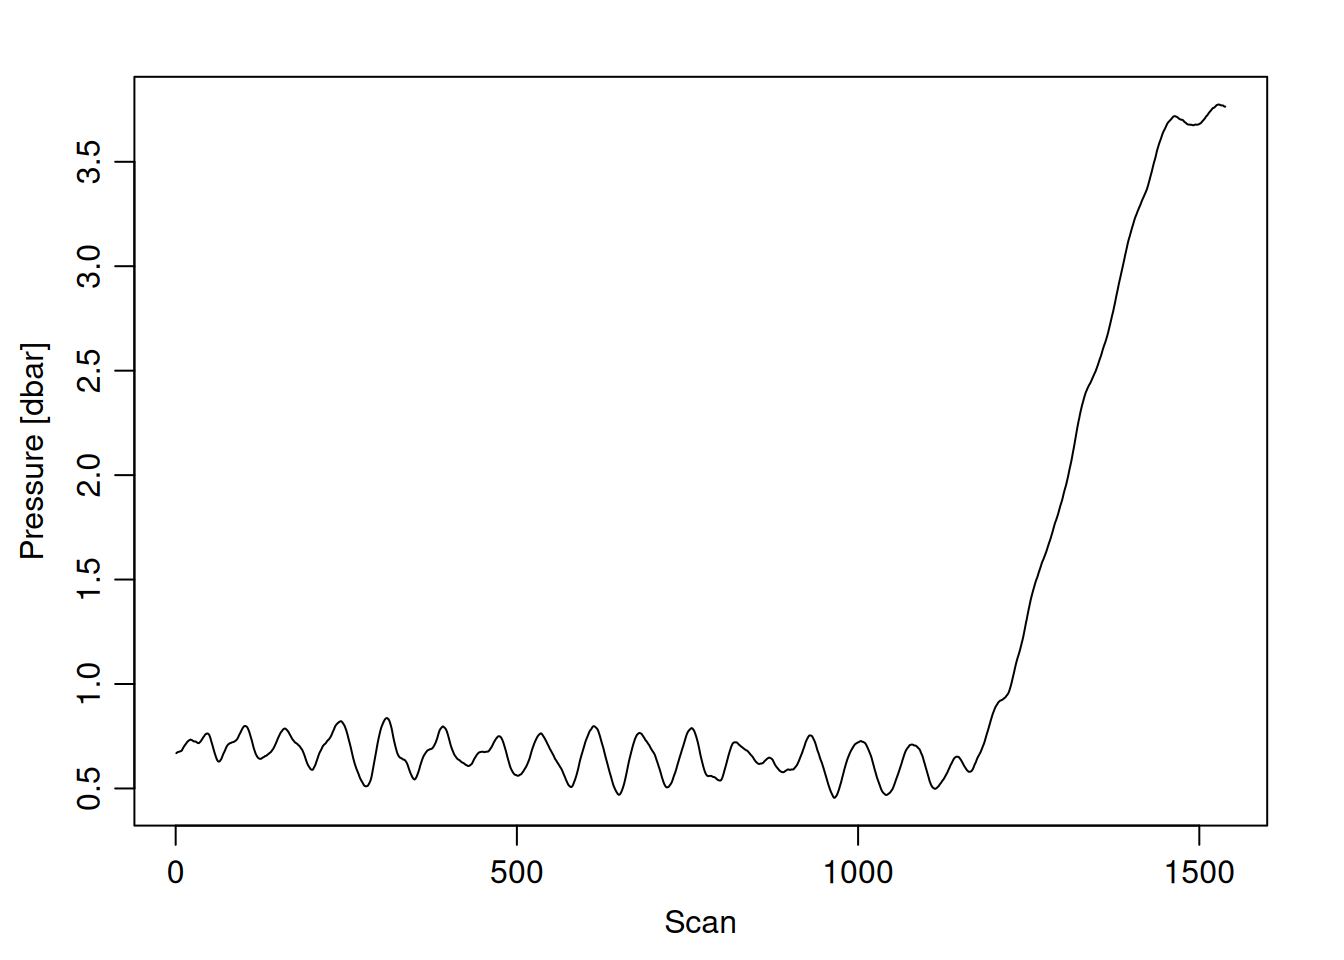
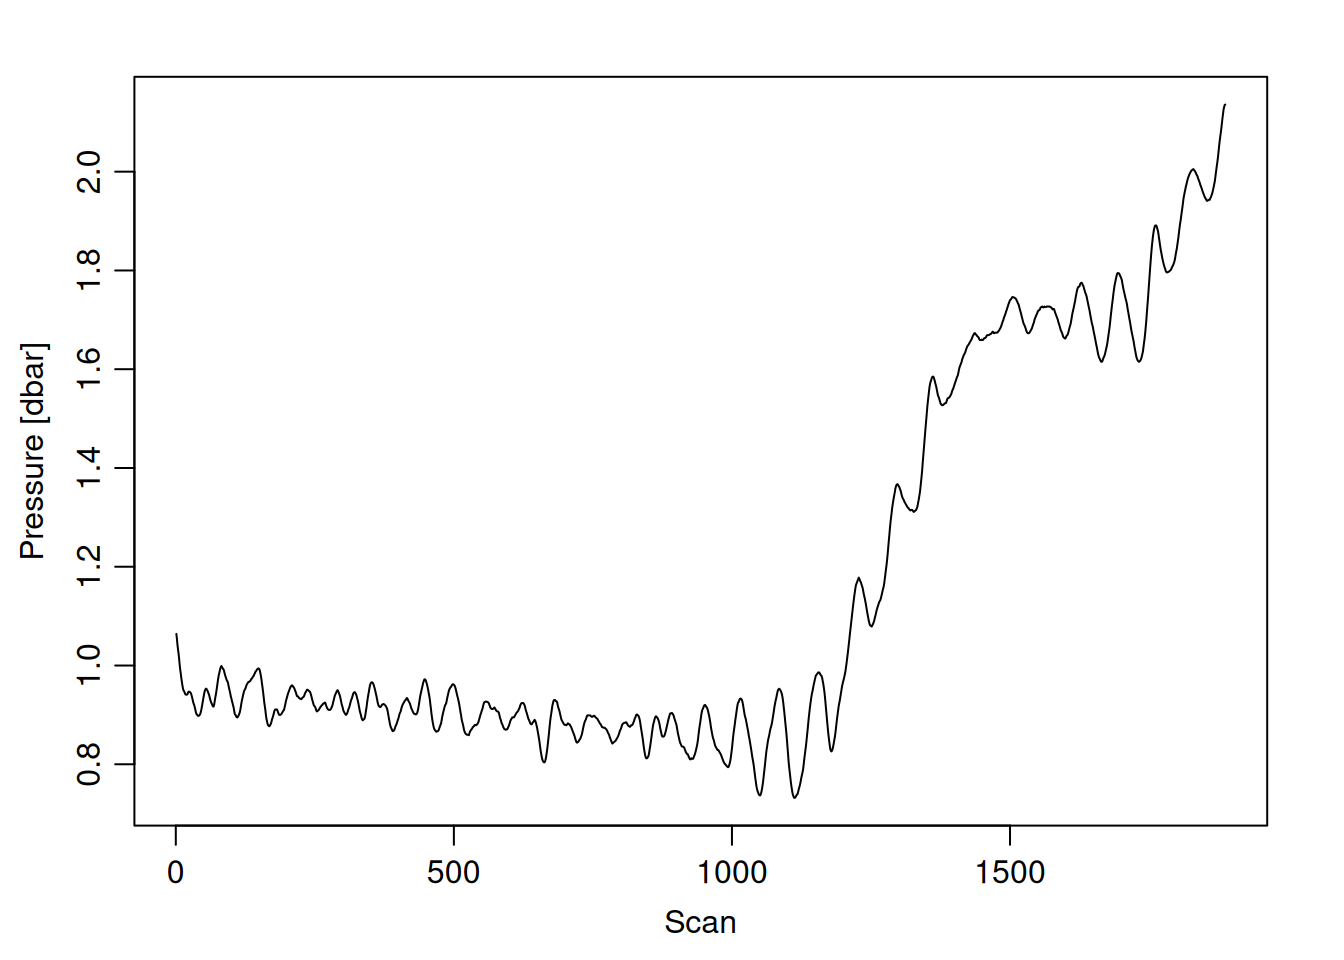
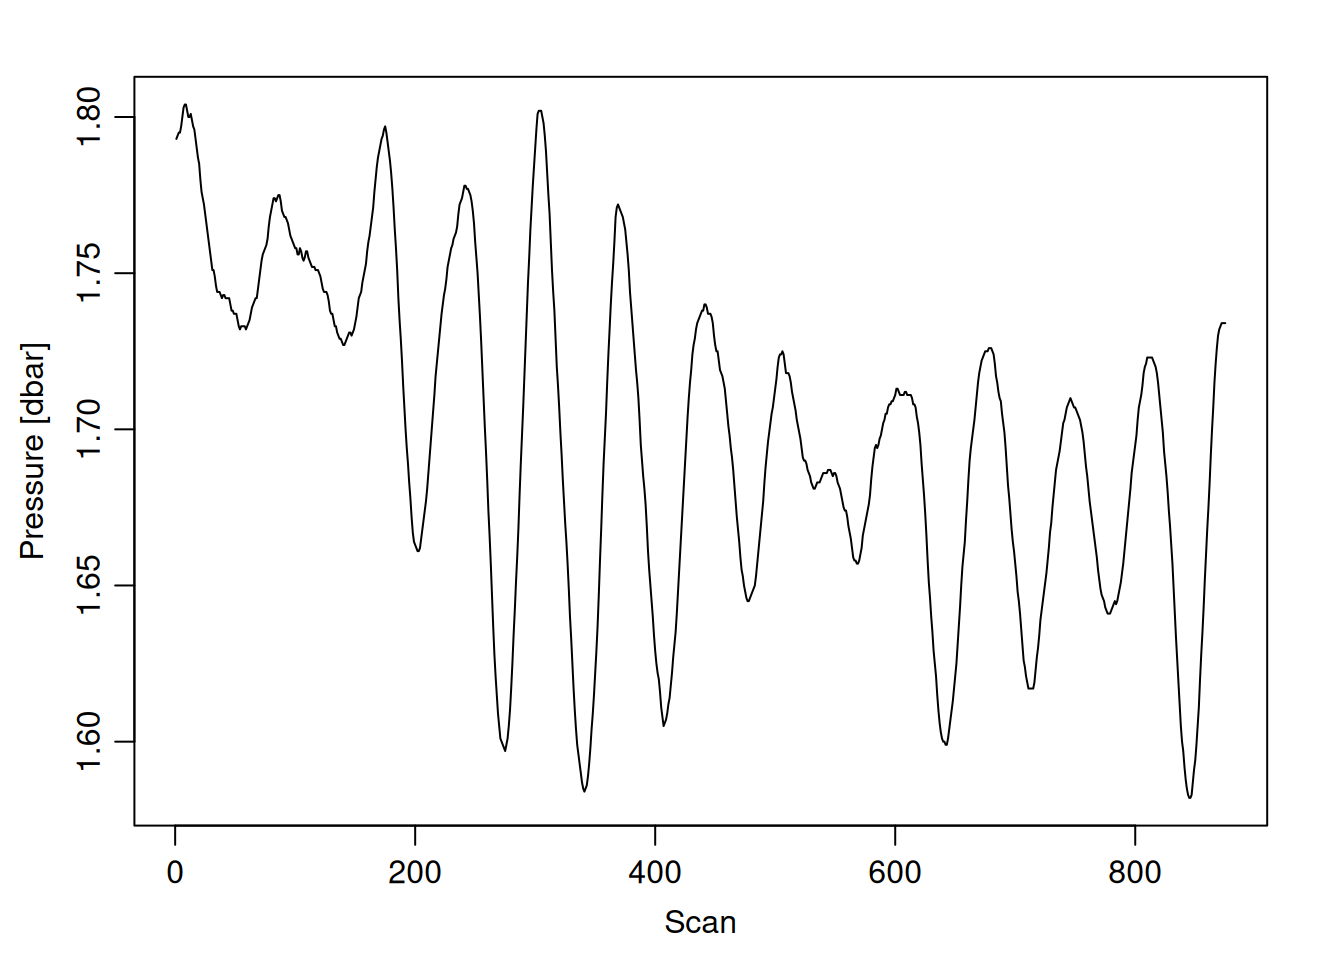
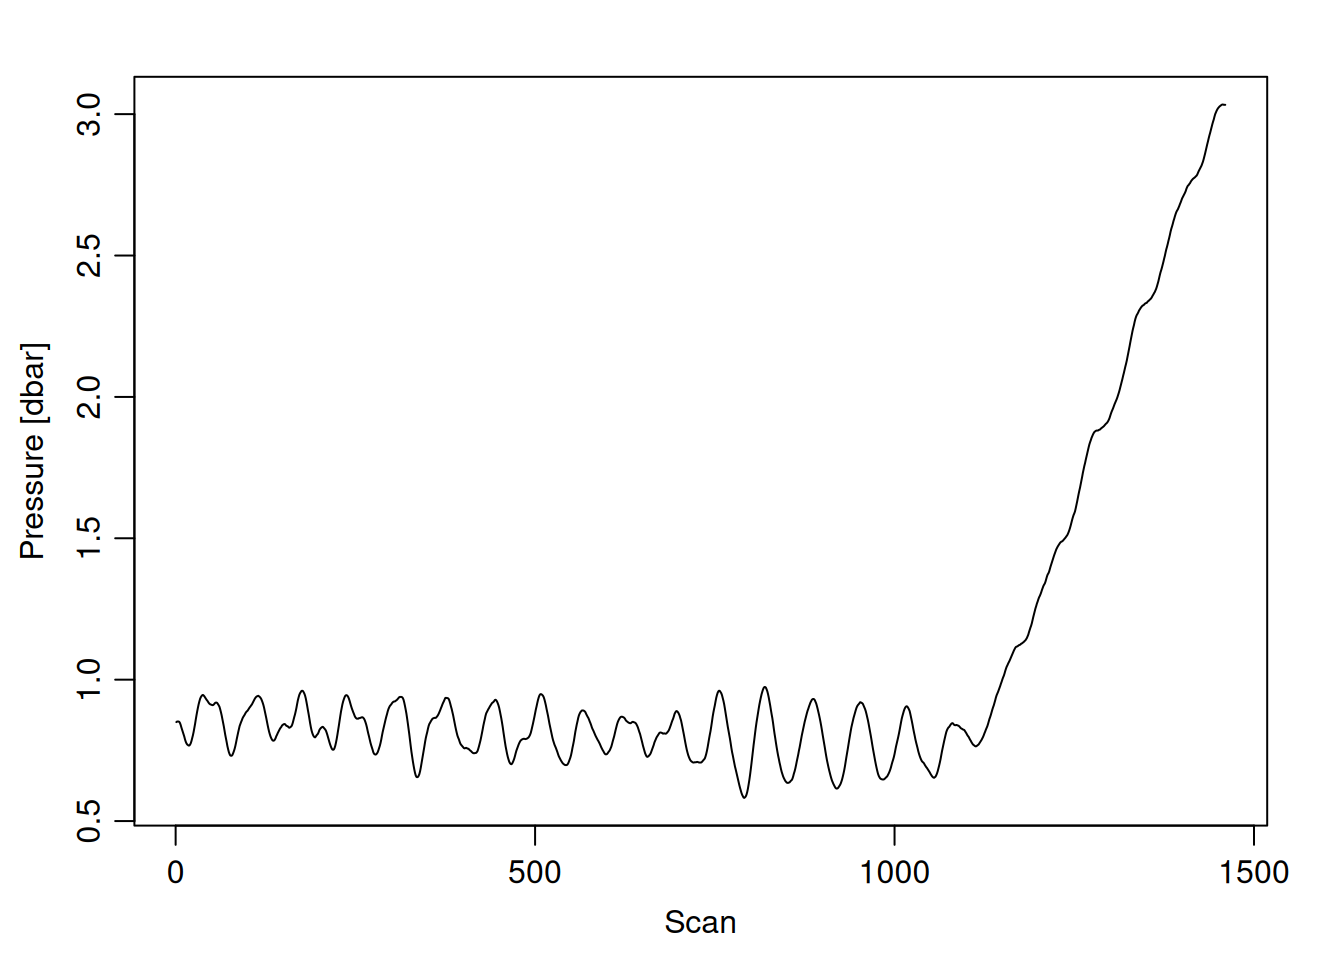
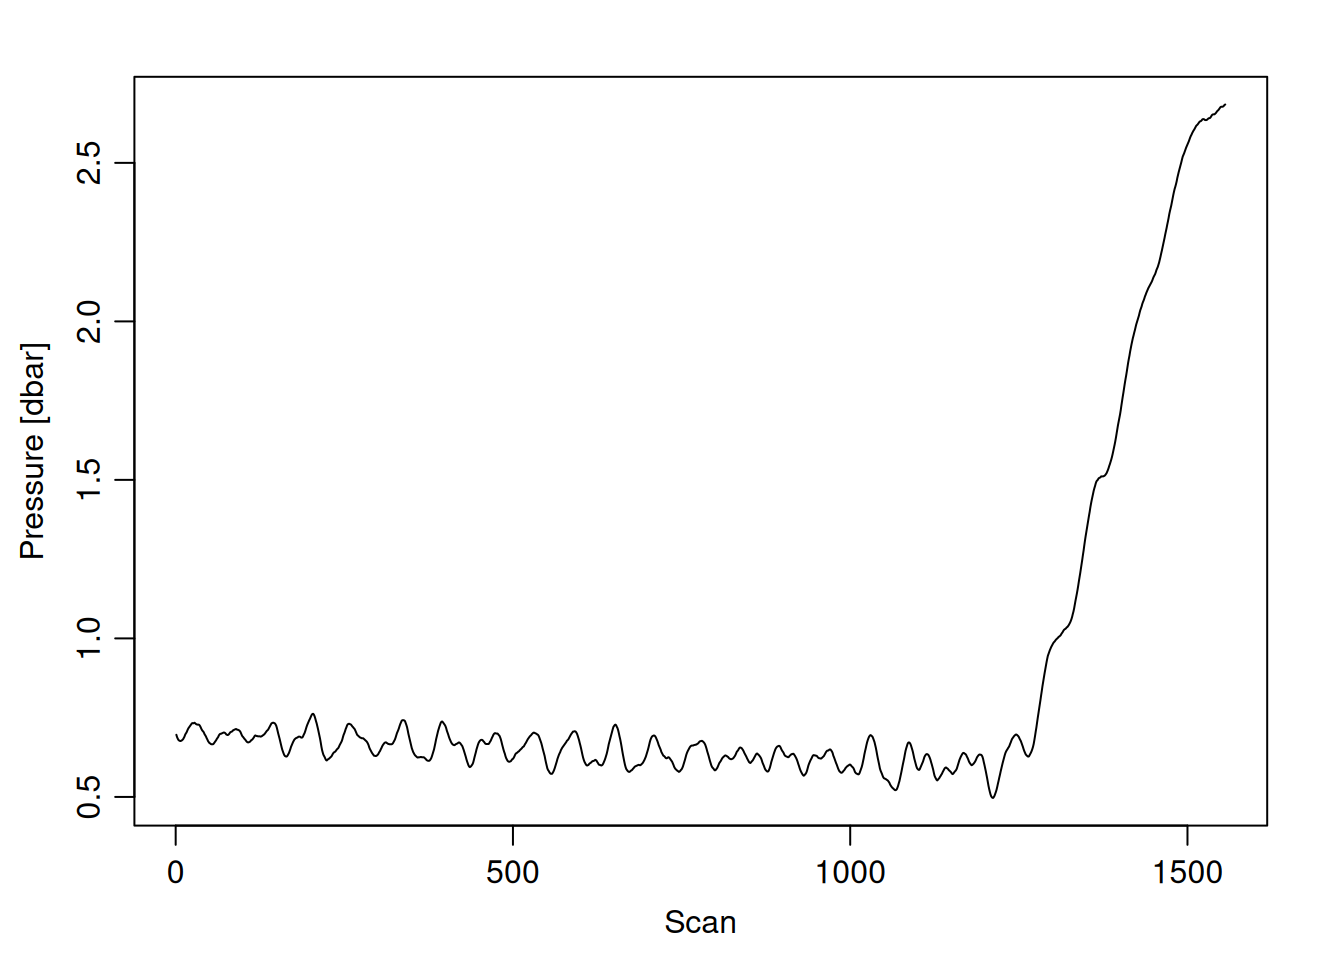
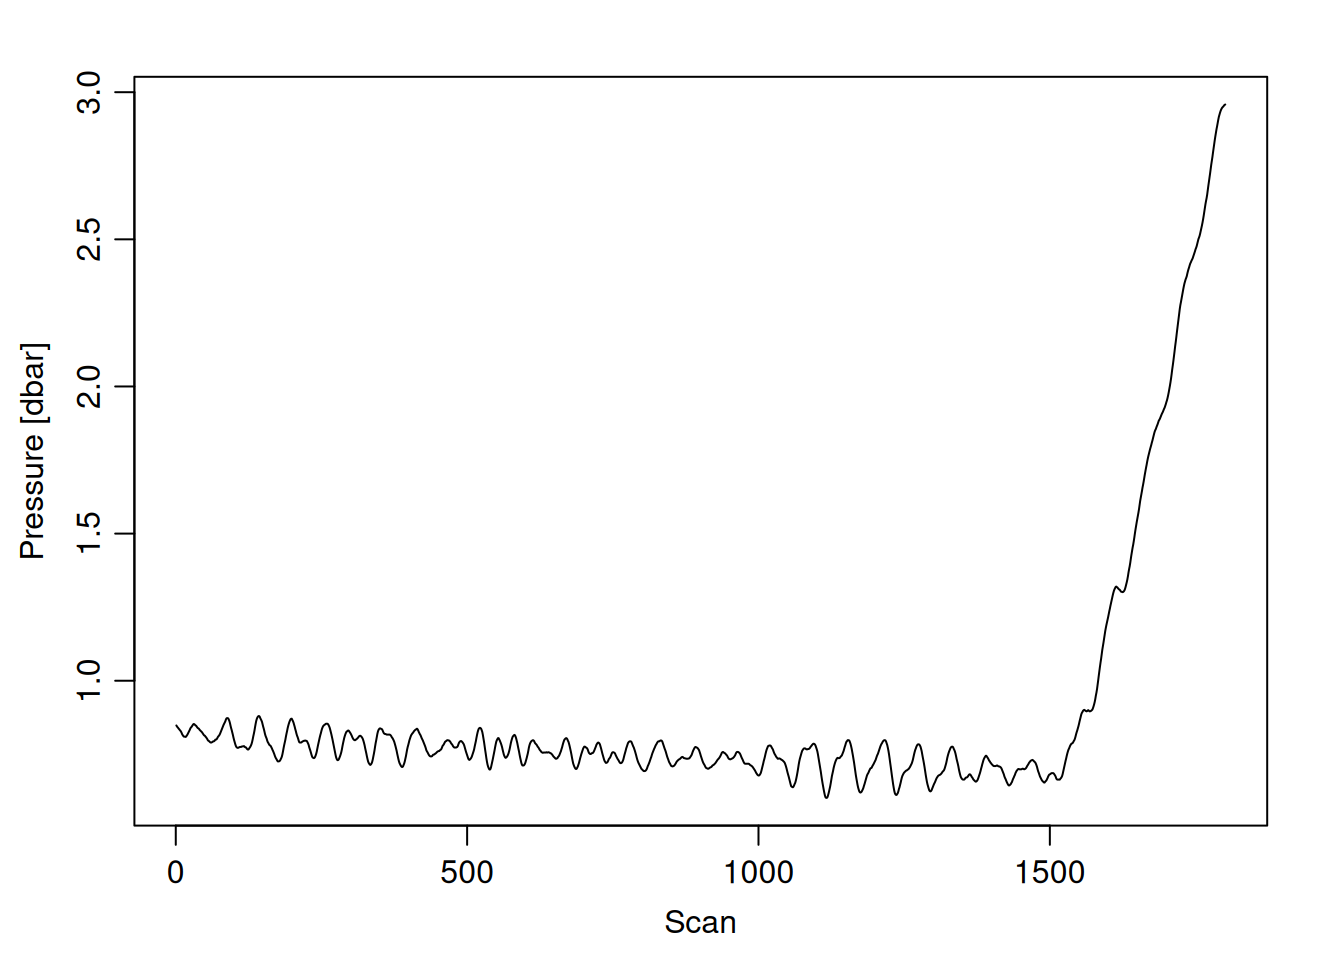
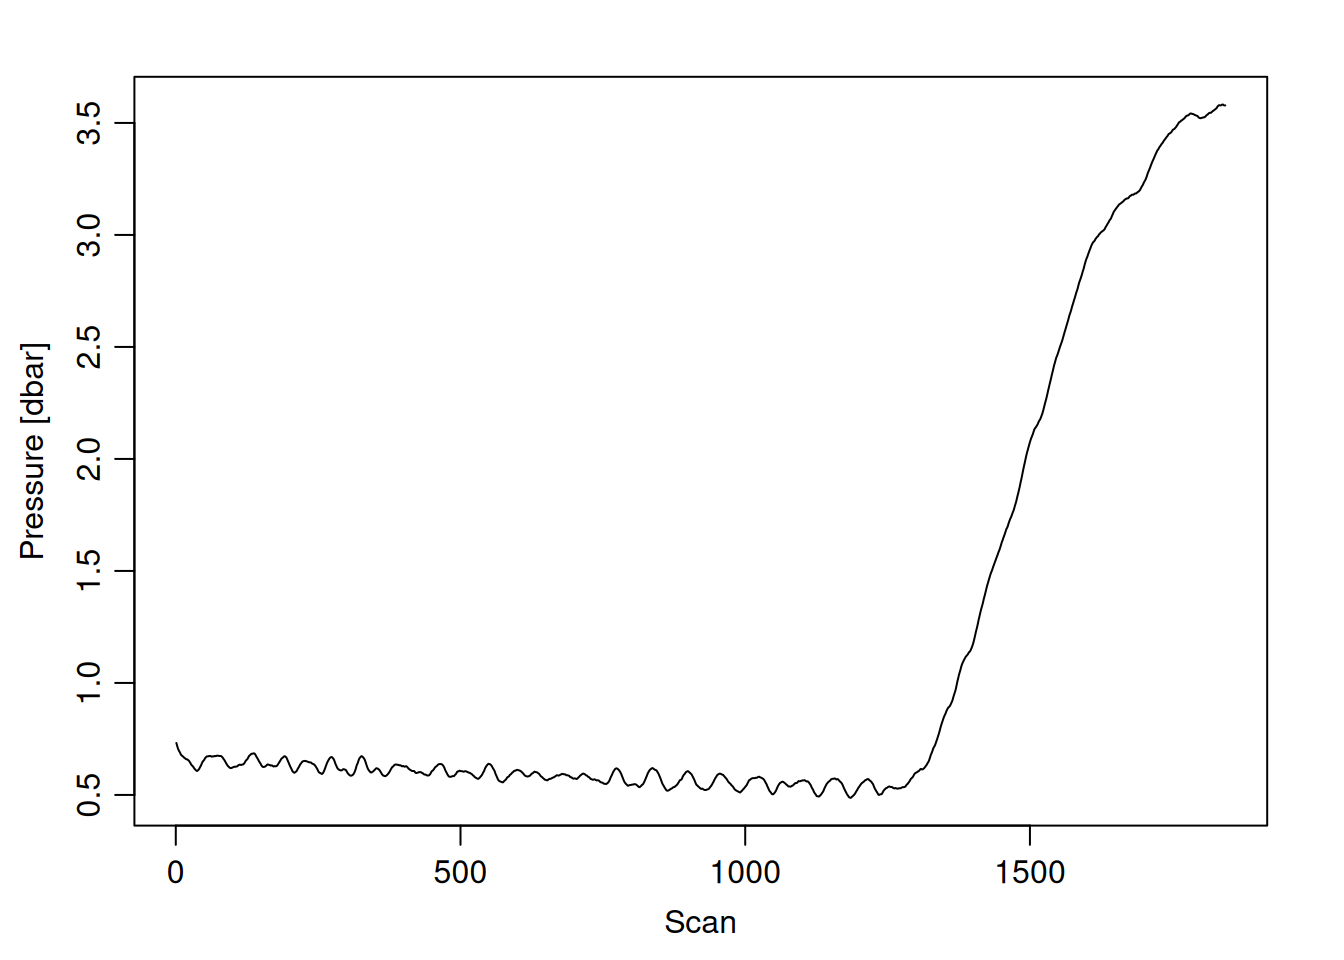
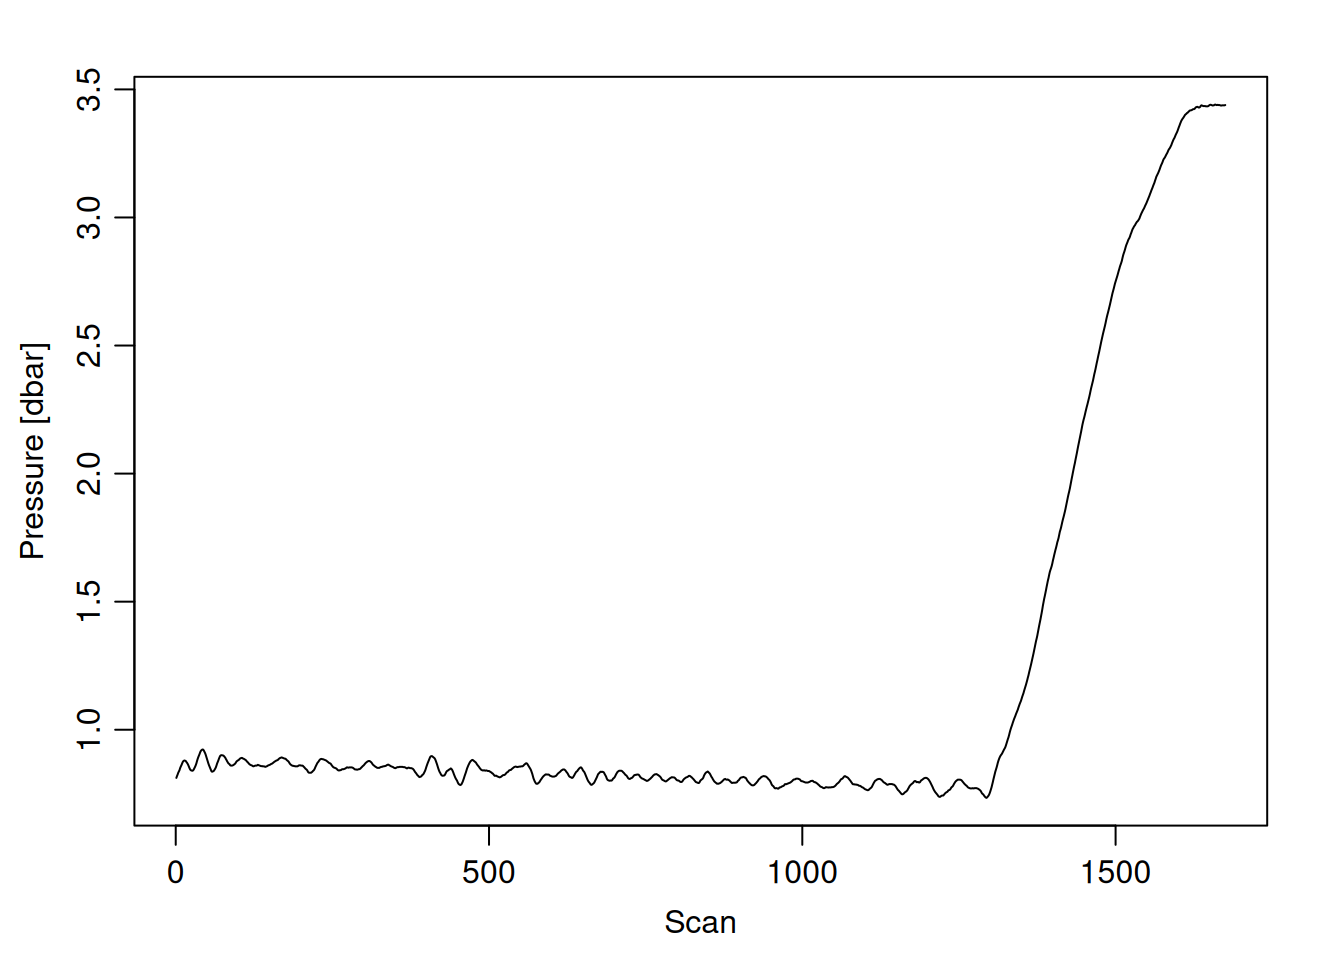
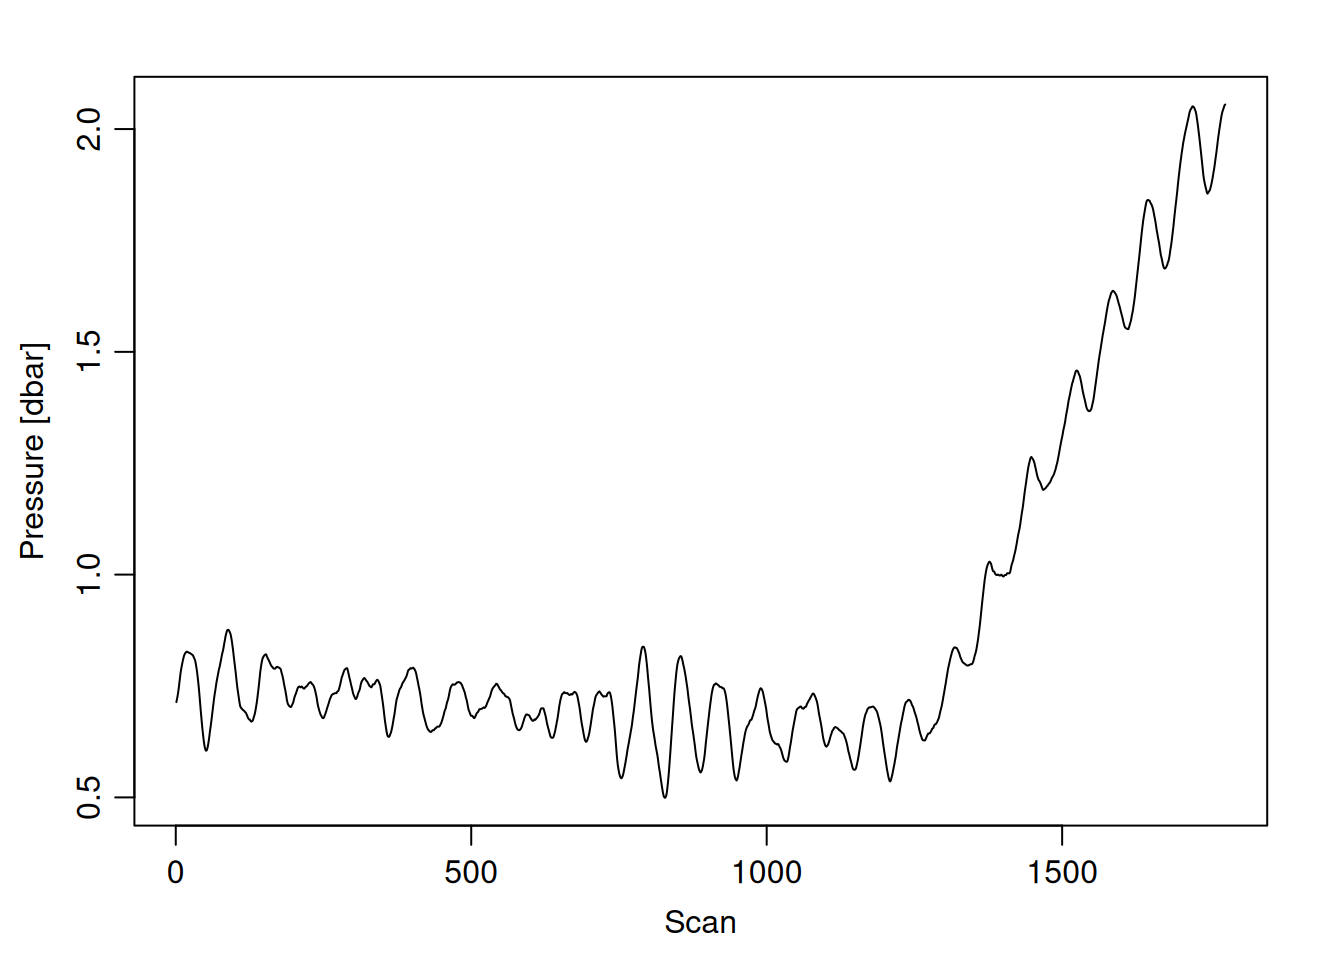
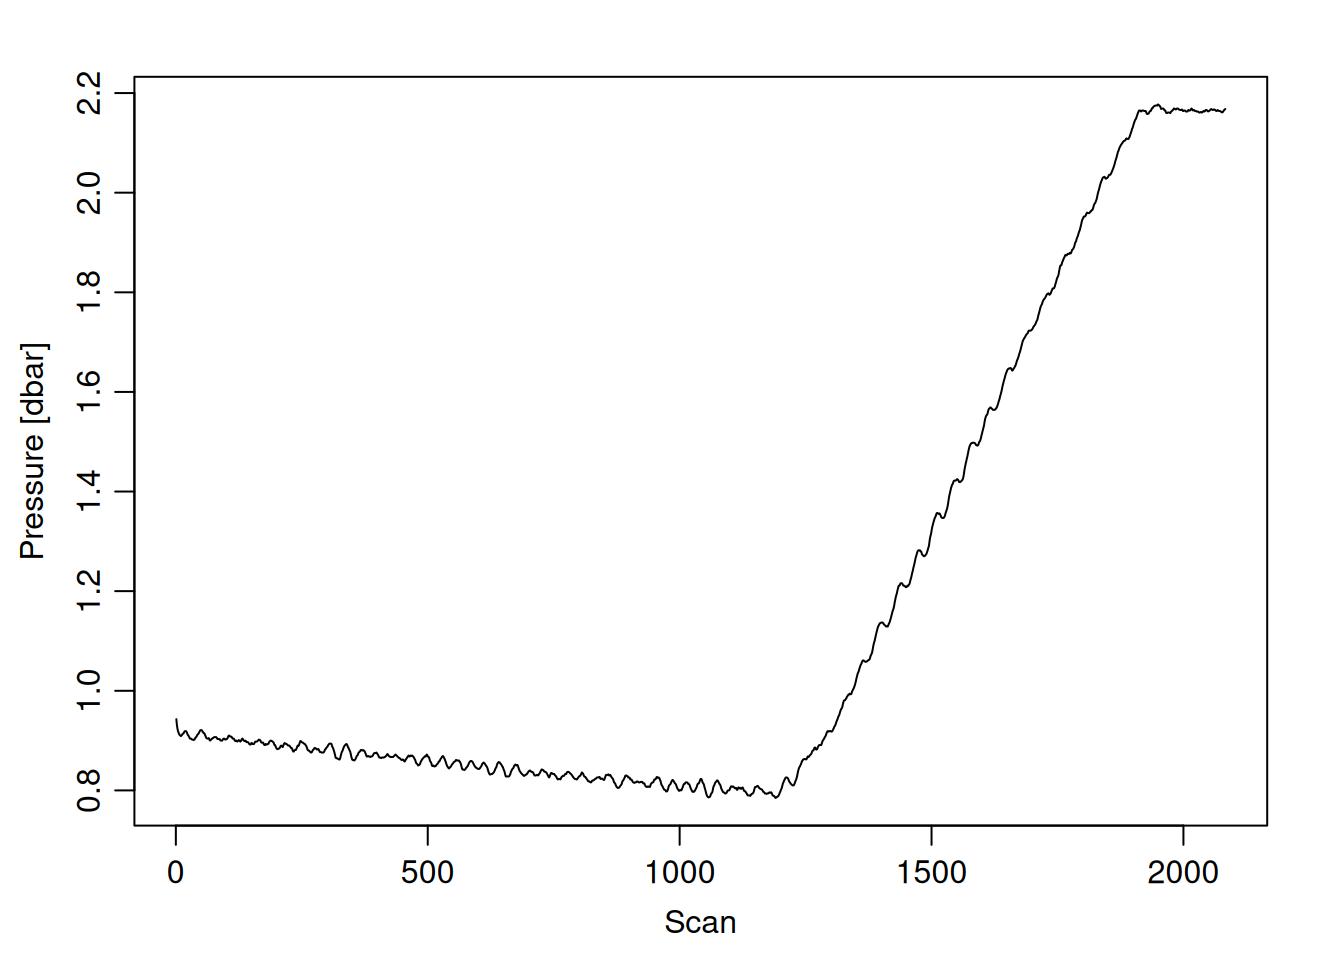
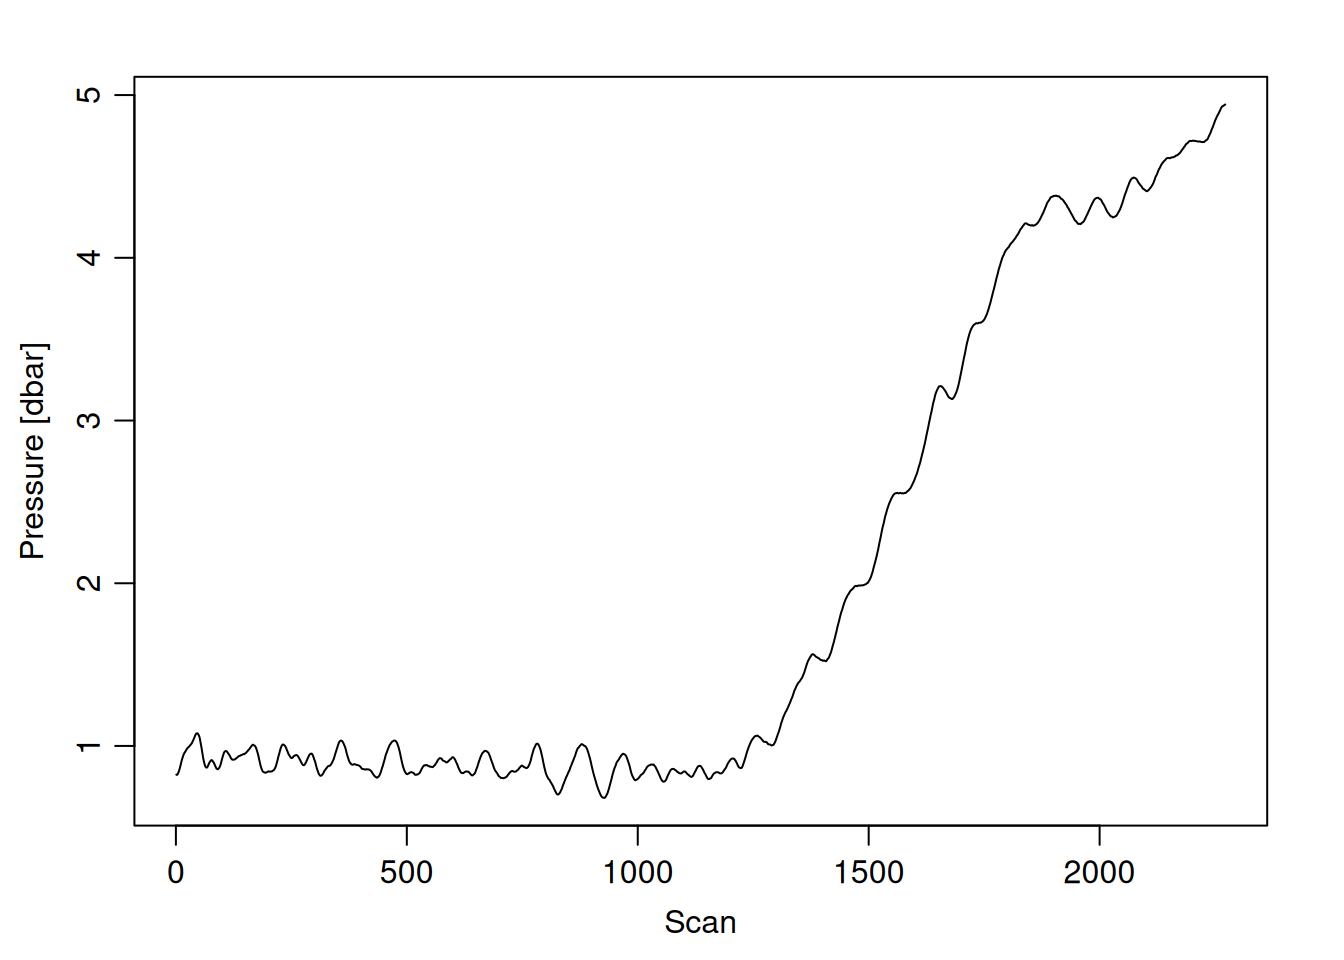
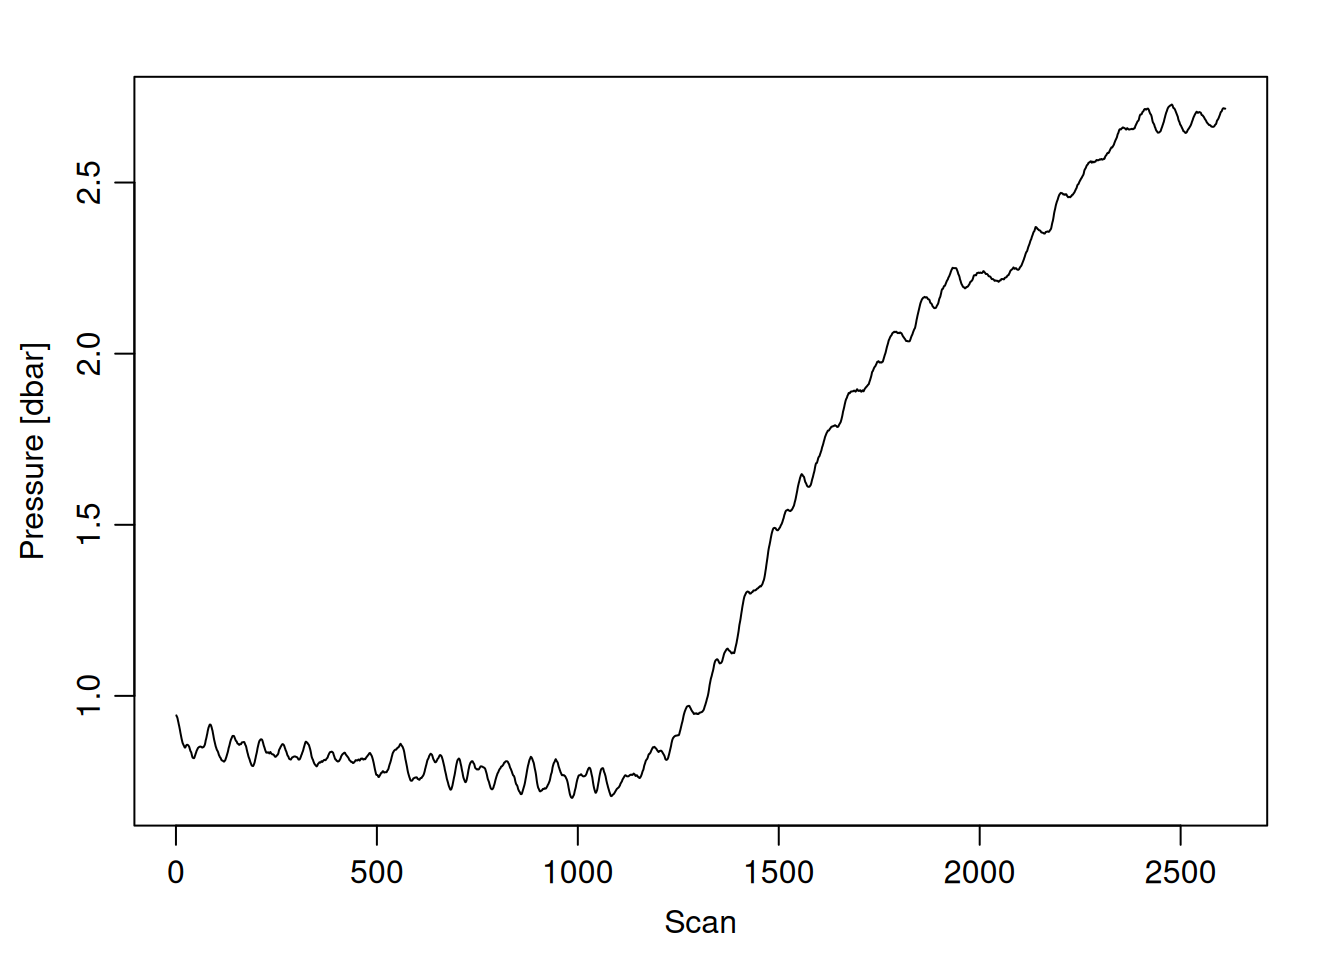
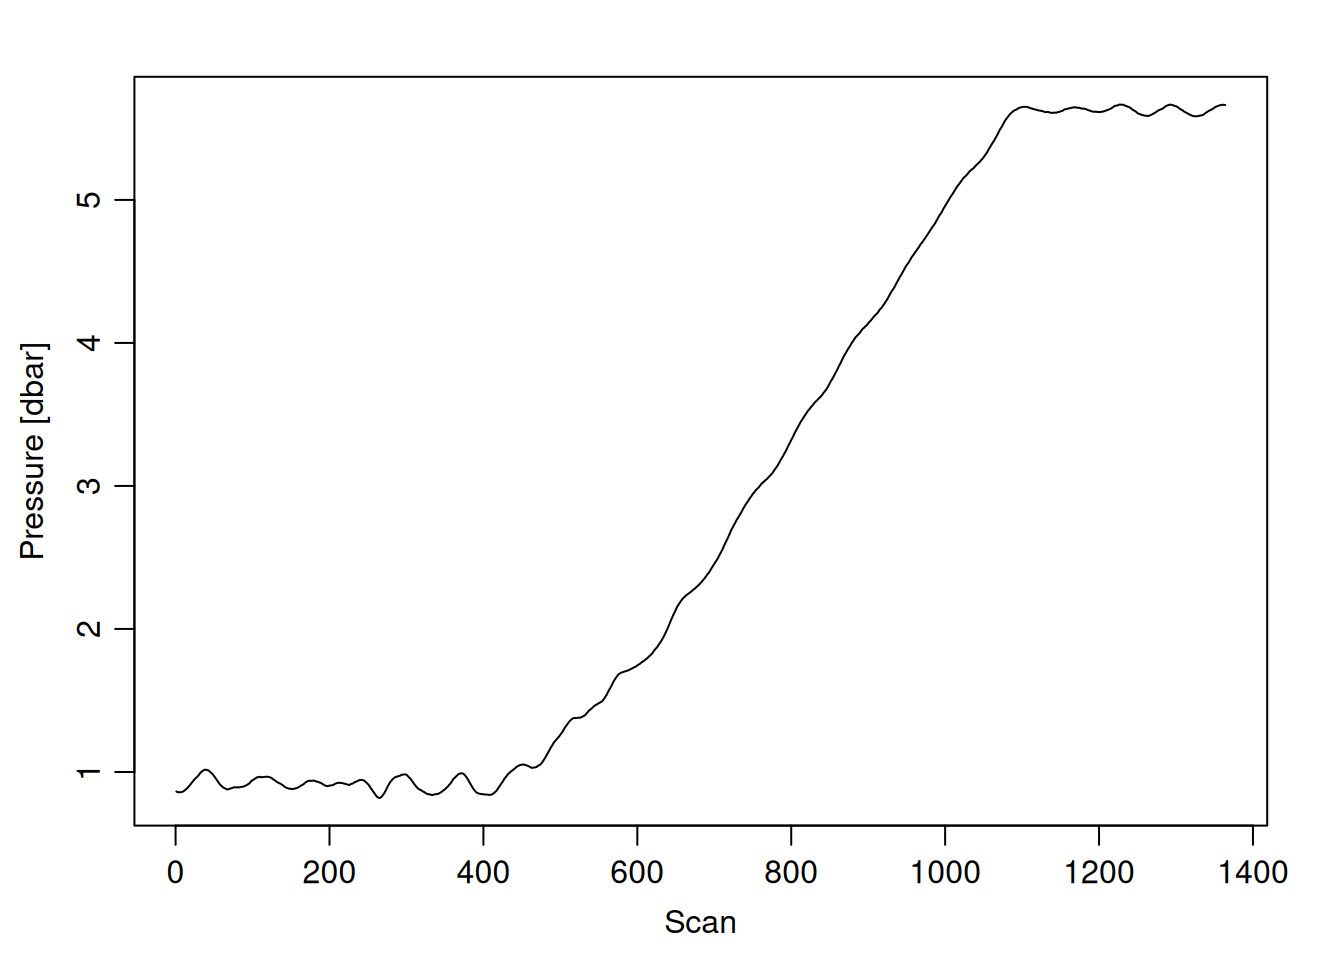
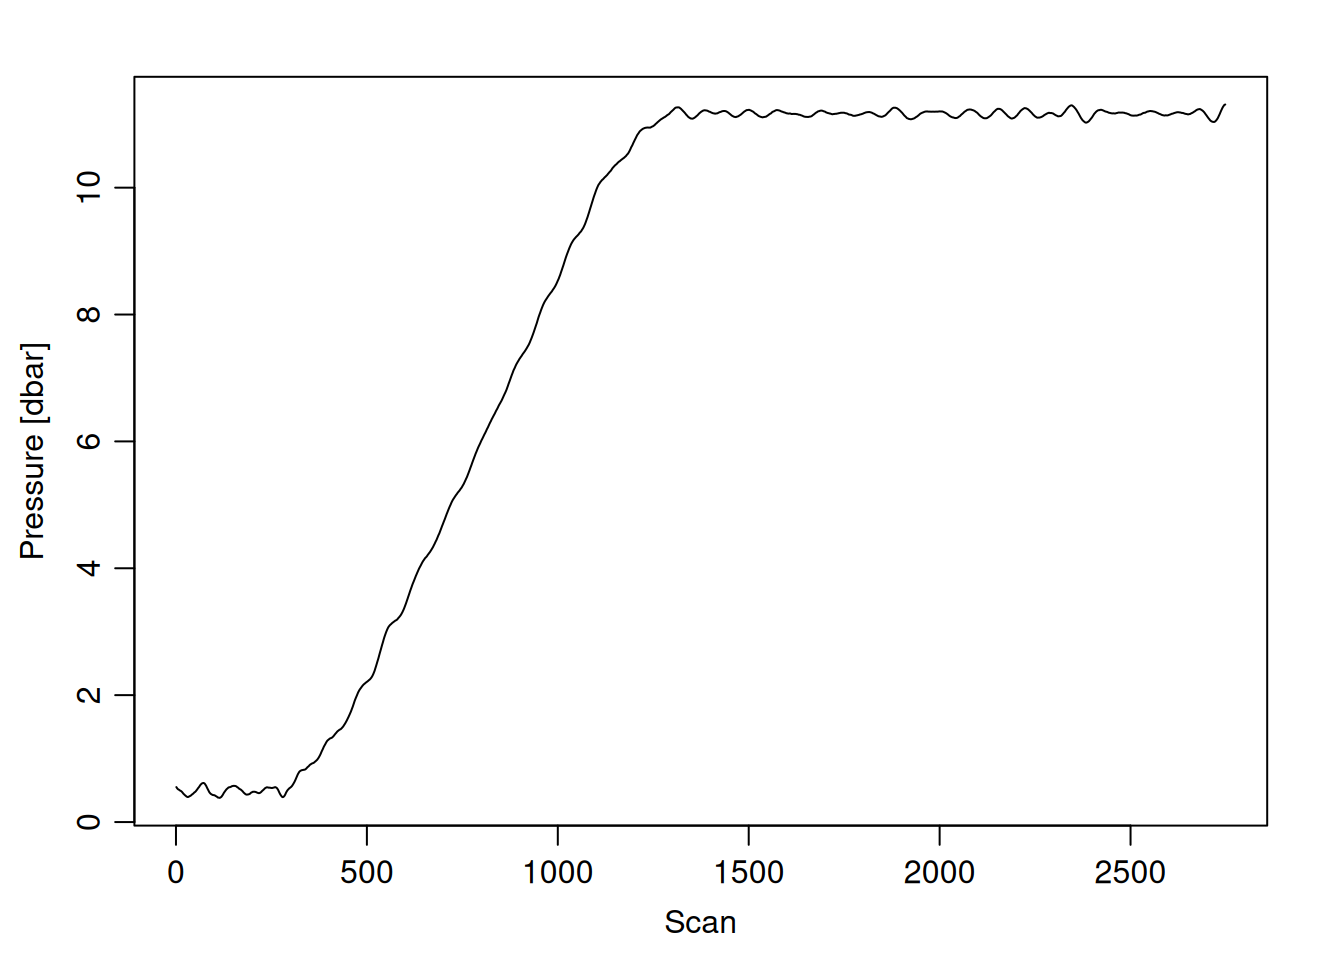
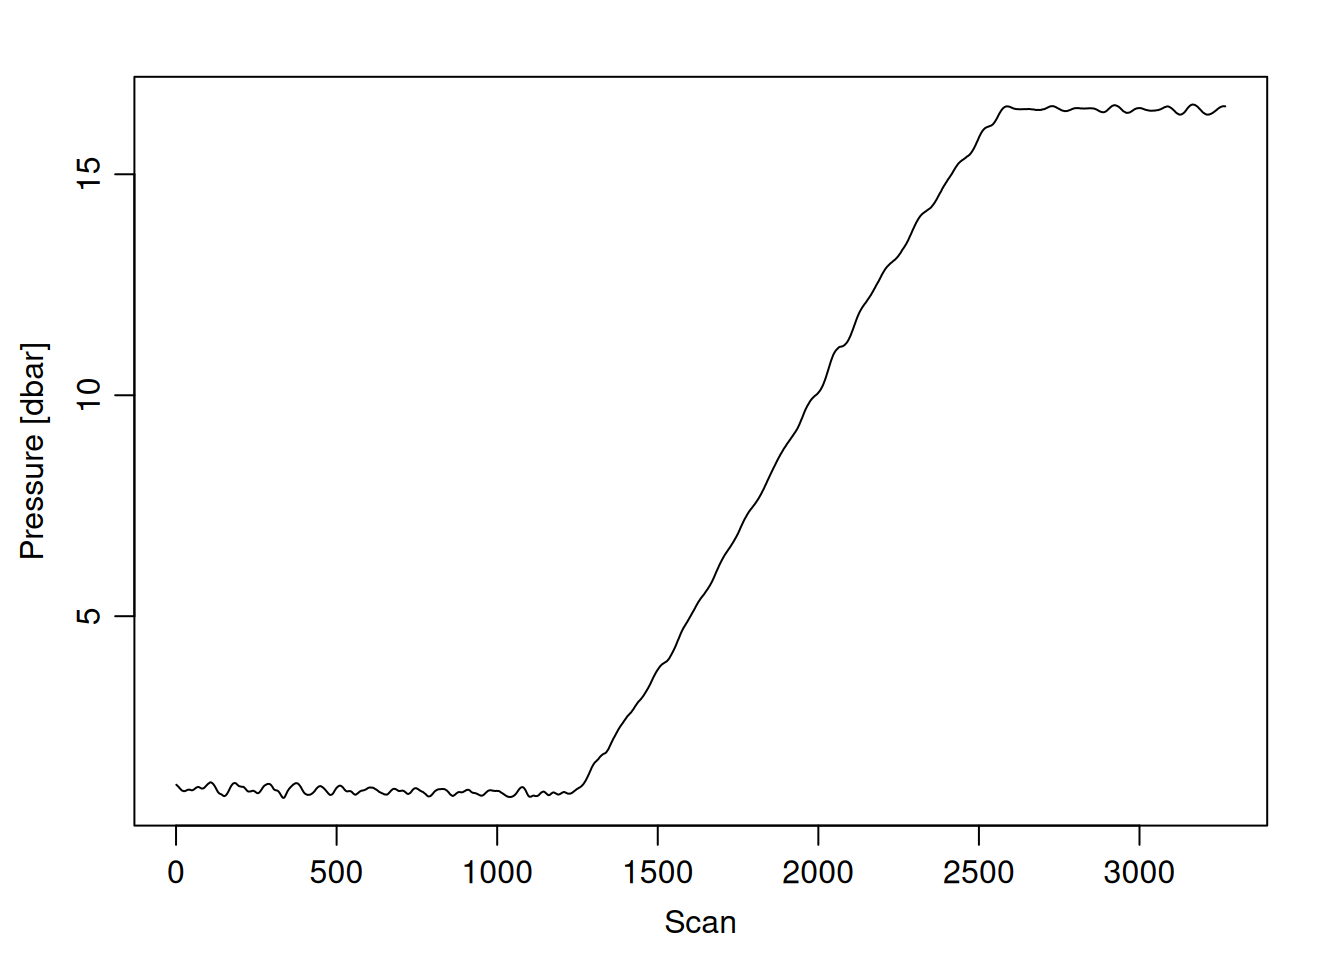
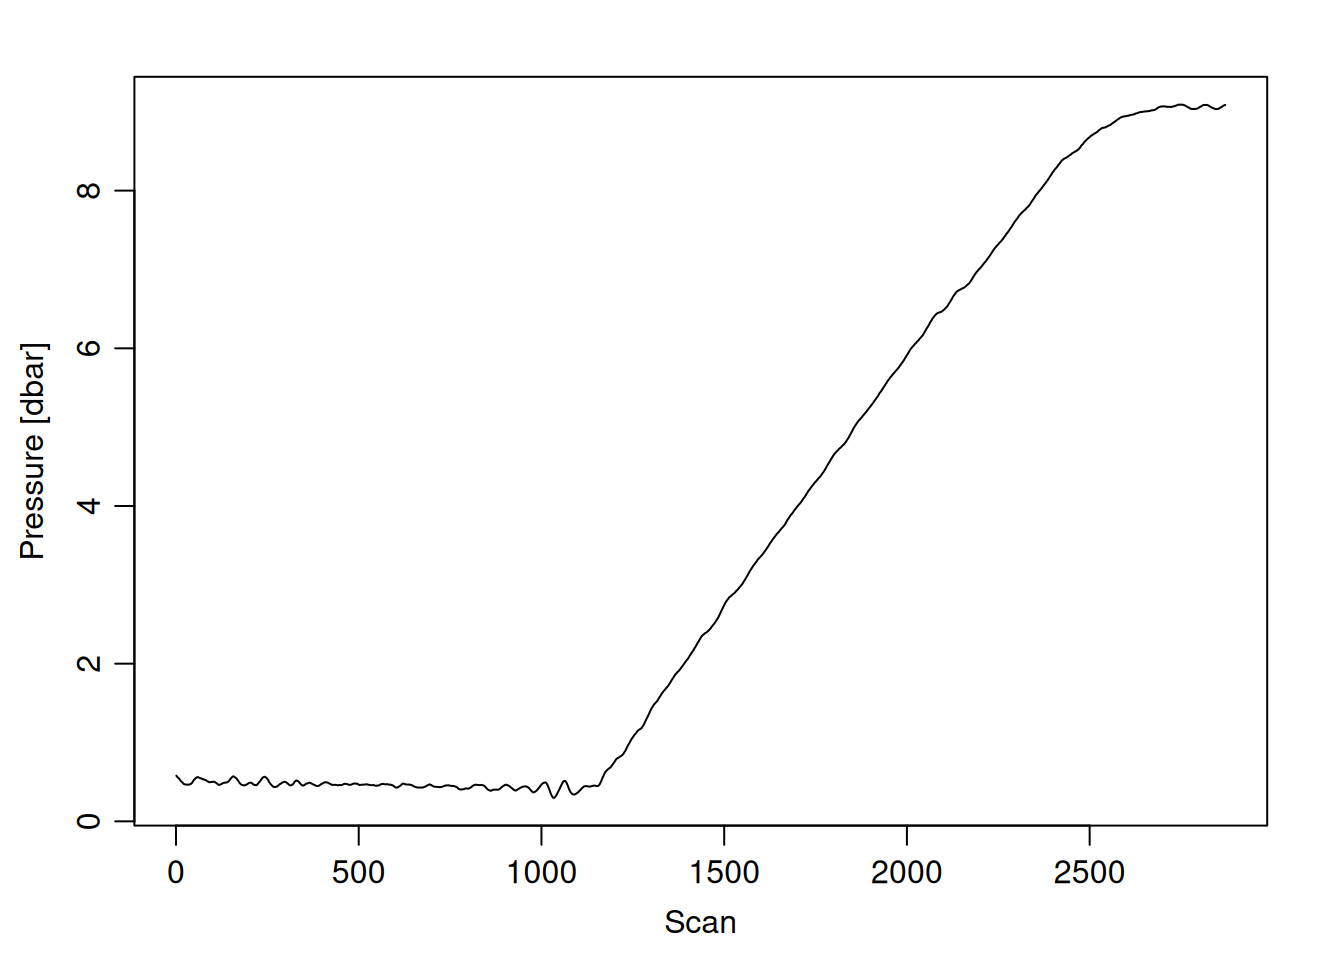
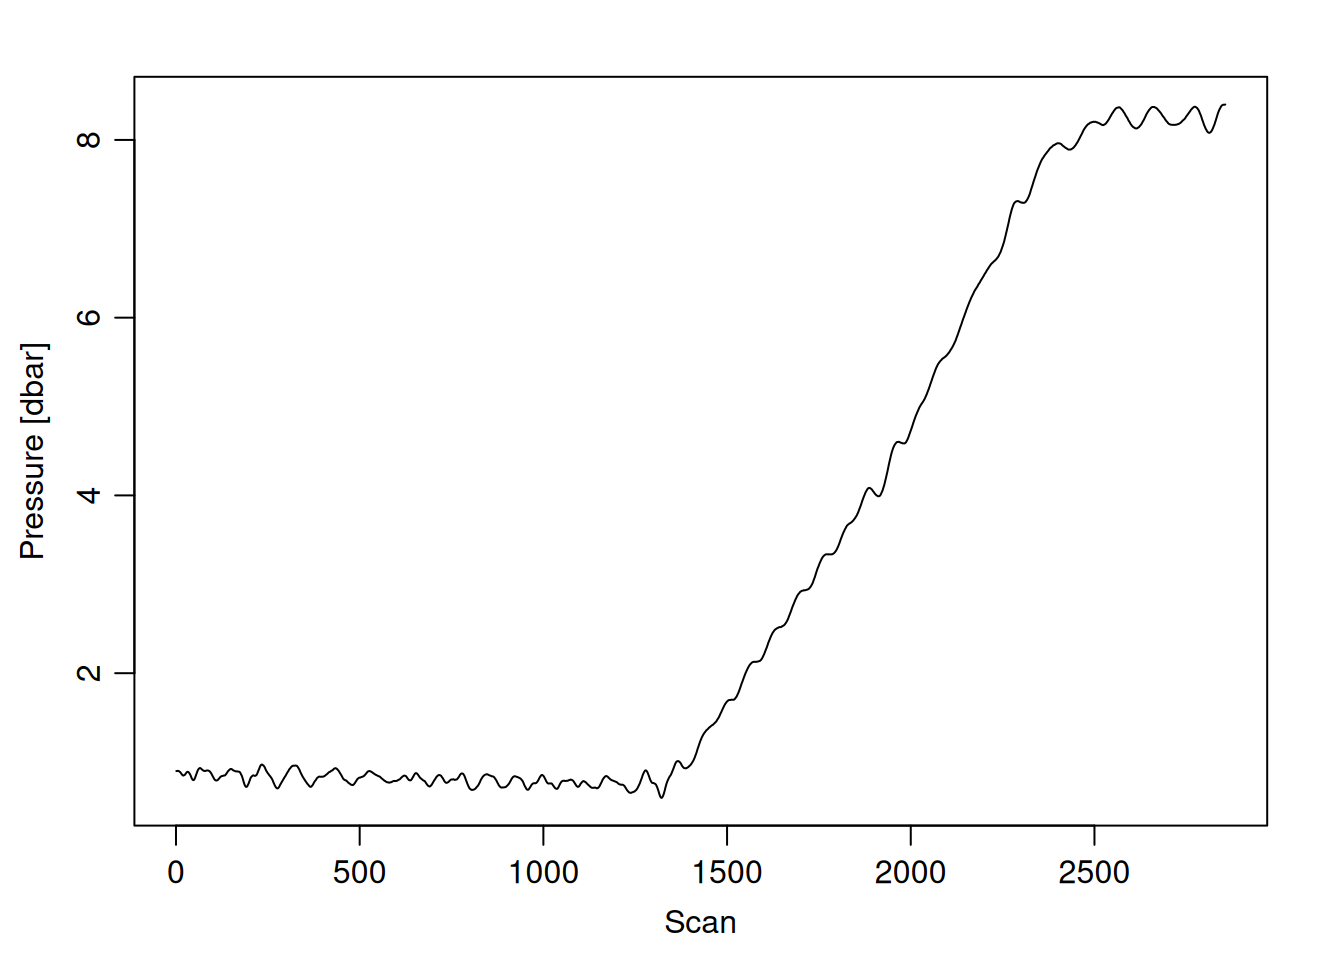
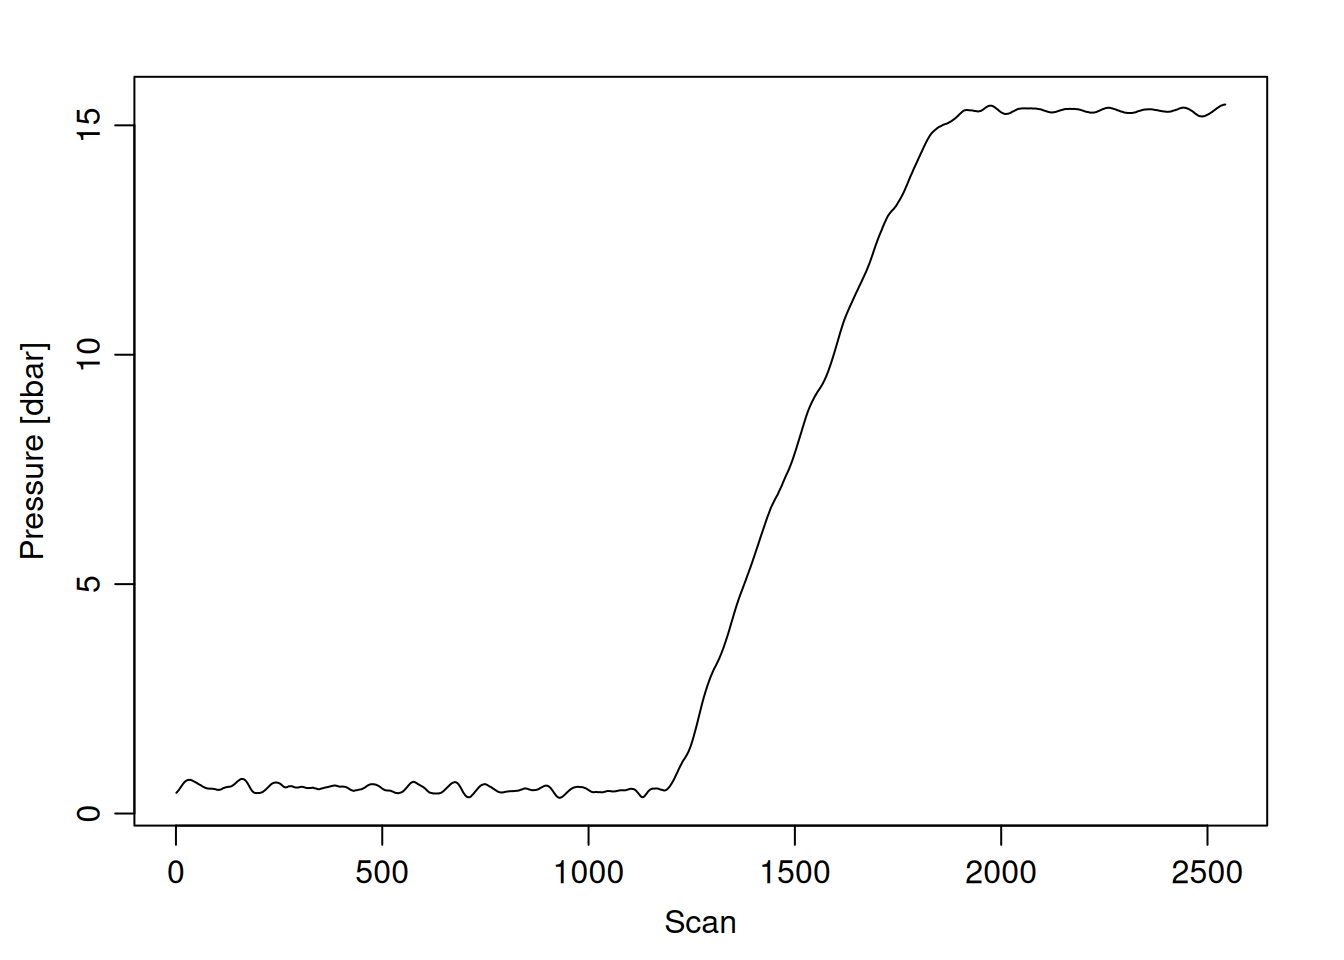
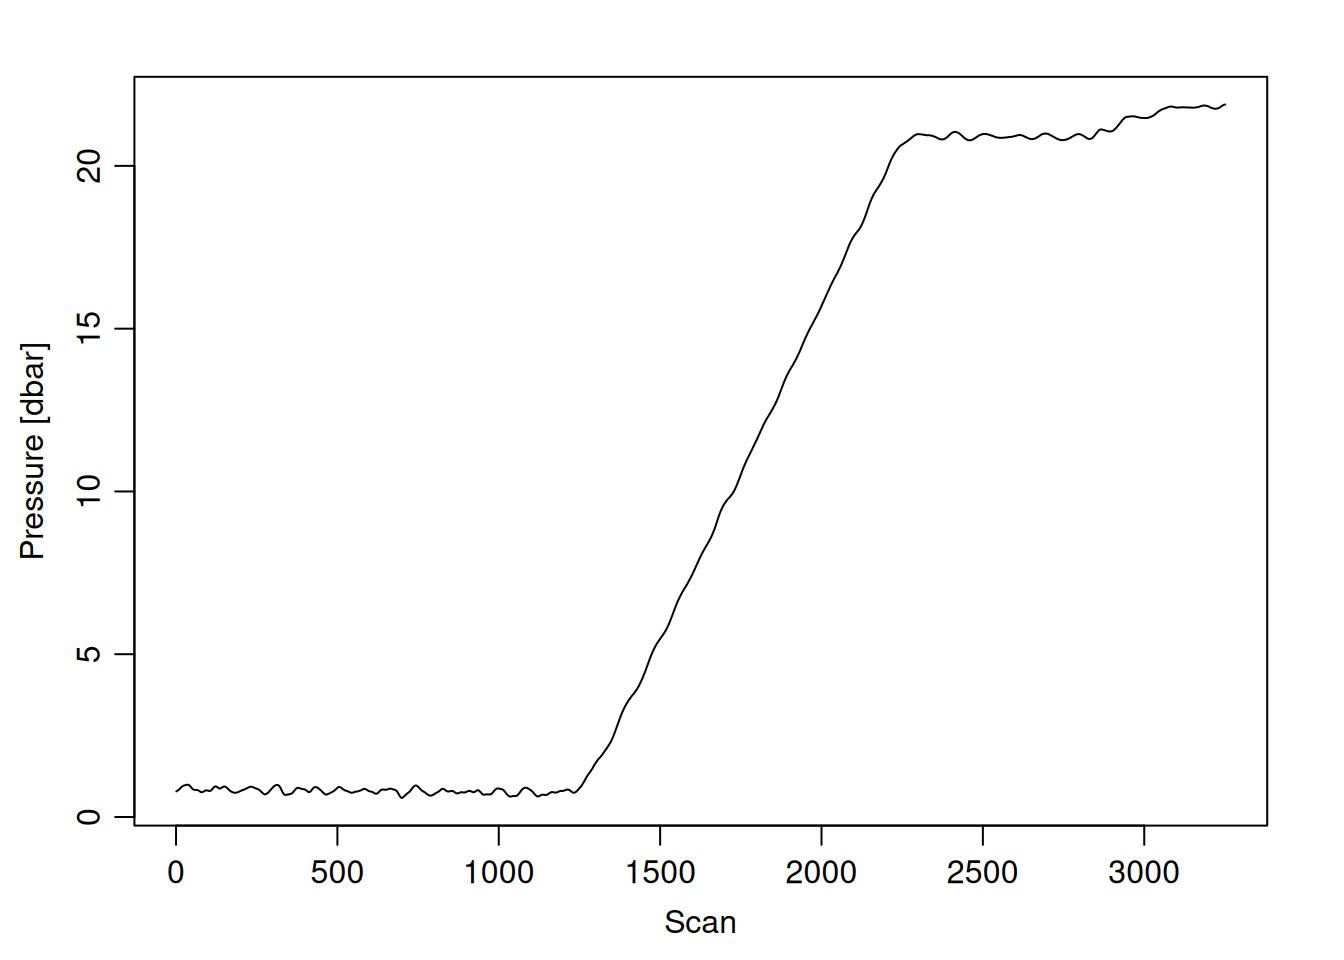
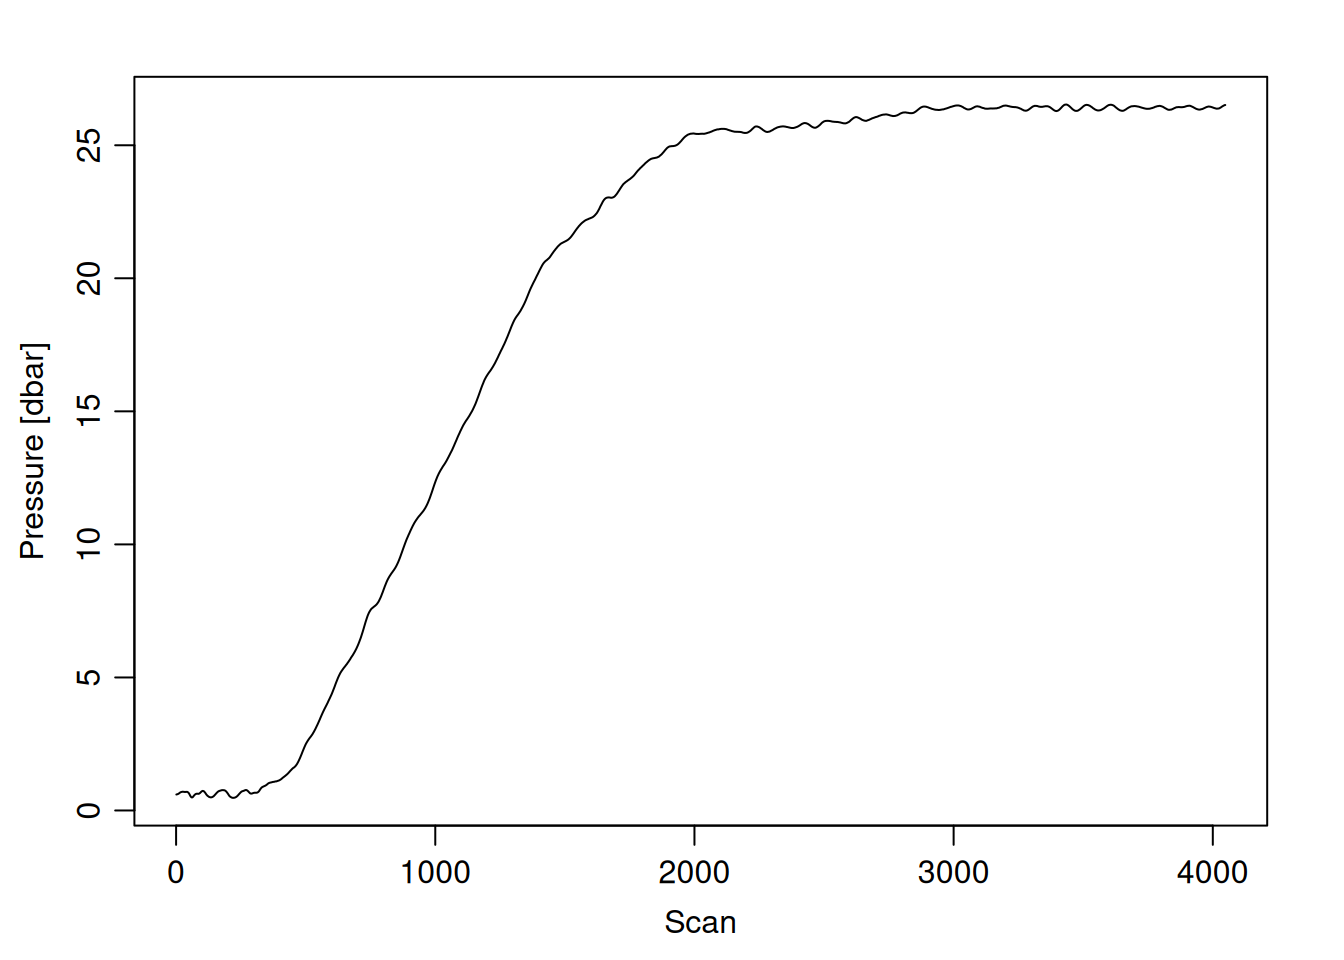
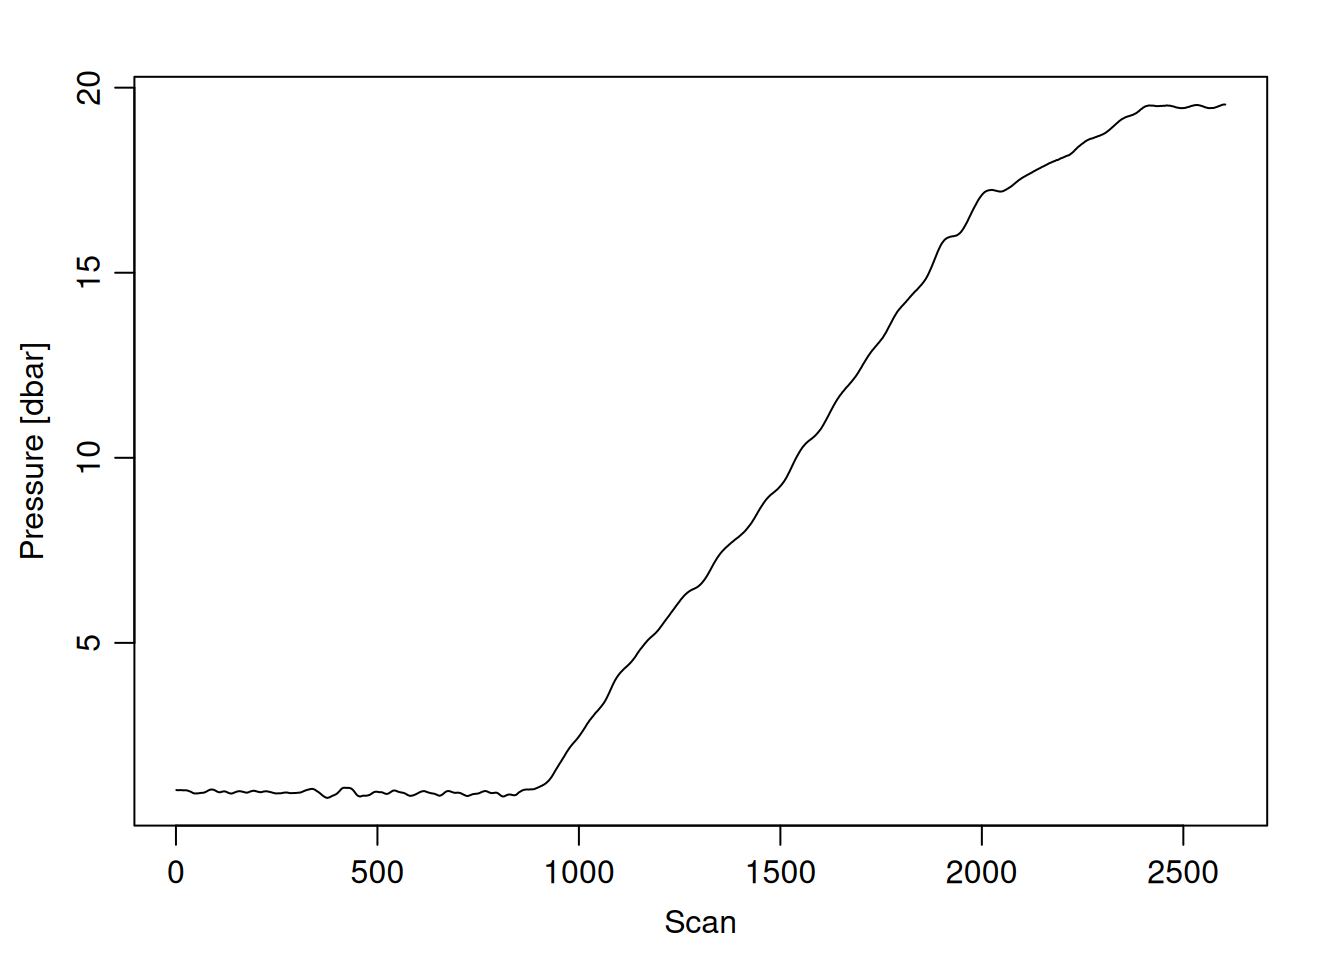
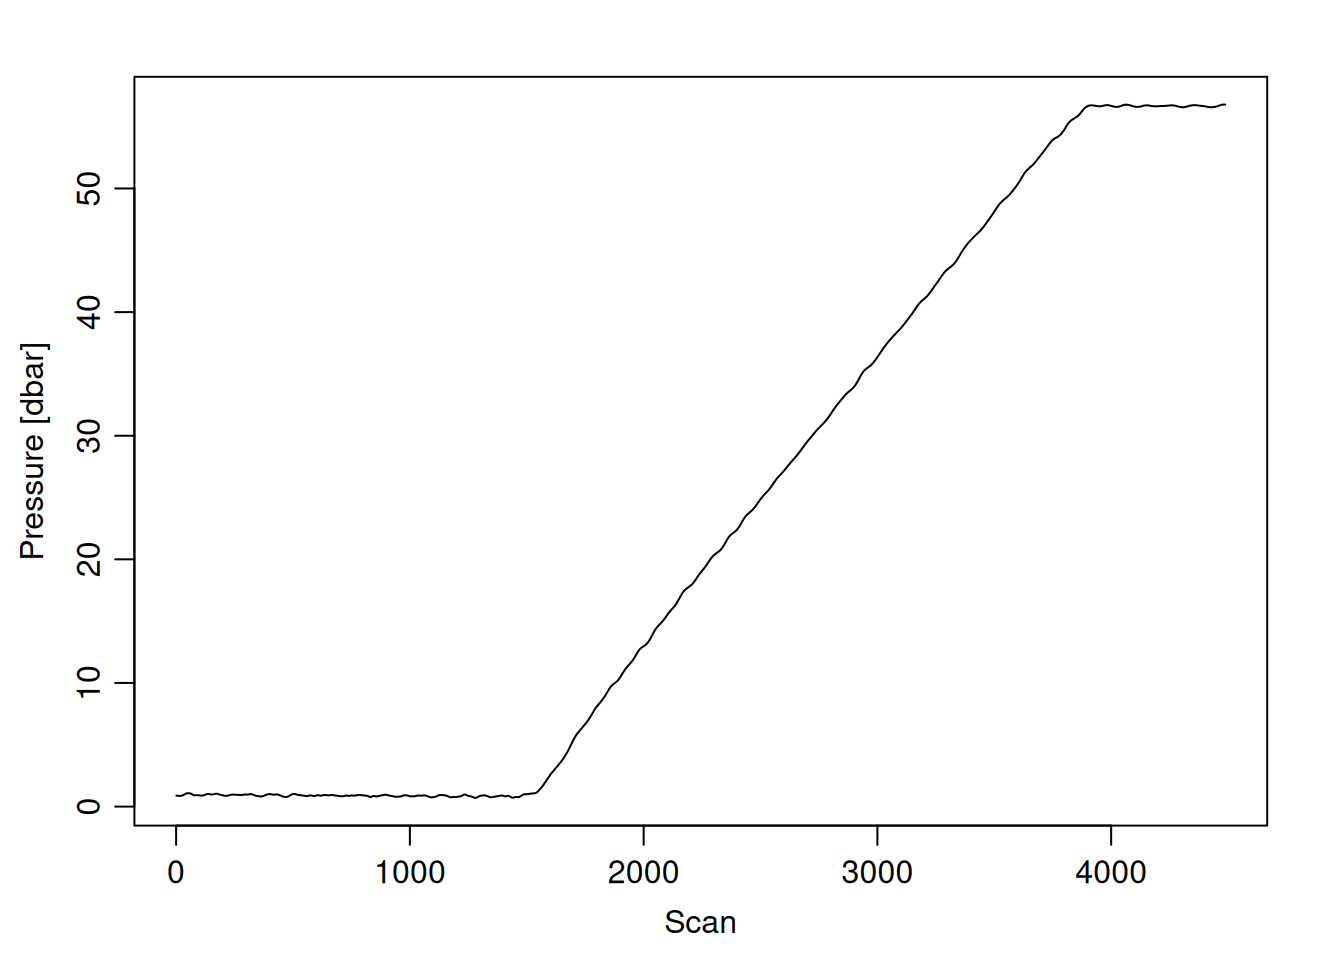
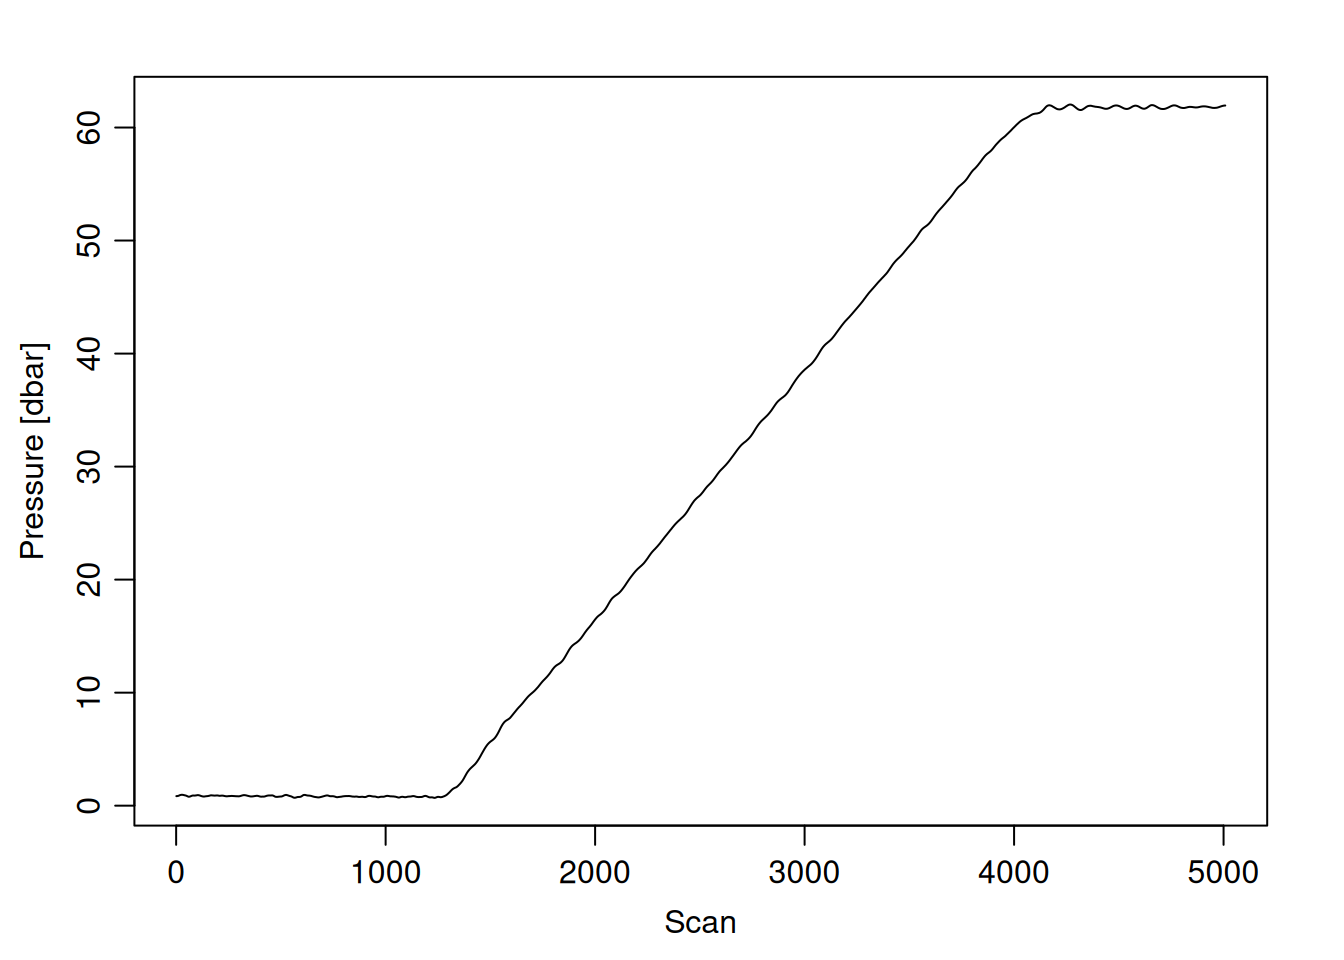
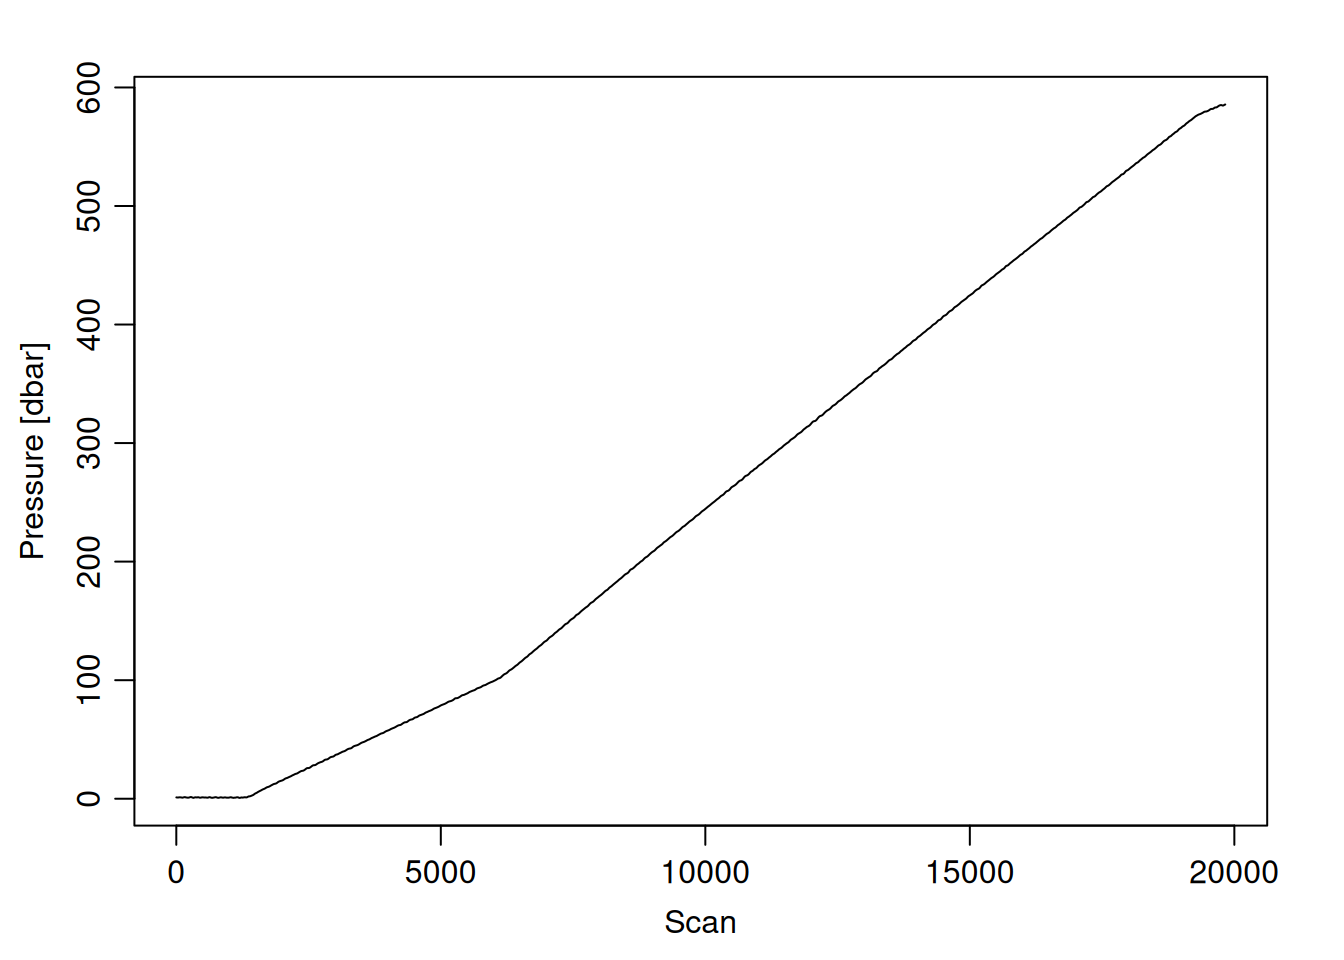
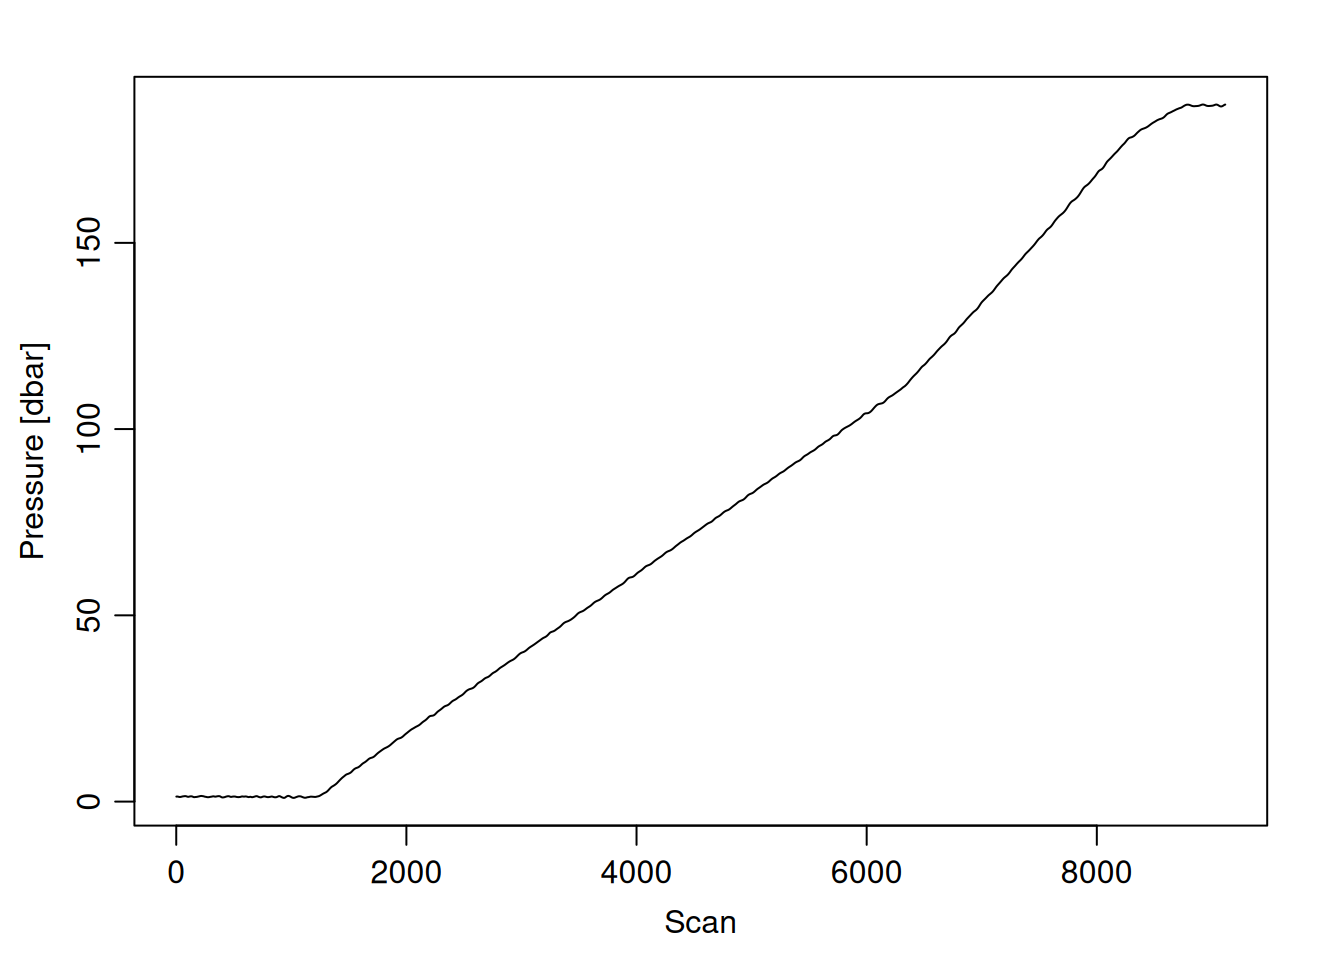
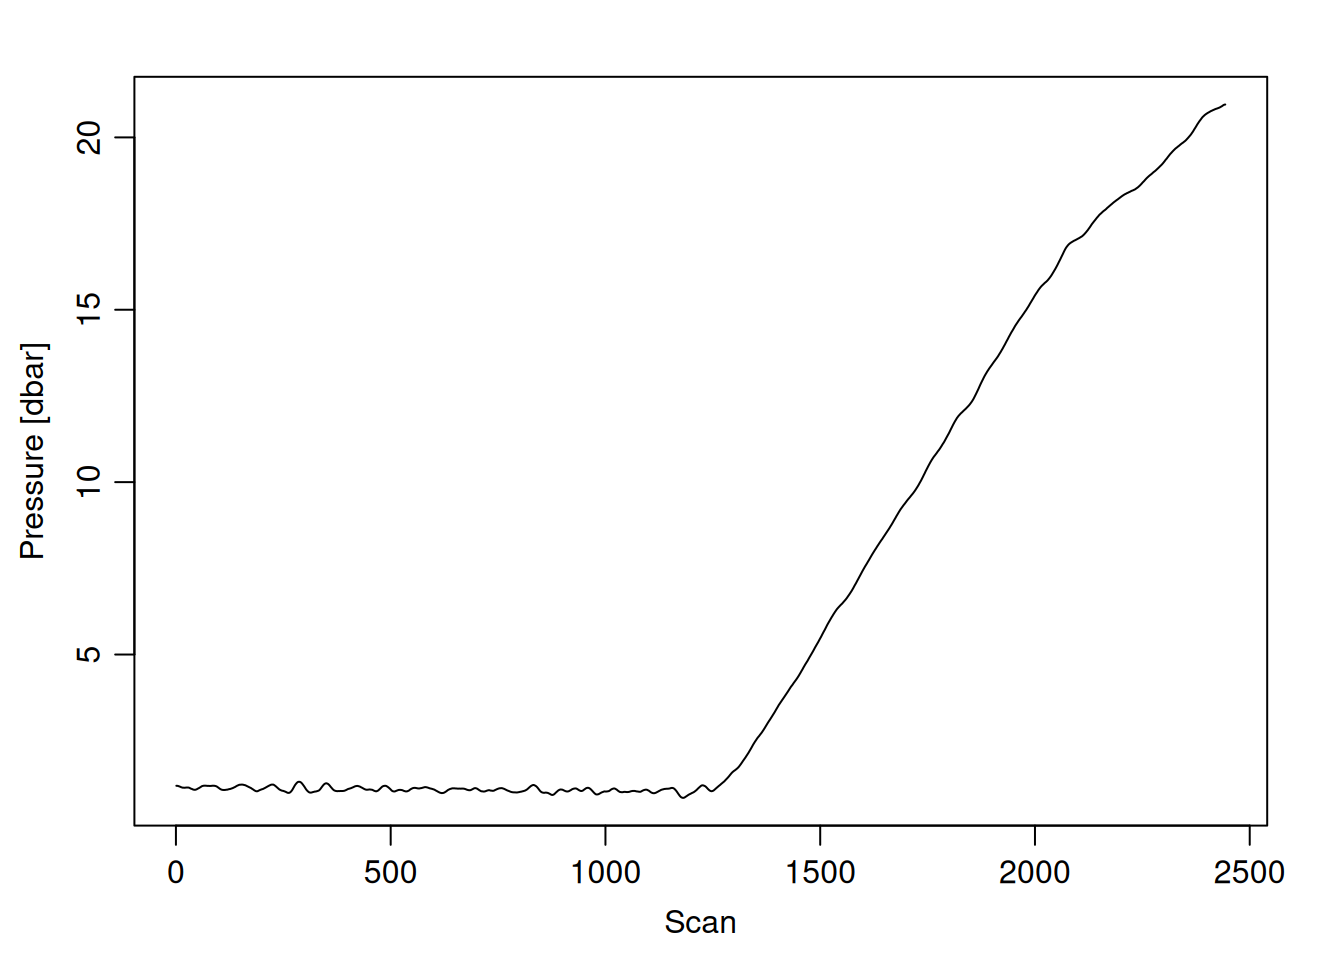
for (i inseq(ctd_FK)){ cast <- ctd_FK[[i]] # 1 is selecting only the first sublist# print(i)print(glue("=== station: {cast@metadata$station[1]}"))print(glue("# scans: {length(cast@data$scan)}"))plotScan(cast)}
=== station: 1
# scans: 2163
=== station: 10
# scans: 2343
=== station: 11
# scans: 2428
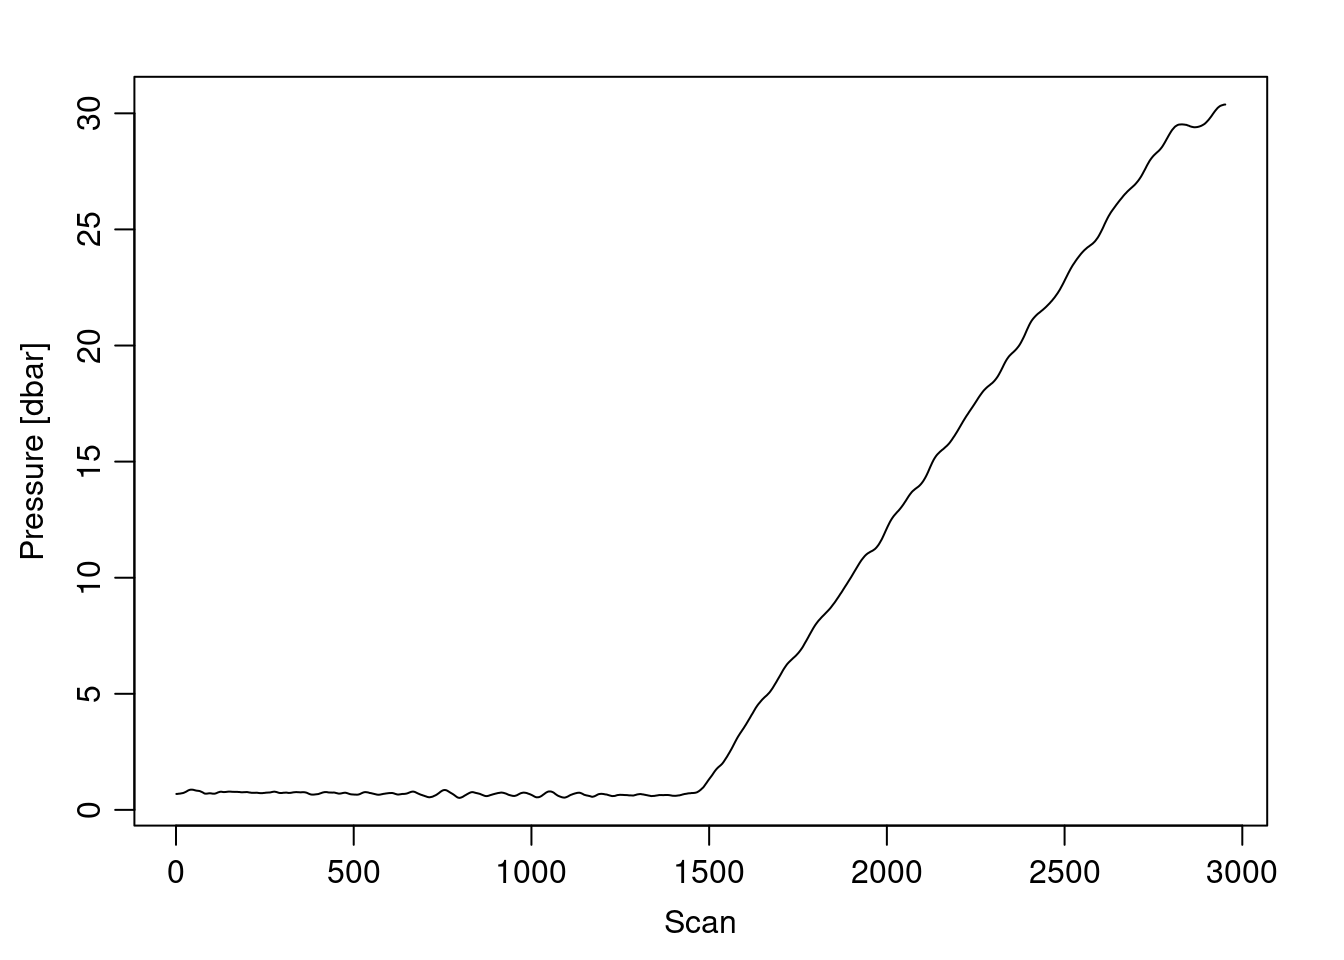
=== station: 12
# scans: 2949
=== station: 13
# scans: 2431
=== station: 14
# scans: 2227
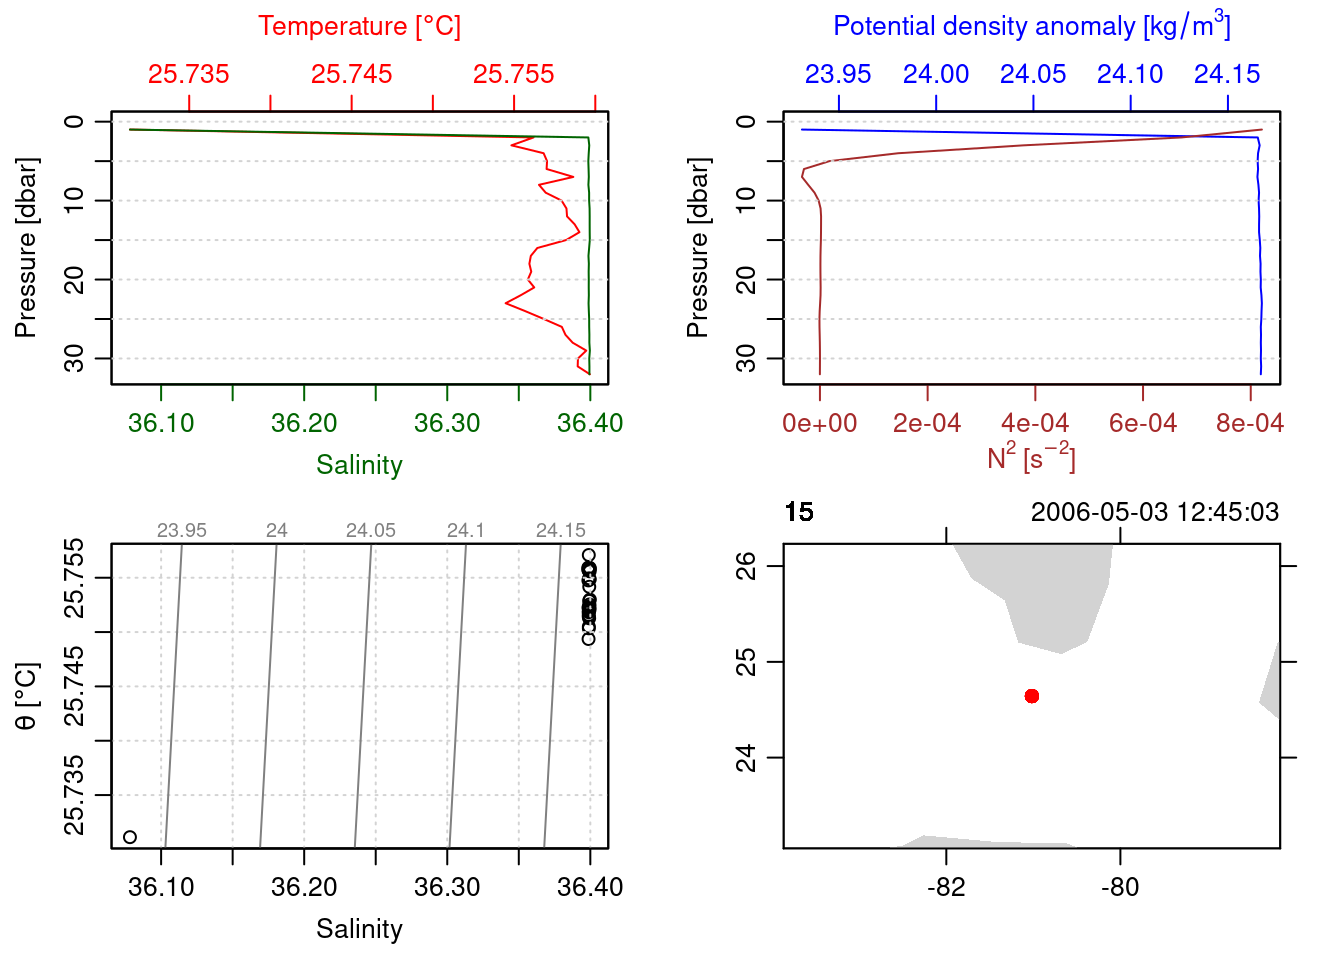
=== station: 15
# scans: 3413
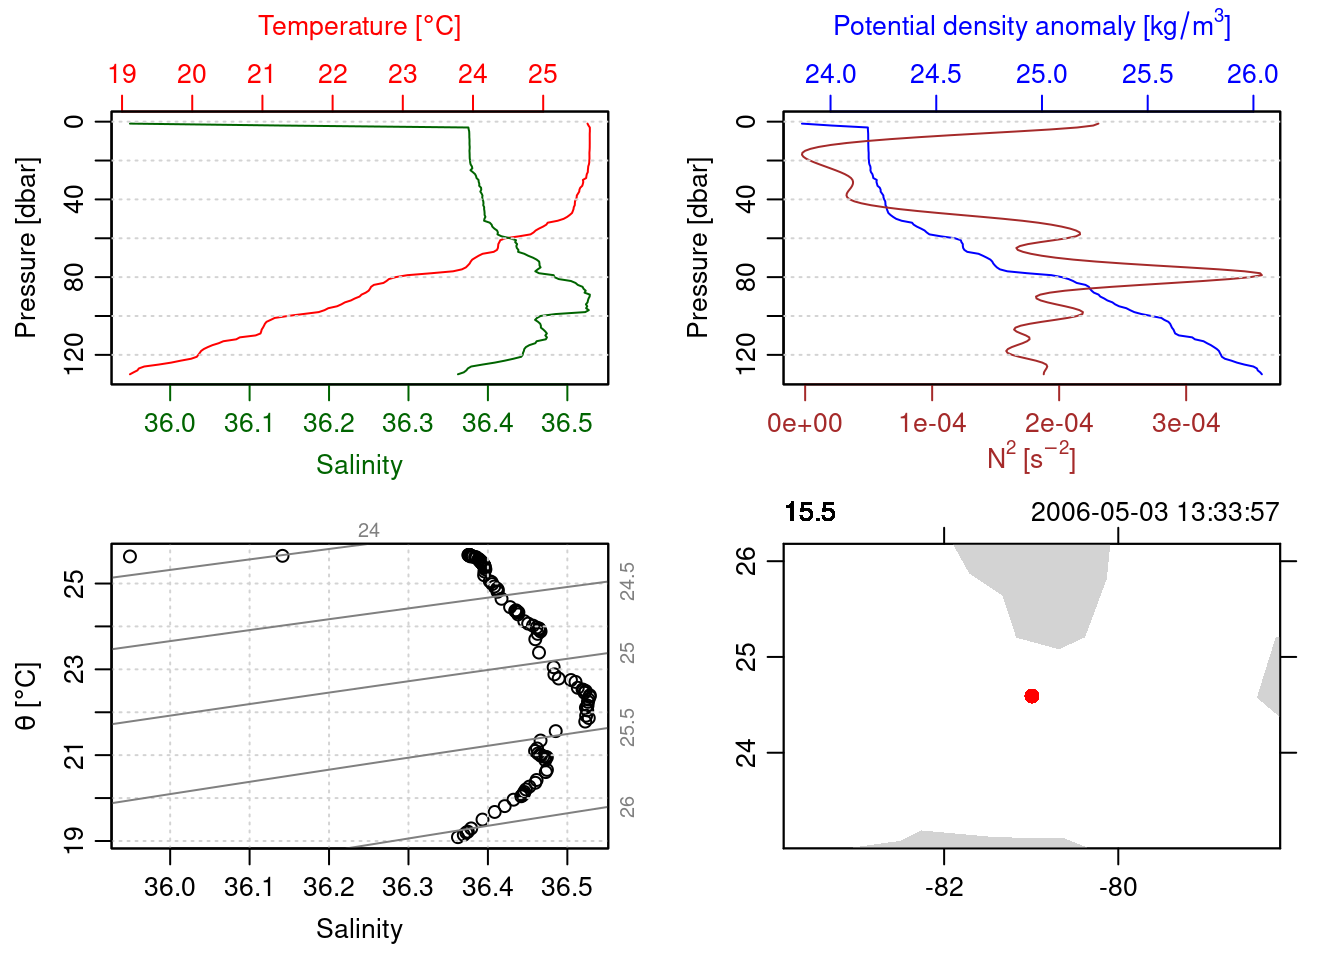
=== station: 15.5
# scans: 8025
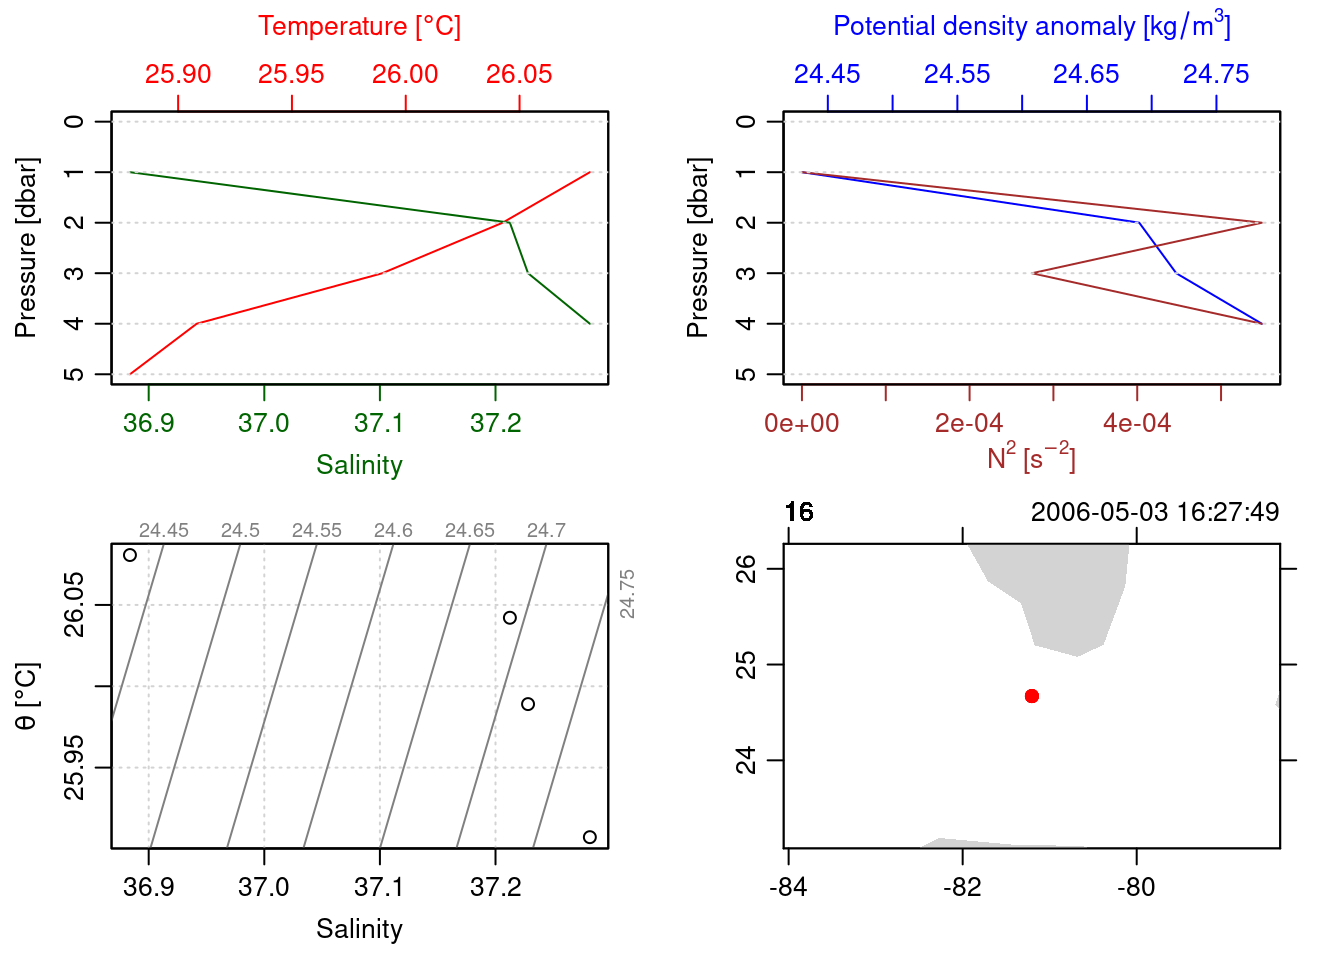
=== station: 16
# scans: 1565
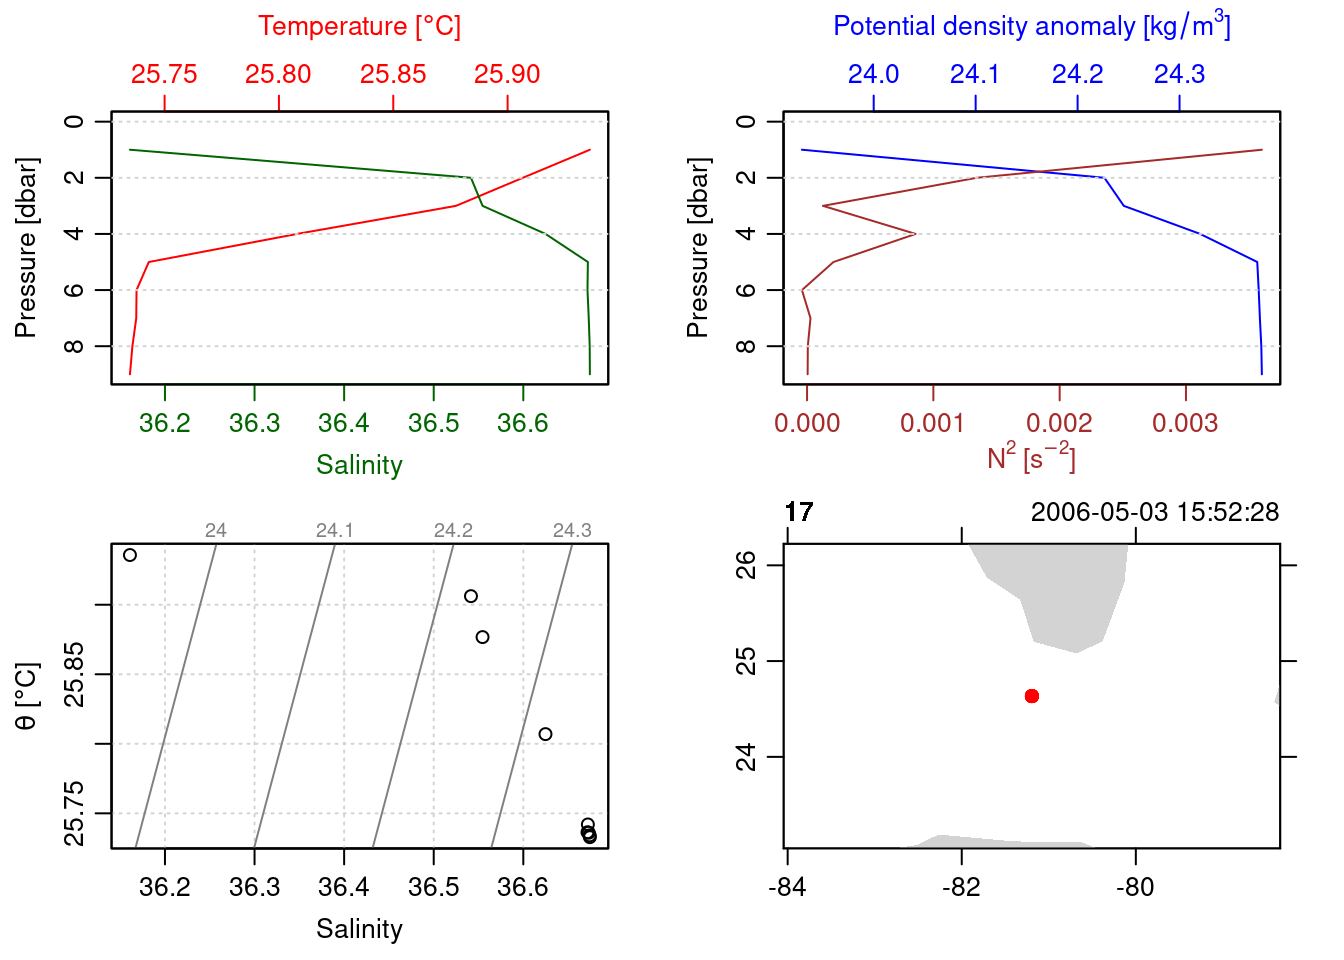
=== station: 17
# scans: 2178
=== station: 18
# scans: 2990
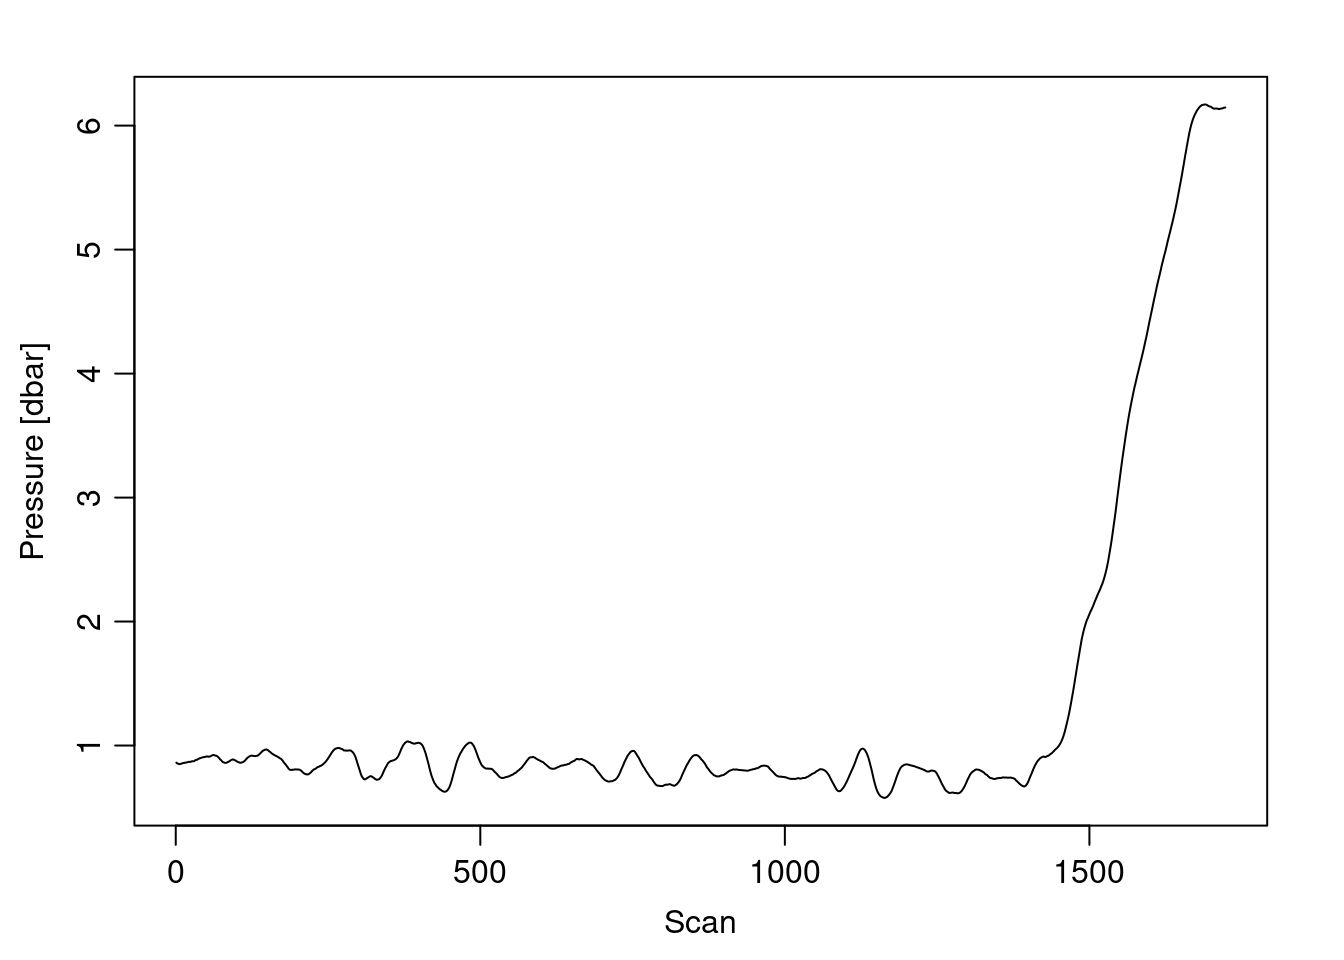
=== station: 19
# scans: 1720
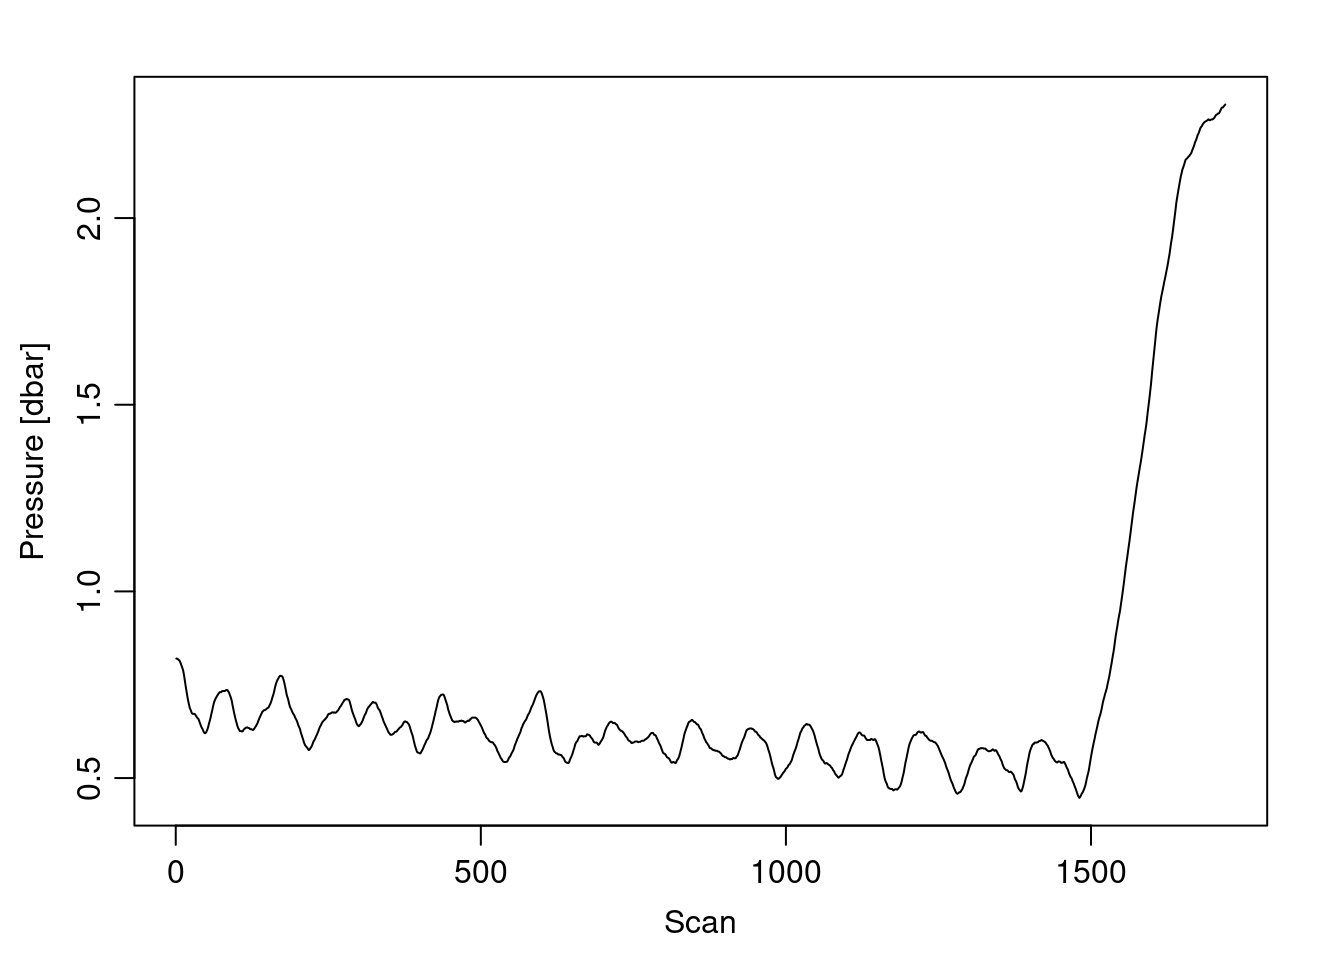
=== station: 2
# scans: 1723
=== station: 20
# scans: 2174
=== station: 21
# scans: 2952
=== station: 21.5
# scans: 8665
=== station: 22
# scans: 3052
=== station: 22.5
# scans: 7534
=== station: 23
# scans: 1885
=== station: 24
# scans: 2222
=== station: 25
# scans: 4505
=== station: 25.5
# scans: 13944
=== station: 26
# scans: 1902
=== station: 27
# scans: 2479
=== station: 28
# scans: 2904
=== station: 28.5
# scans: 3383
=== station: 29
# scans: 3671
=== station: 29.5
# scans: 3787
=== station: 3
# scans: 4536
=== station: 30
# scans: 3288
=== station: 30.5
# scans: 2764
=== station: 31
# scans: 2428
=== station: 32
# scans: 1713
=== station: 33
# scans: 2750
=== station: 34
# scans: 1677
=== station: 39
# scans: 2079
=== station: 4
# scans: 1324
=== station: 40
# scans: 2081
=== station: 41
# scans: 2931
=== station: 42
# scans: 638
=== station: 45
# scans: 2443
=== station: 46
# scans: 2665
=== station: 47
# scans: 2516
=== station: 48
# scans: 1949
=== station: 49
# scans: 1632
=== station: 5
# scans: 1867
=== station: 5.5
# scans: 1860
=== station: 50
# scans: 2314
=== station: 51
# scans: 1563
=== station: 52
# scans: 2683
=== station: 53
# scans: 29
=== station: 54
# scans: 1257
=== station: 55
# scans: 1122
=== station: 56
# scans: 1906
=== station: 57
# scans: 2307
=== station: 6
# scans: 2189
=== station: 6.5
# scans: 7225
=== station: 60
# scans: 1629
=== station: 61
# scans: 1538
=== station: 62
# scans: 1782
=== station: 63
# scans: 1887
=== station: 64
# scans: 875
=== station: 65
# scans: 1460
=== station: 66
# scans: 1556
=== station: 67
# scans: 1801
=== station: 68
# scans: 1843
=== station: 69
# scans: 1675
=== station: 7
# scans: 1776
=== station: 70
# scans: 2274
=== station: 71
# scans: 2083
=== station: 8
# scans: 2272
=== station: 9
# scans: 3483
=== station: 9.5
# scans: 7644
=== station: CAL1
# scans: 2611
=== station: CAL2
# scans: 1364
=== station: CAL3
# scans: 2714
=== station: CAL4
# scans: 2748
=== station: CAL5
# scans: 3267
=== station: CH1
# scans: 2871
=== station: CH2
# scans: 2856
=== station: CH3
# scans: 2543
=== station: CH4
# scans: 3251
=== station: CH5
# scans: 4048
=== station: DT01
# scans: 3024
=== station: DT02
# scans: 2604
=== station: DT03
# scans: 4488
=== station: DT04
# scans: 5008
=== station: DT05
# scans: 4623
=== station: DT06
# scans: 8535
=== station: DT07
# scans: 19828
=== station: DT08
# scans: 9116
=== station: DT09
# scans: 4978
=== station: DT10
# scans: 2648
=== station: DT11
# scans: 2443
=== station: DTXX
# scans: 522
plotting each cast in the first list
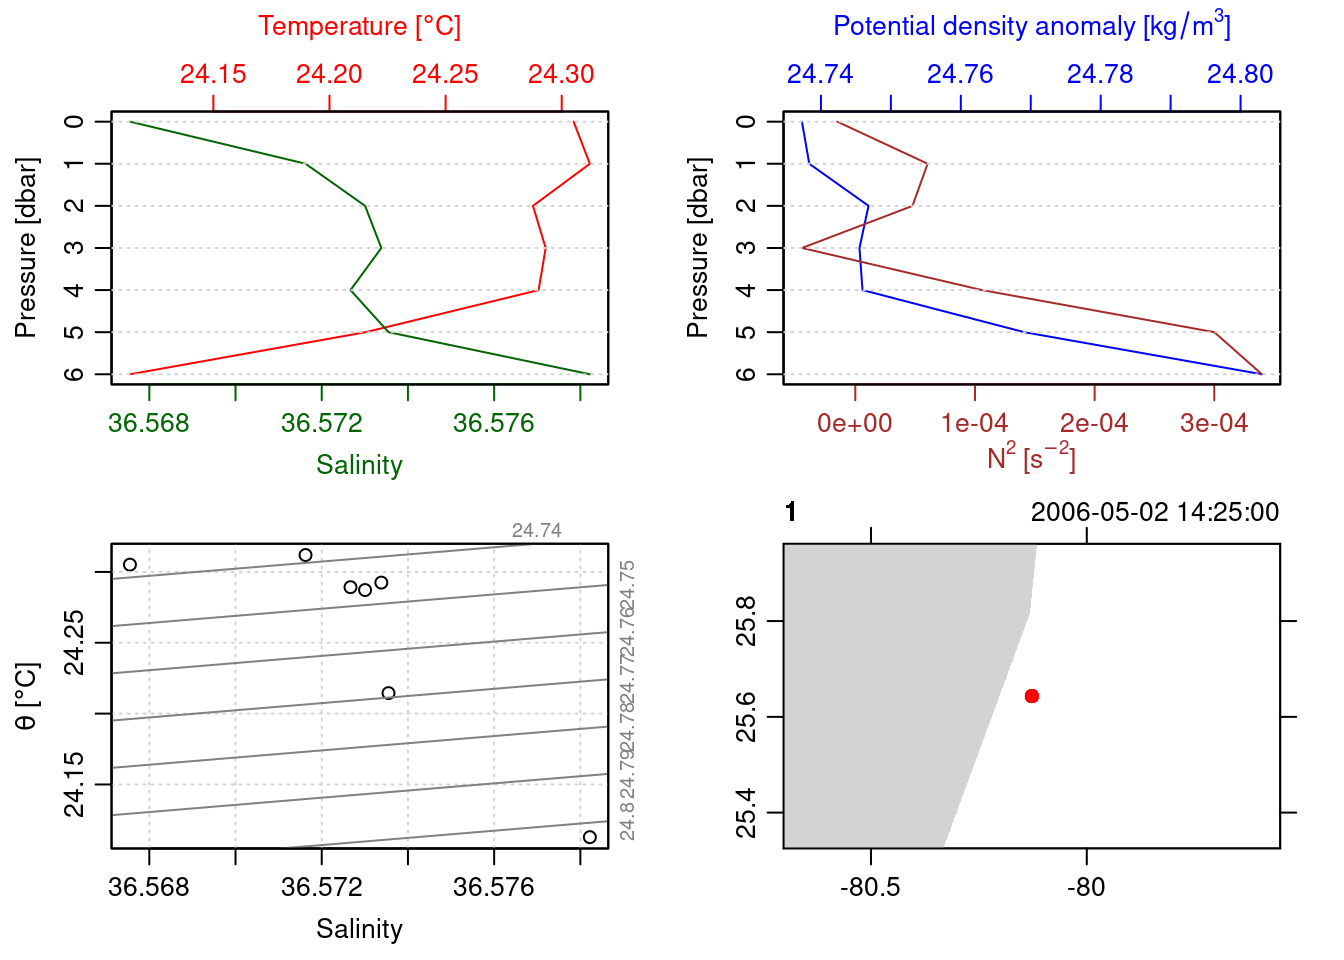
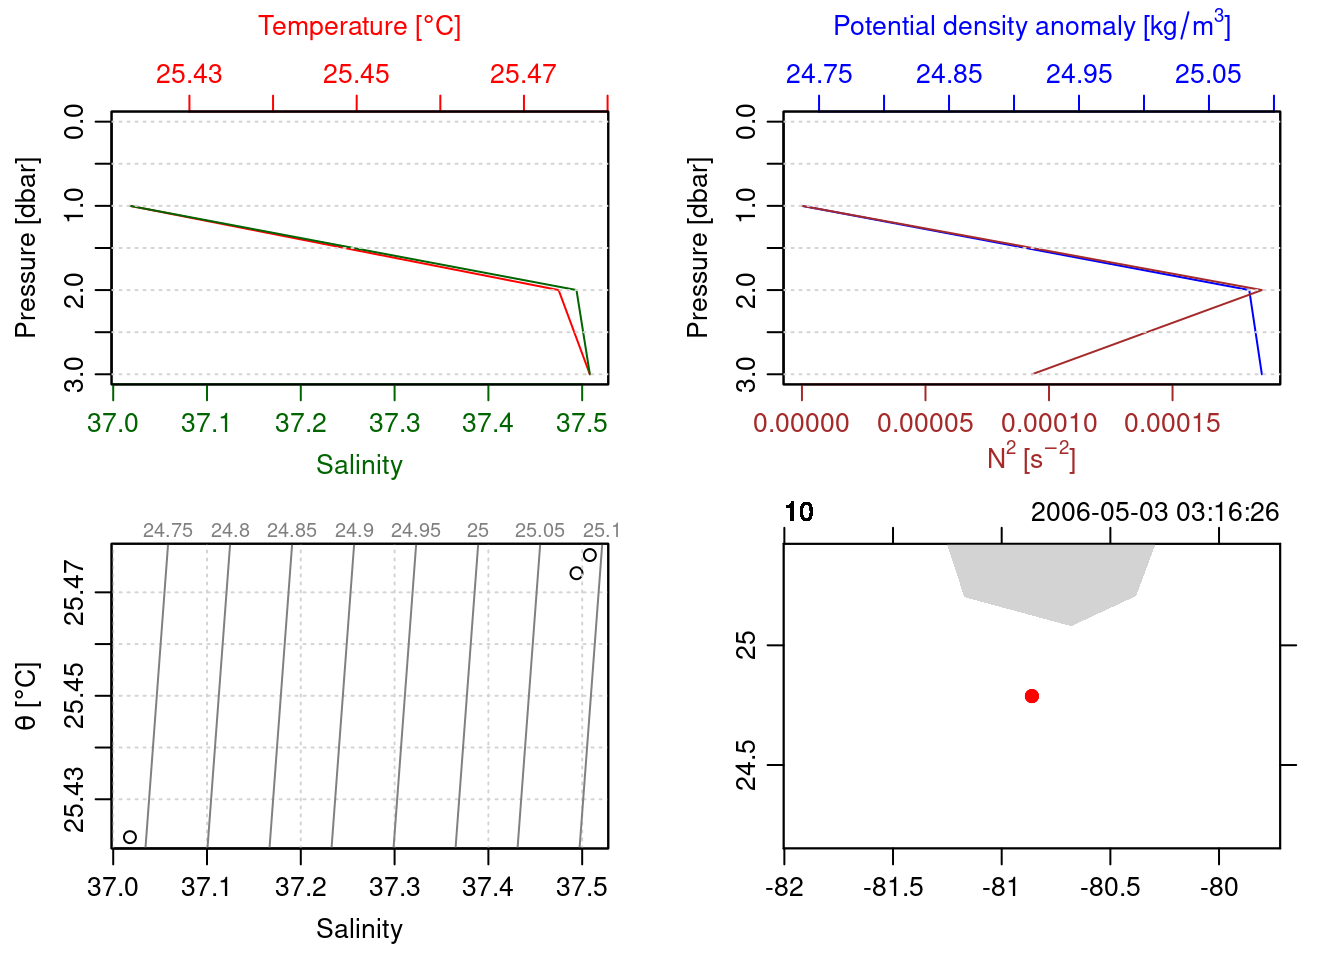
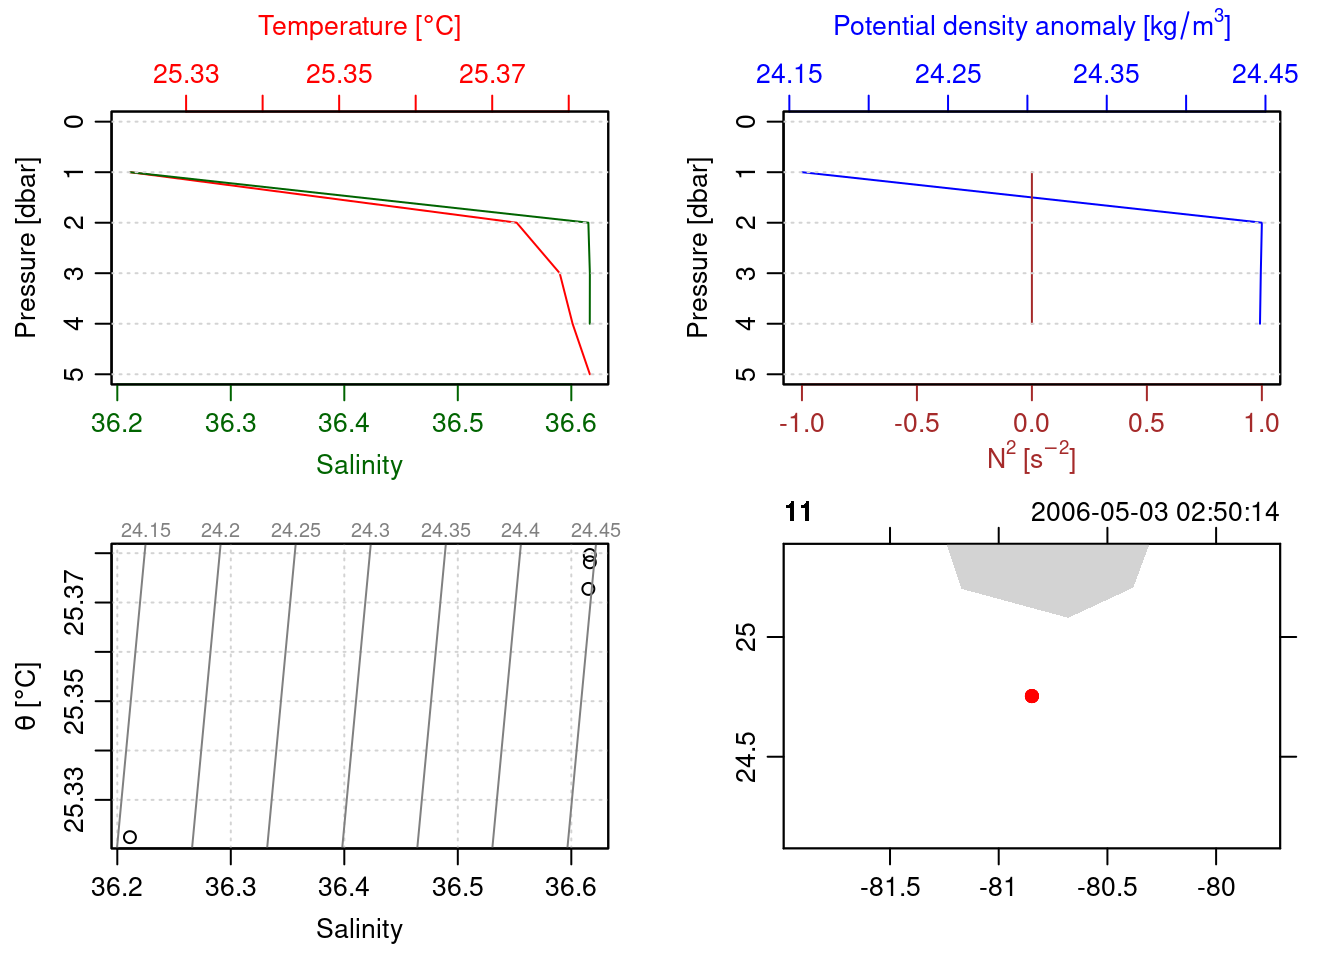
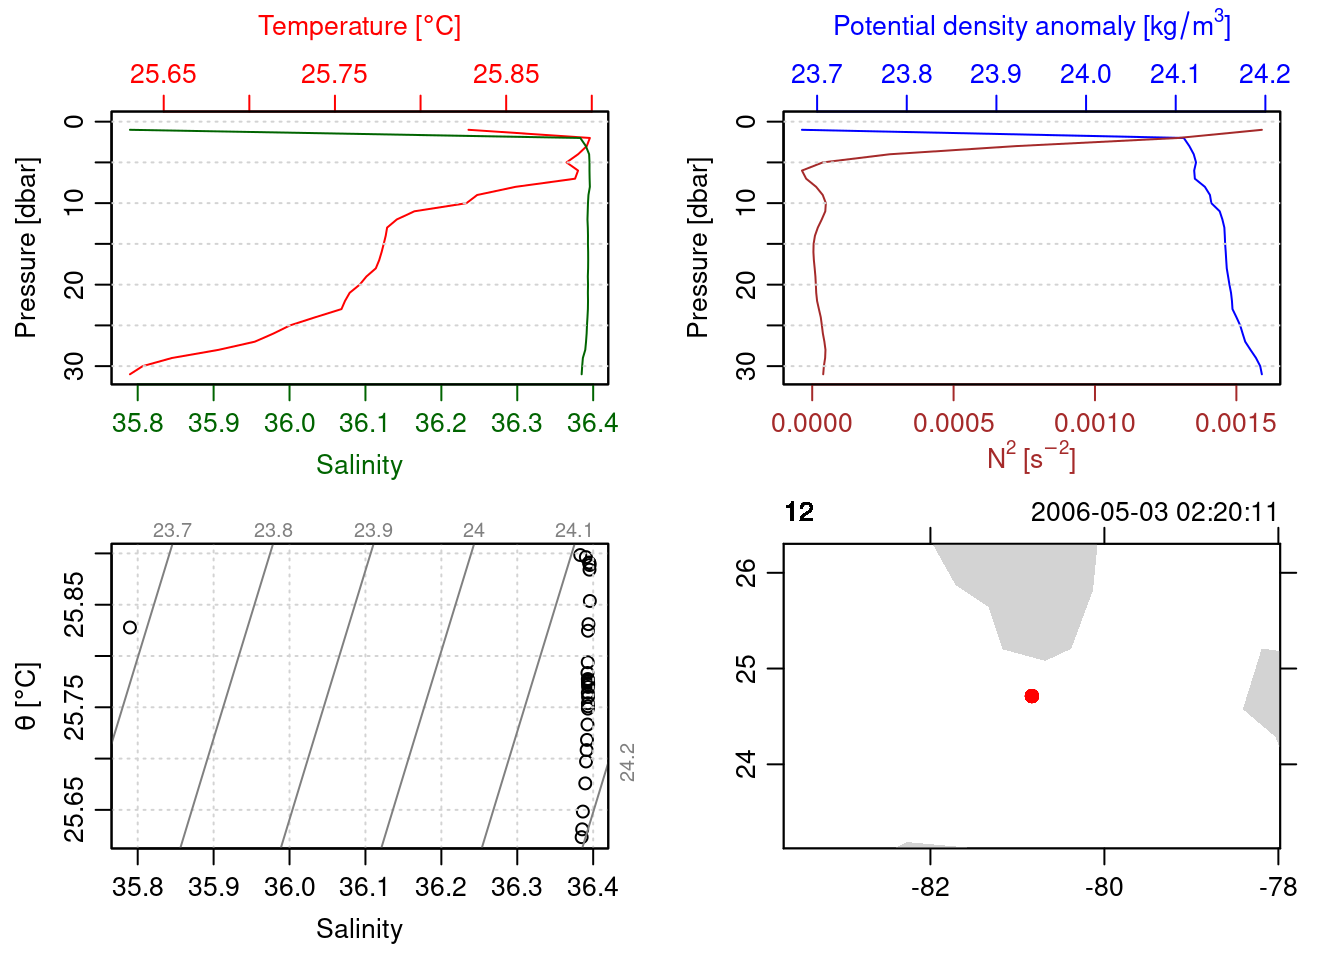
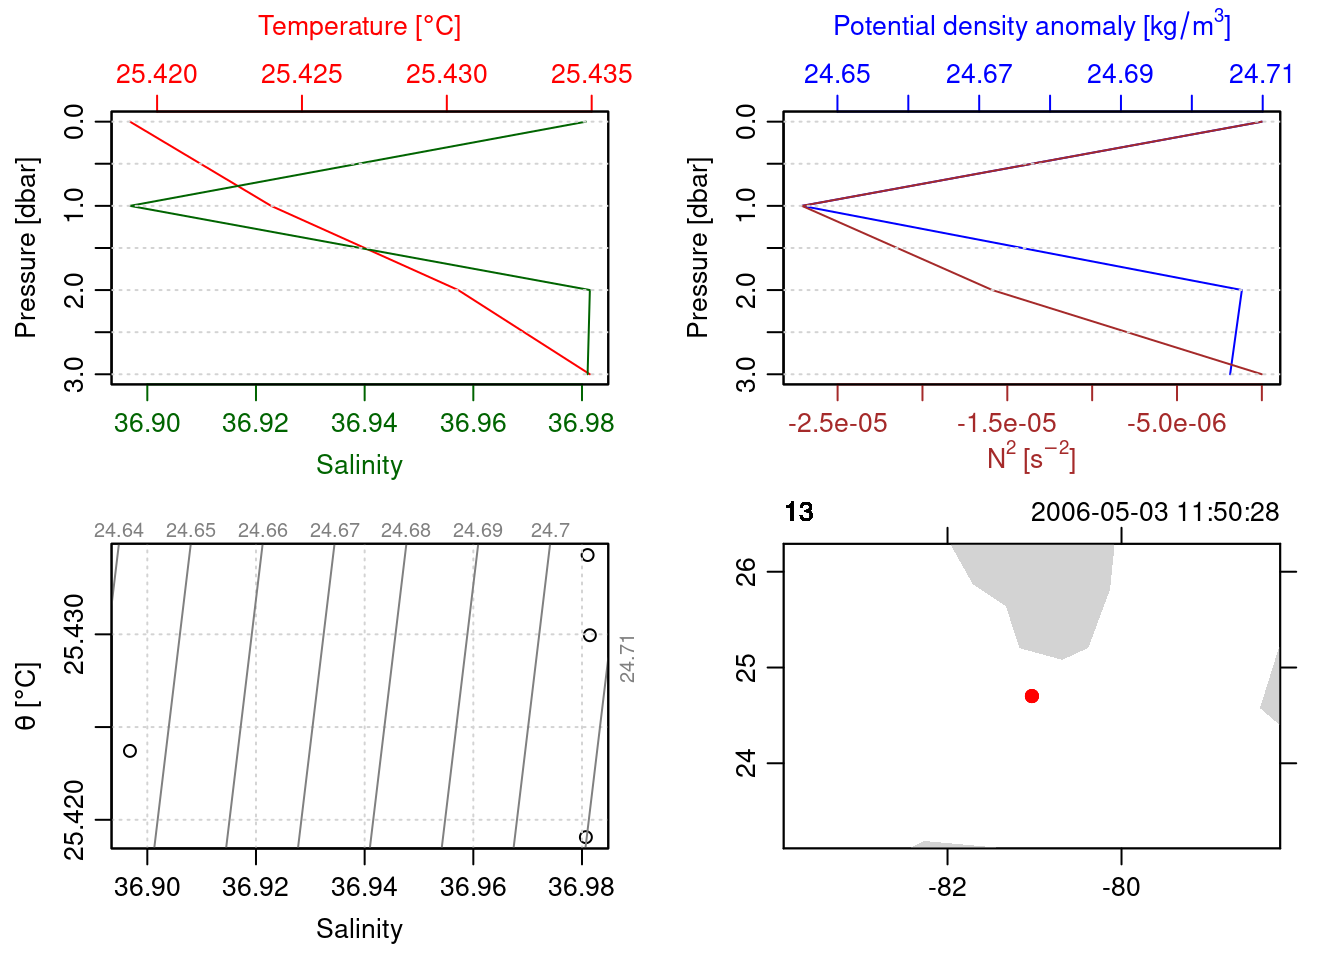
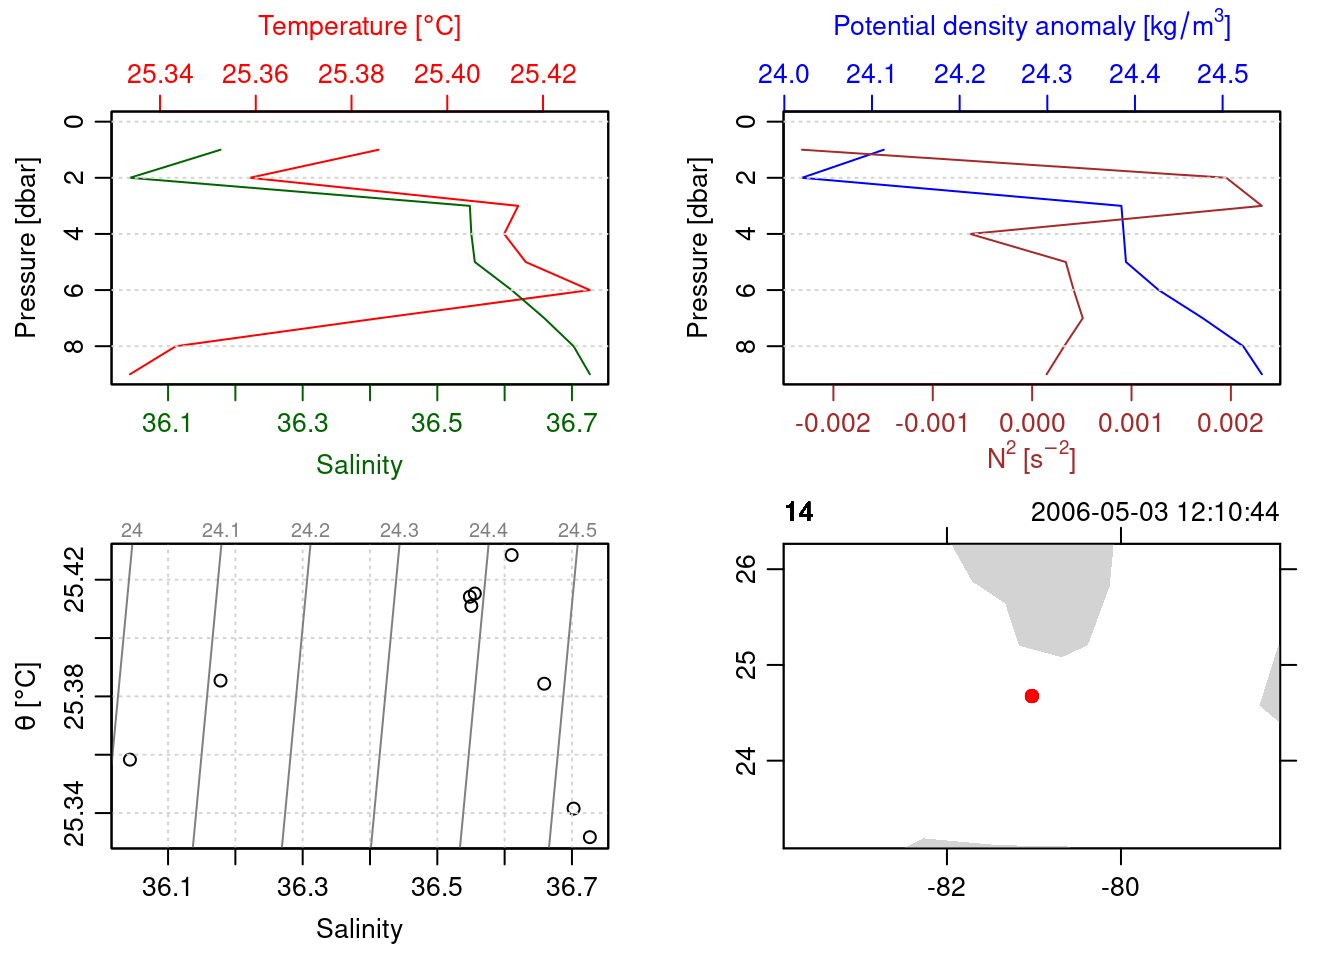
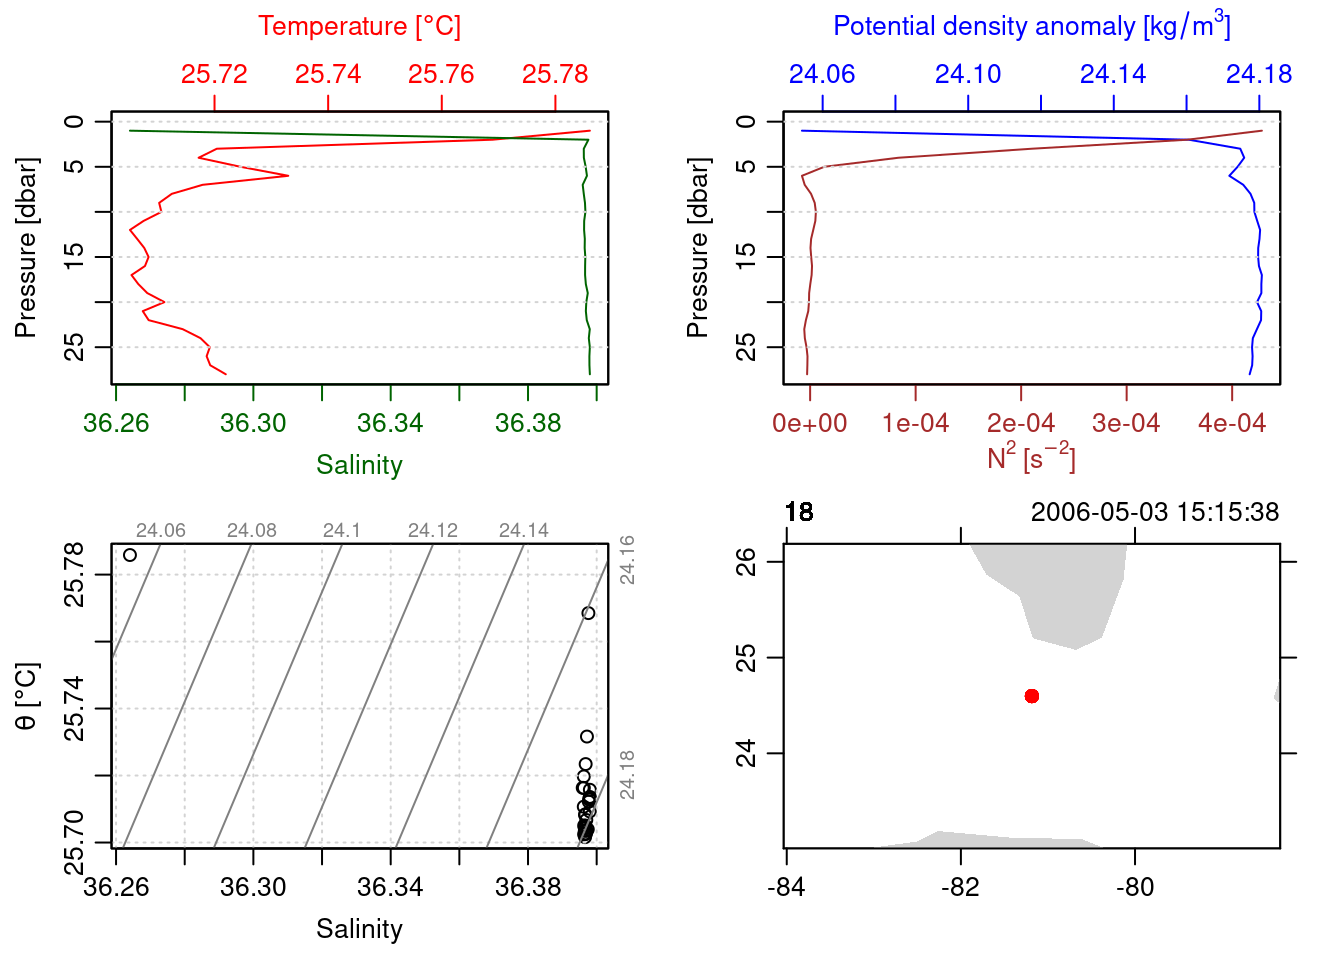
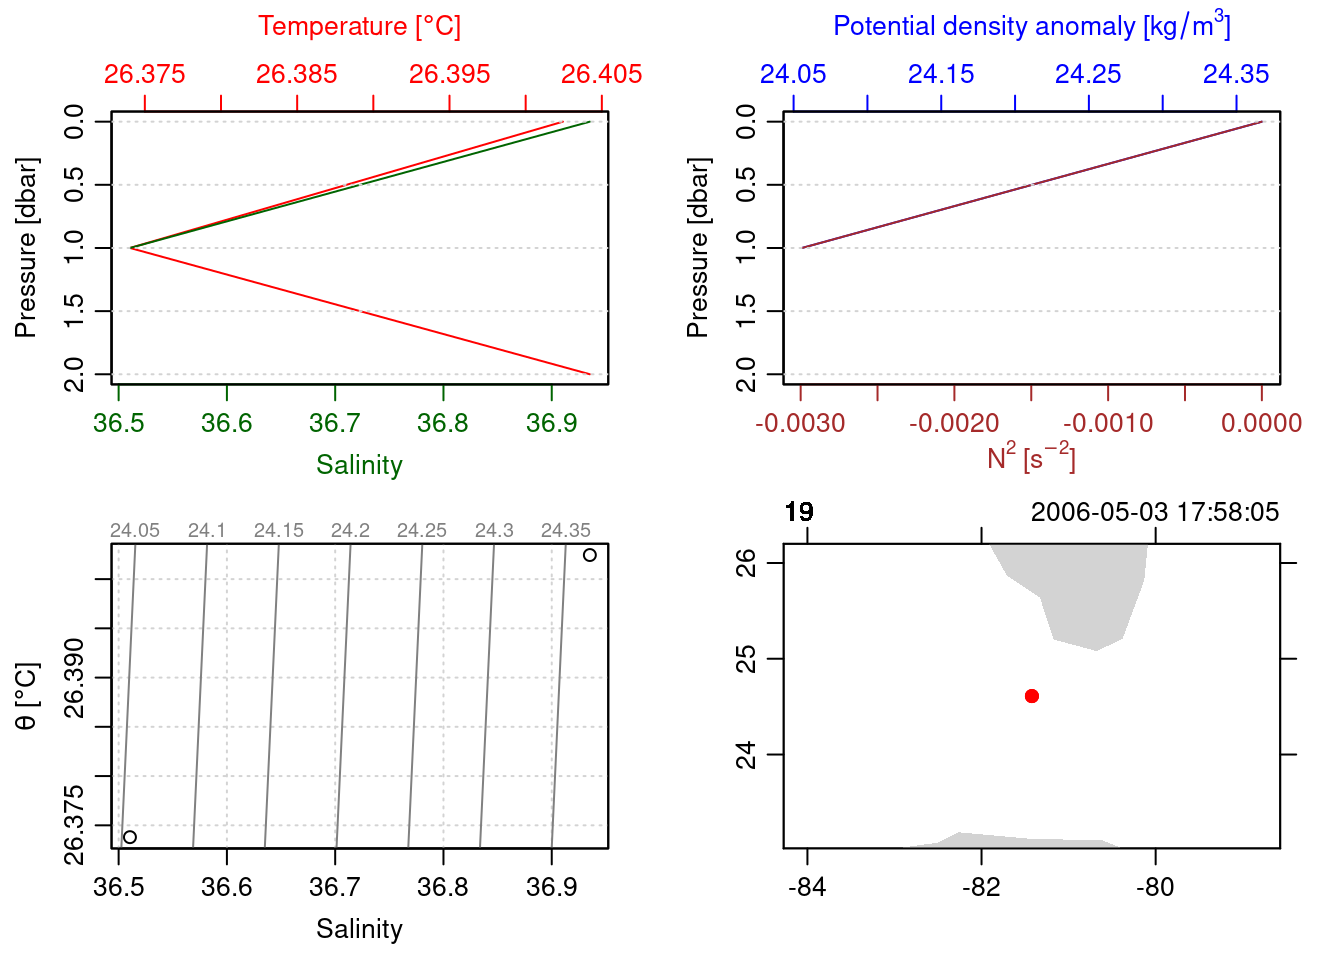
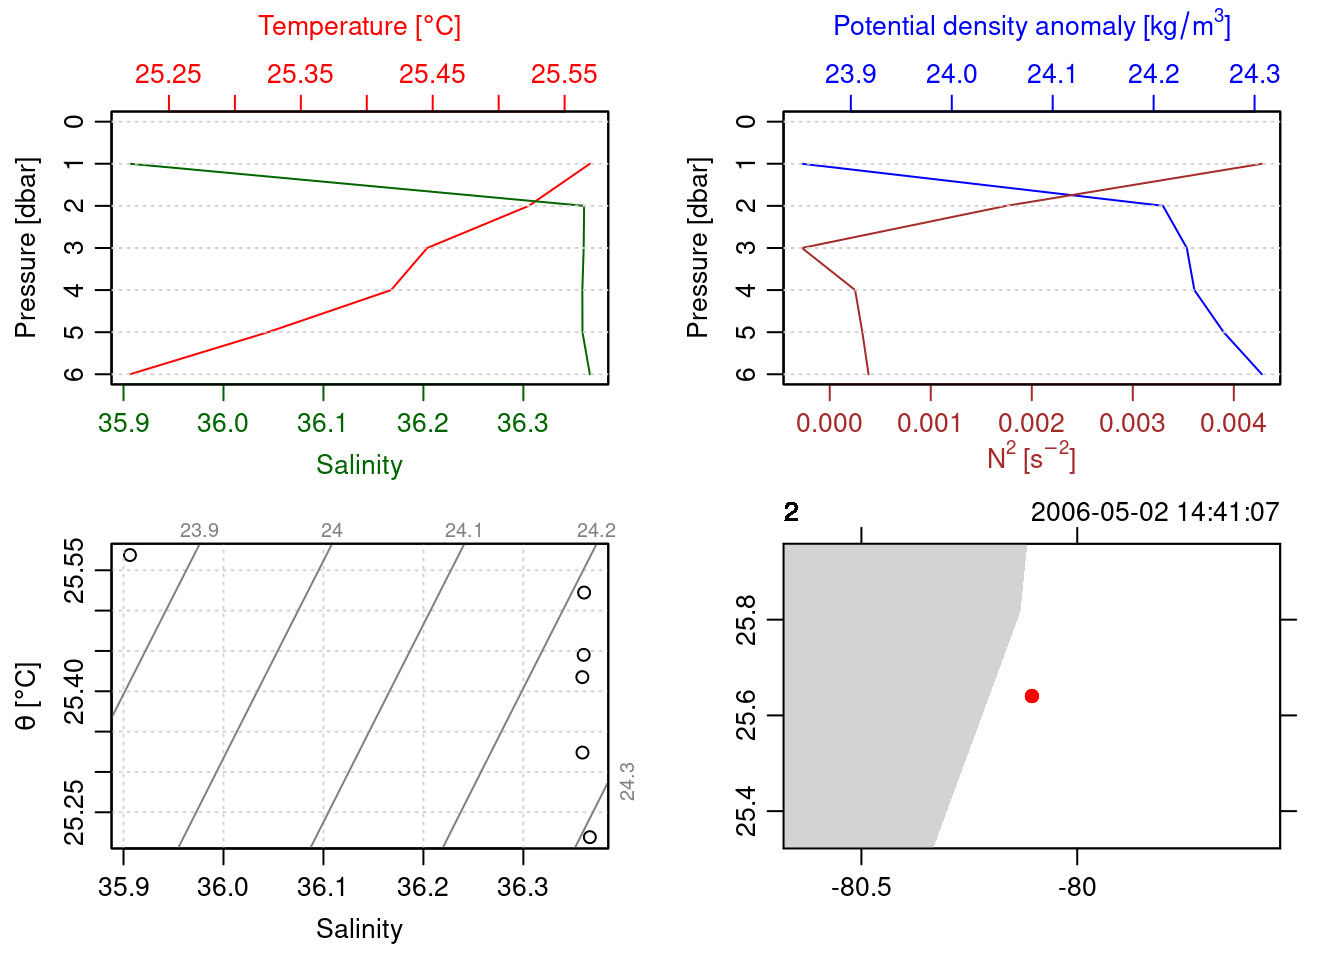
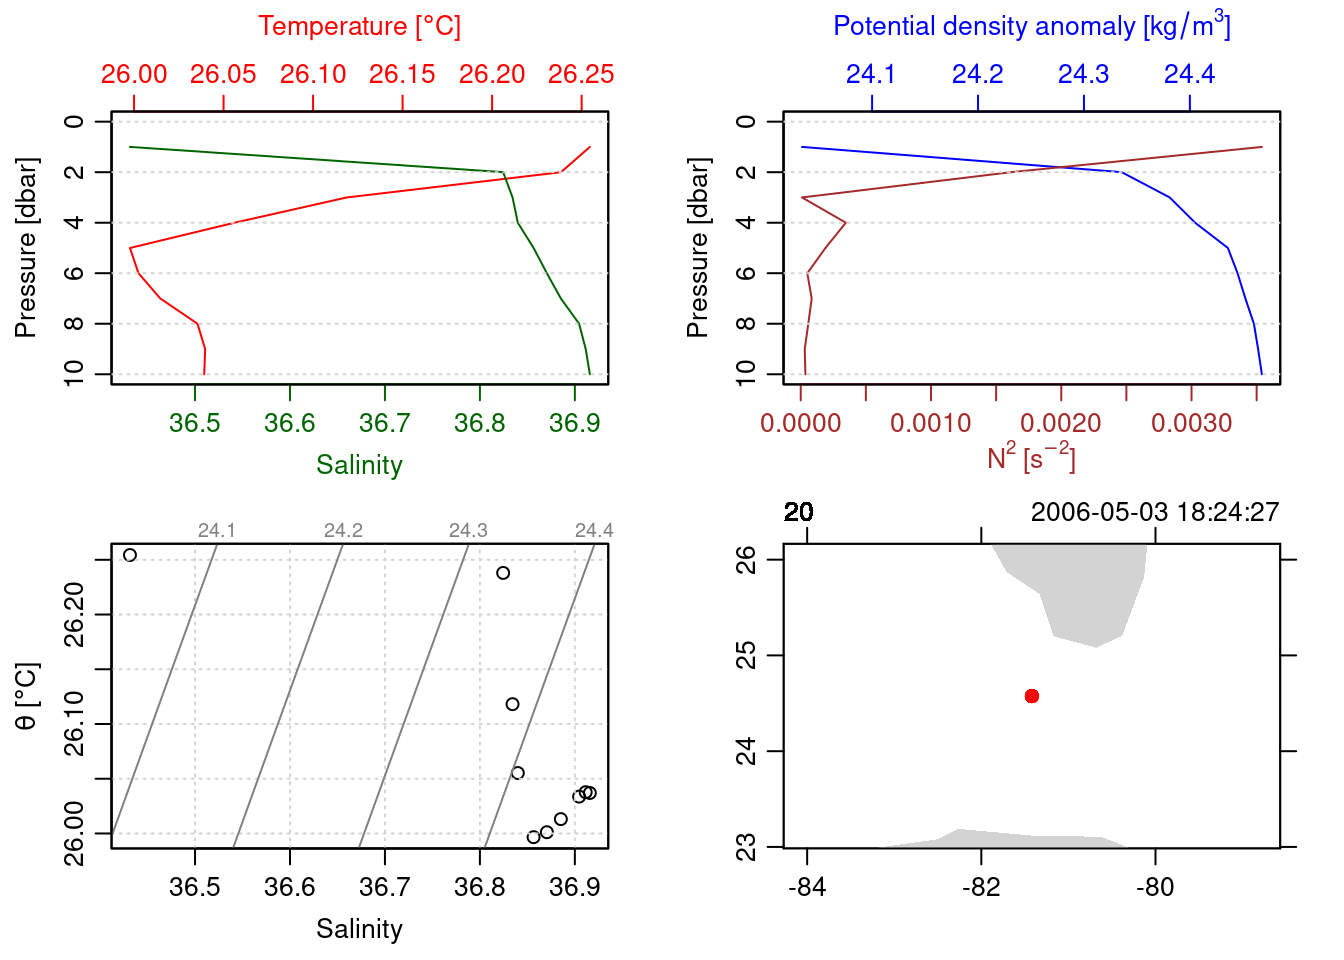
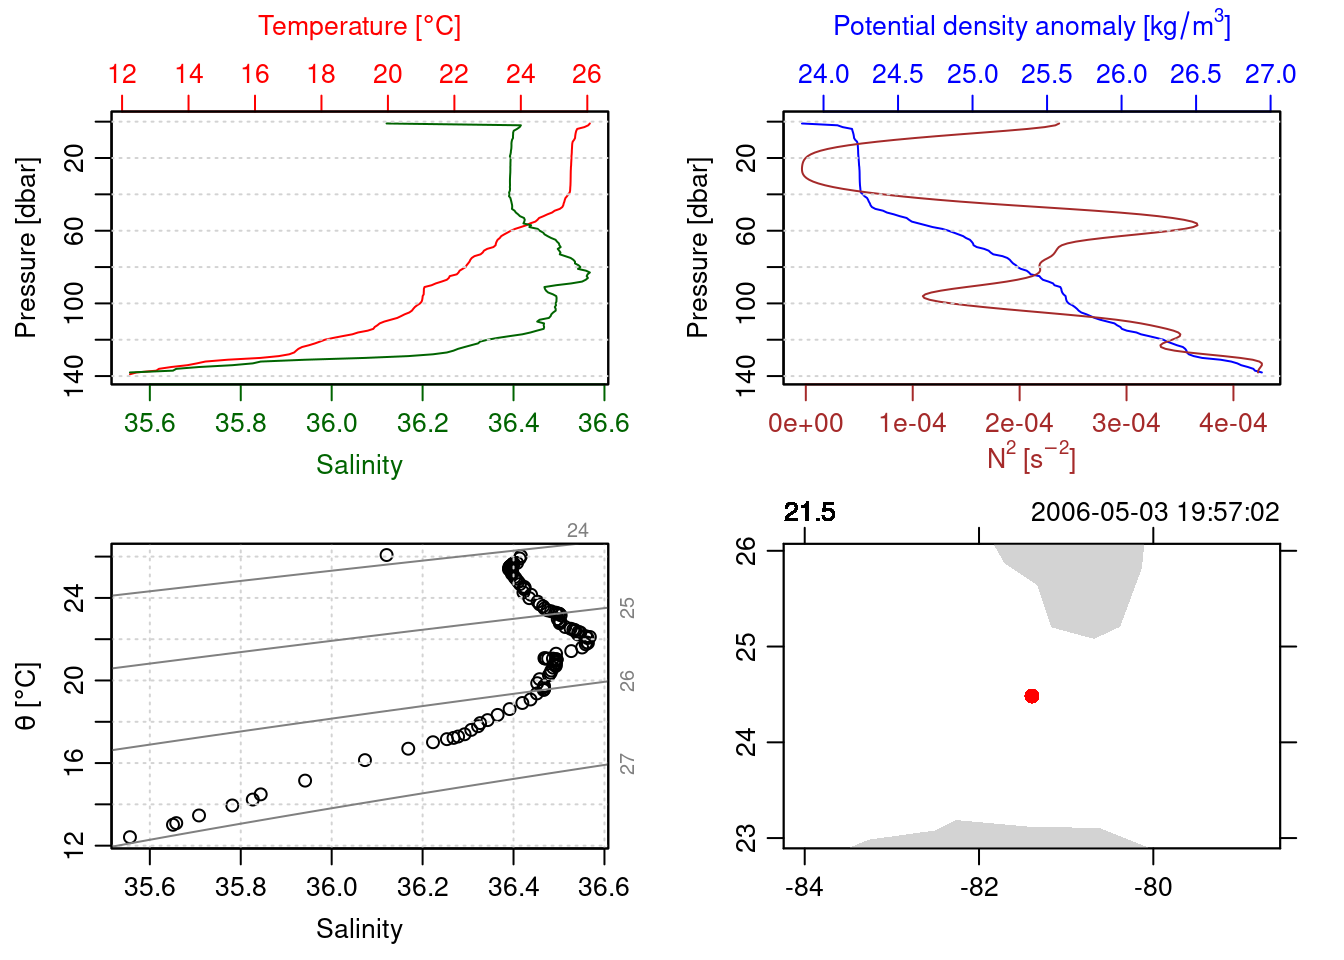
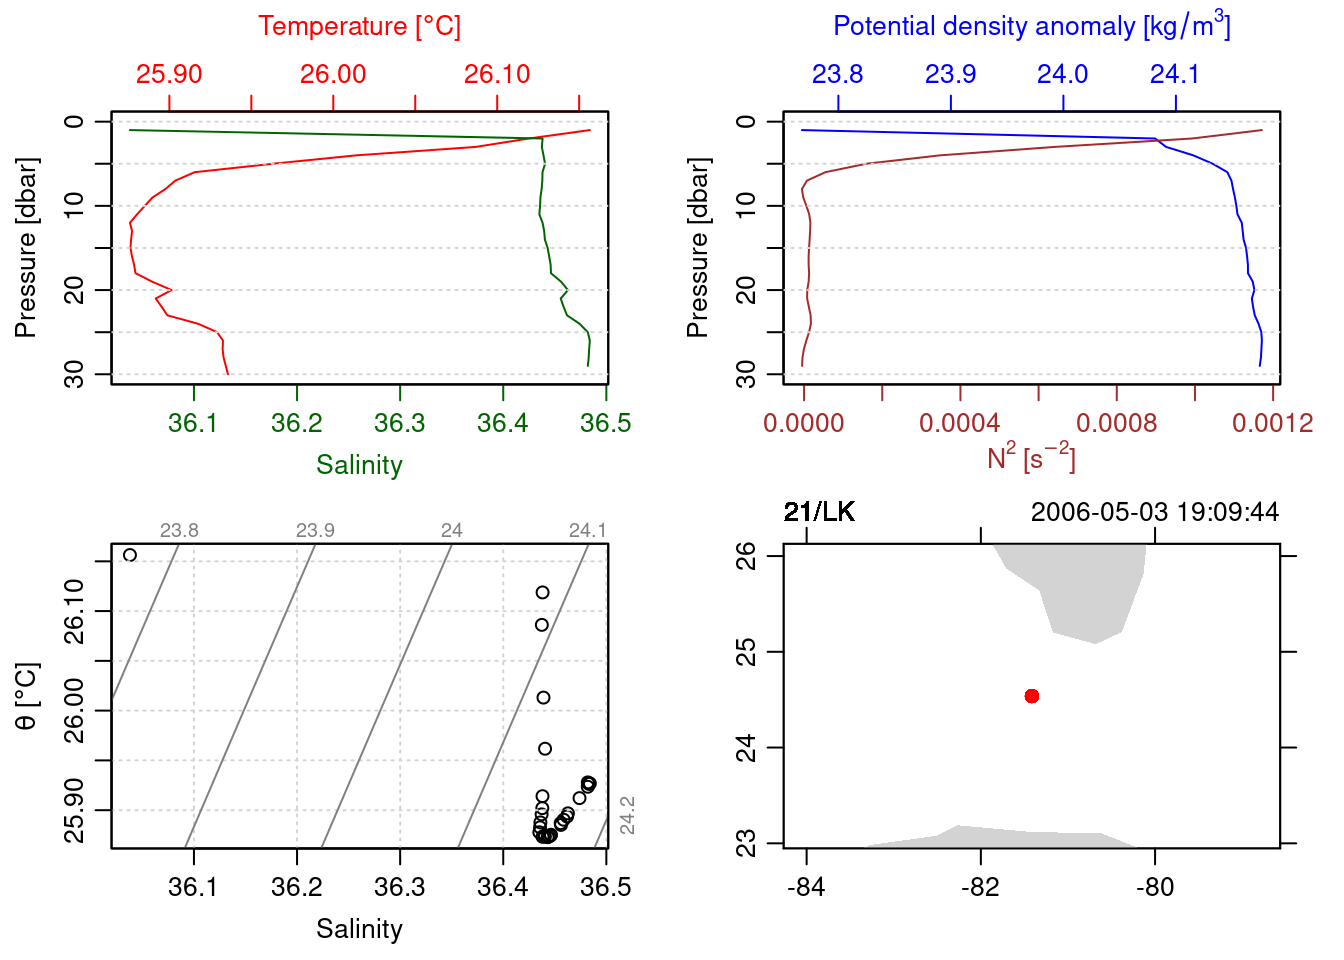
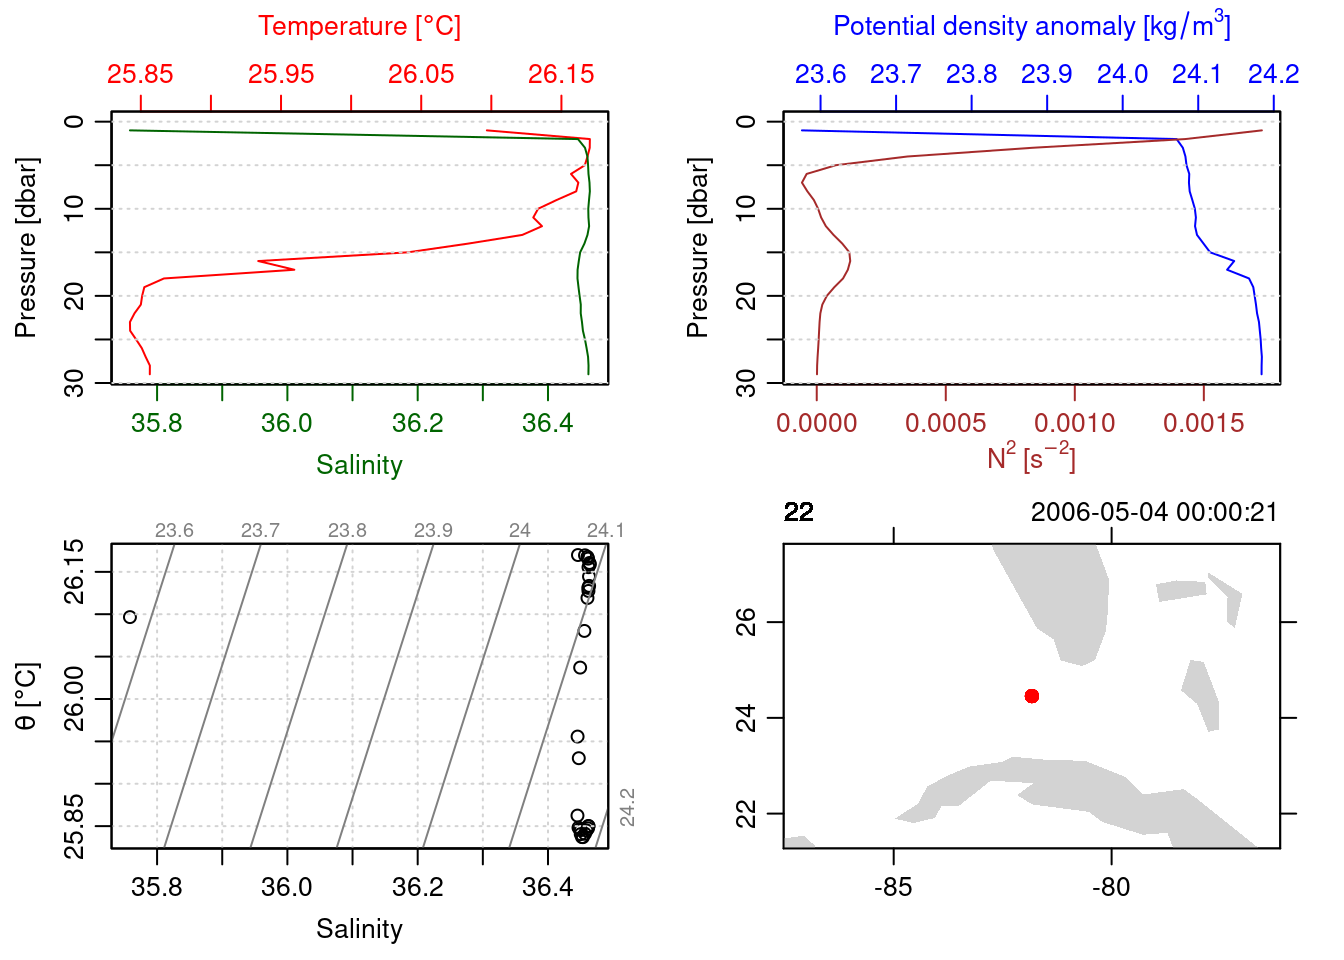
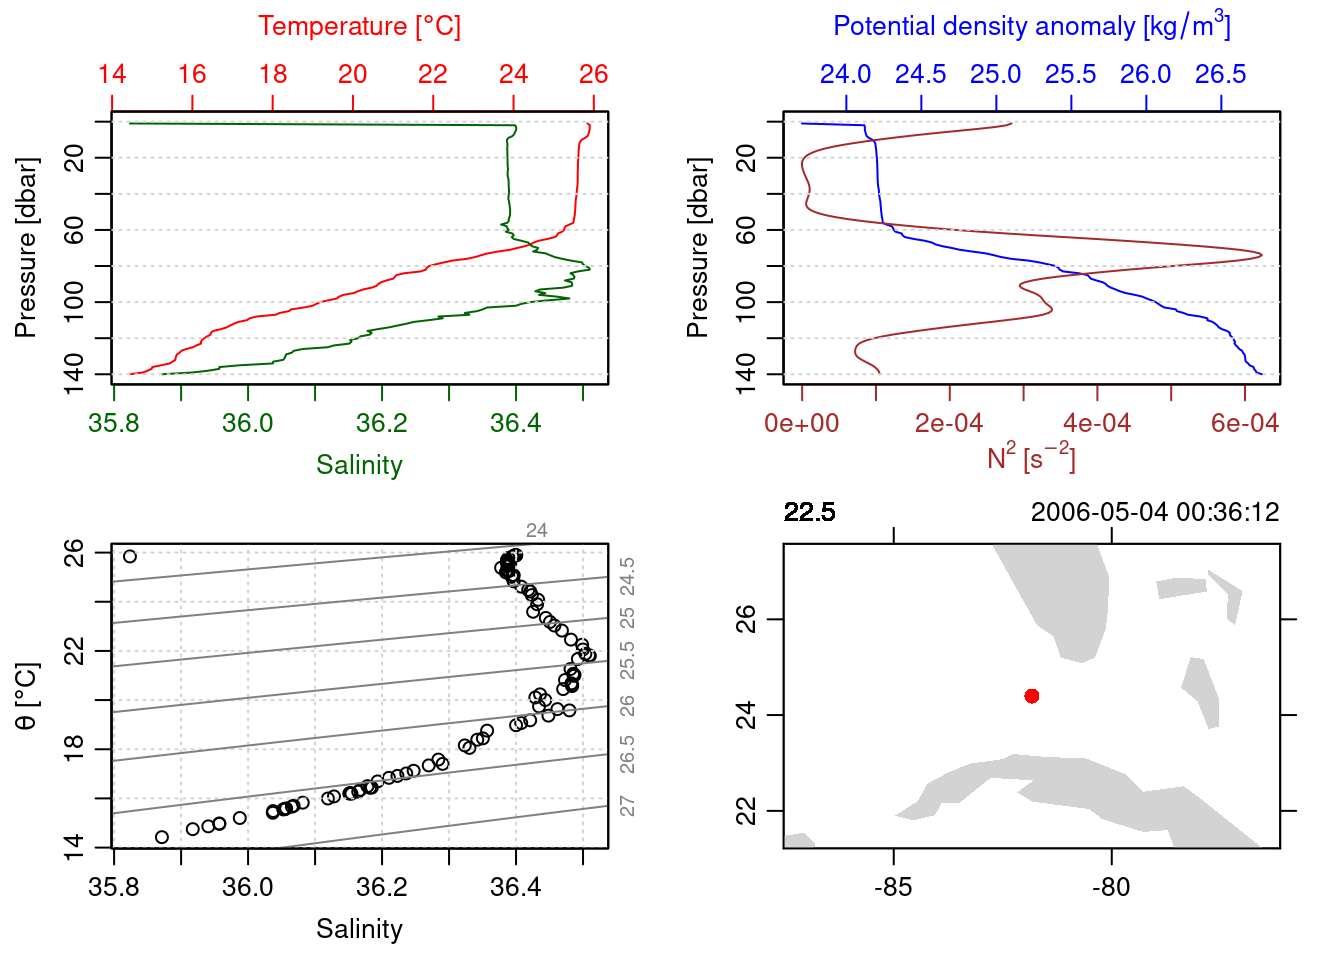
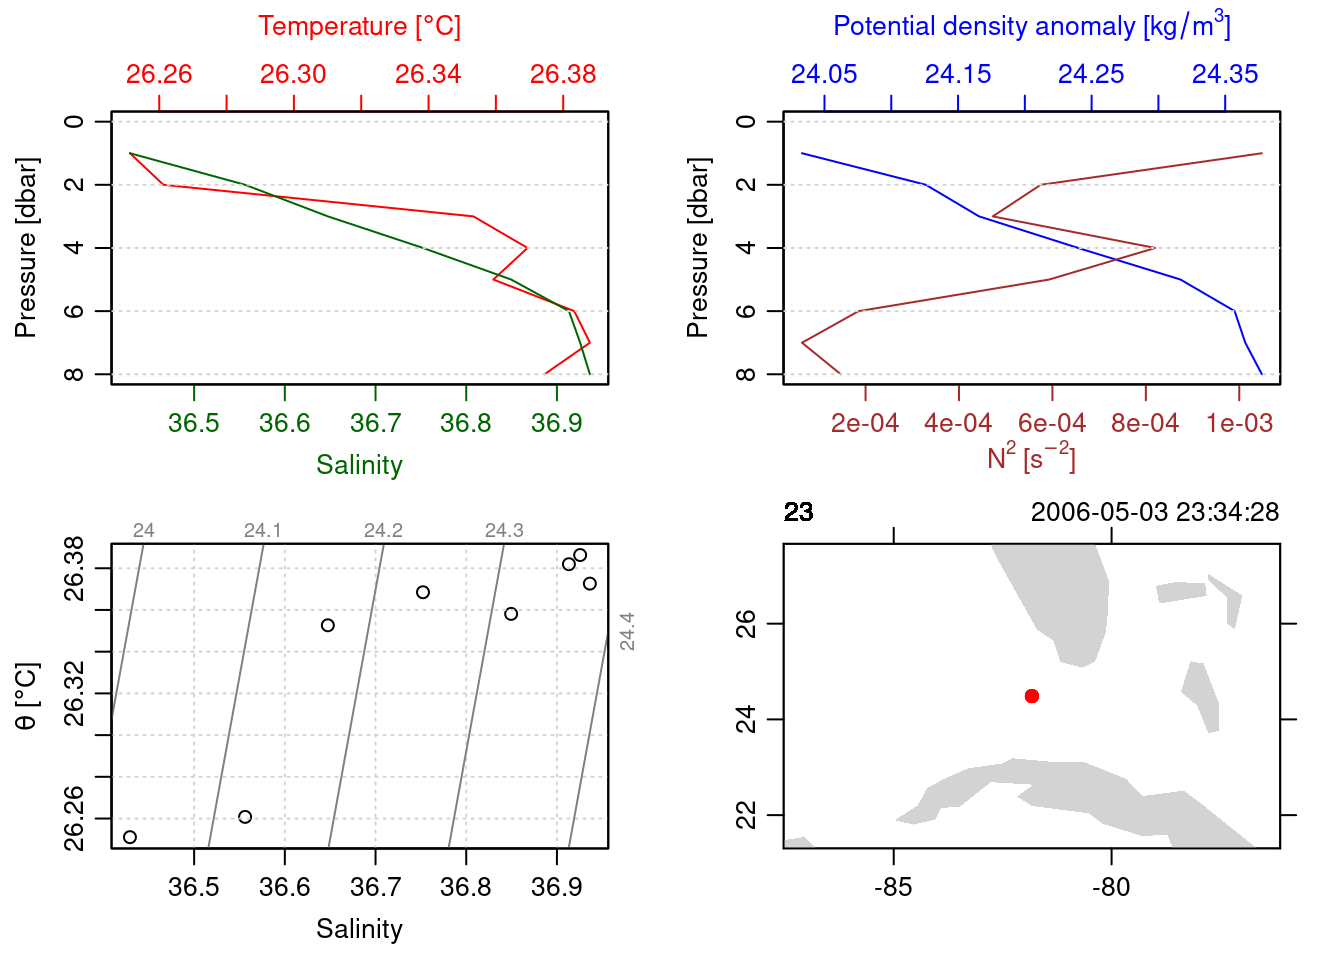
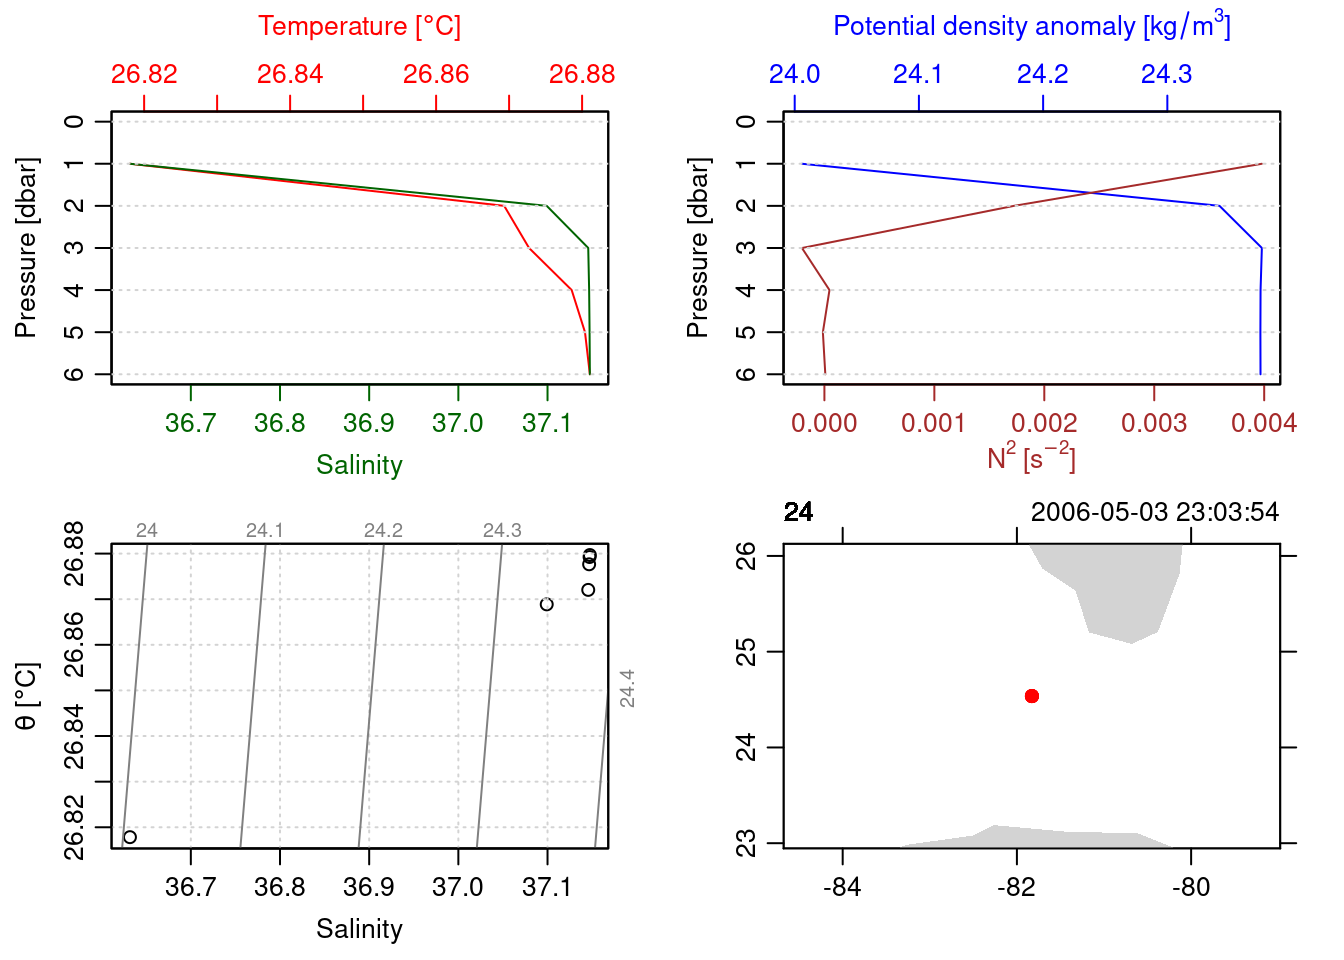
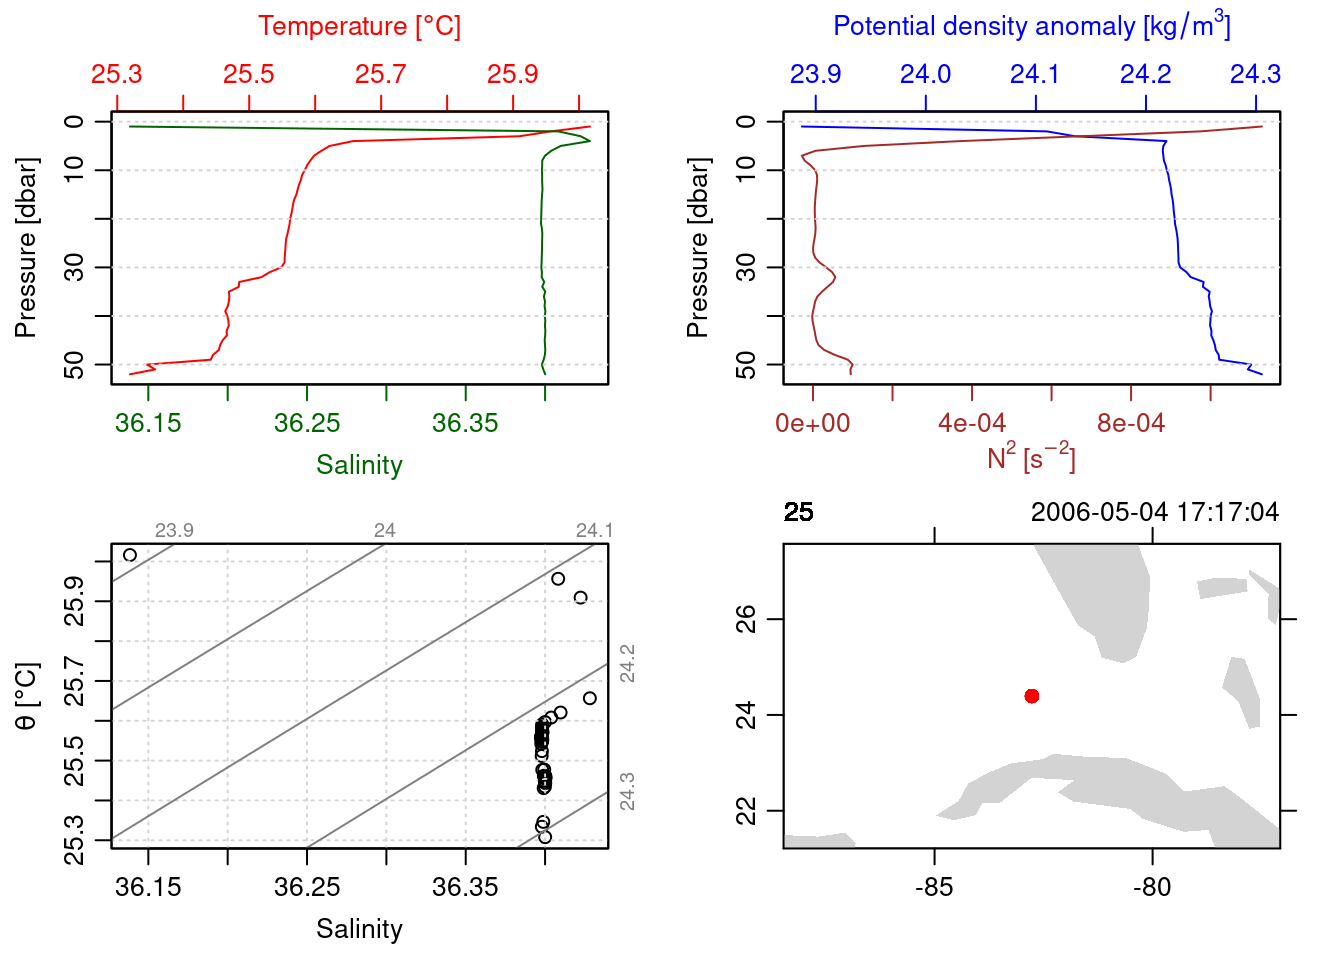
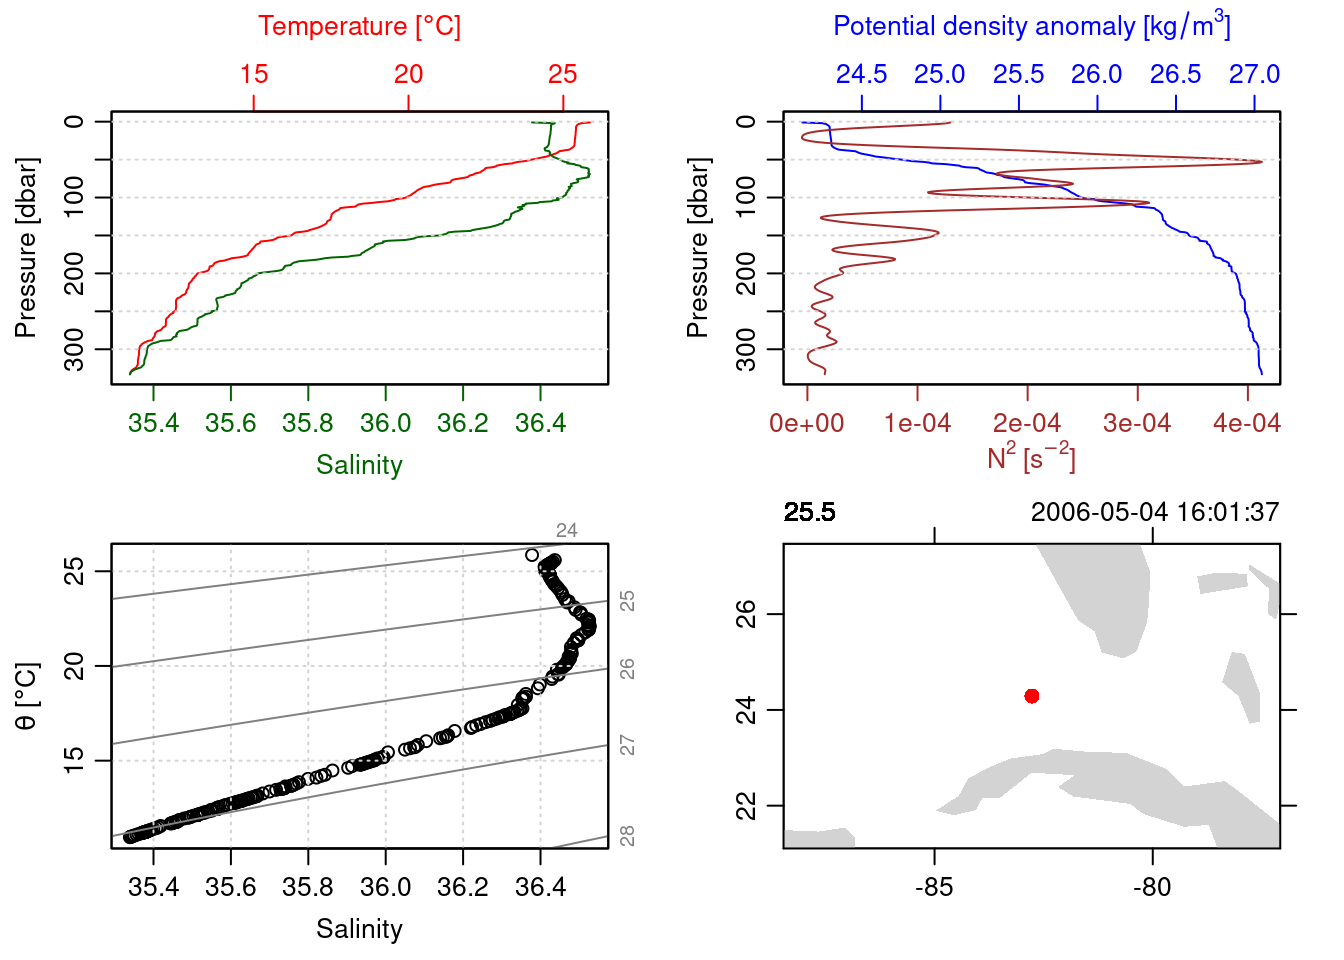
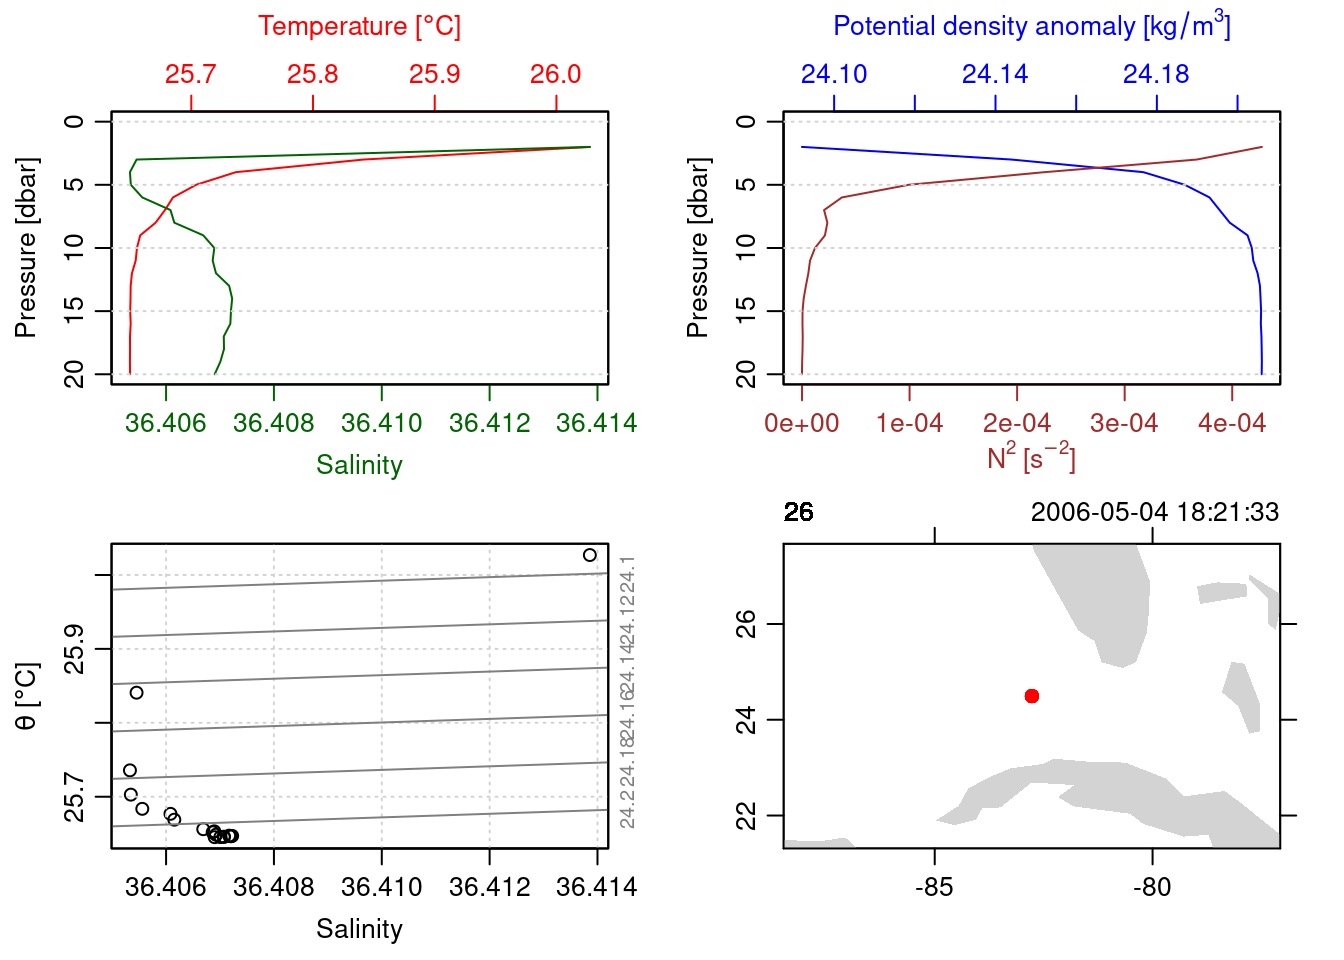
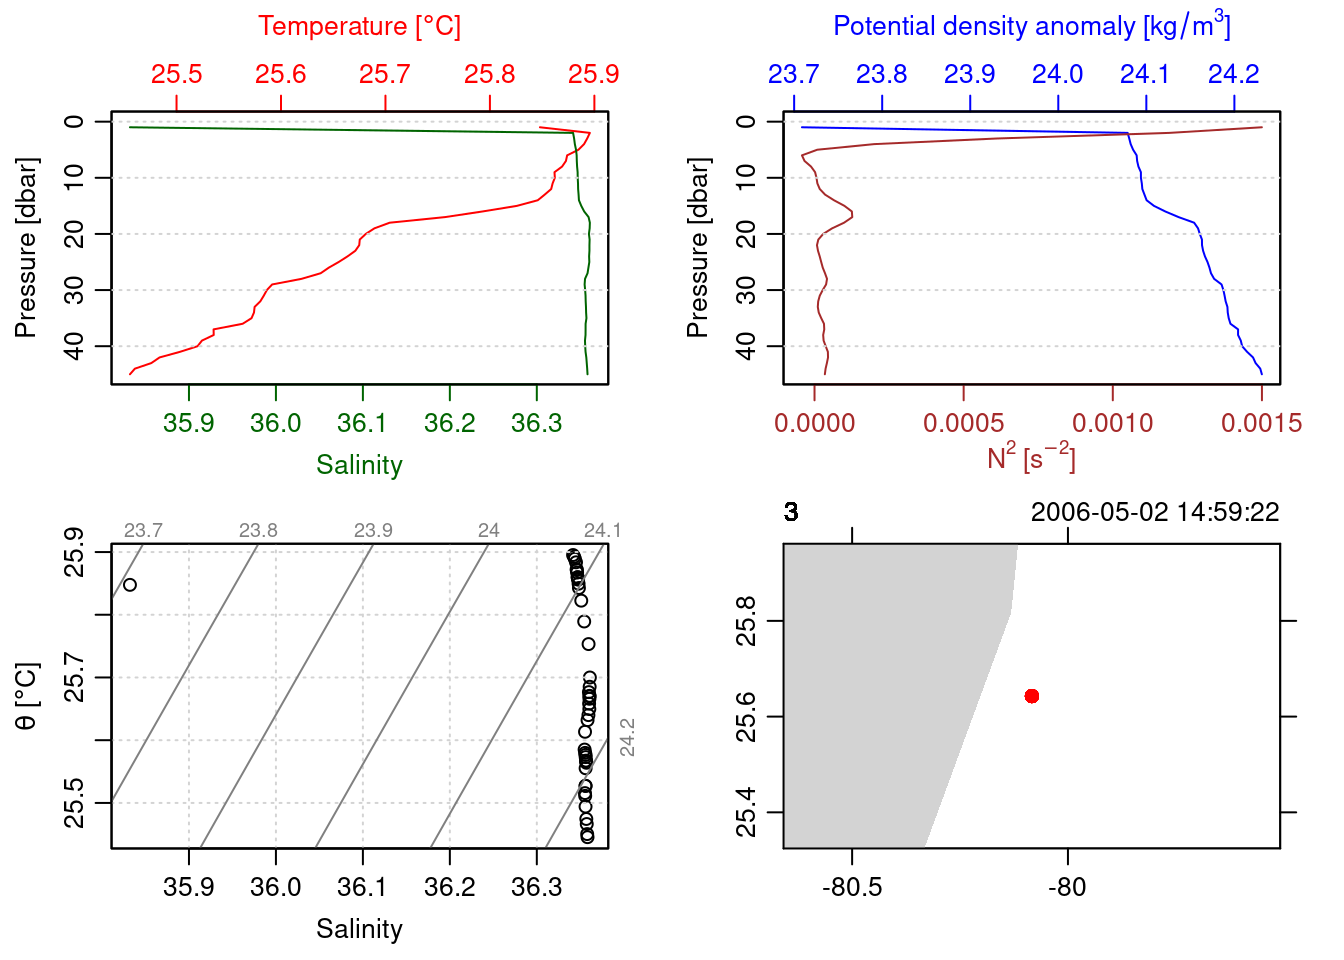
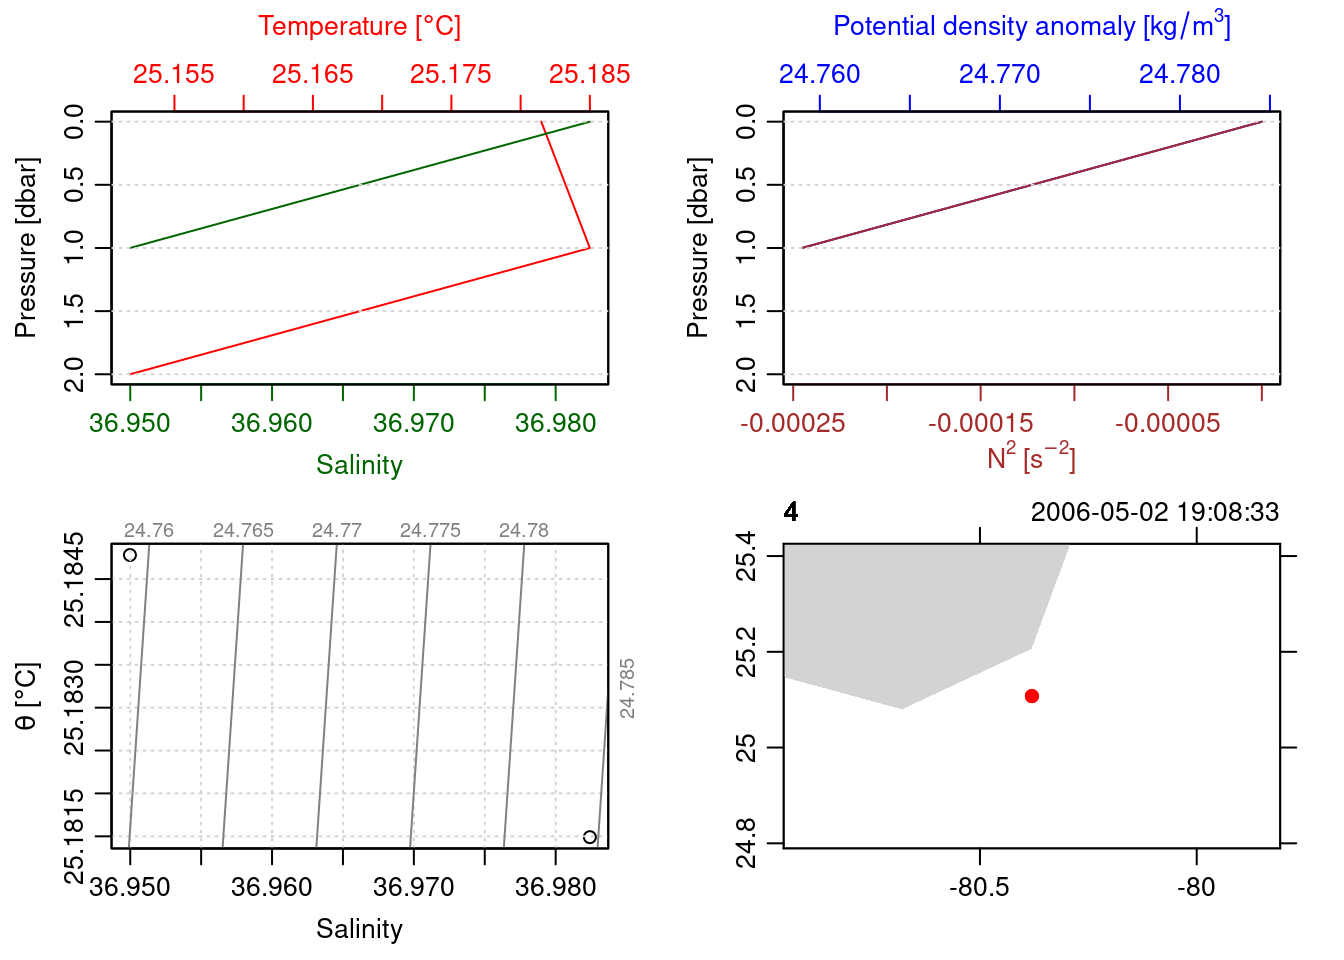
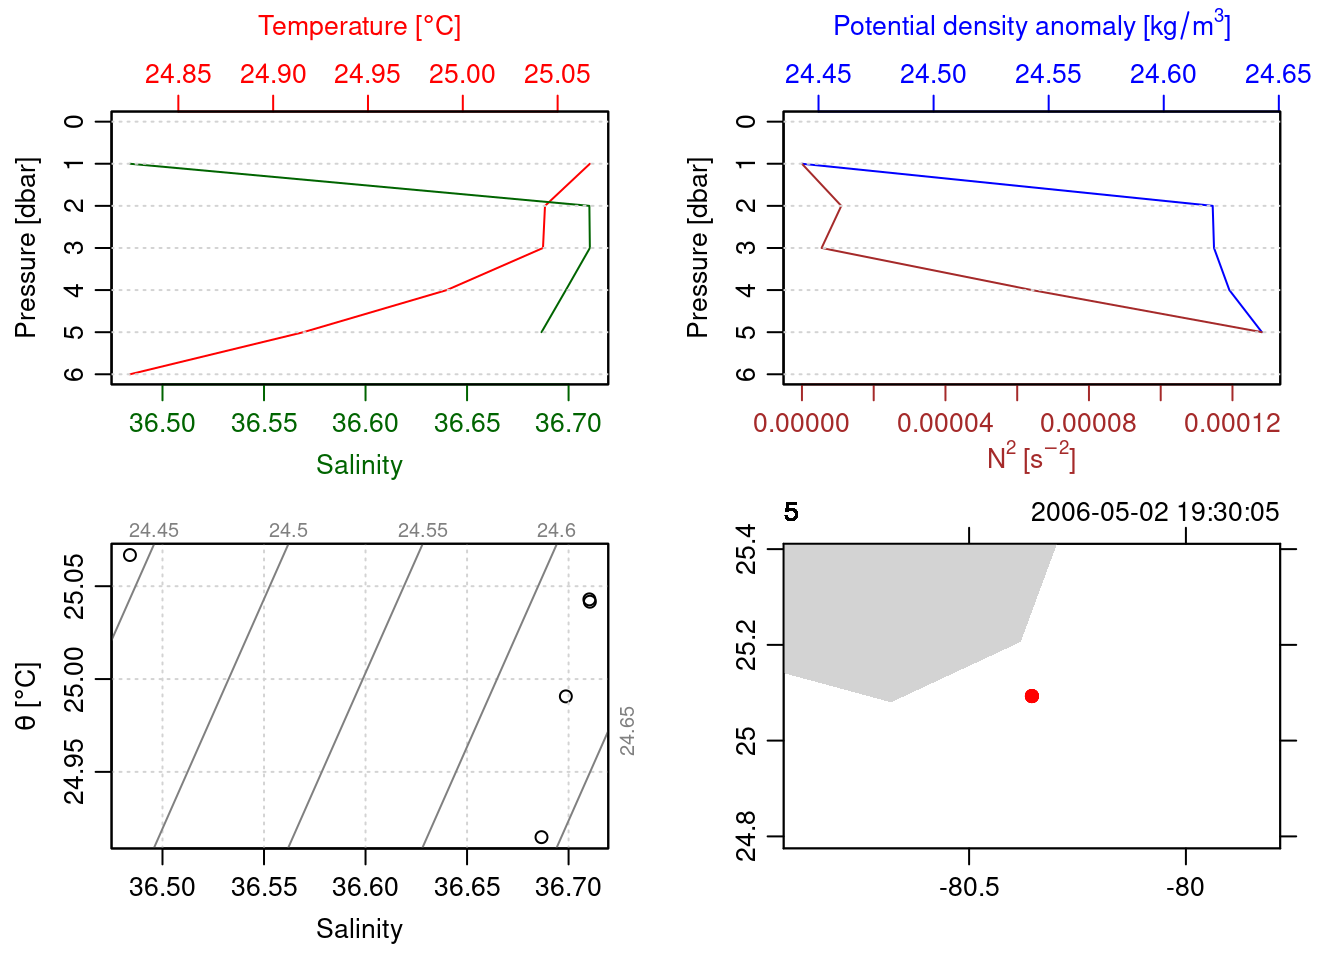
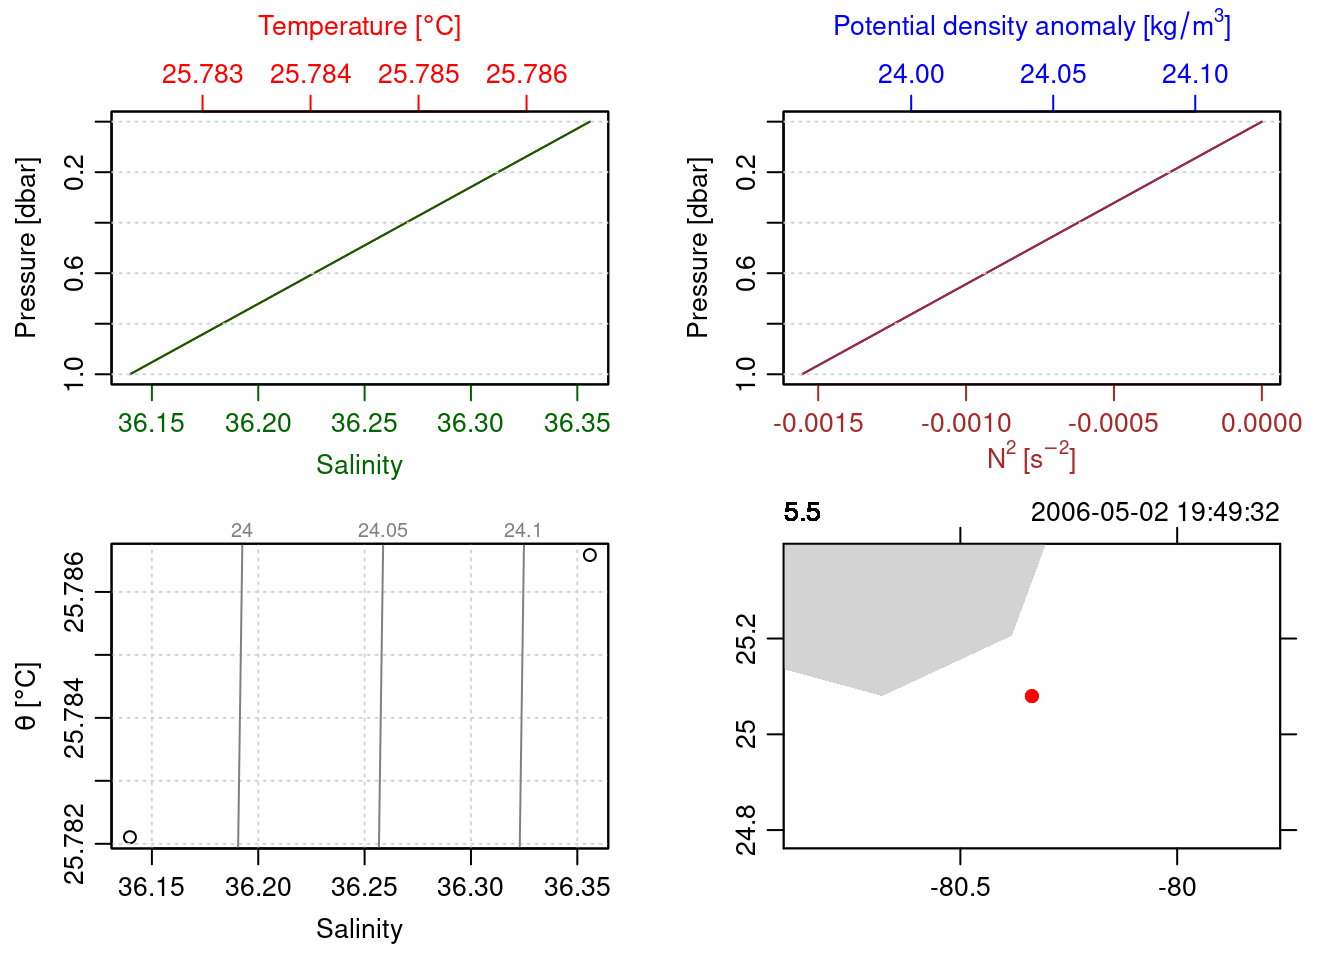
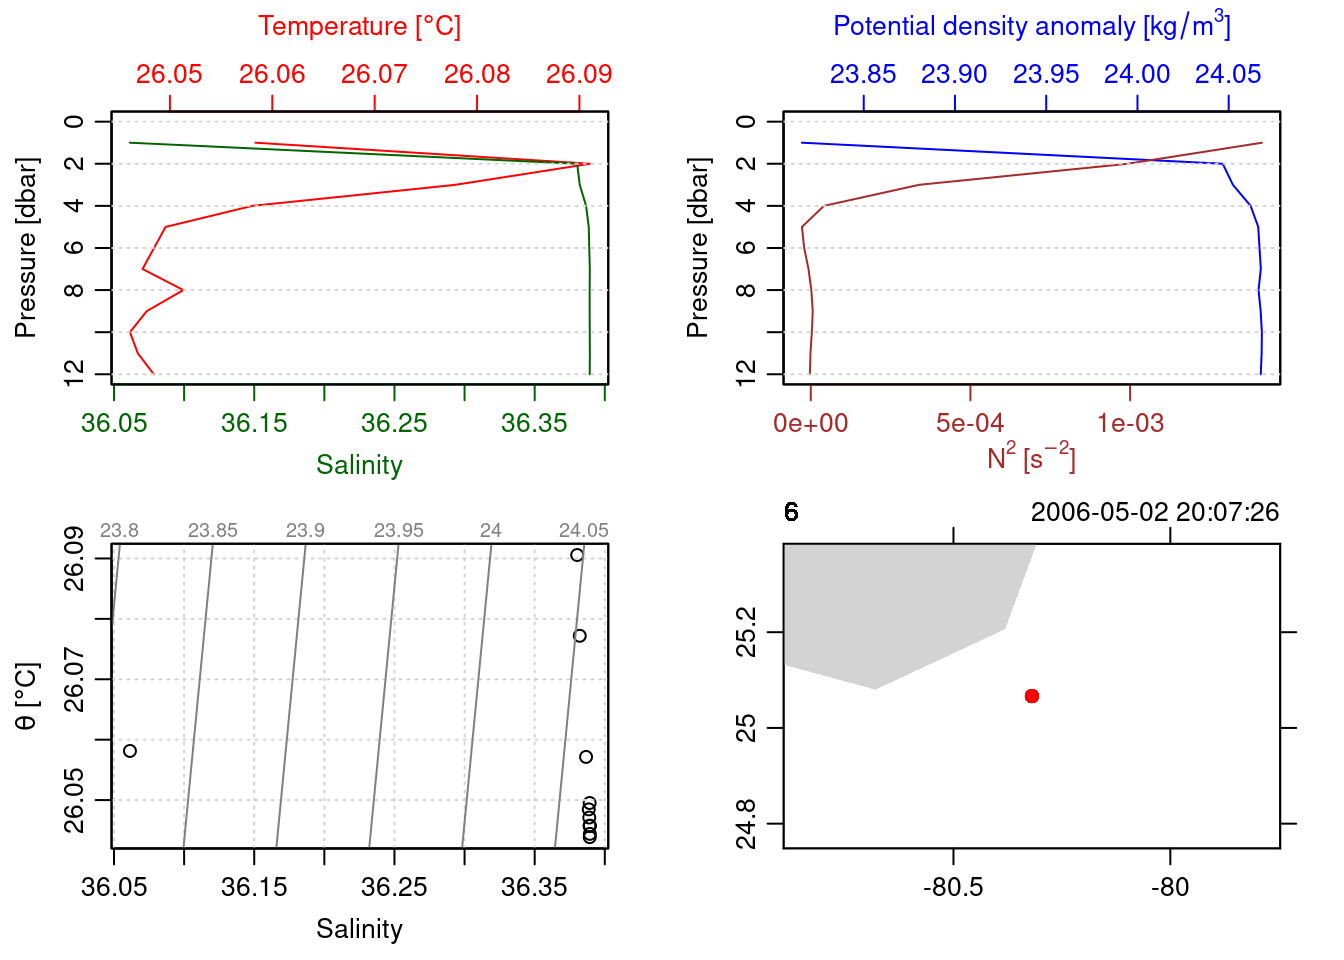
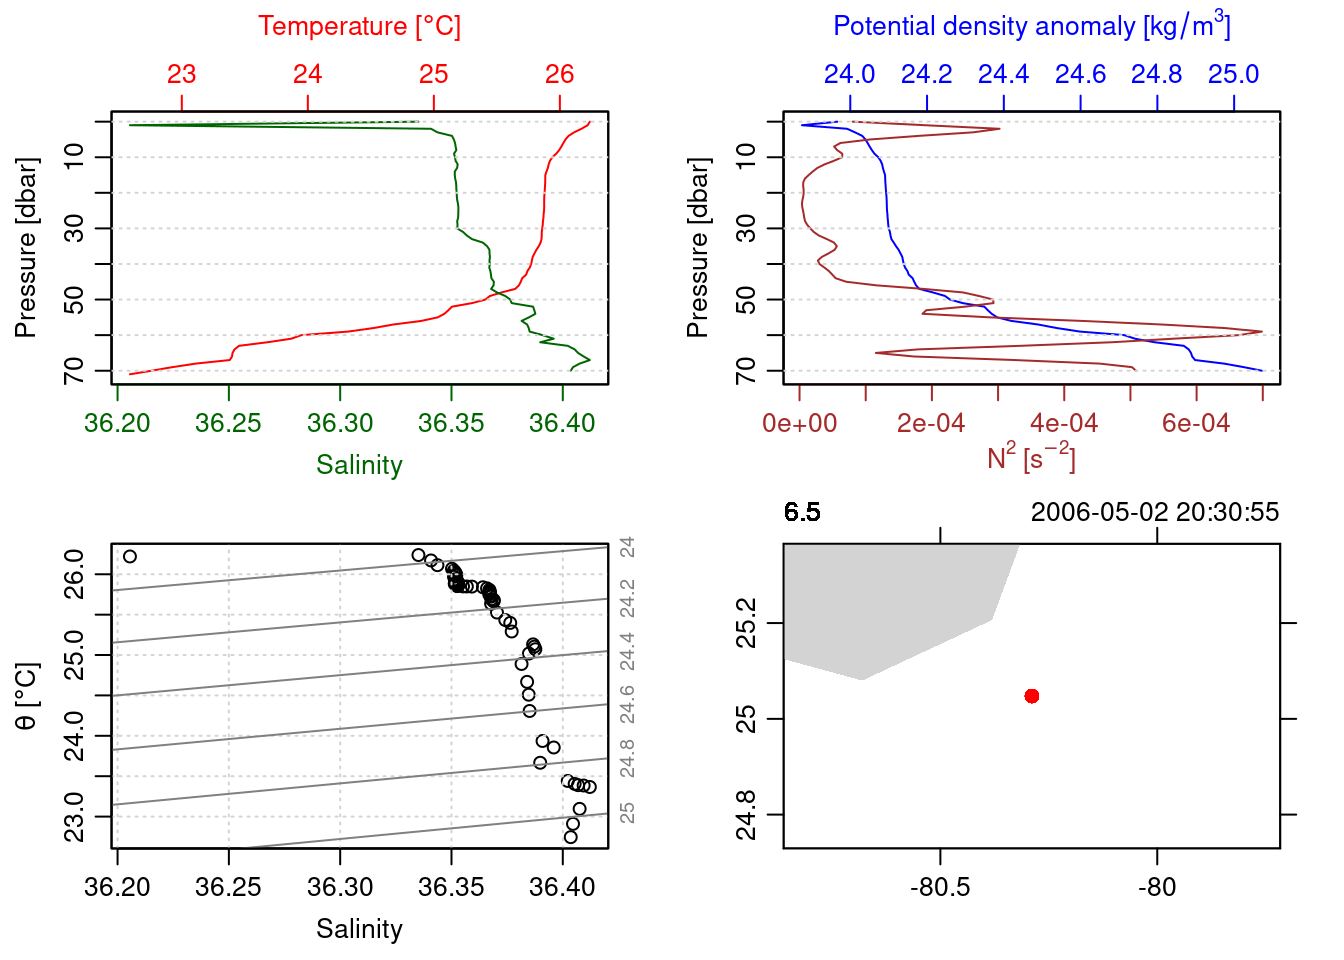
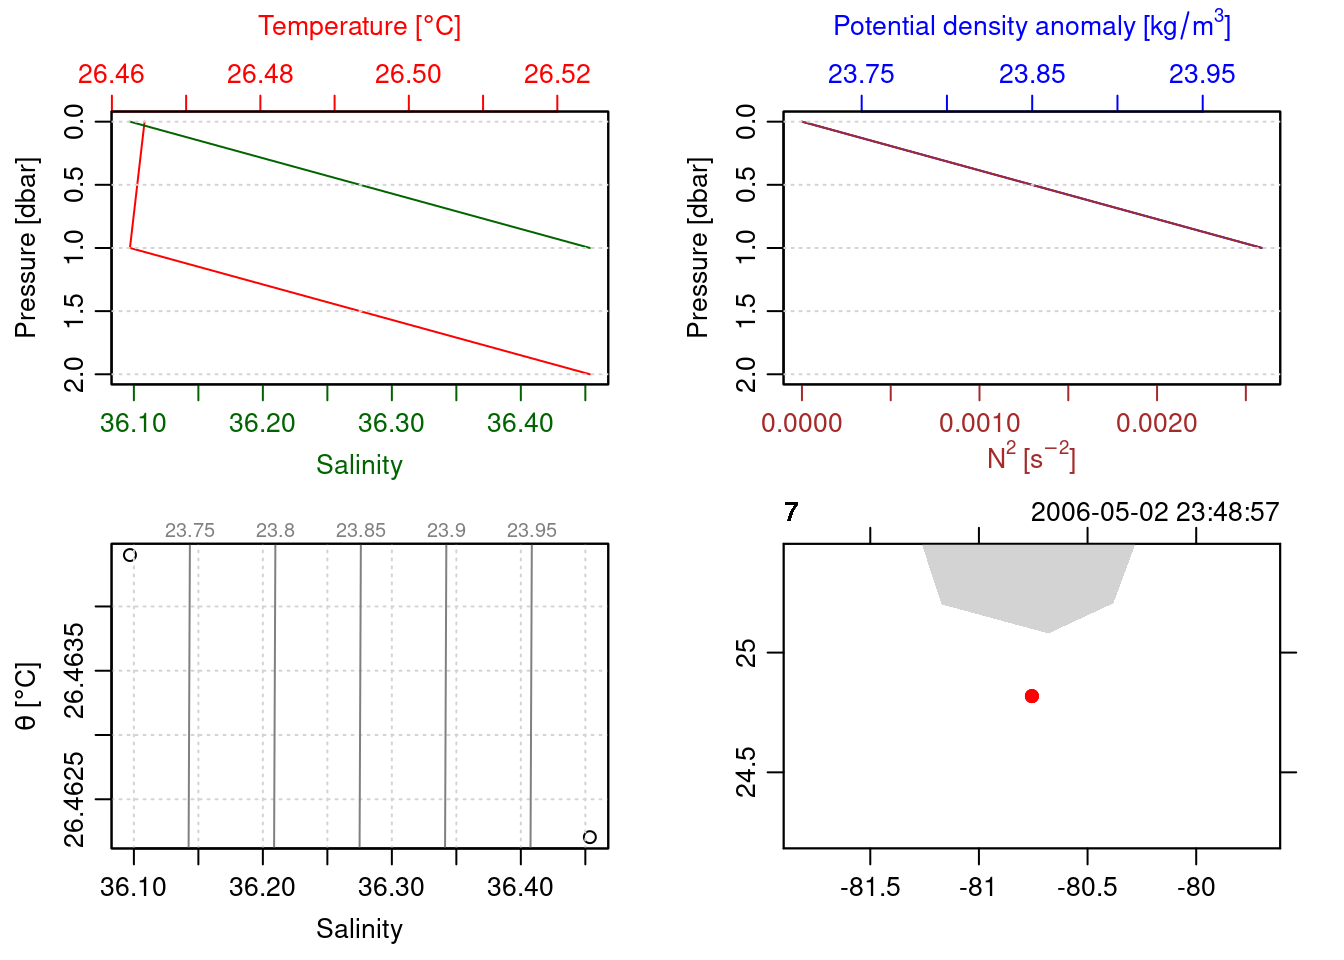
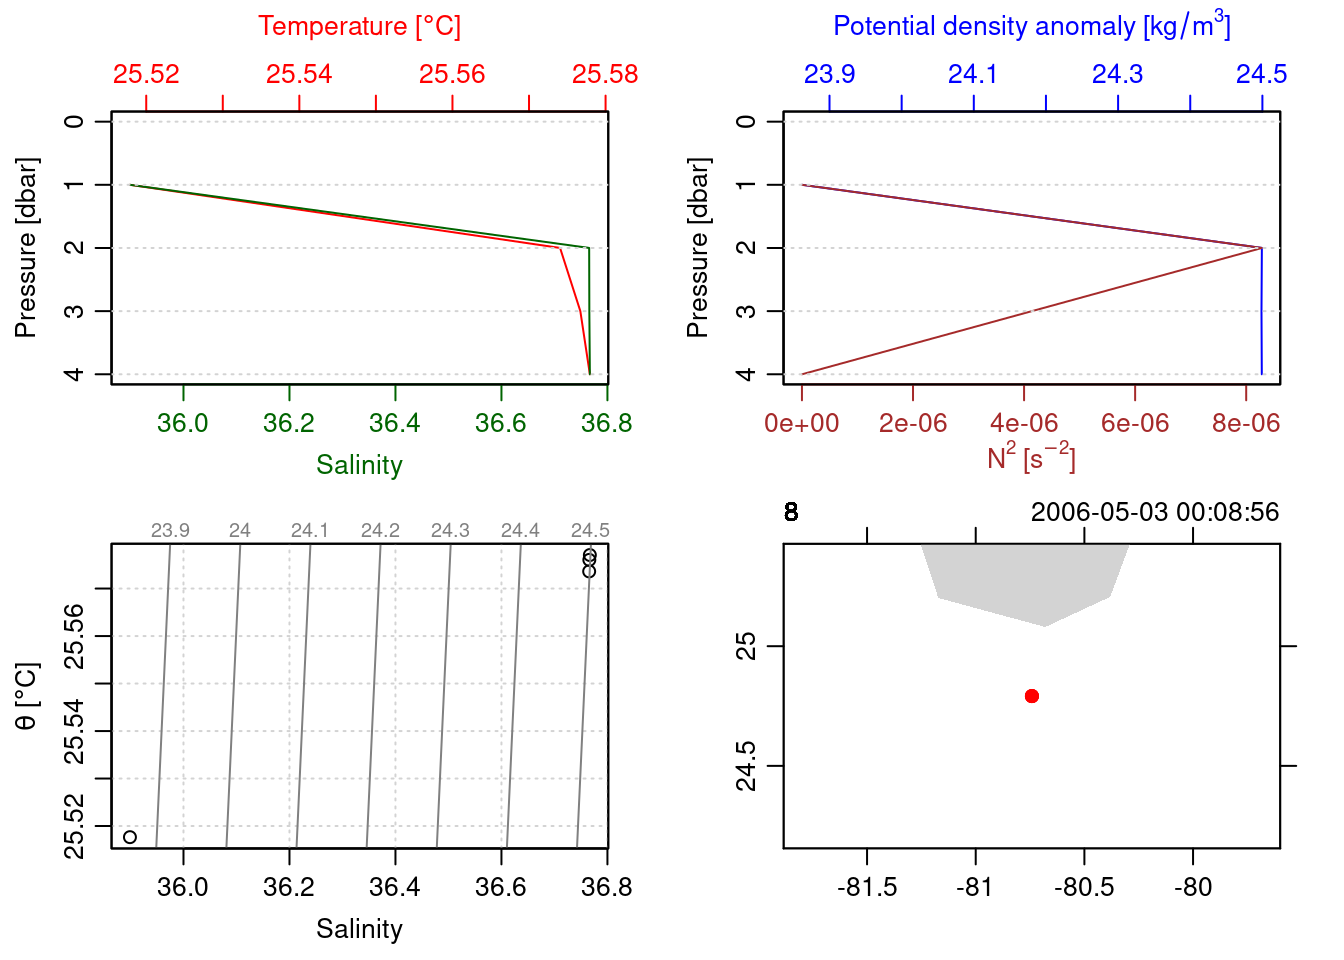
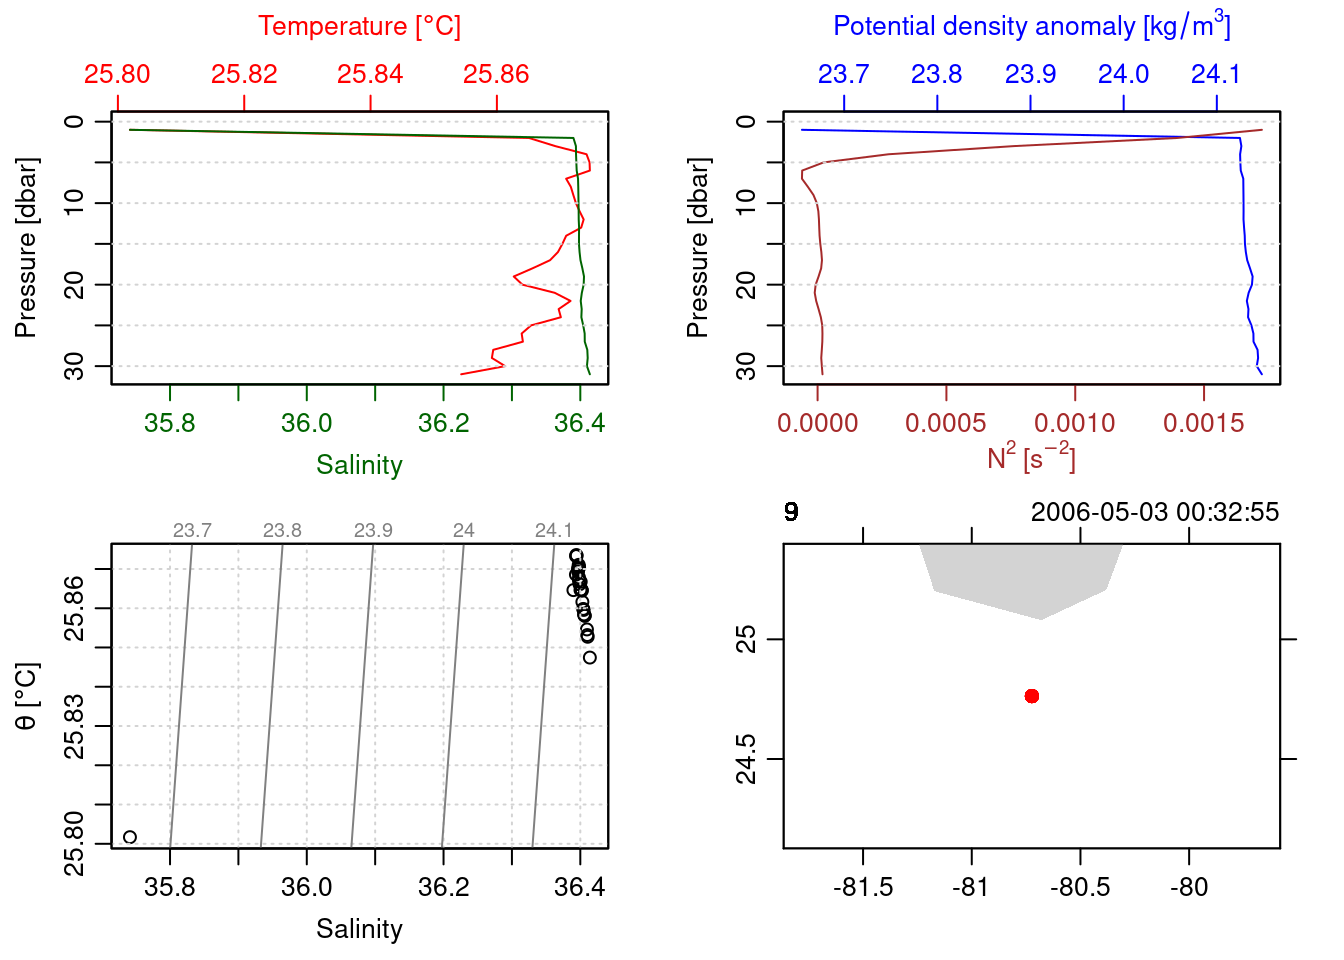
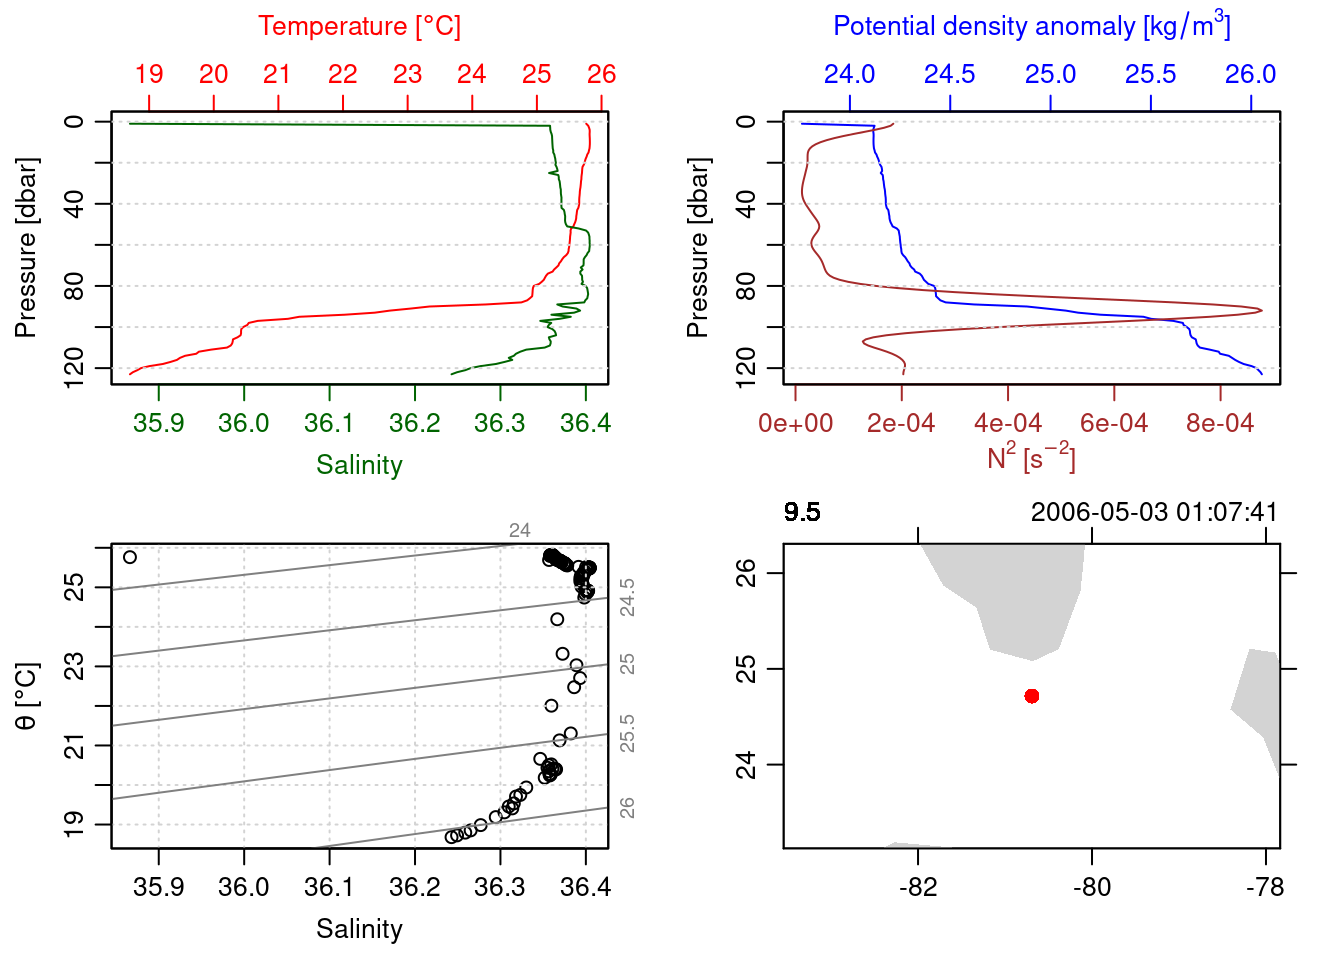
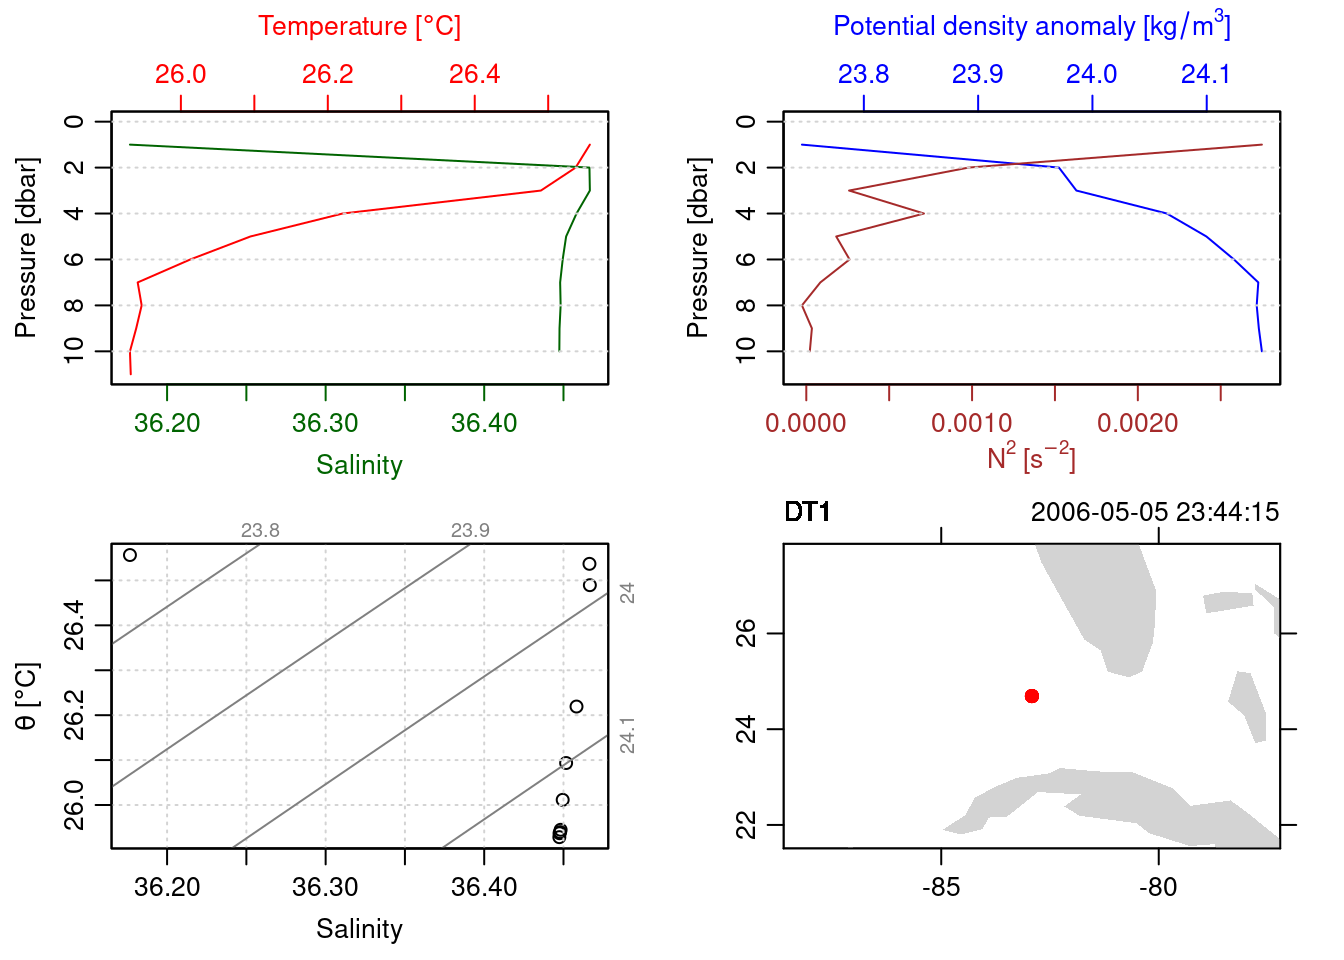
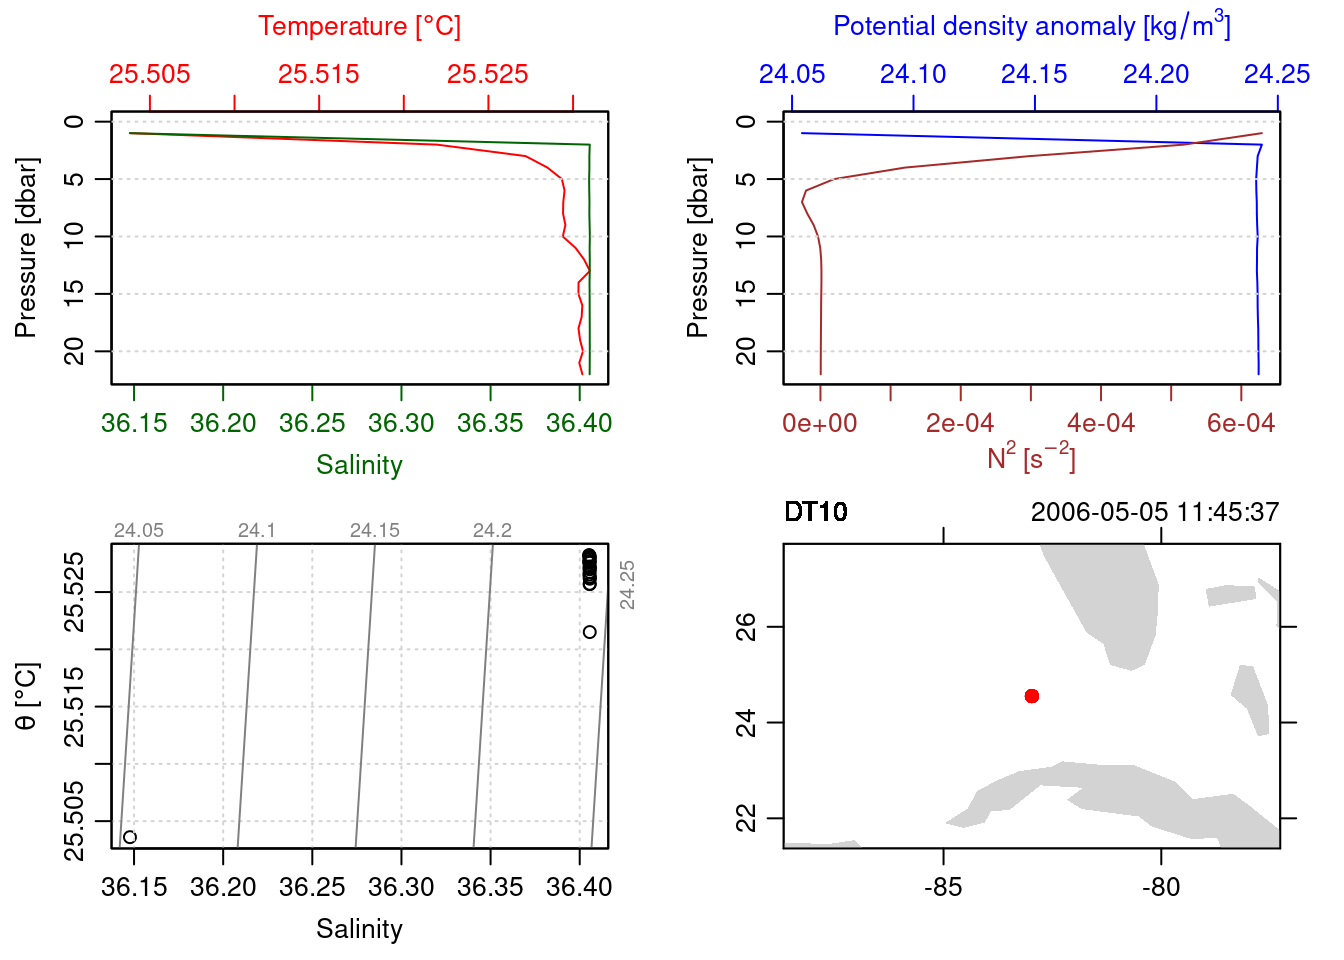
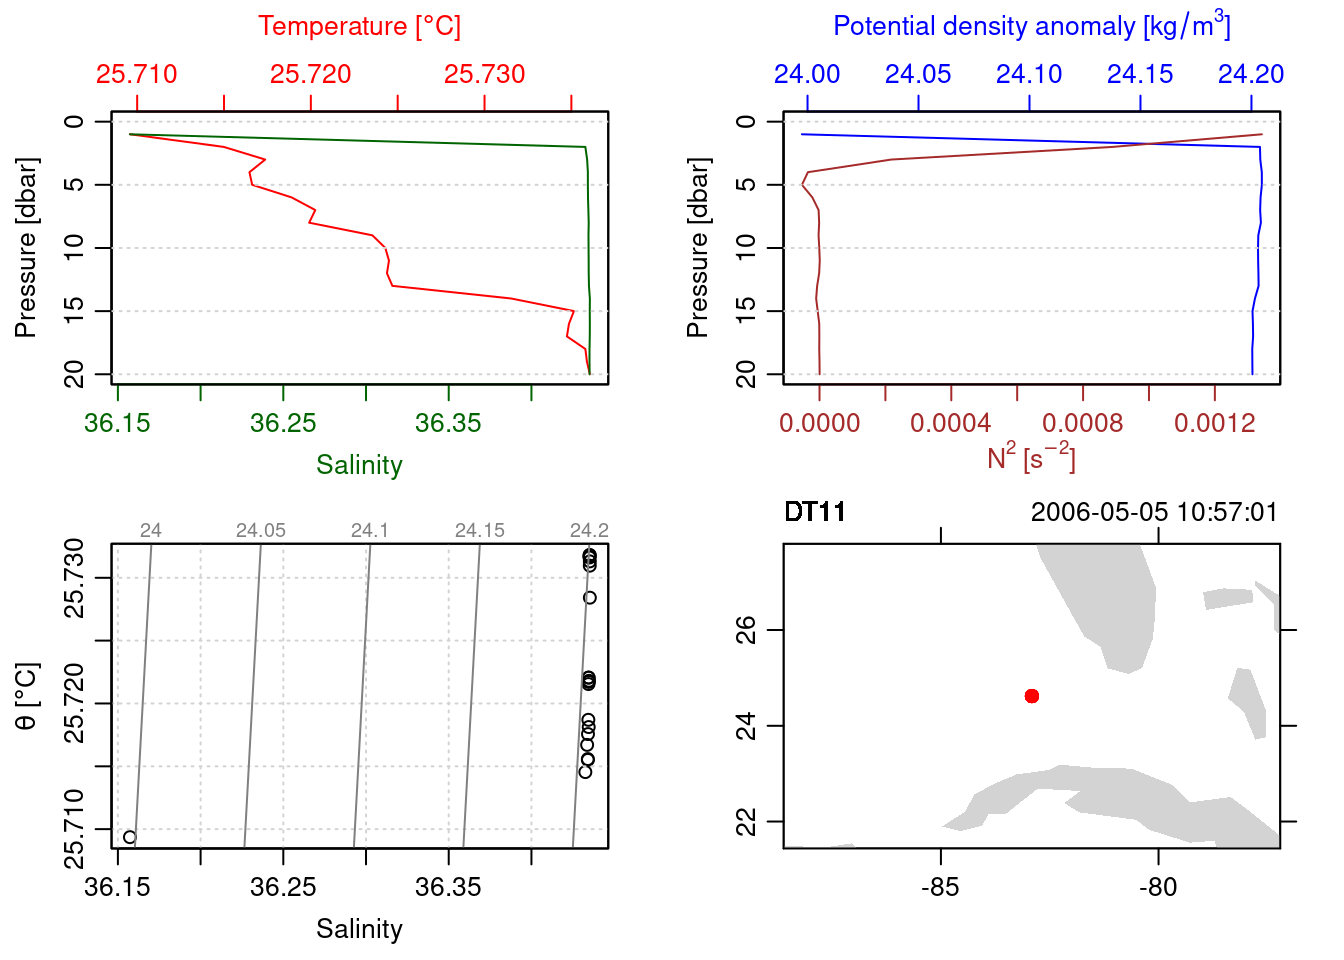
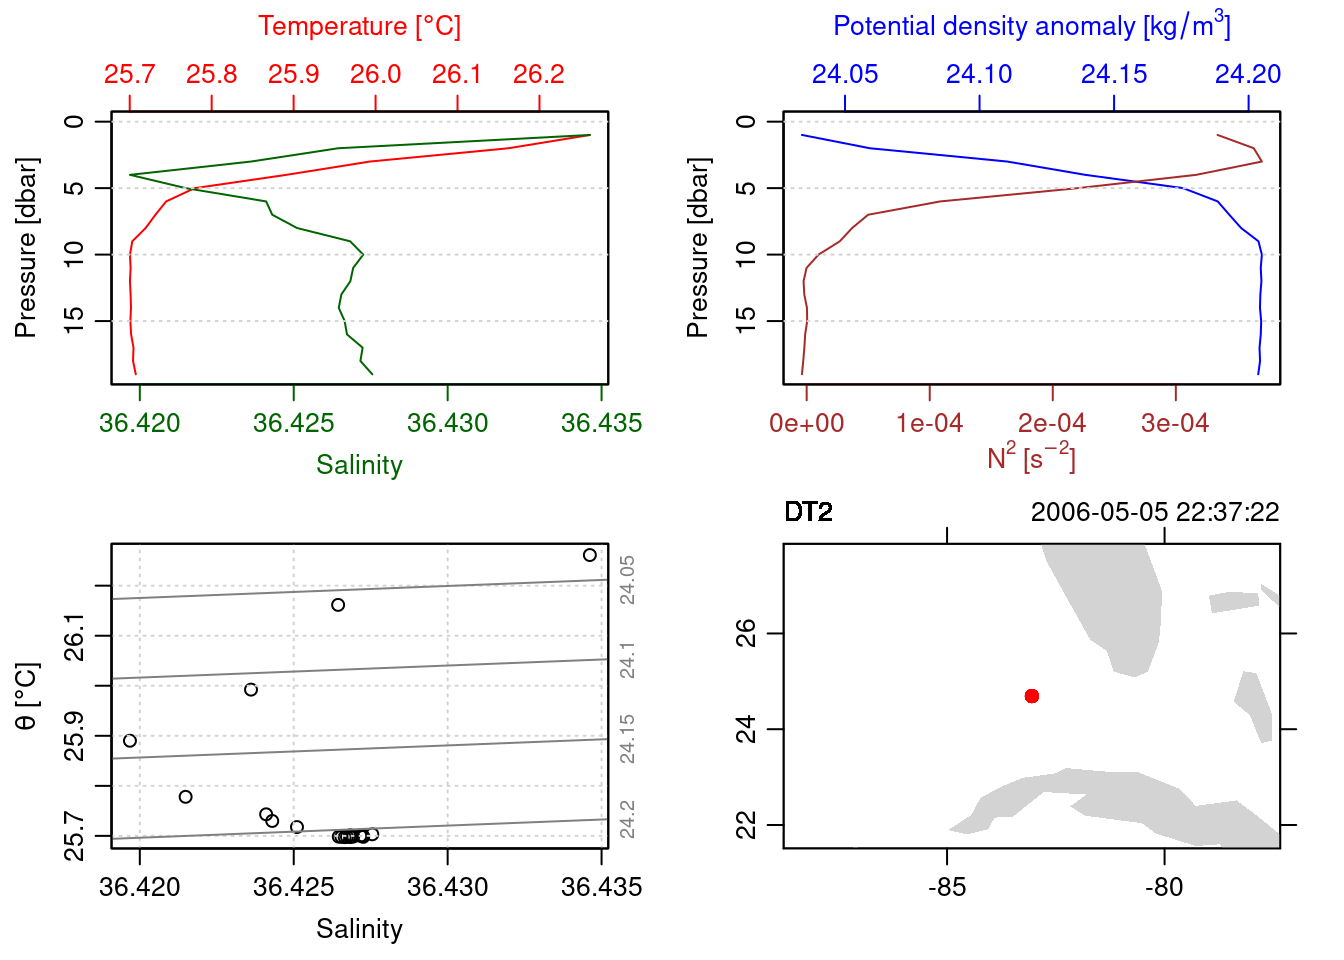
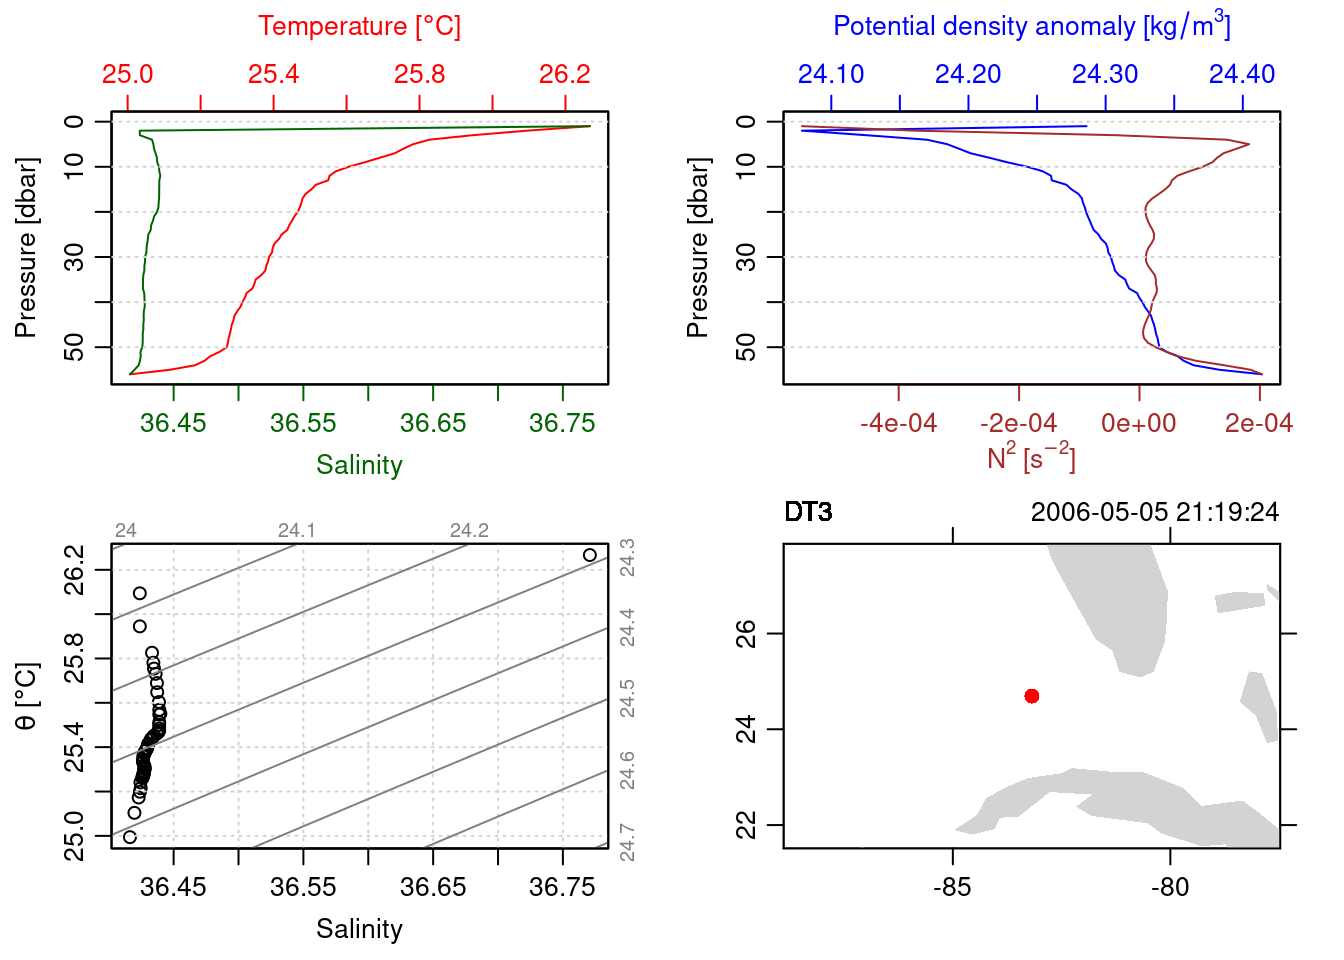
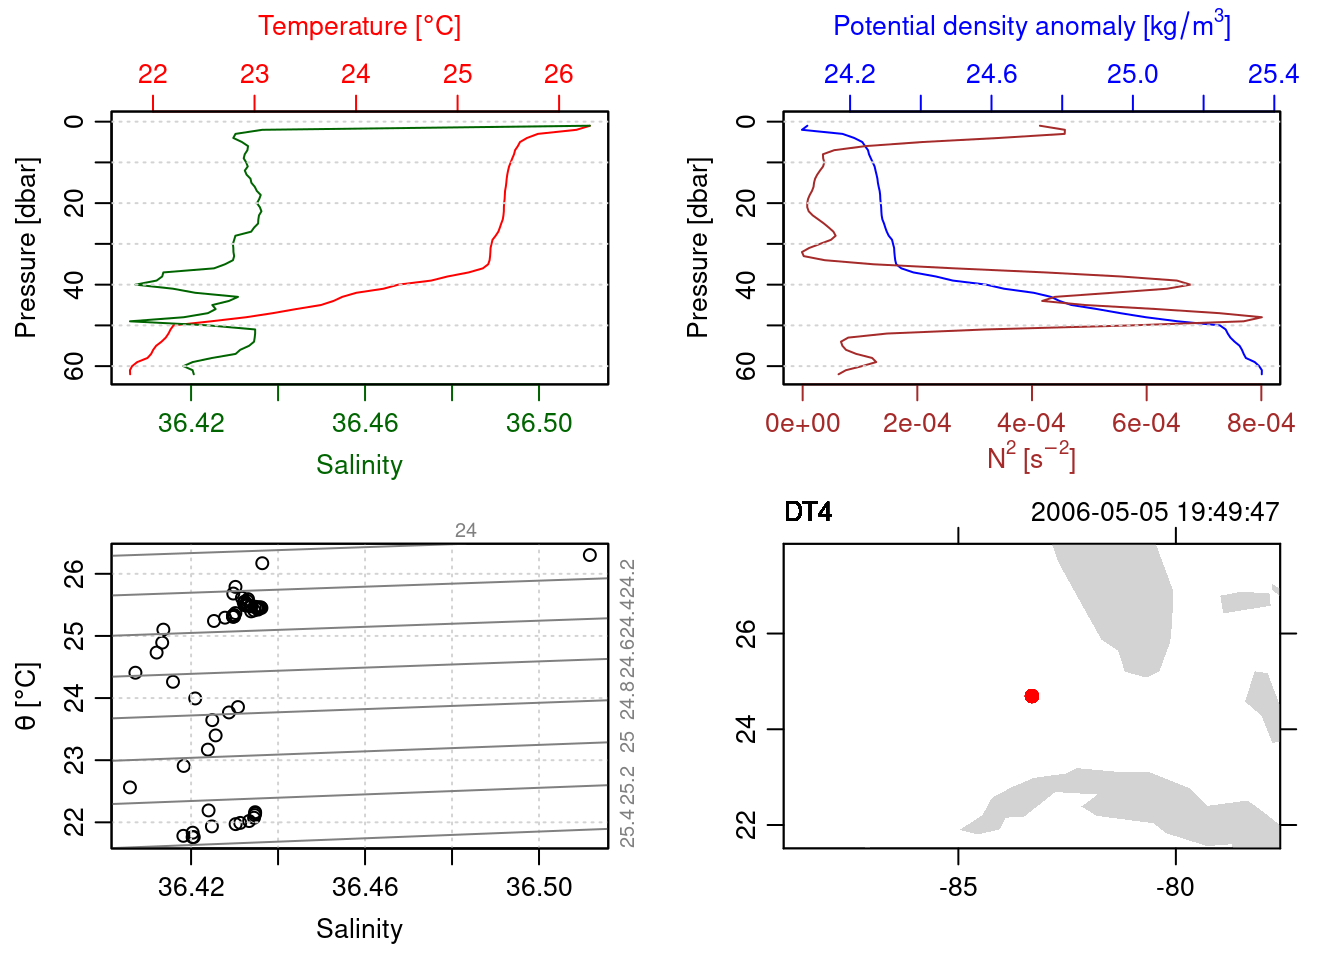
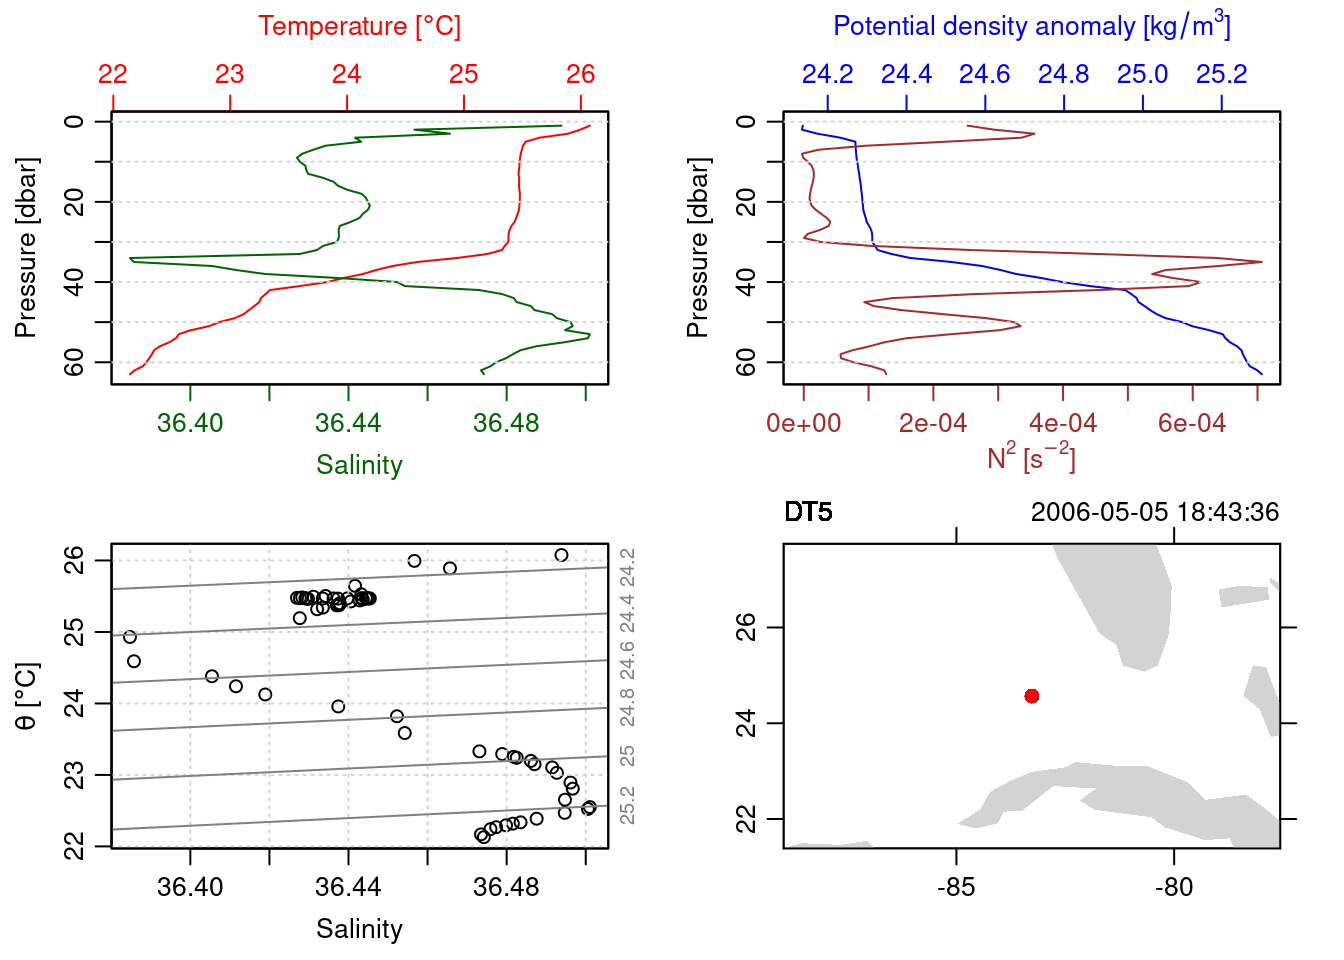
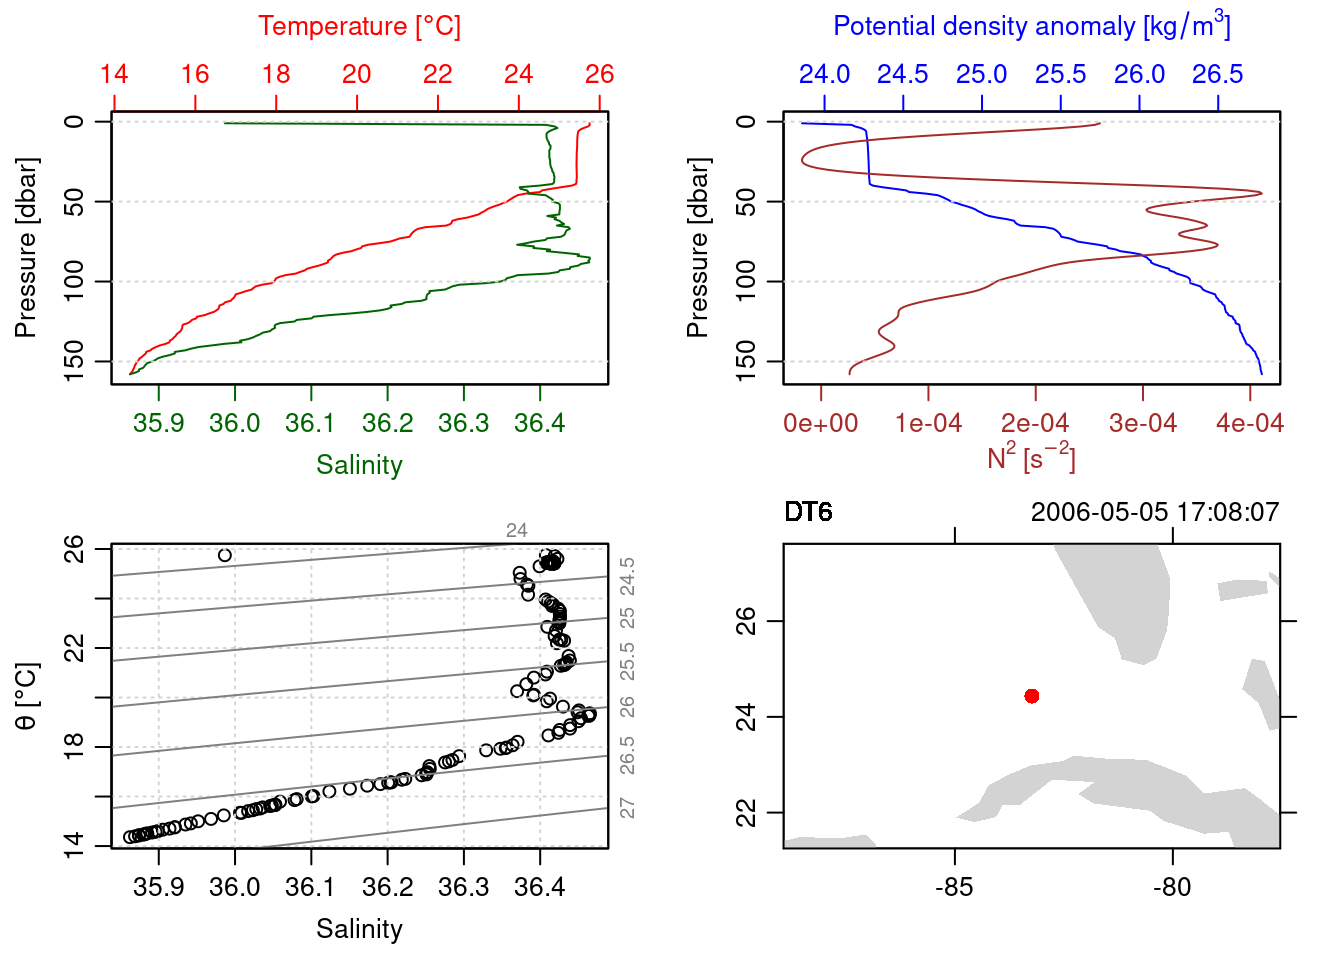
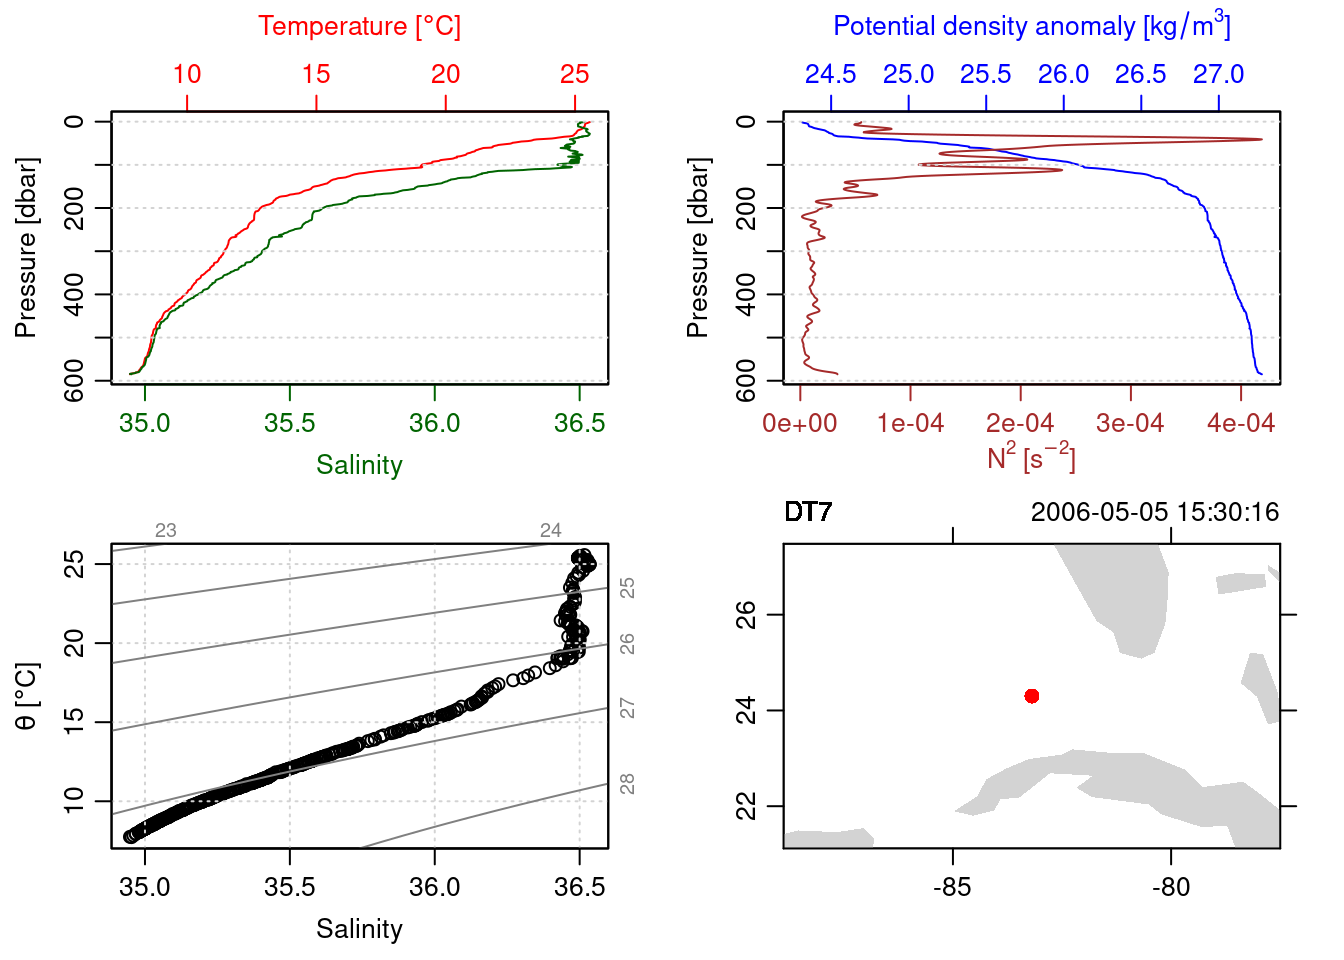
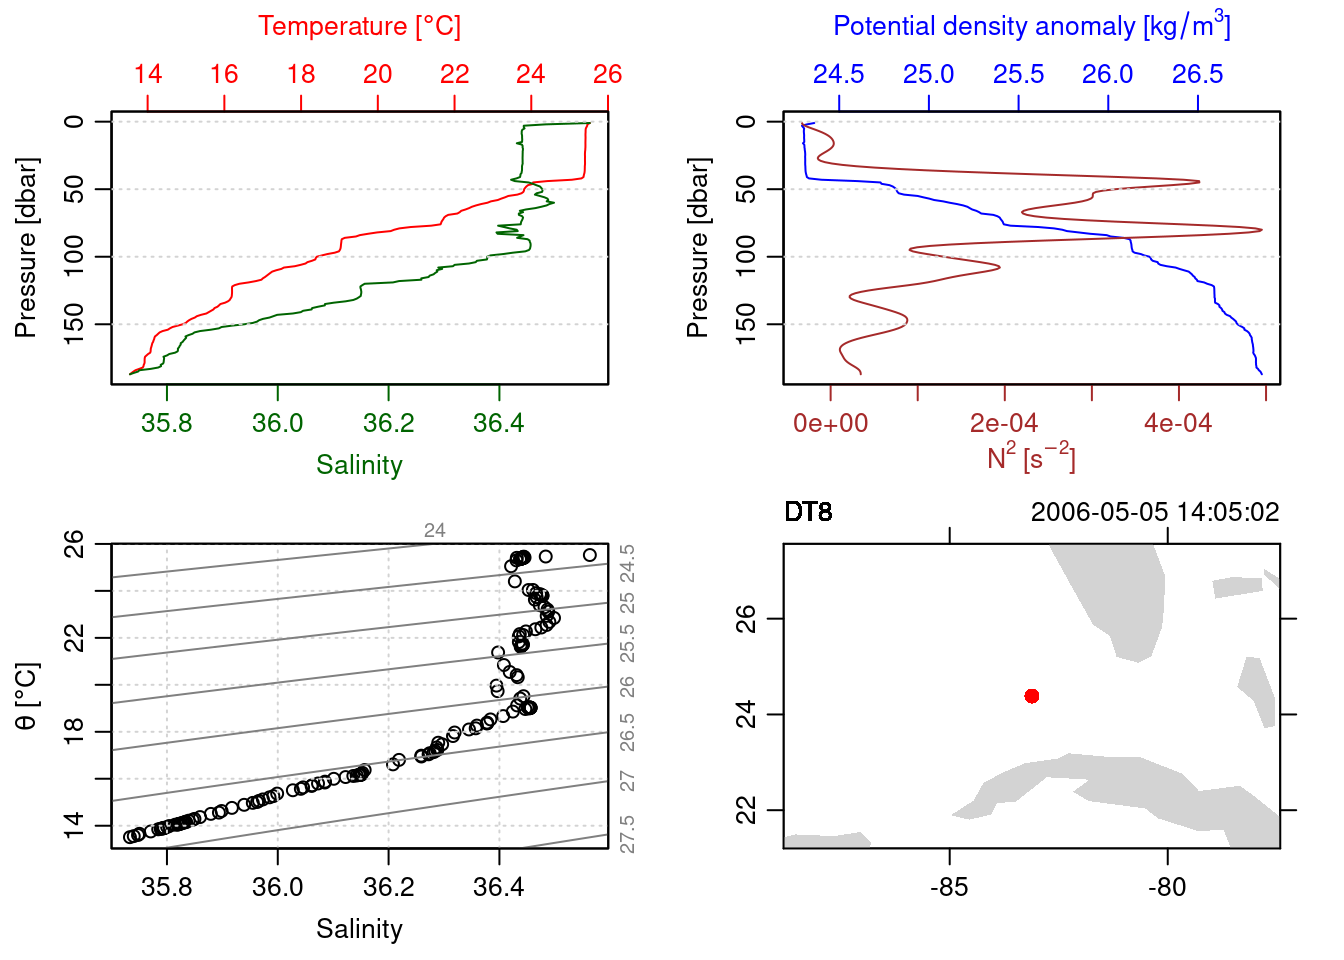
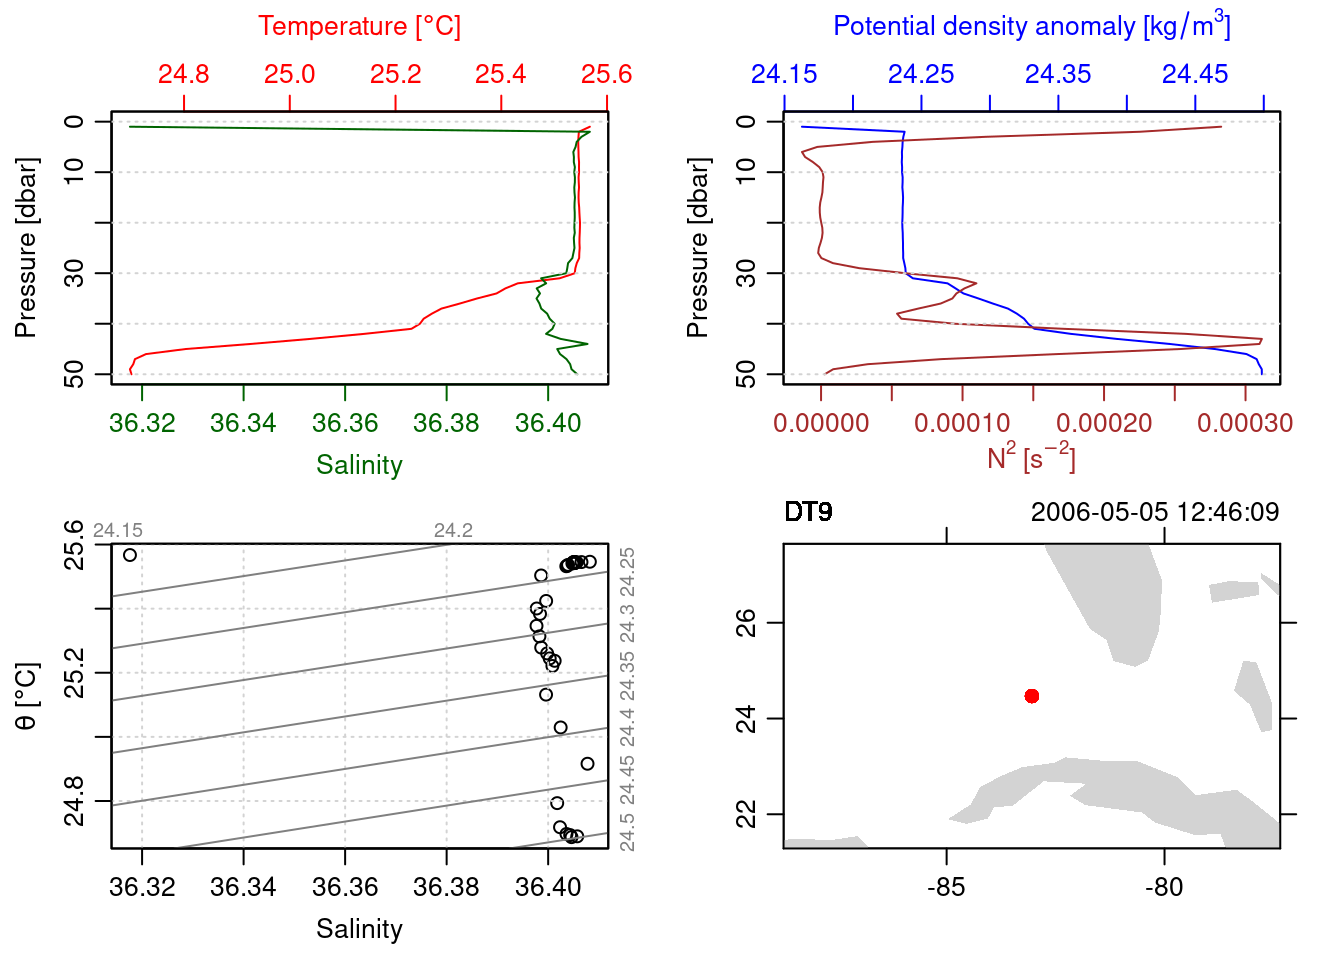
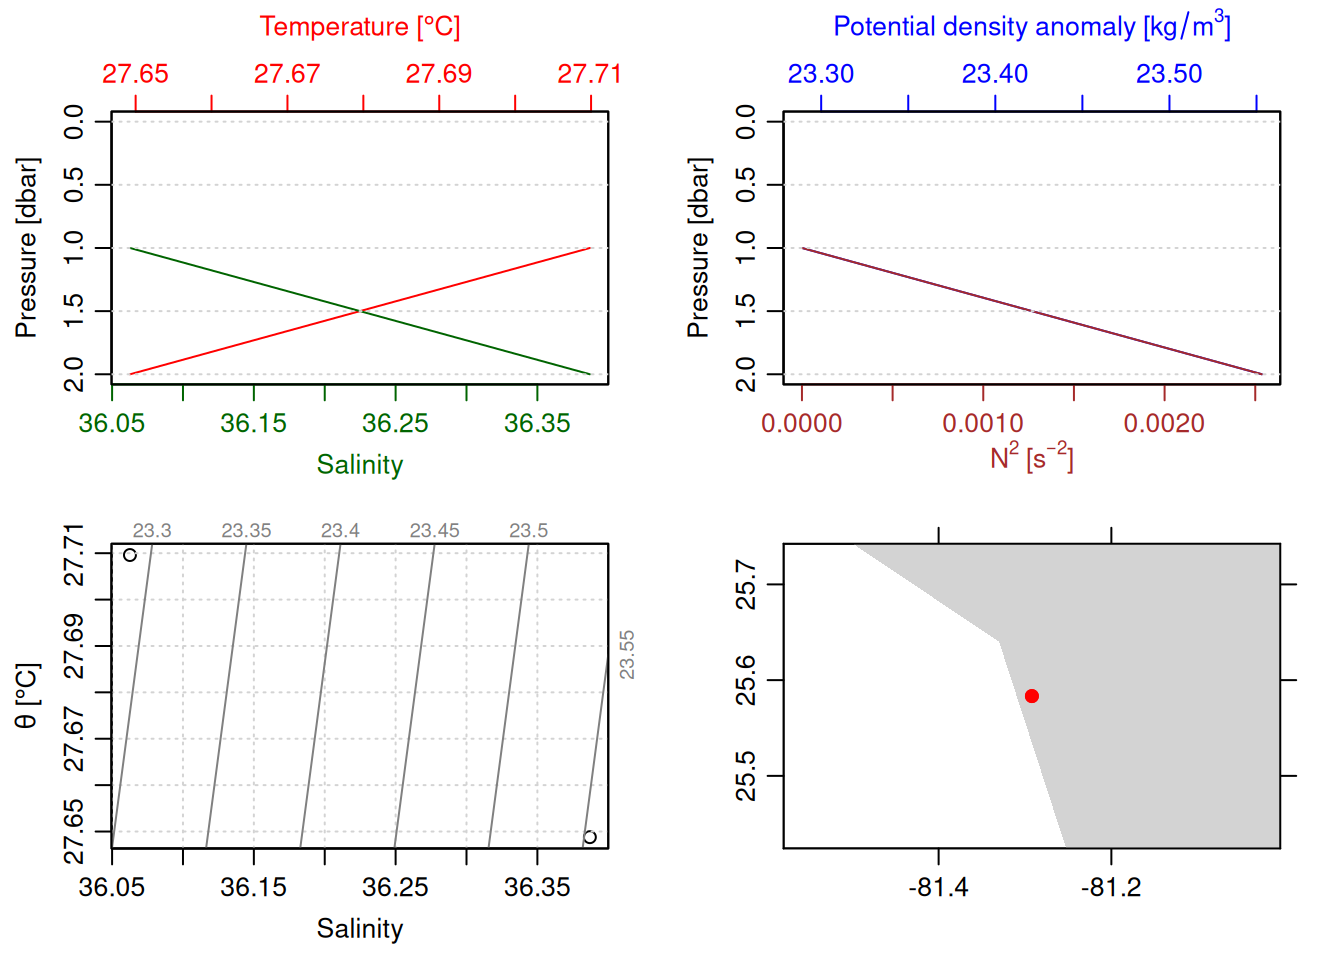
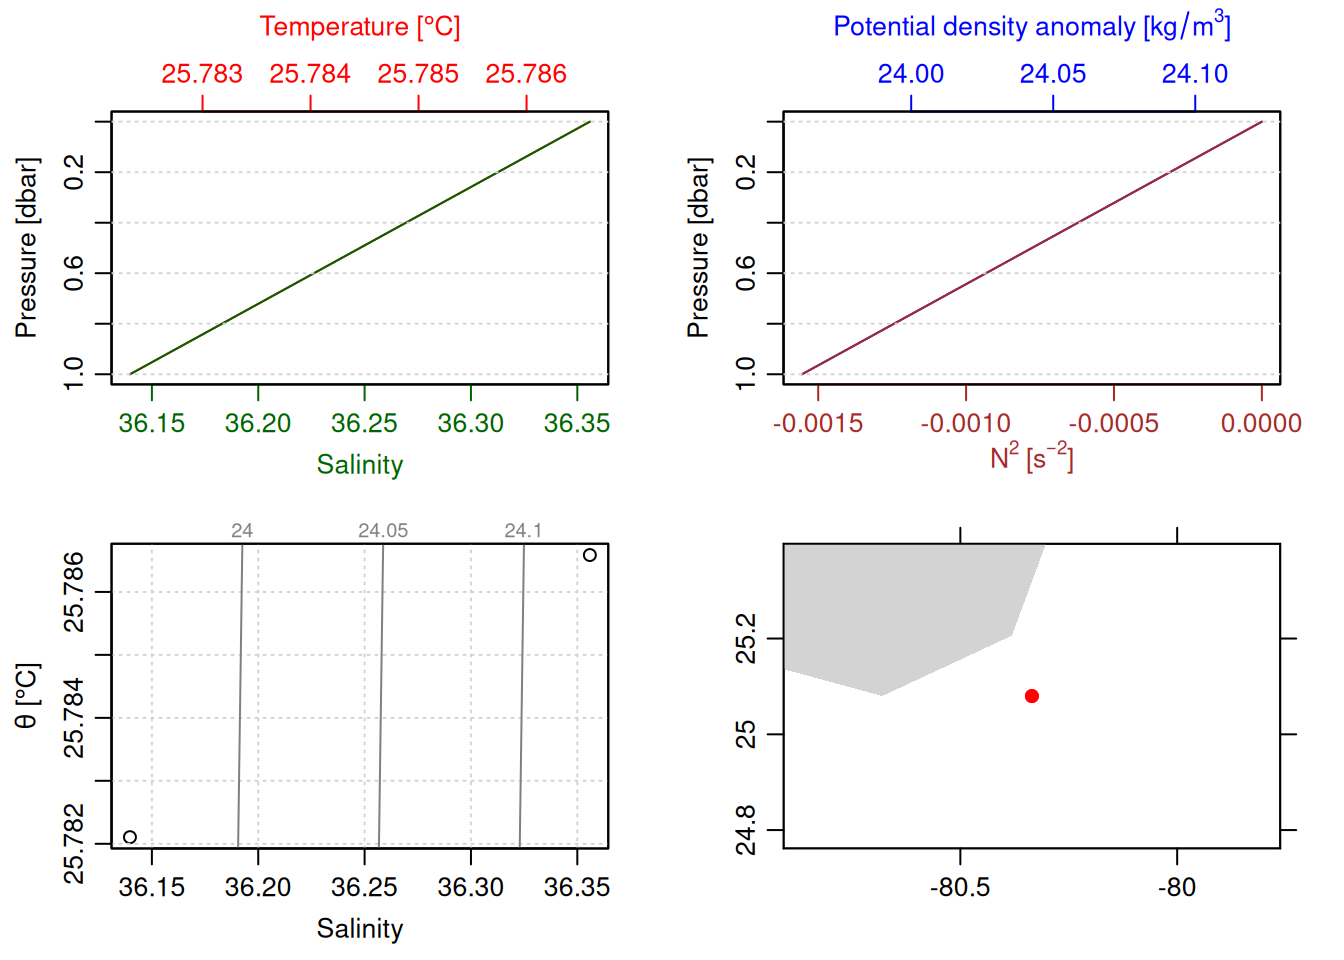
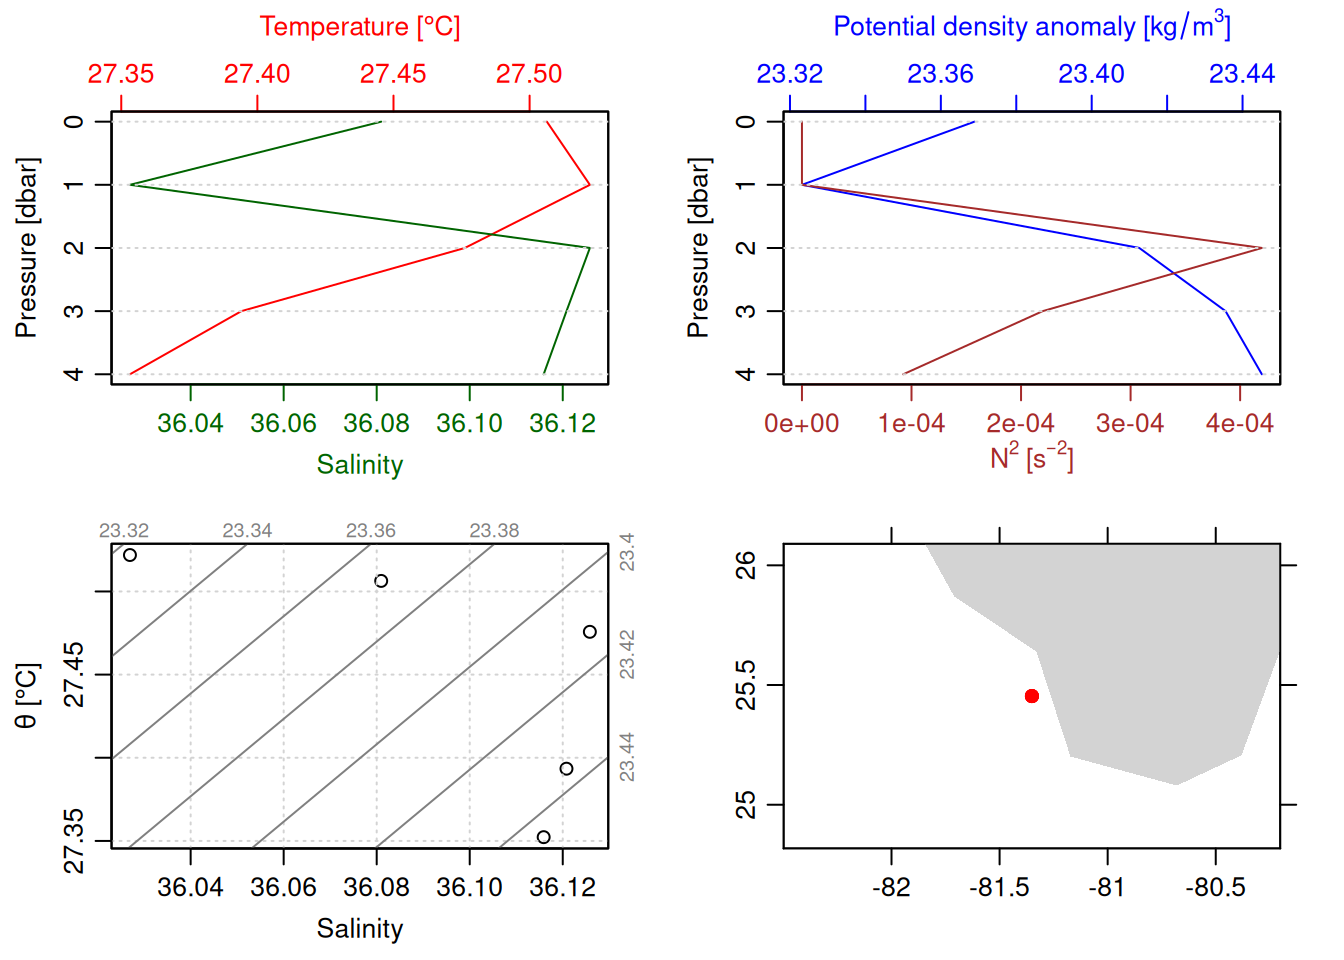
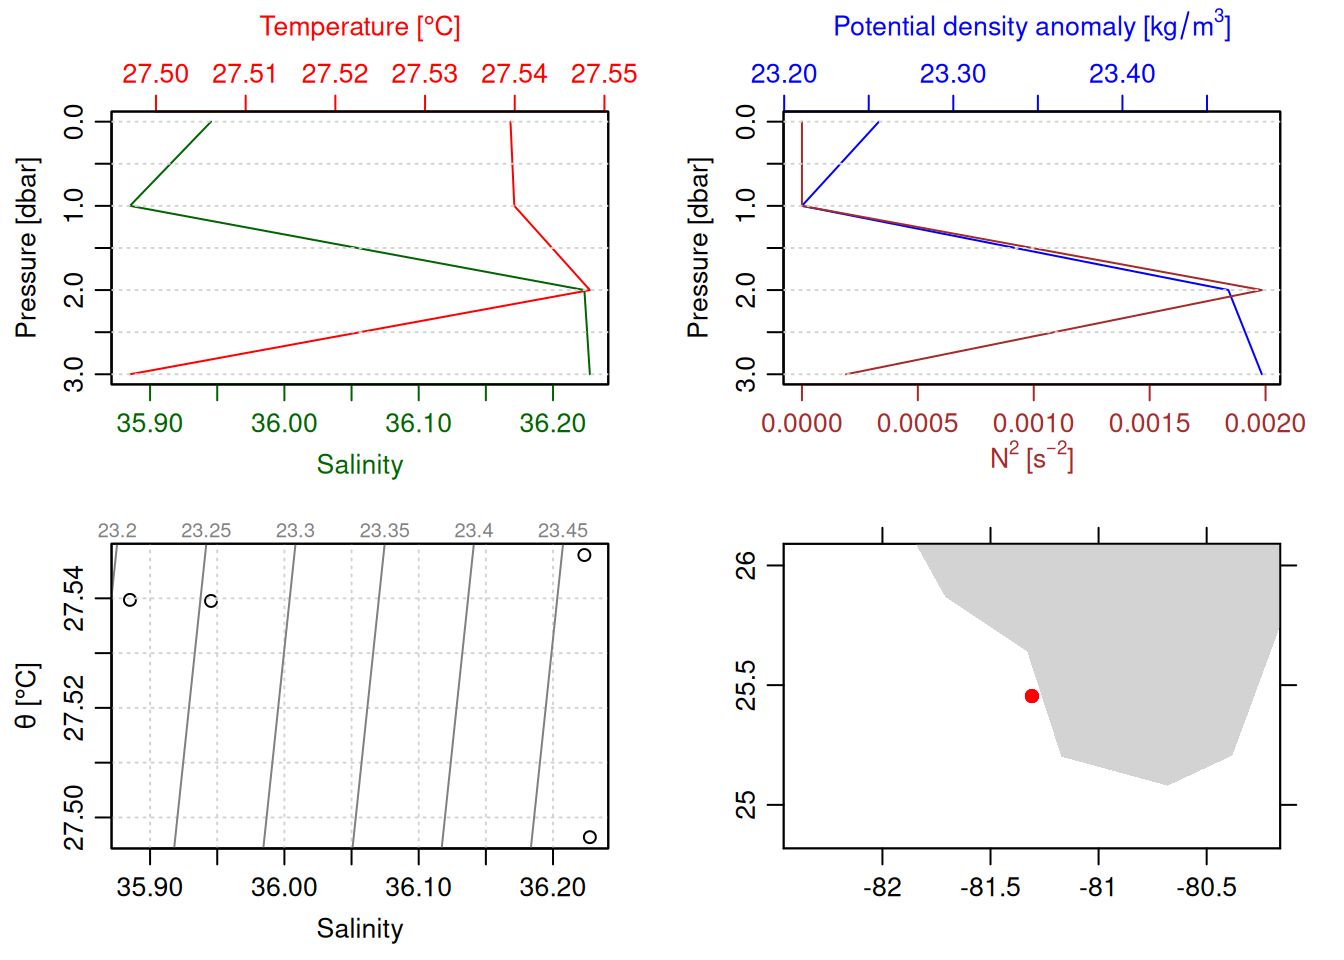
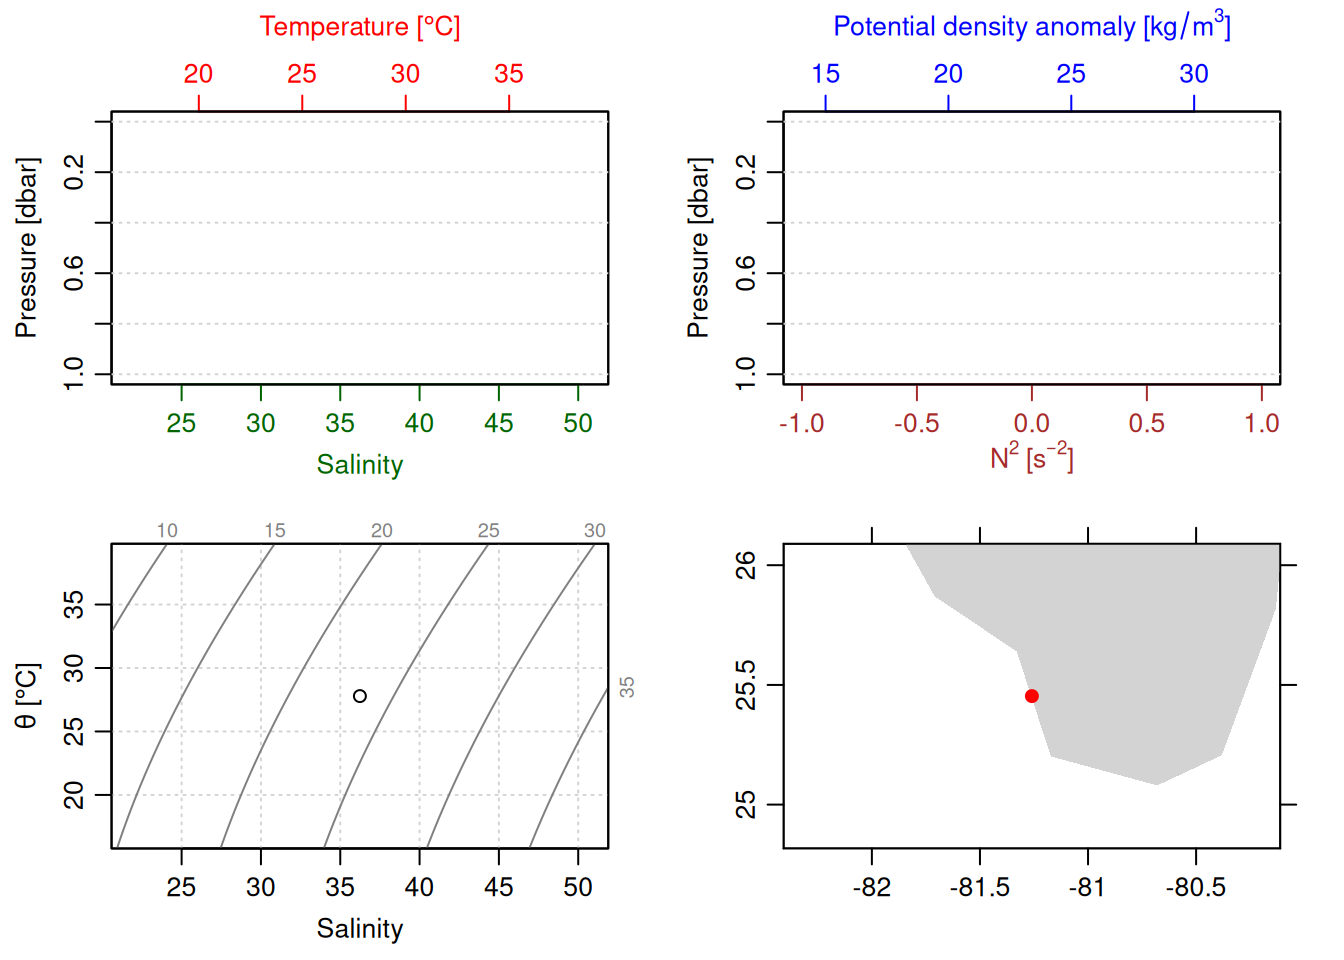
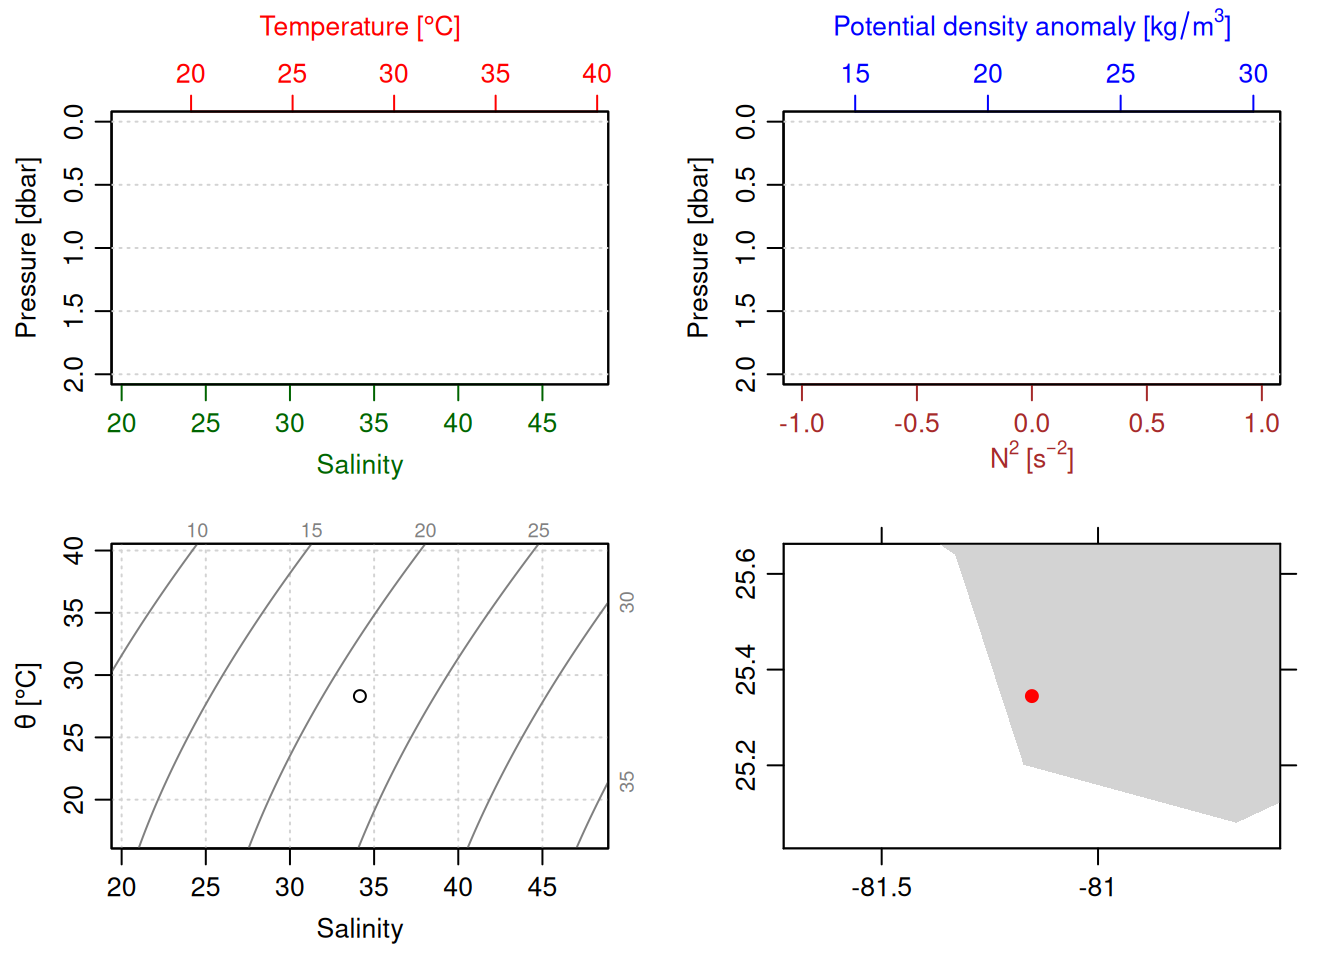
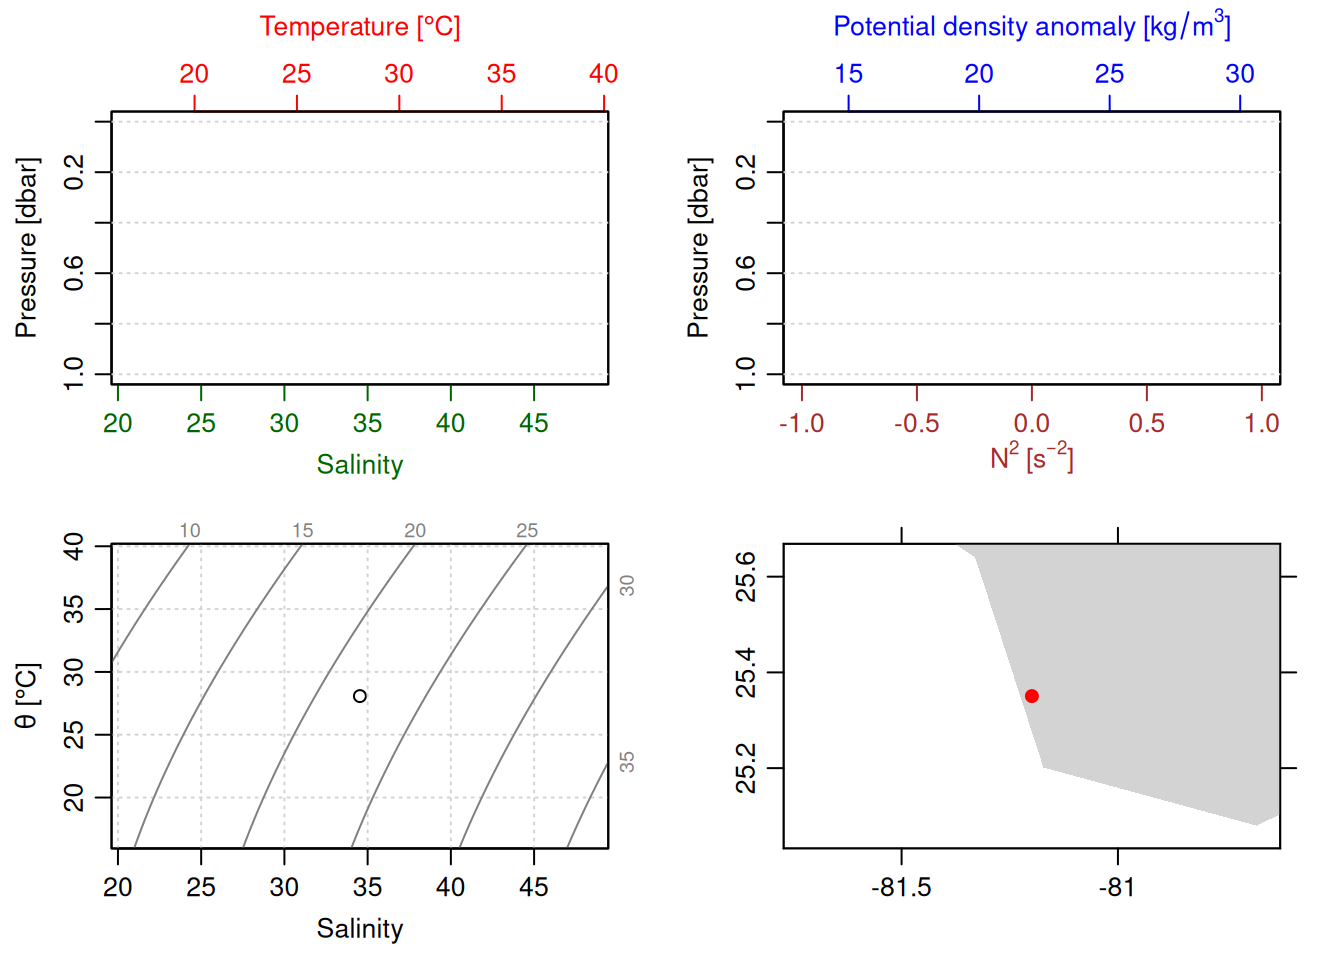
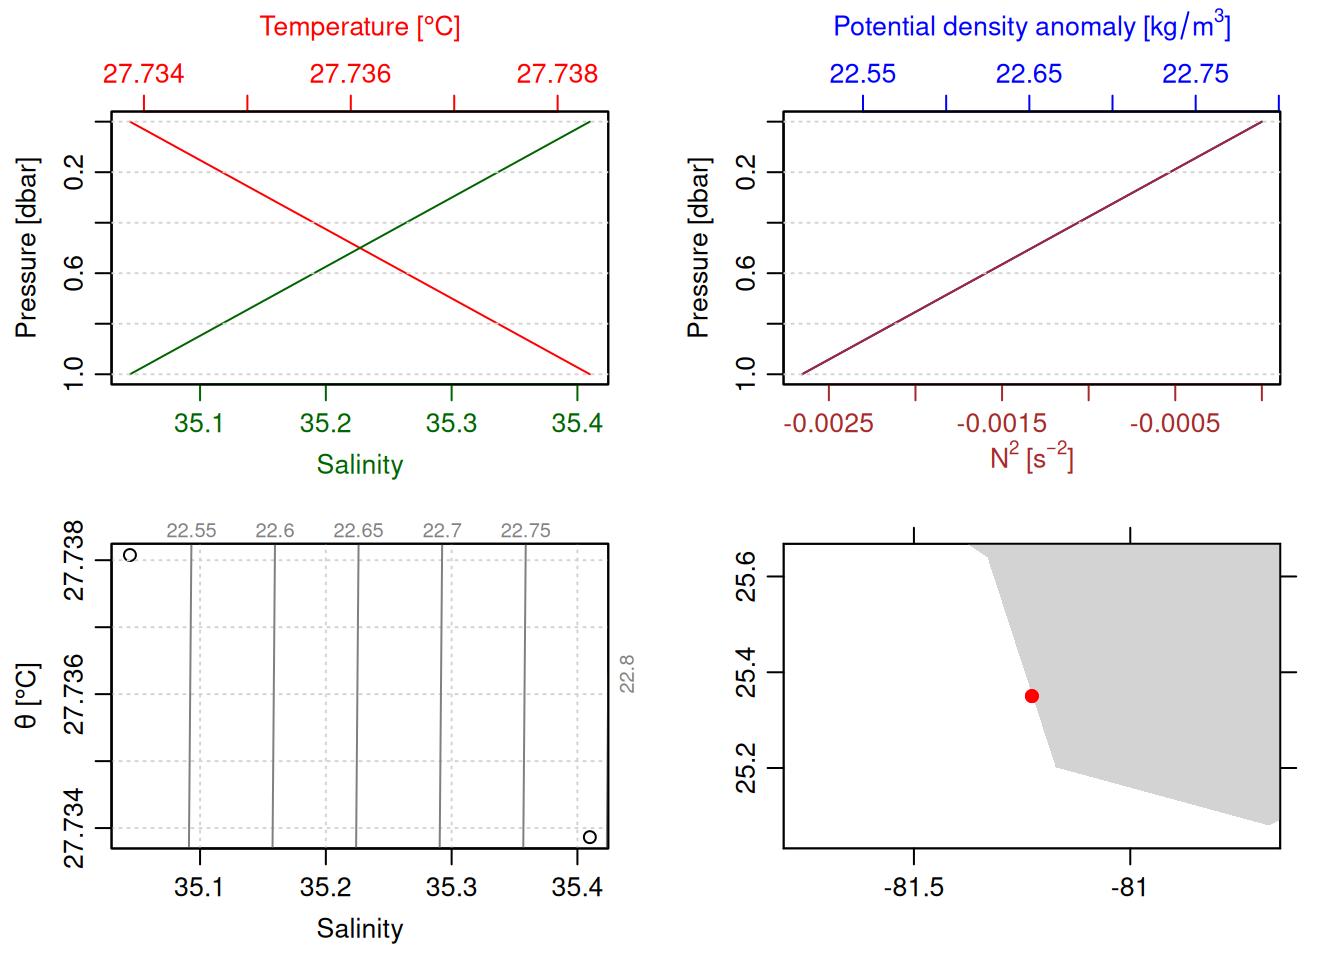
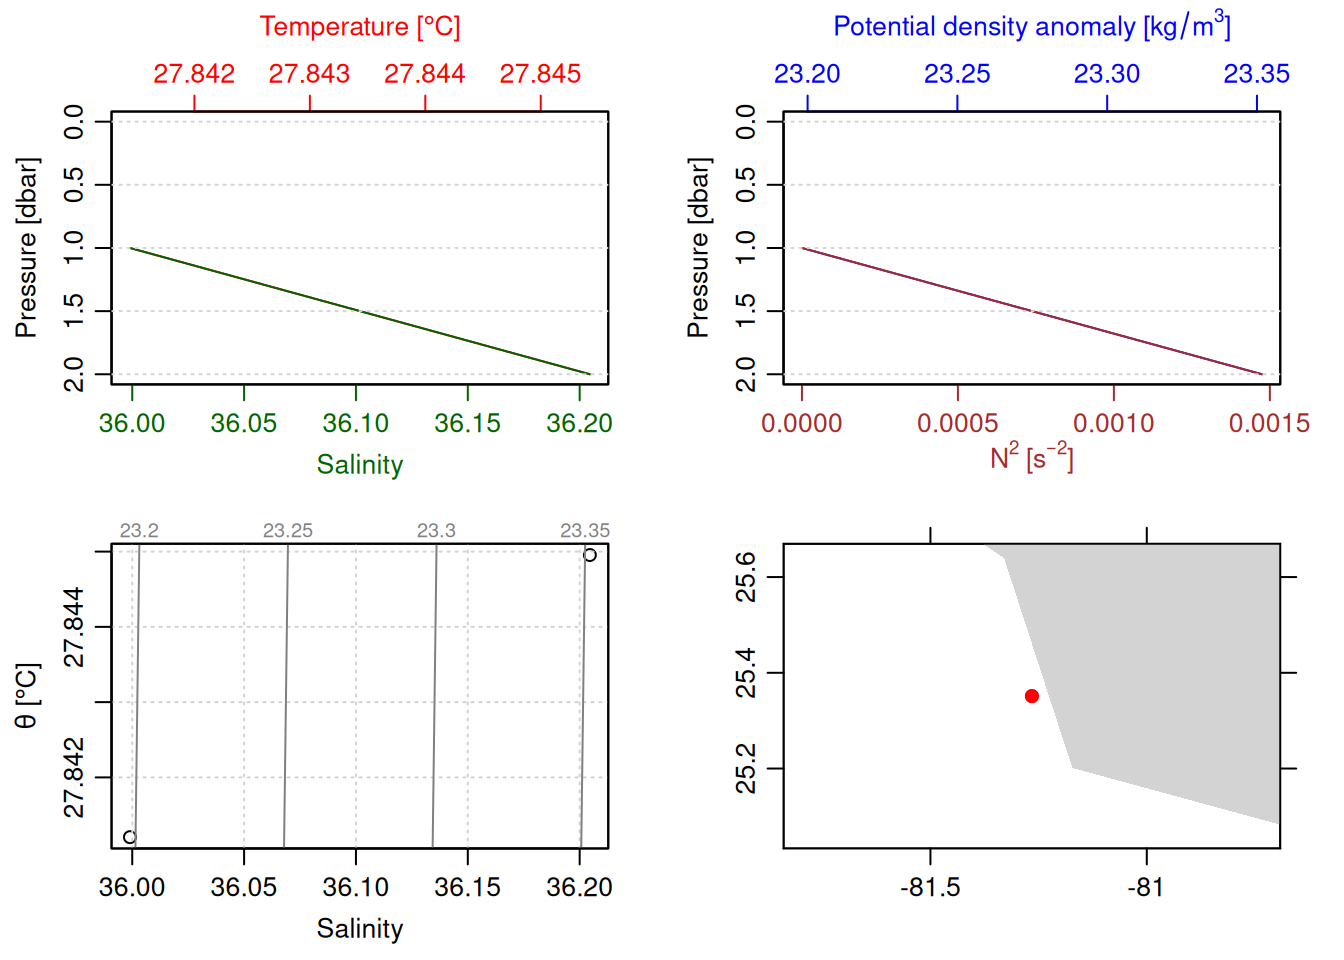
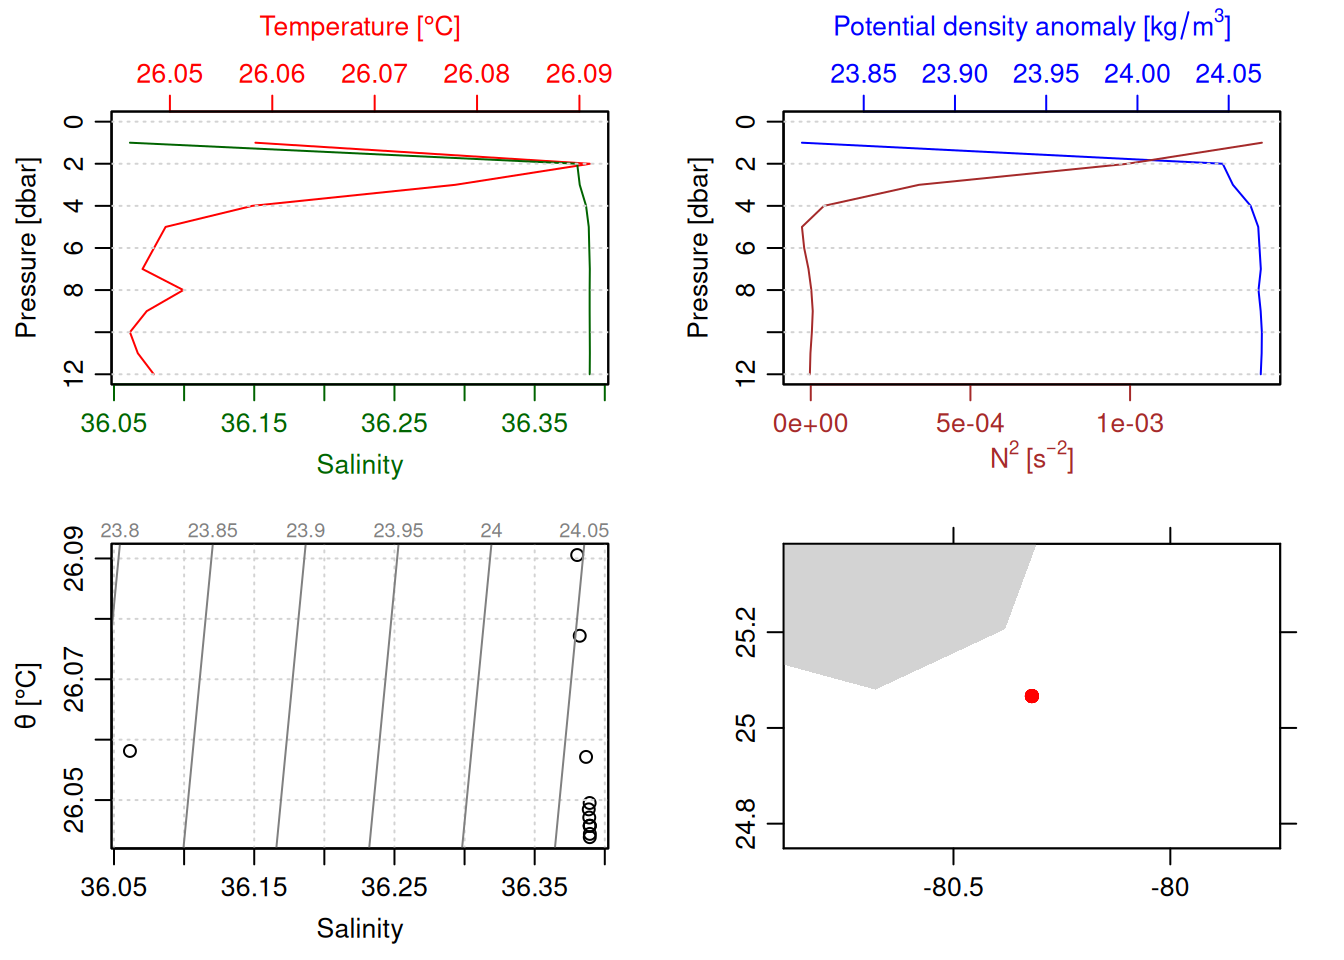
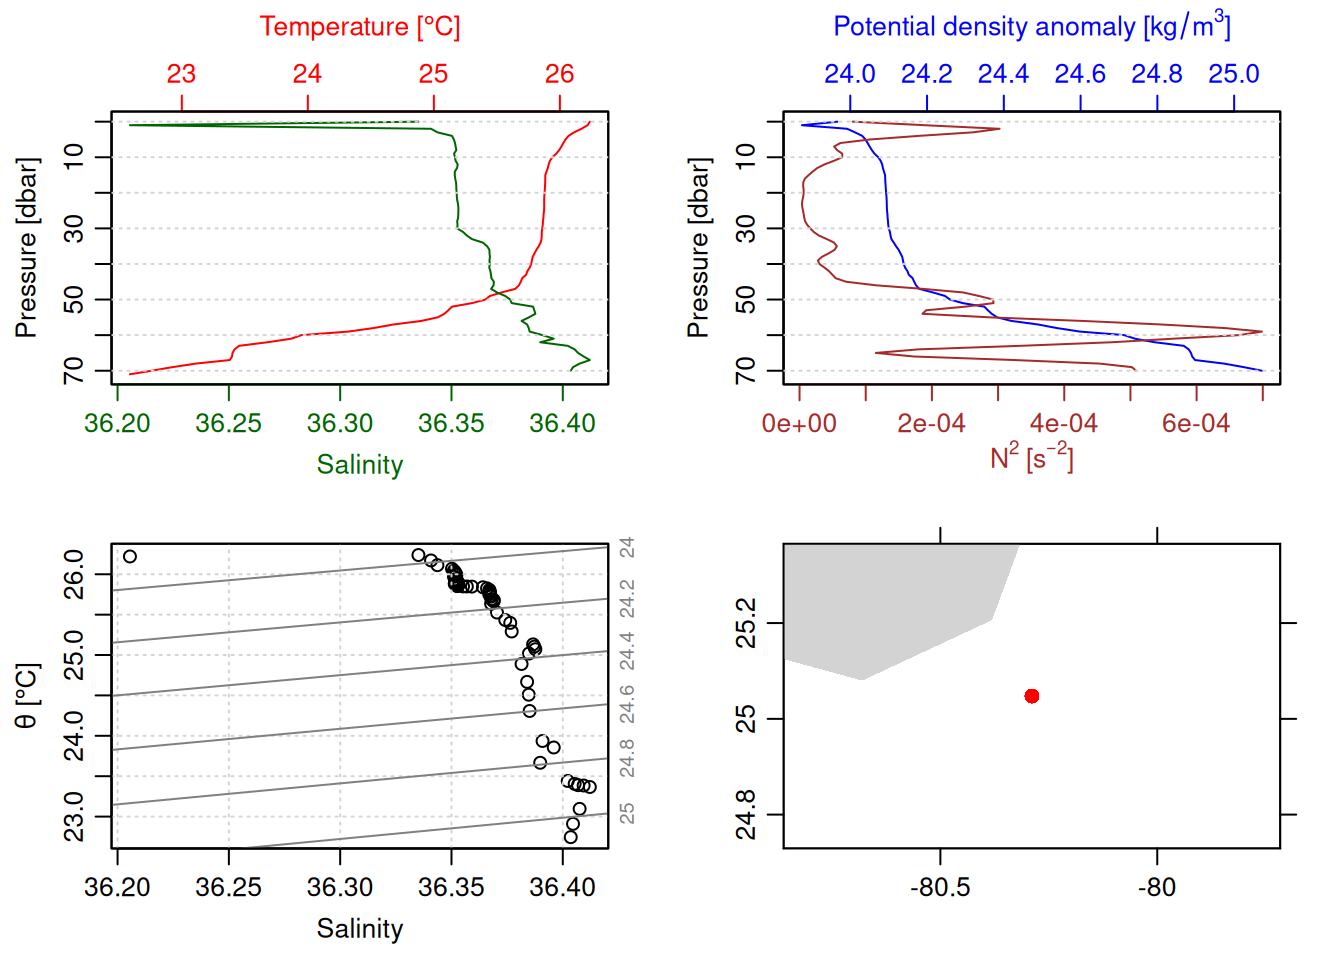
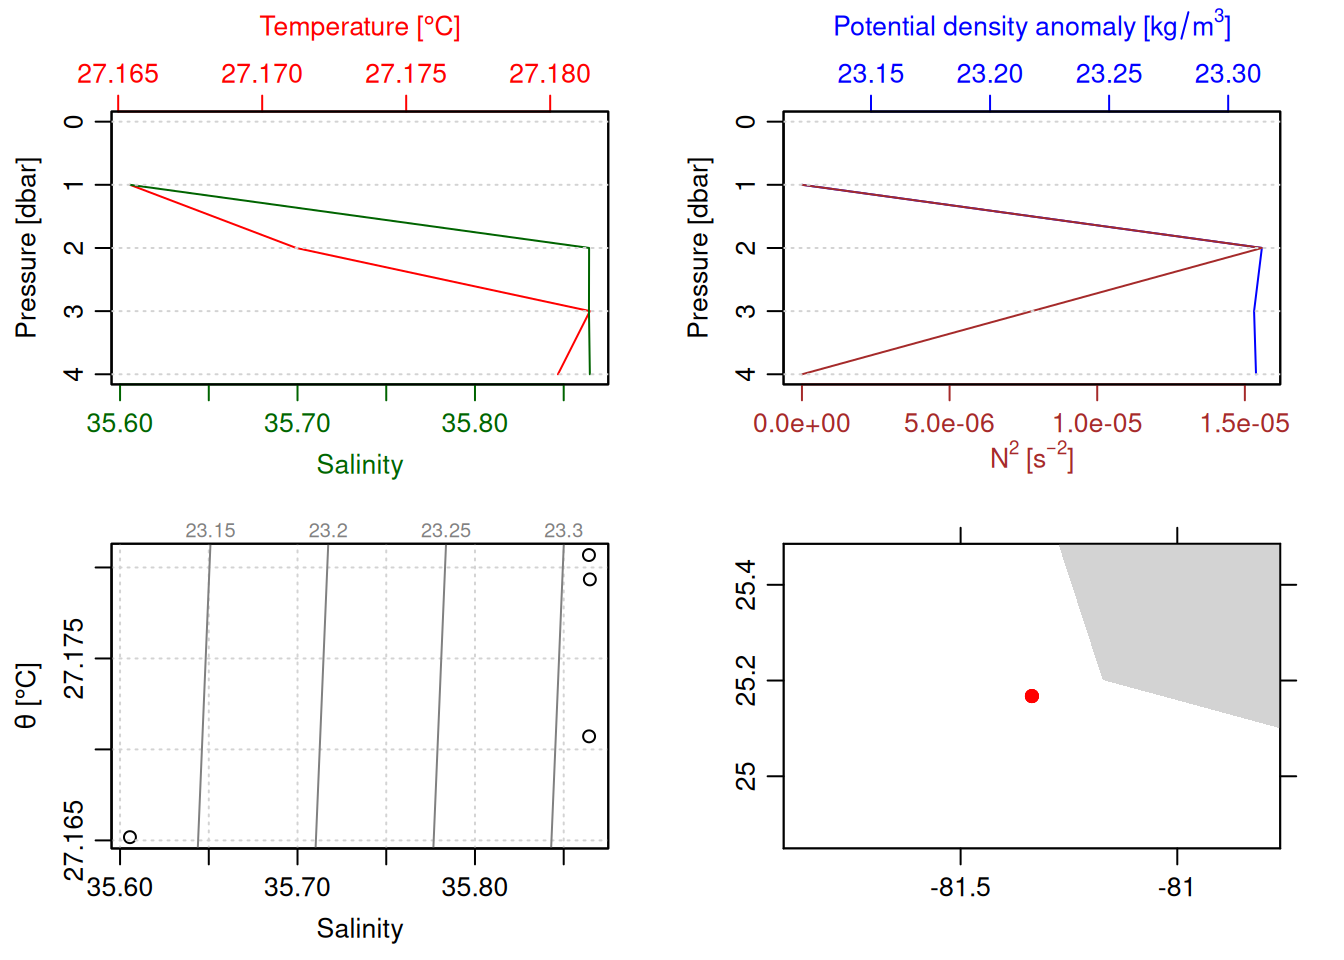
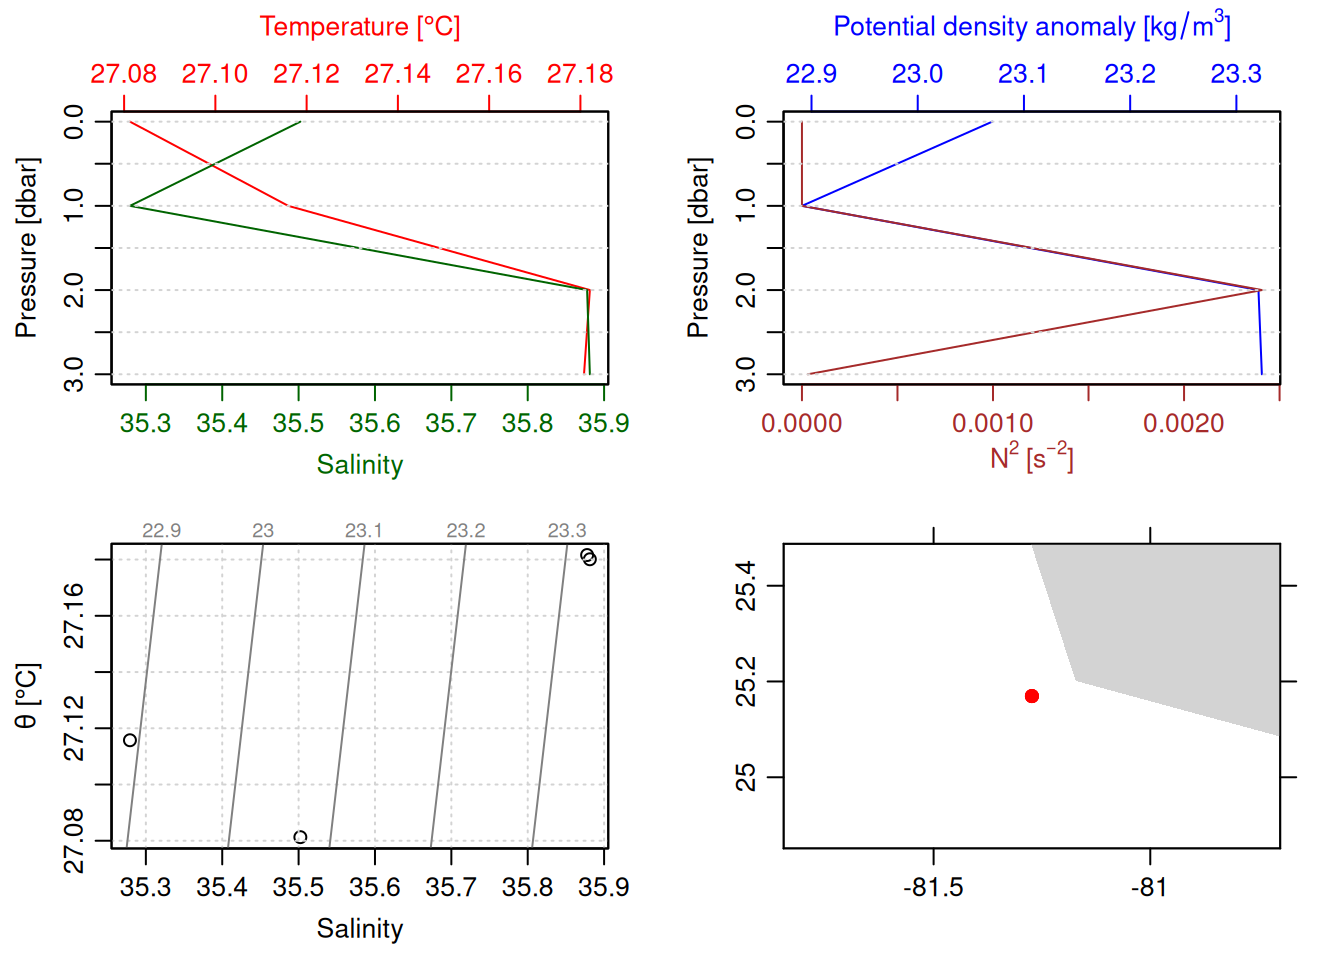
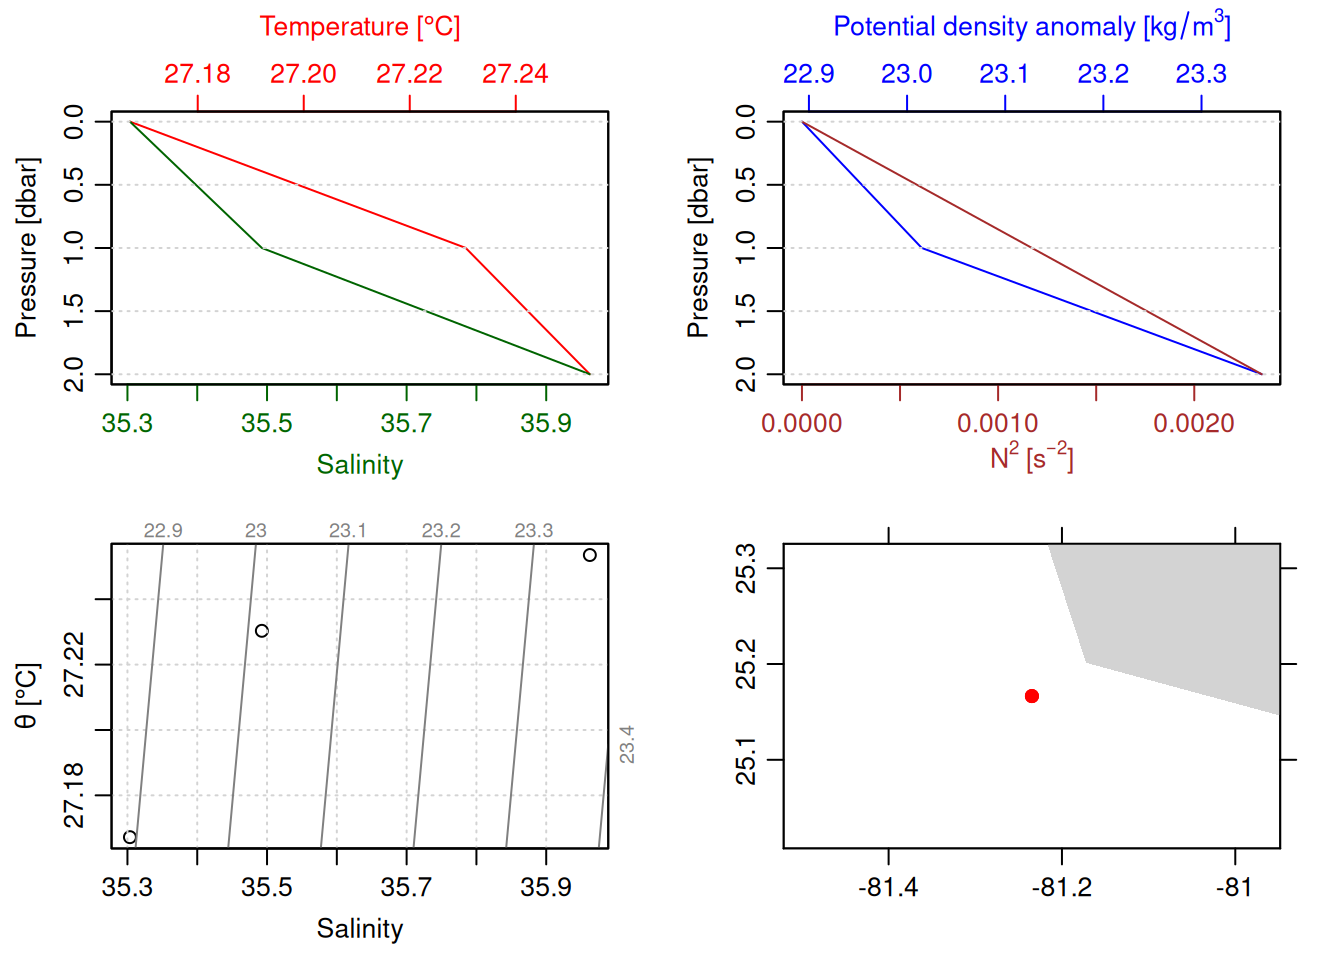
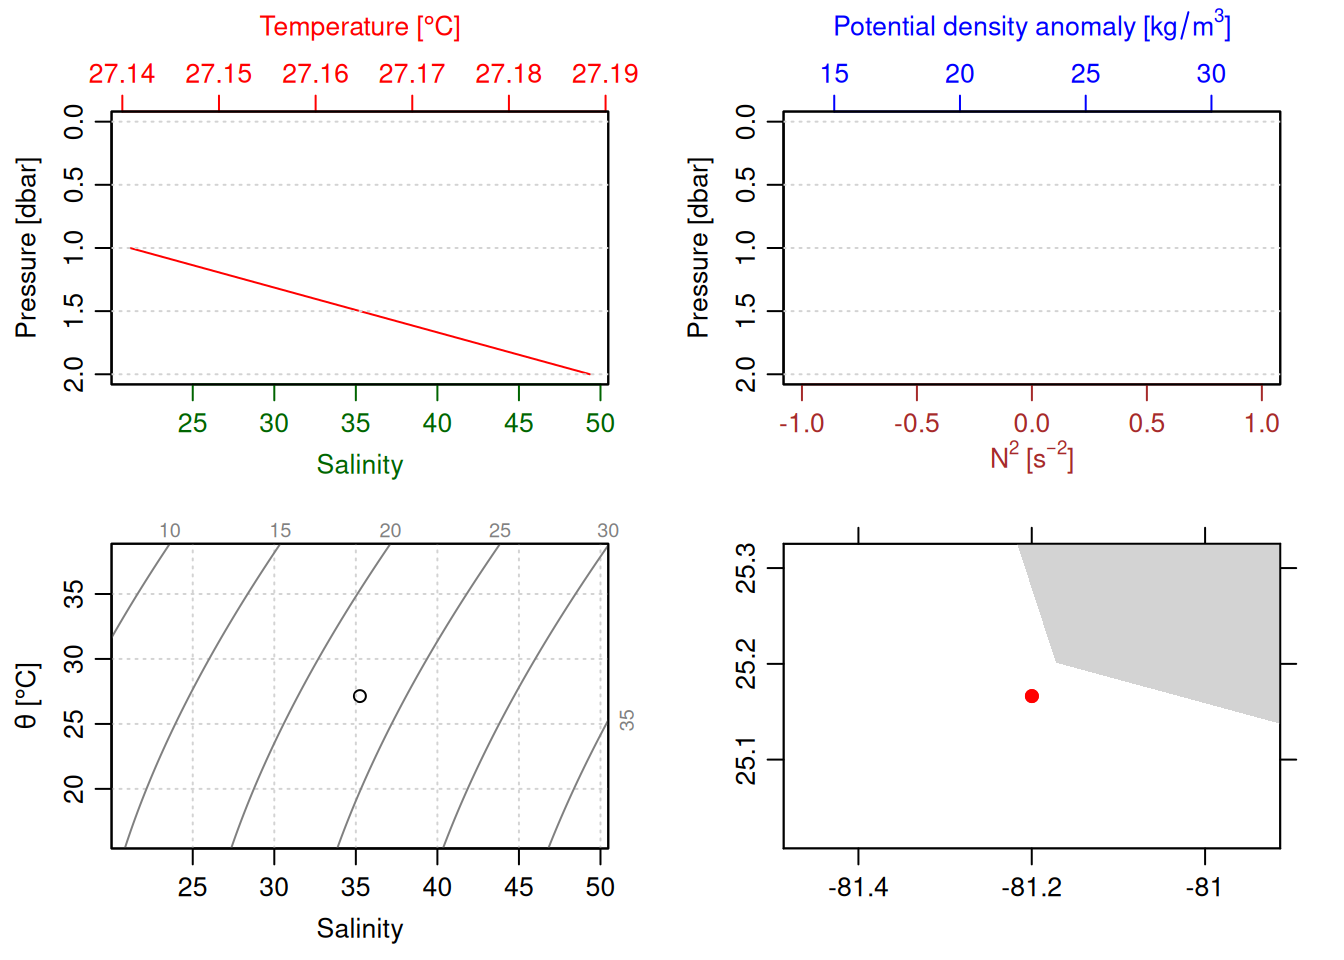
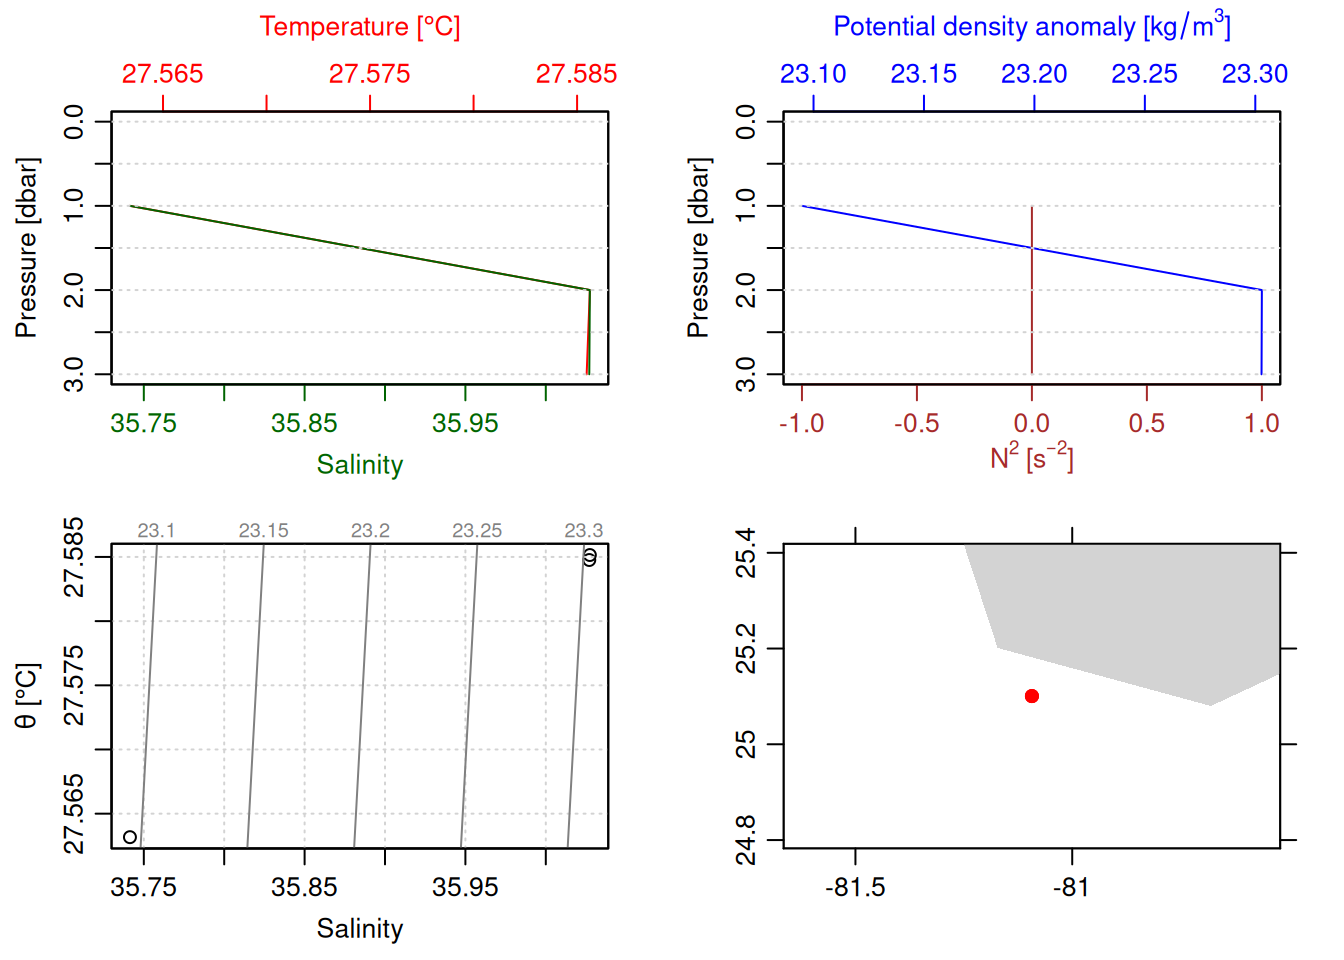
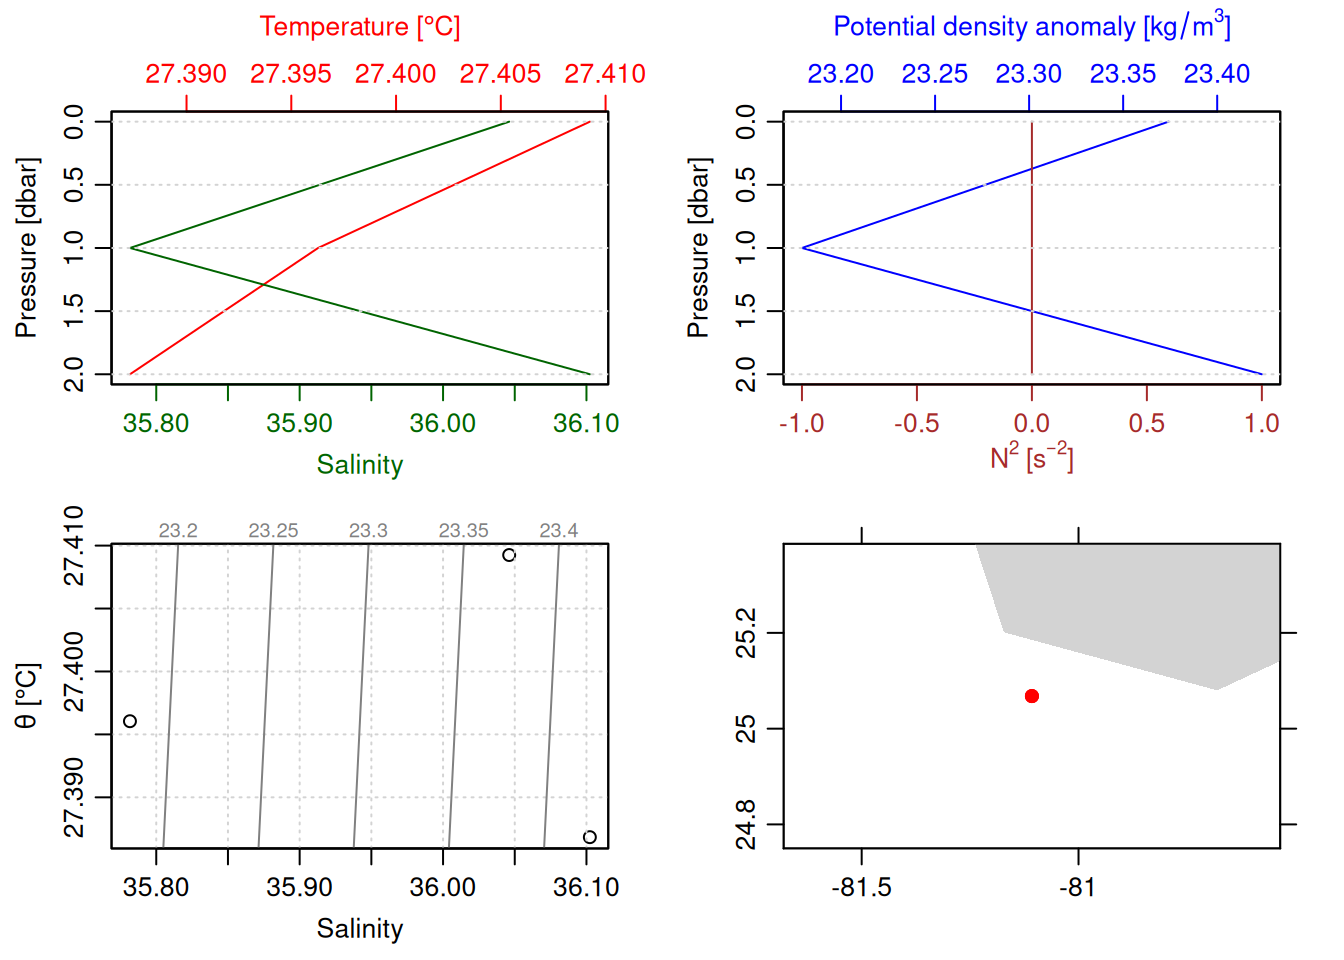
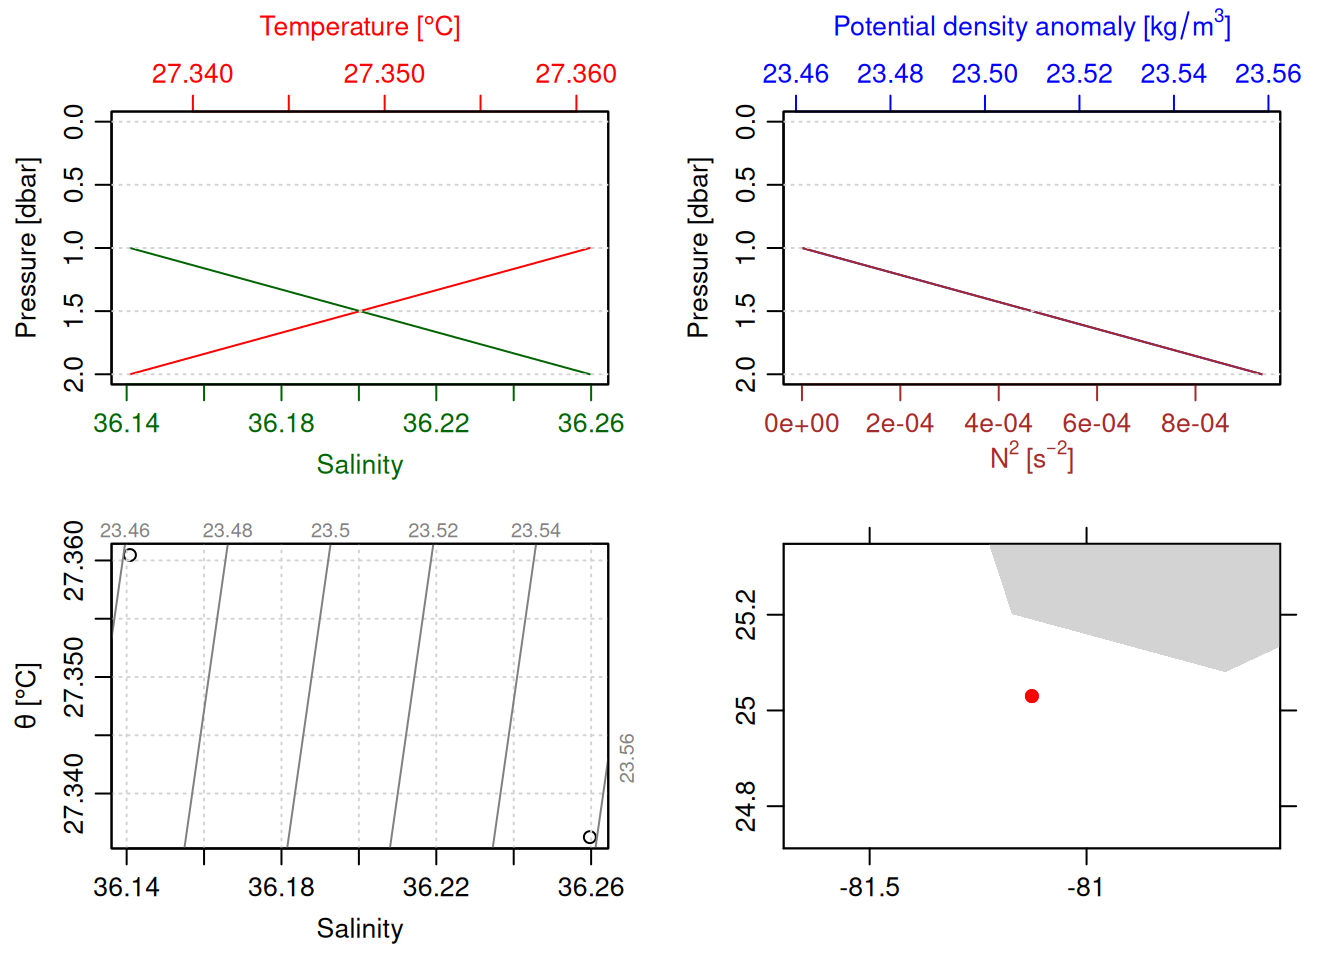
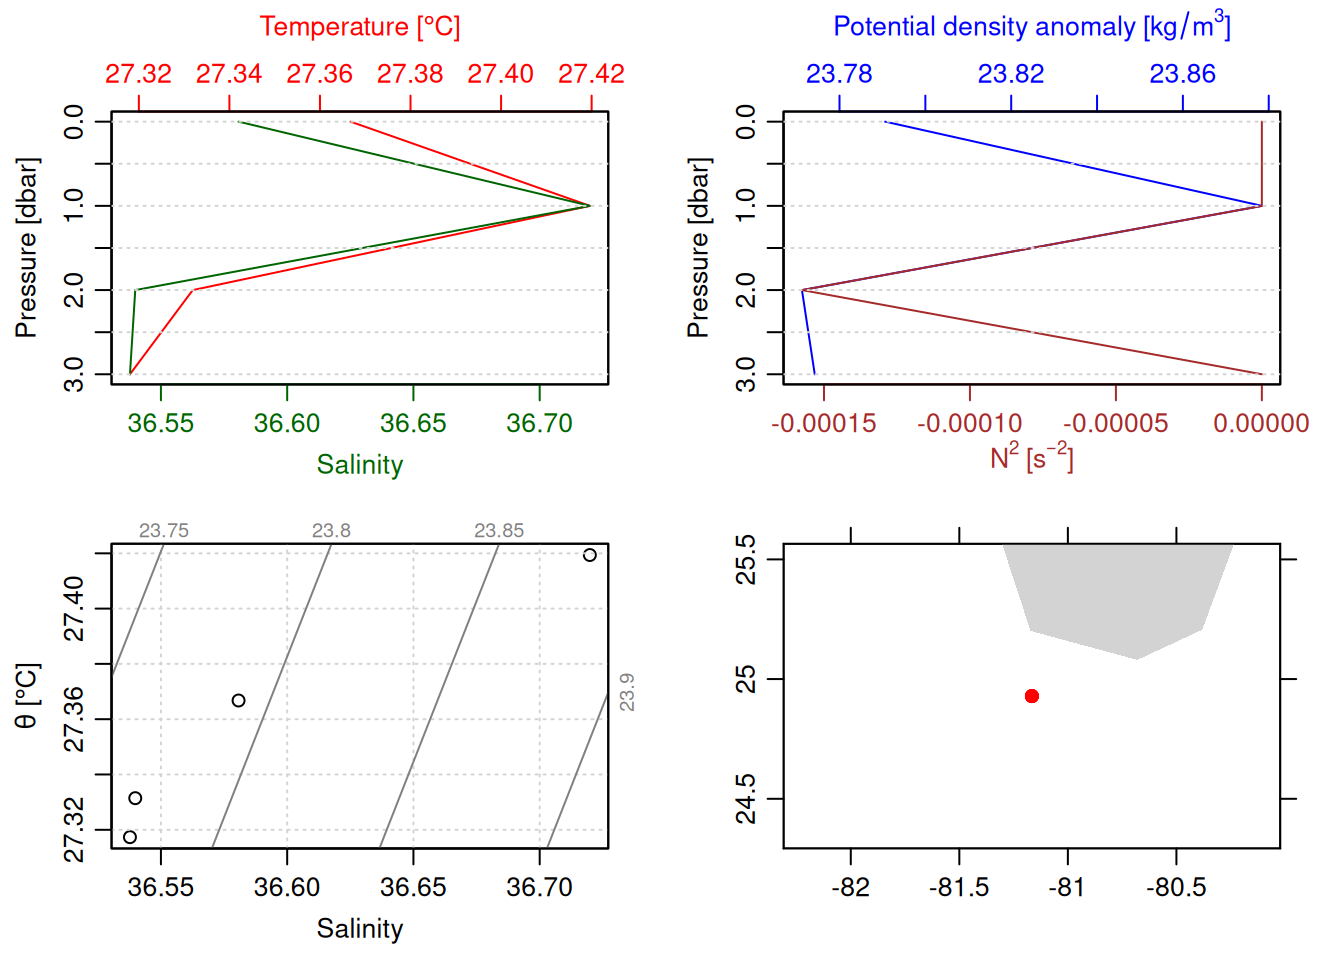
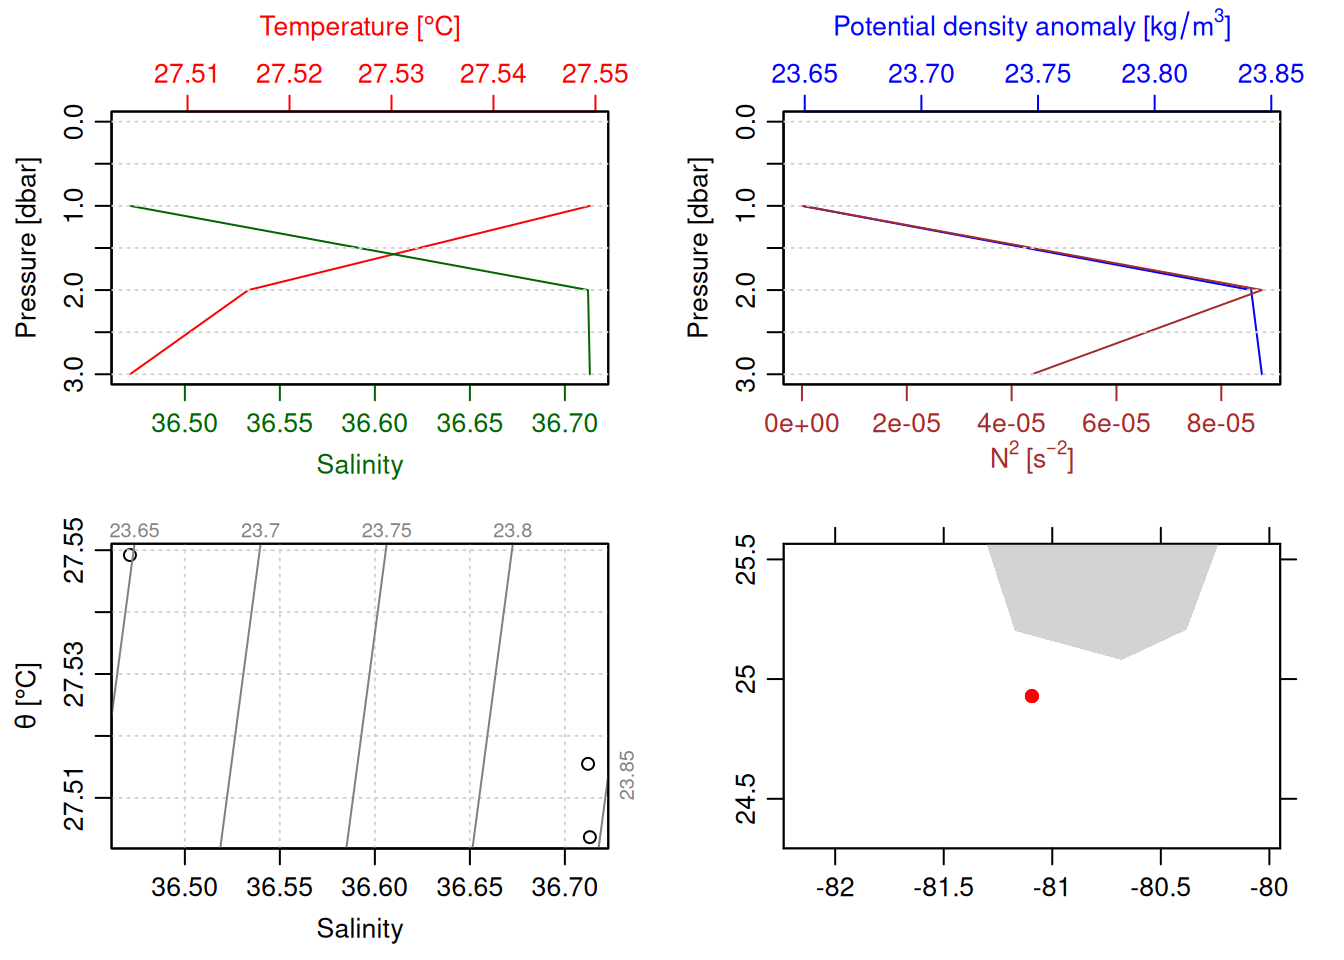
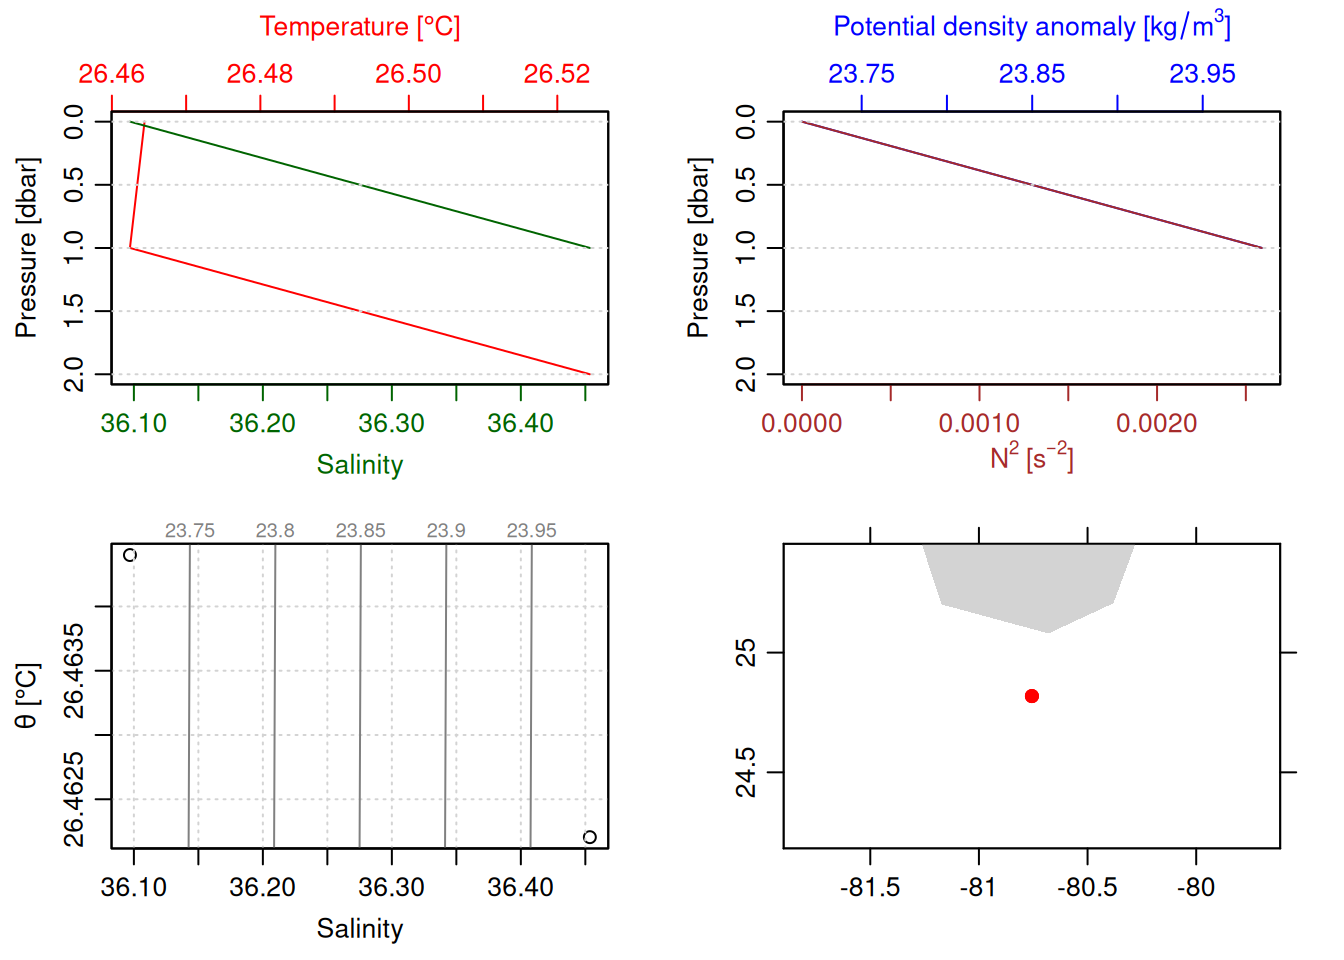
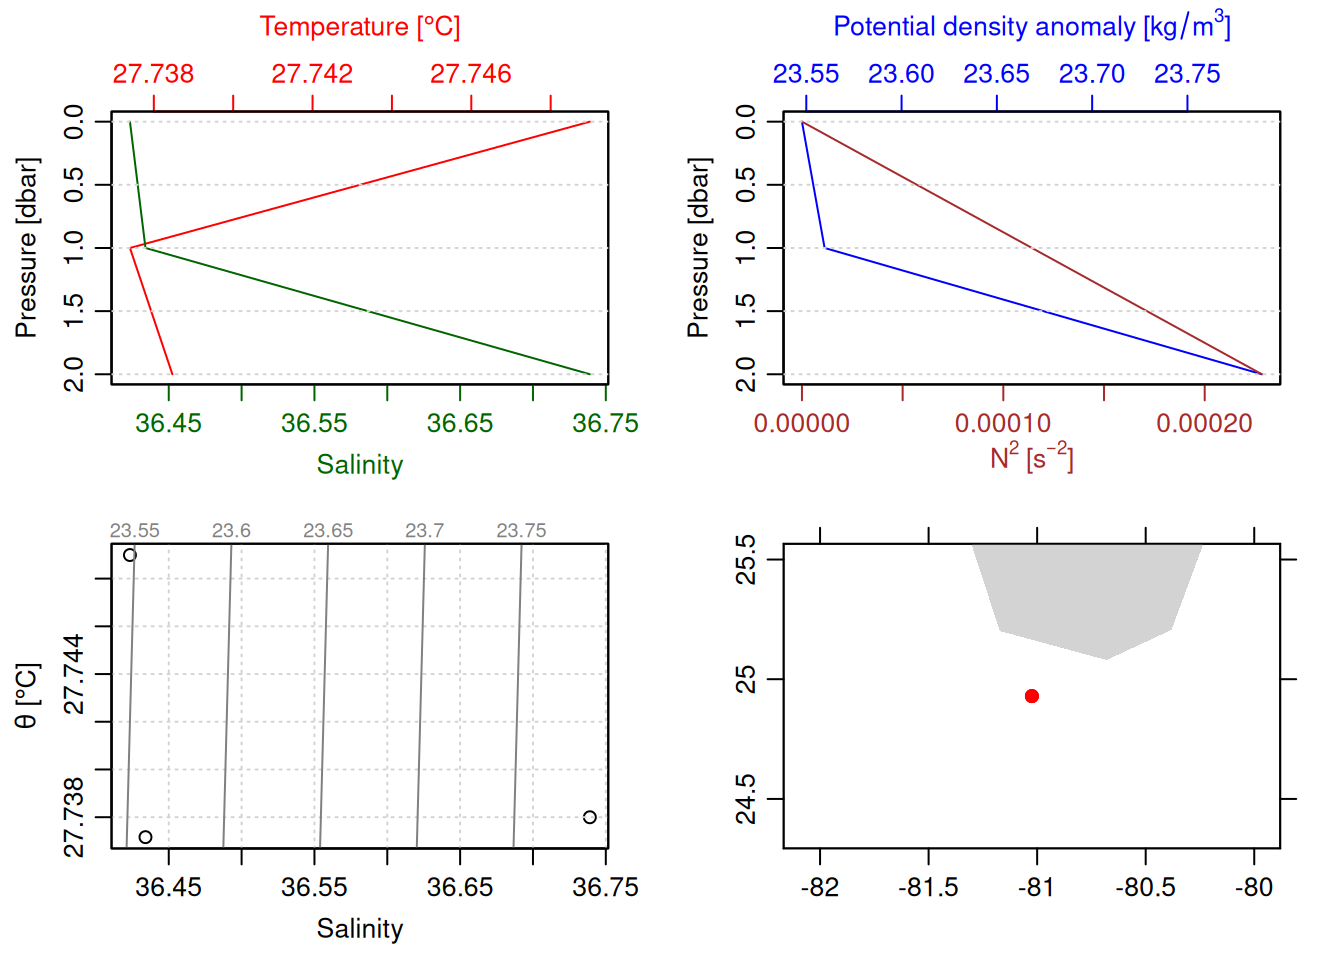
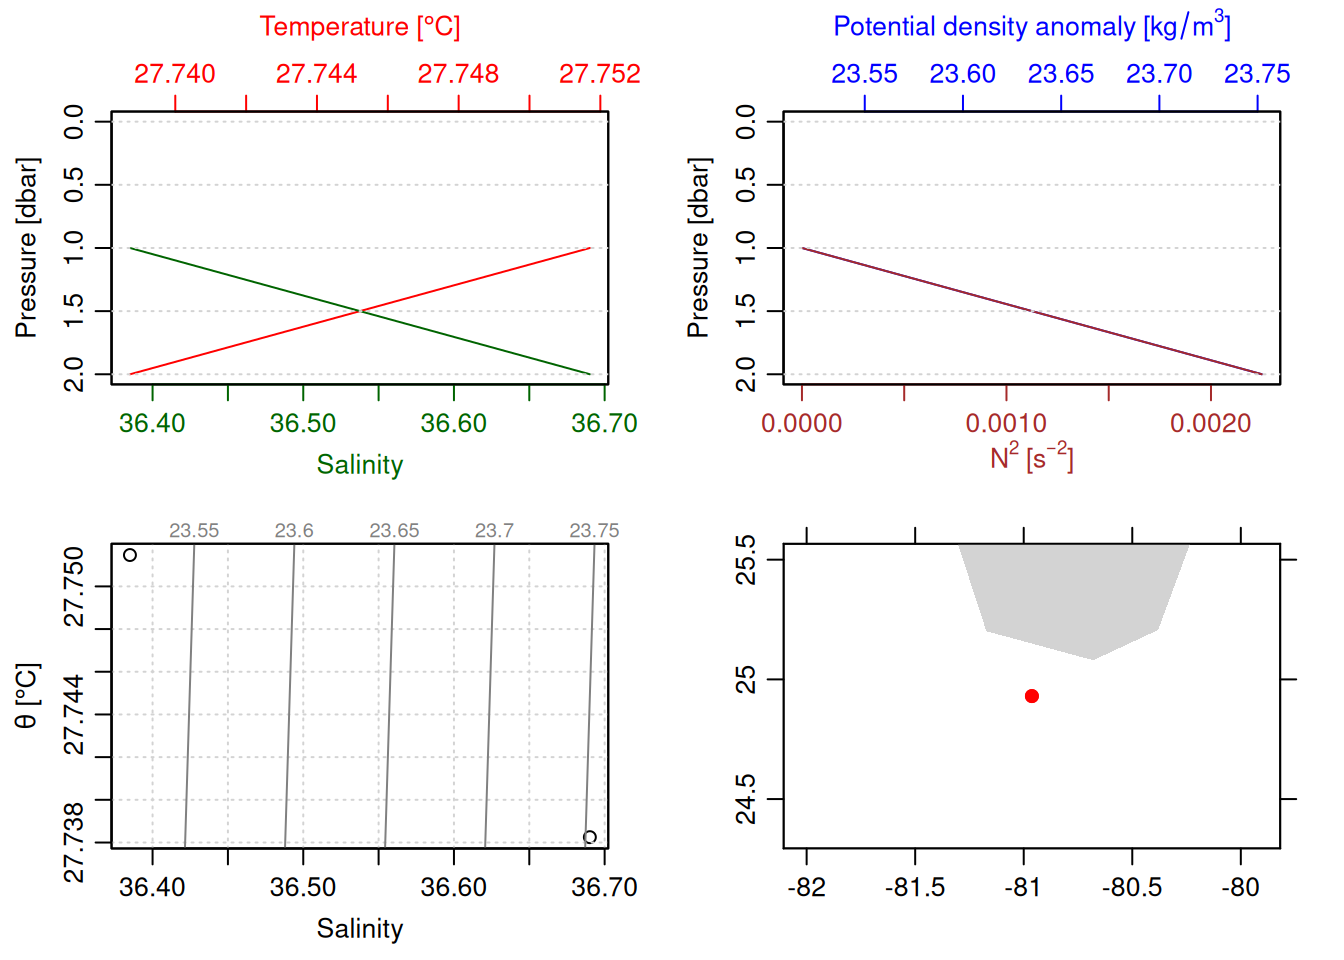
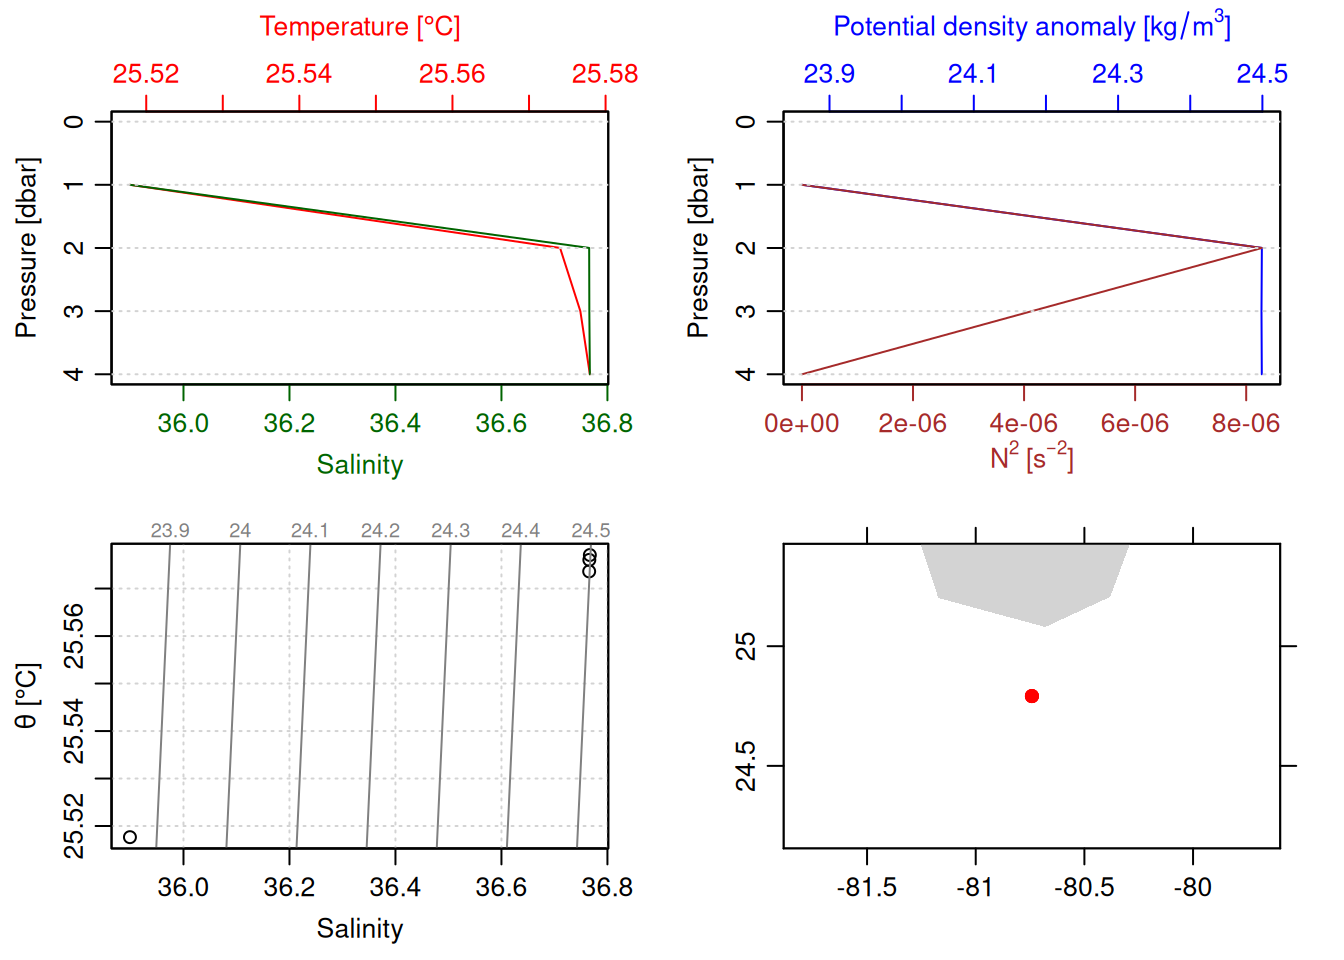
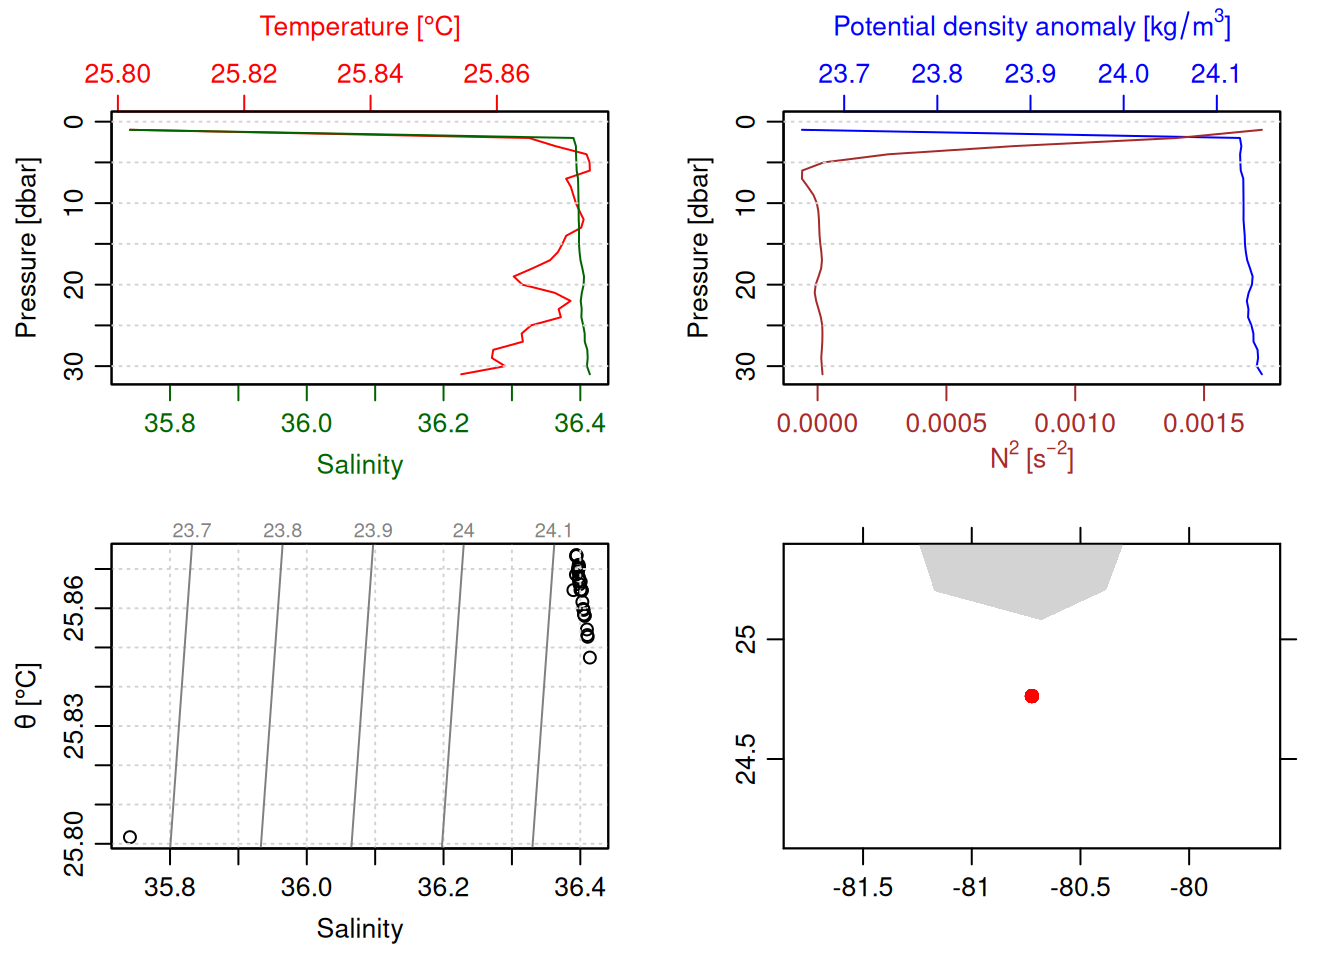
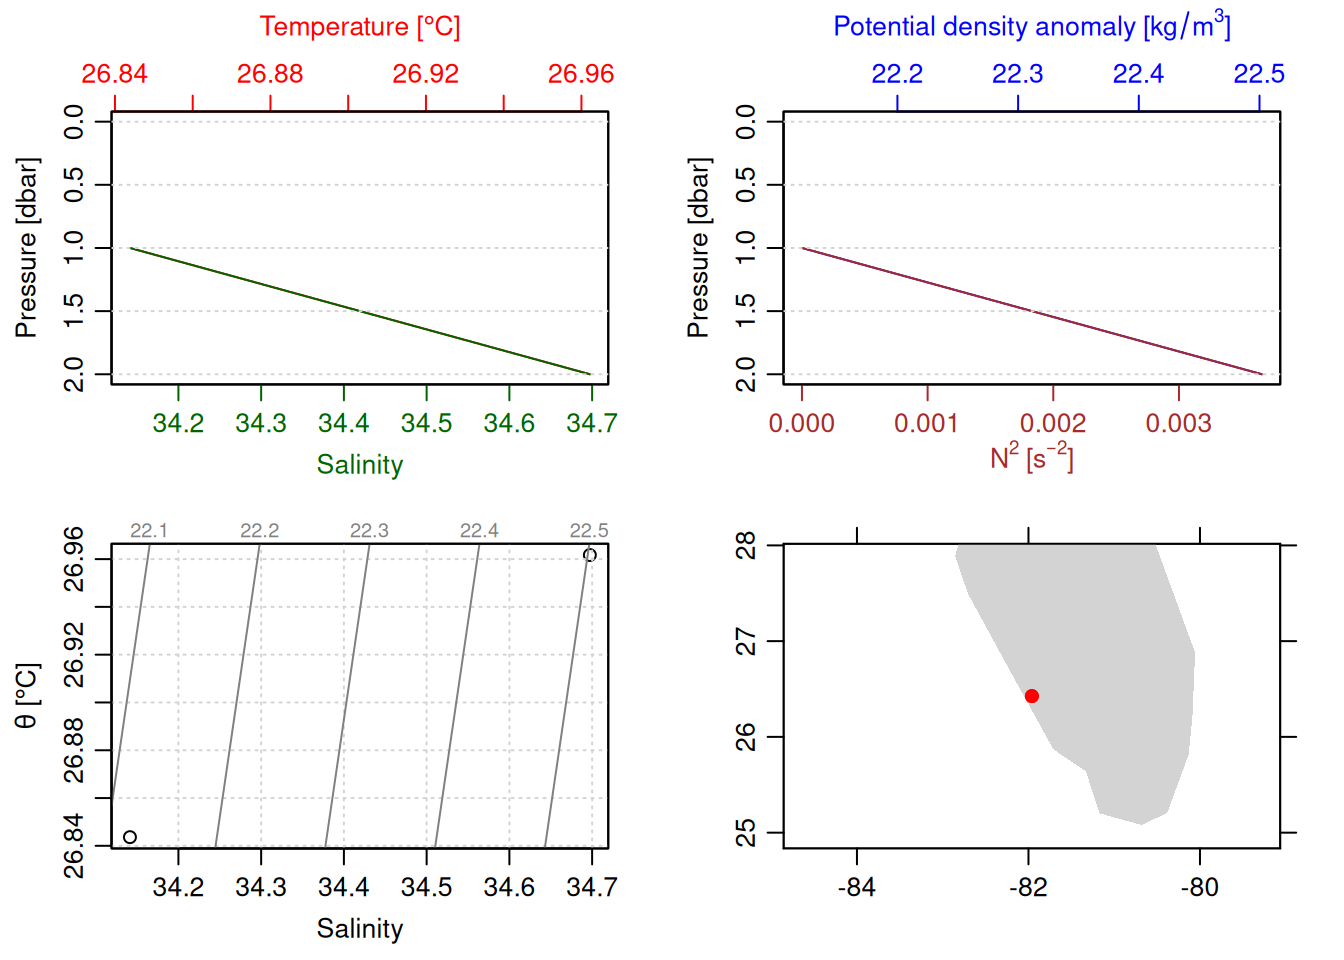
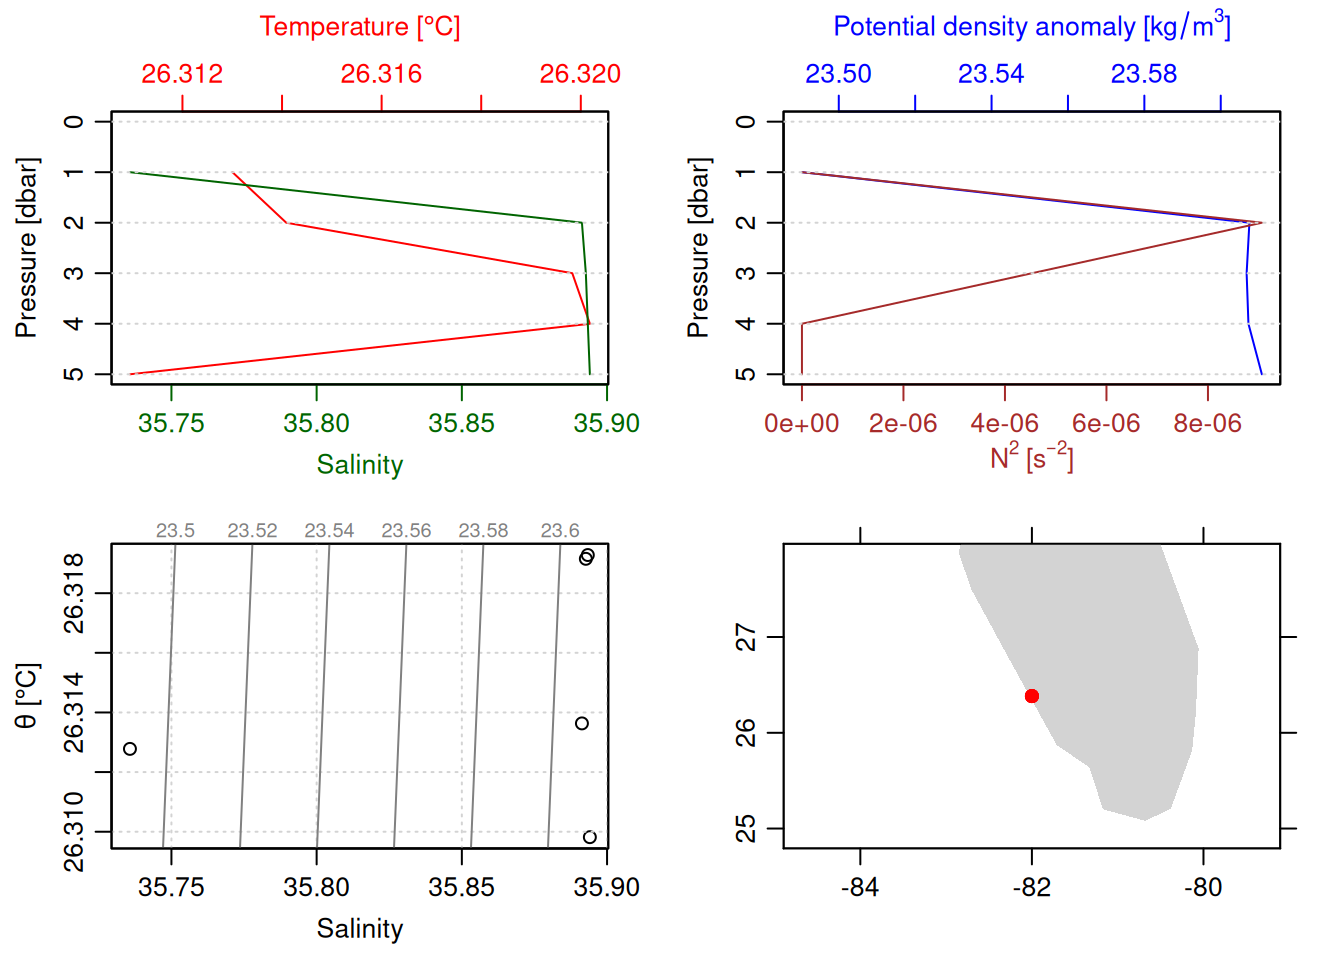
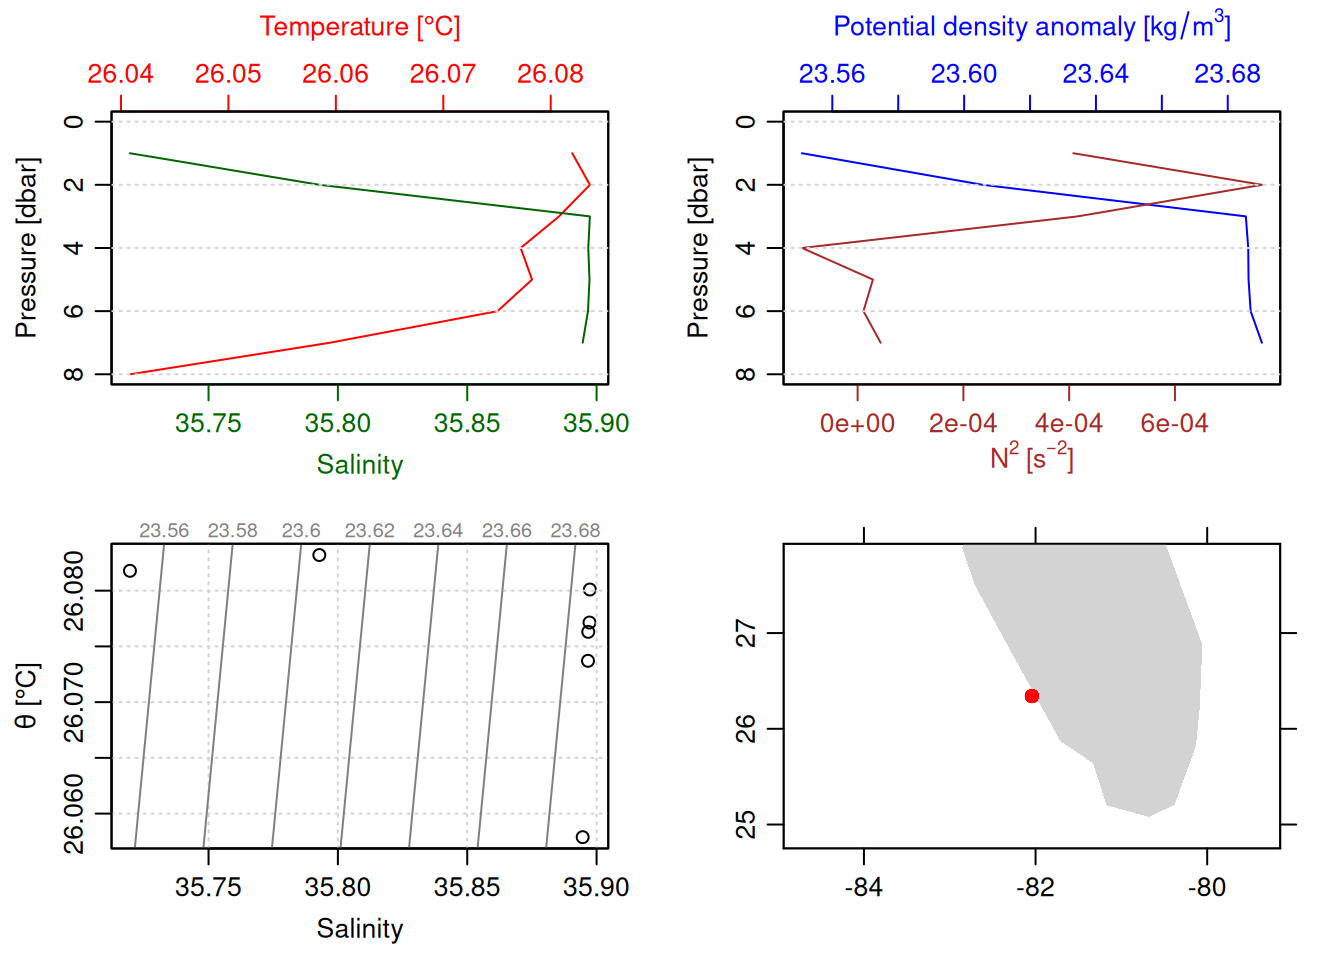
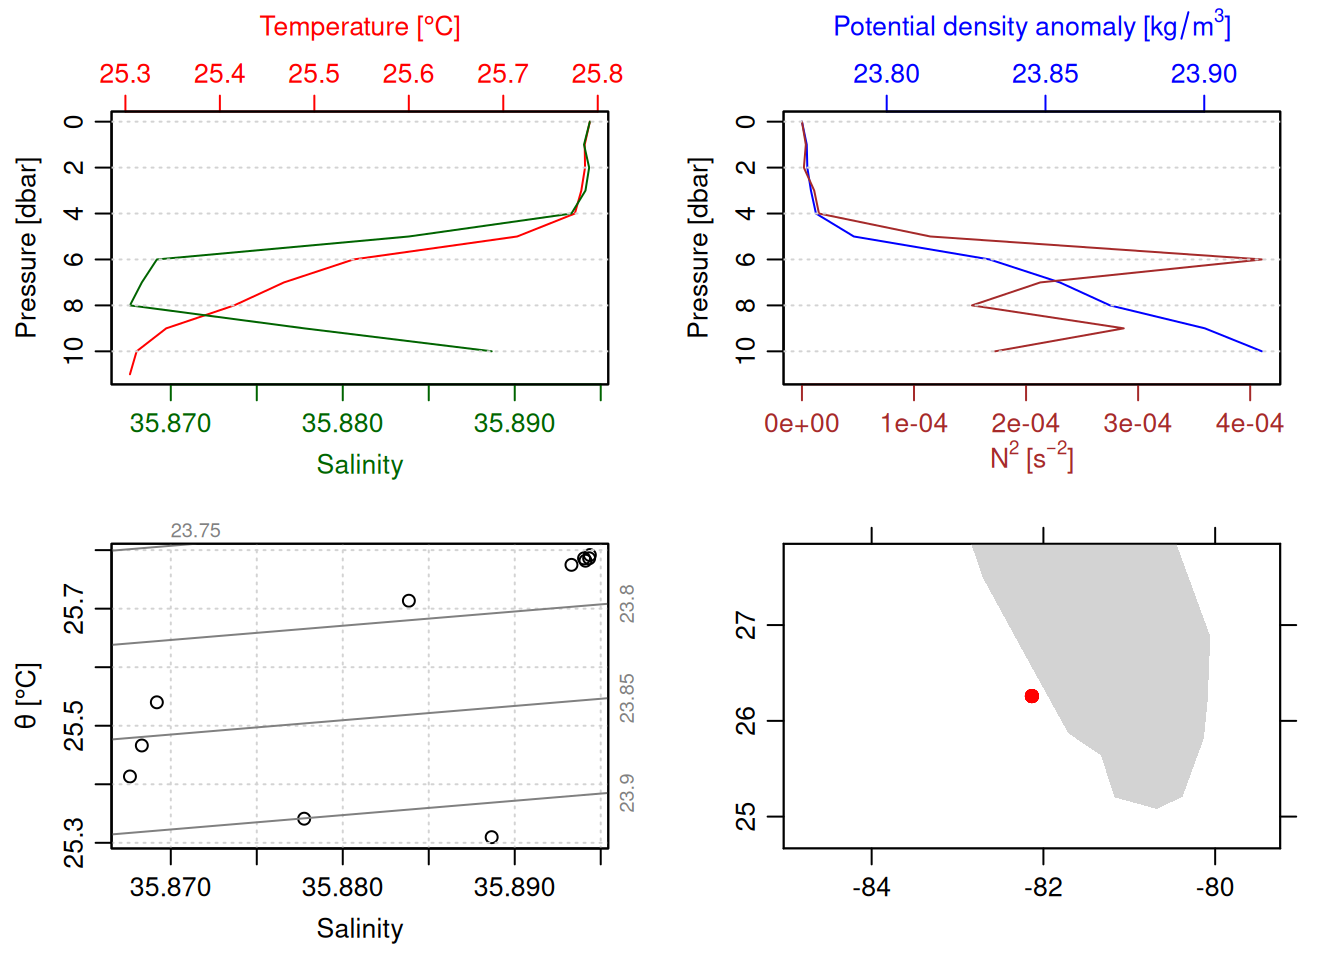
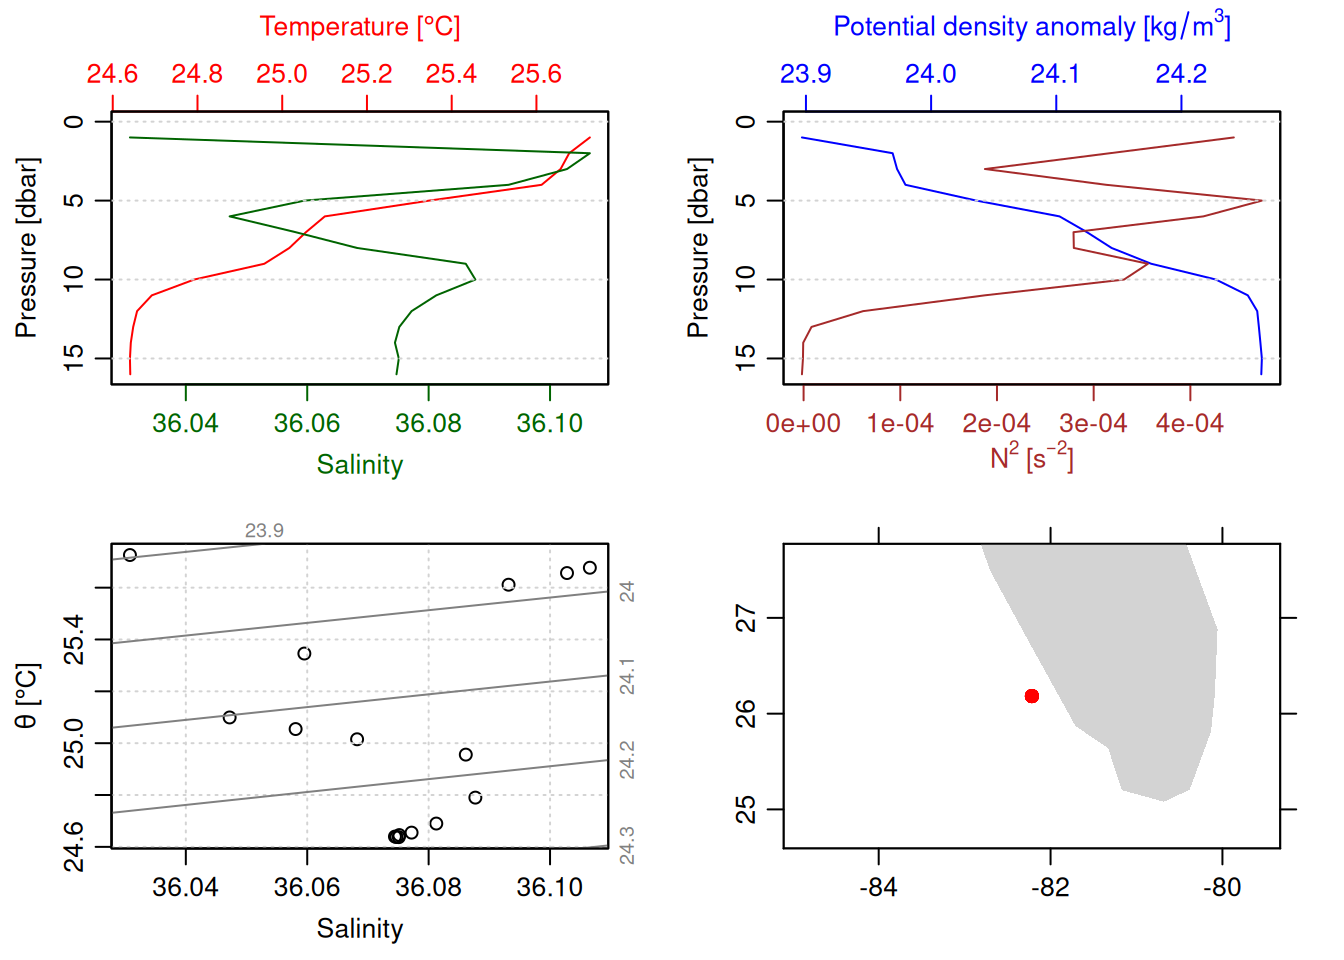
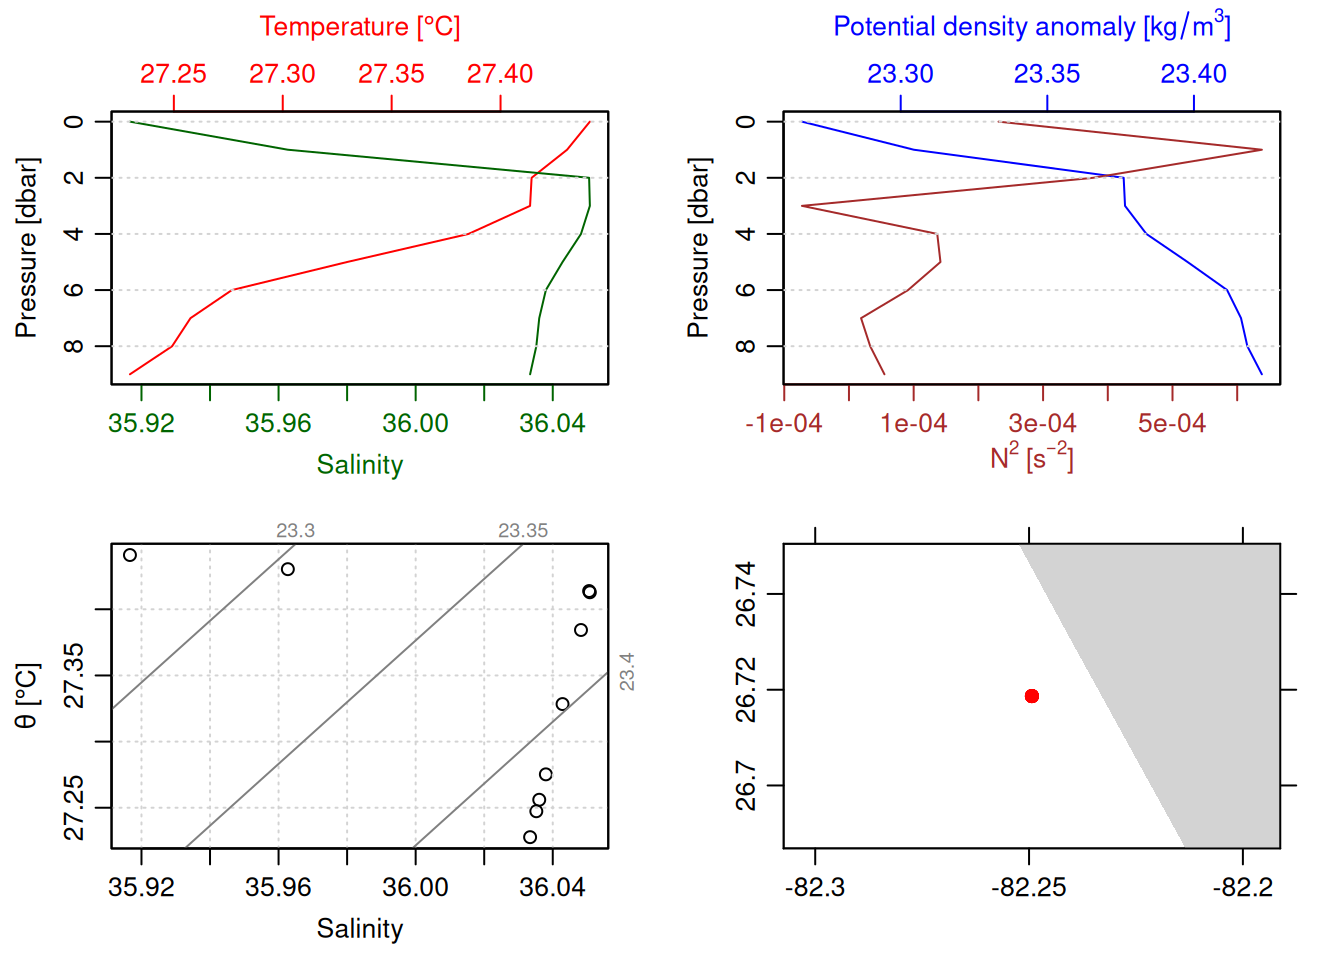
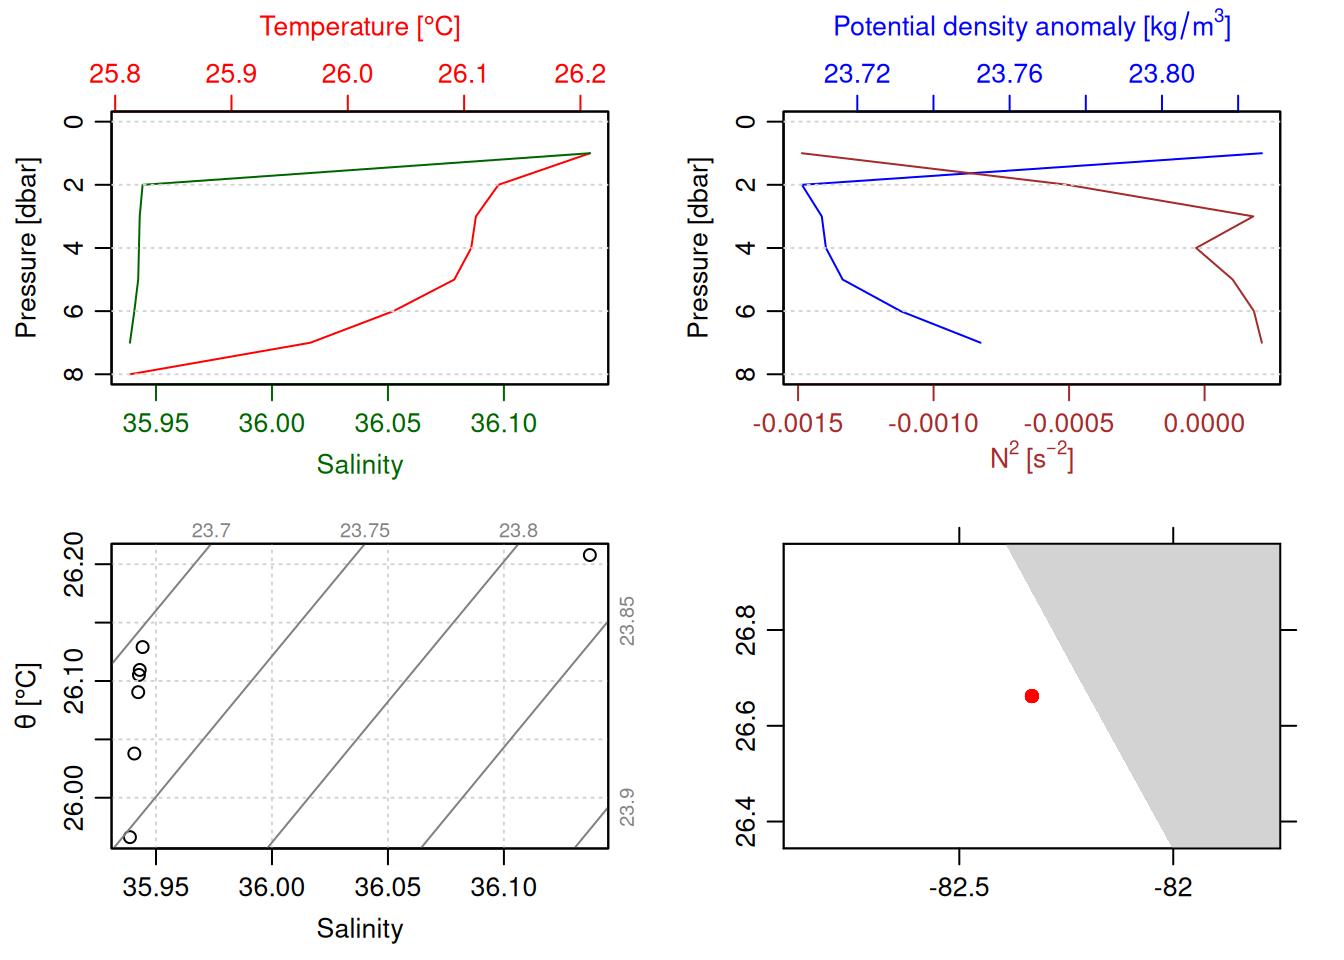
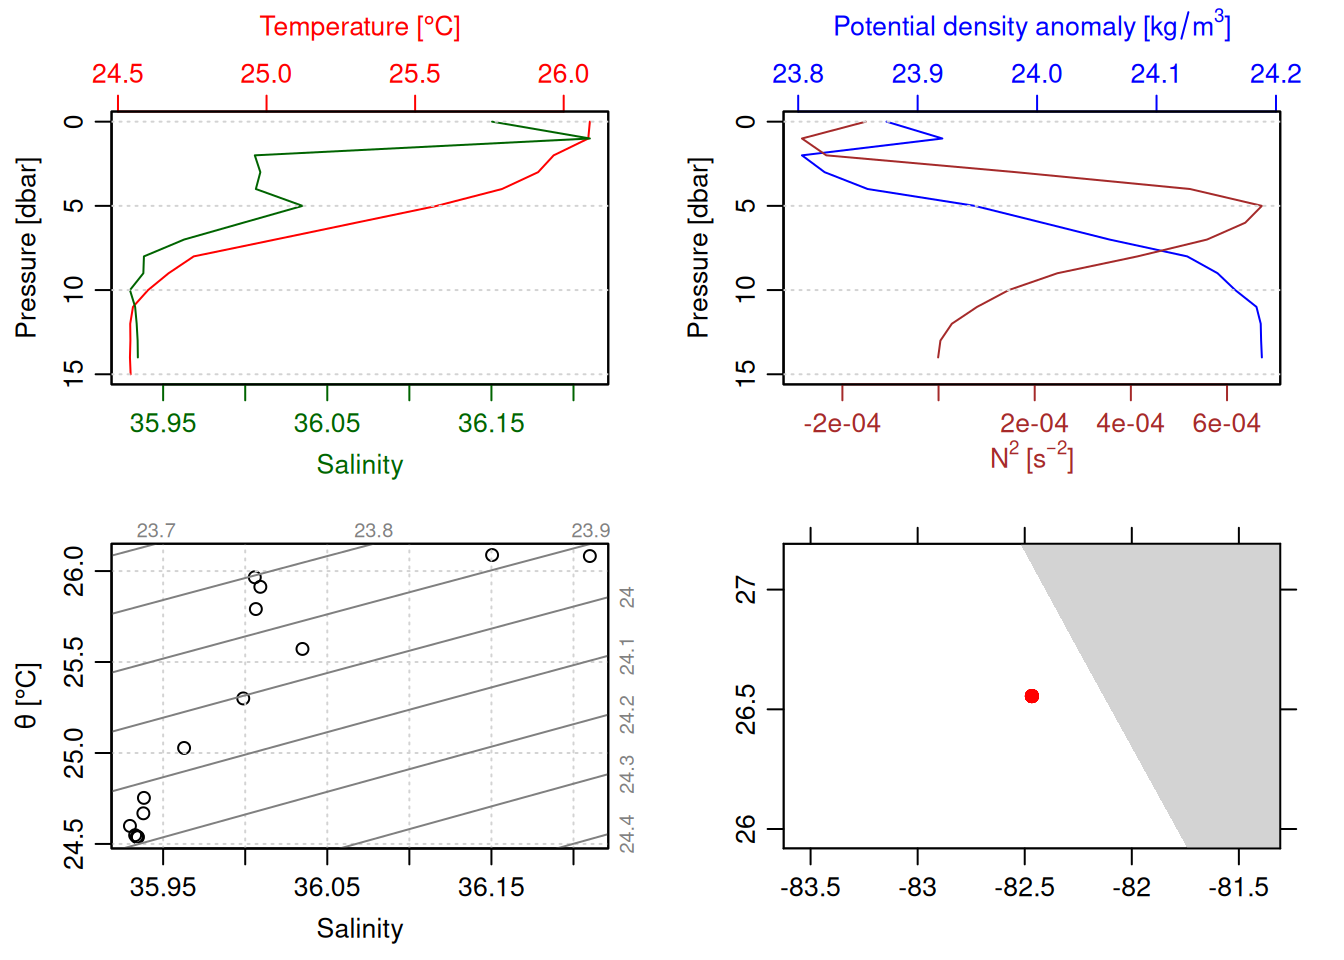
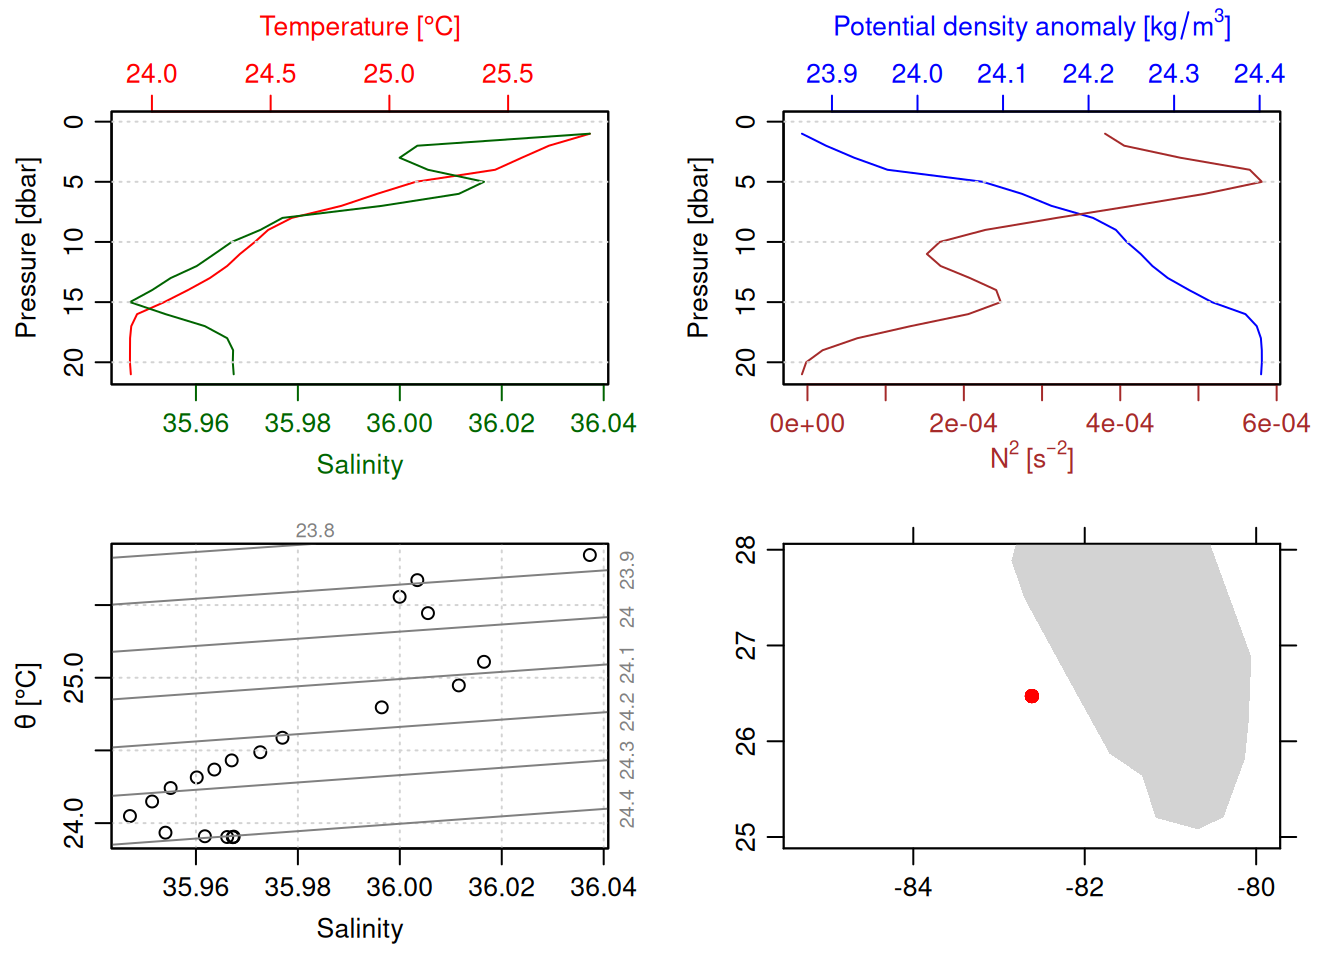
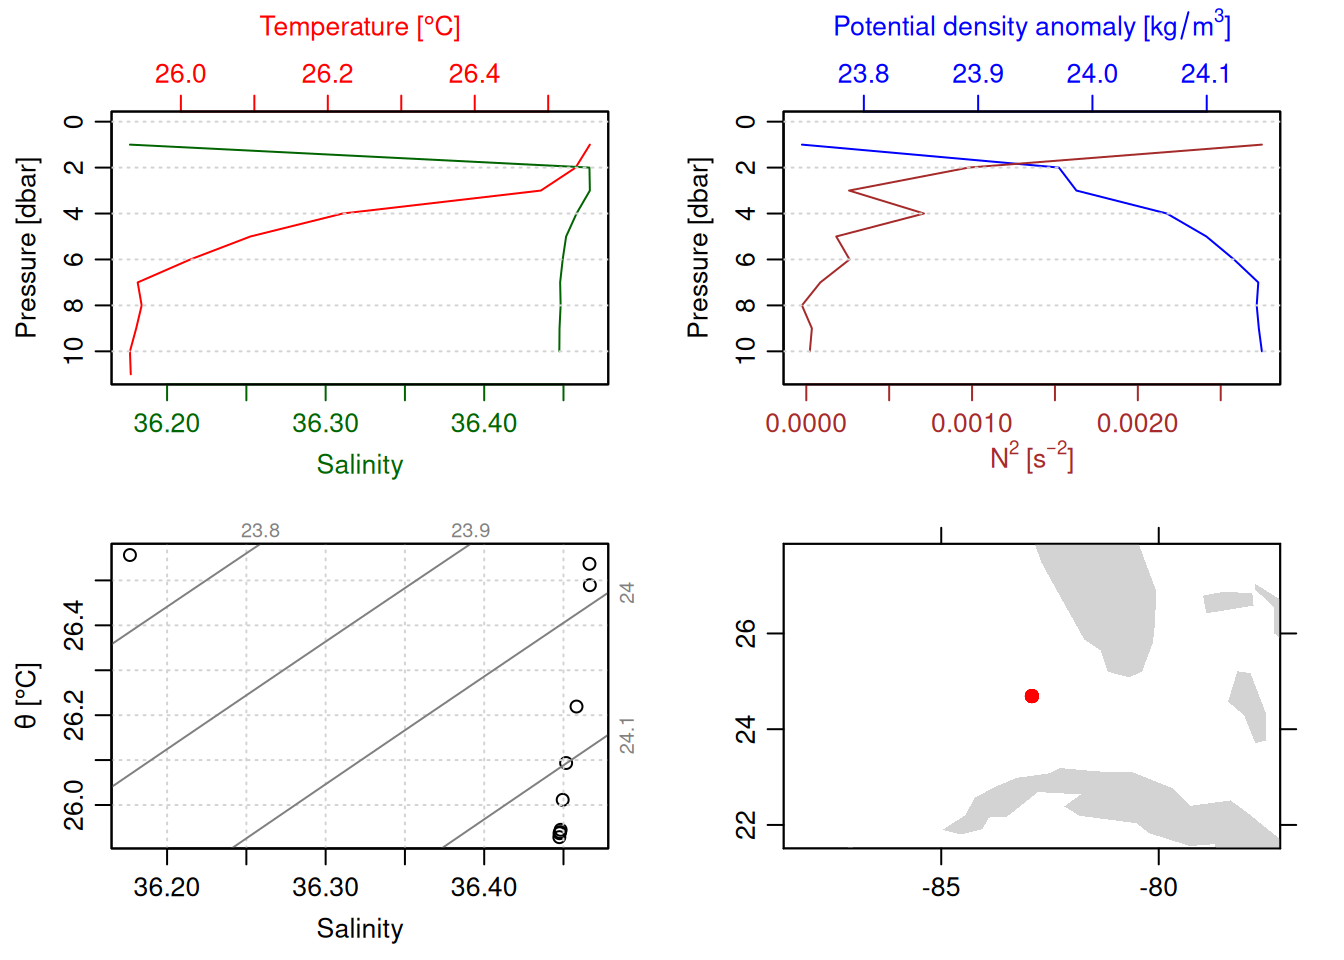
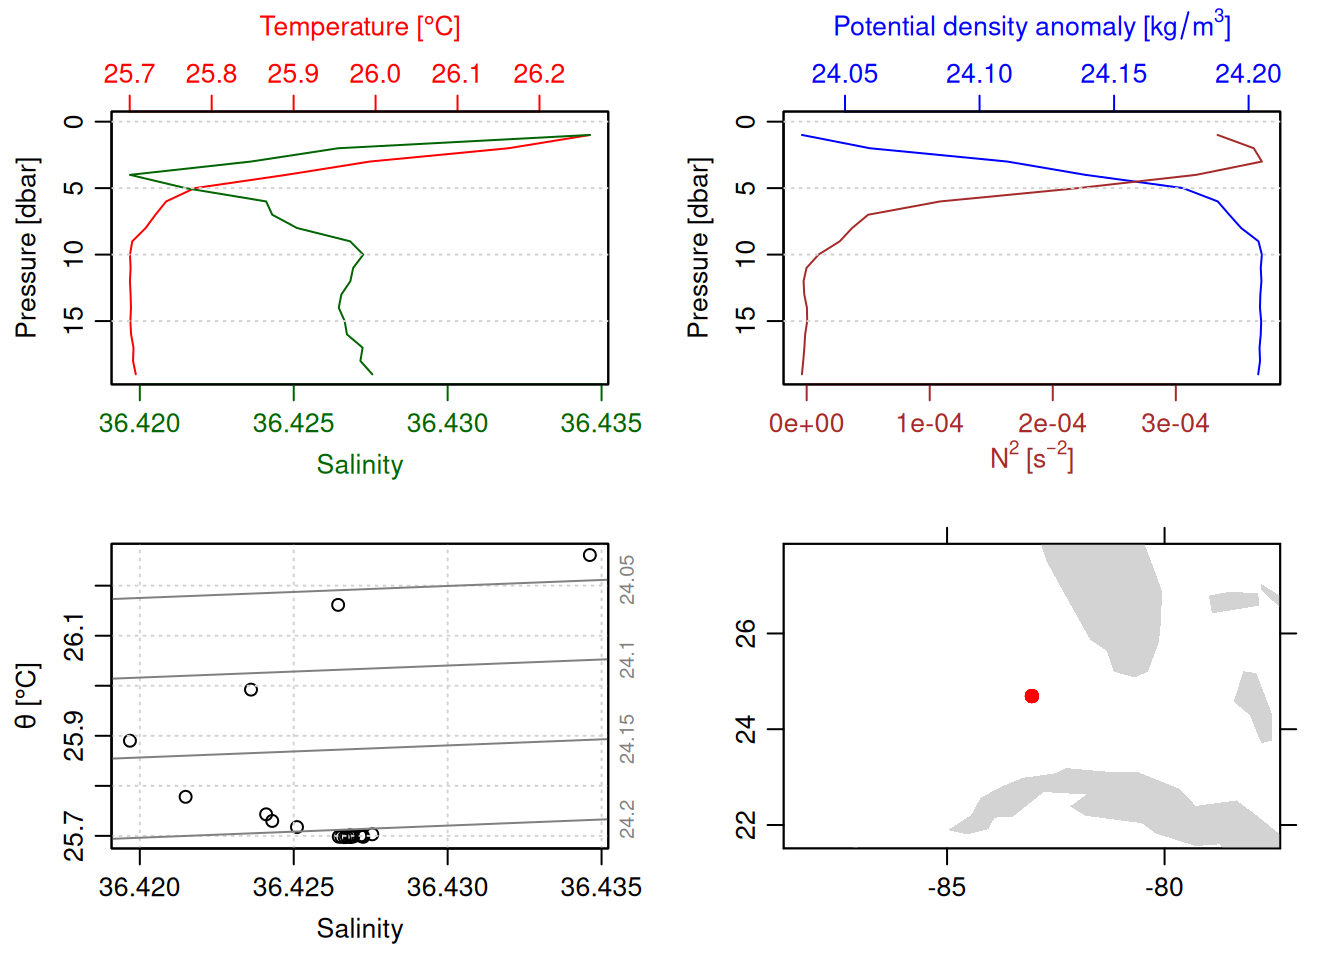
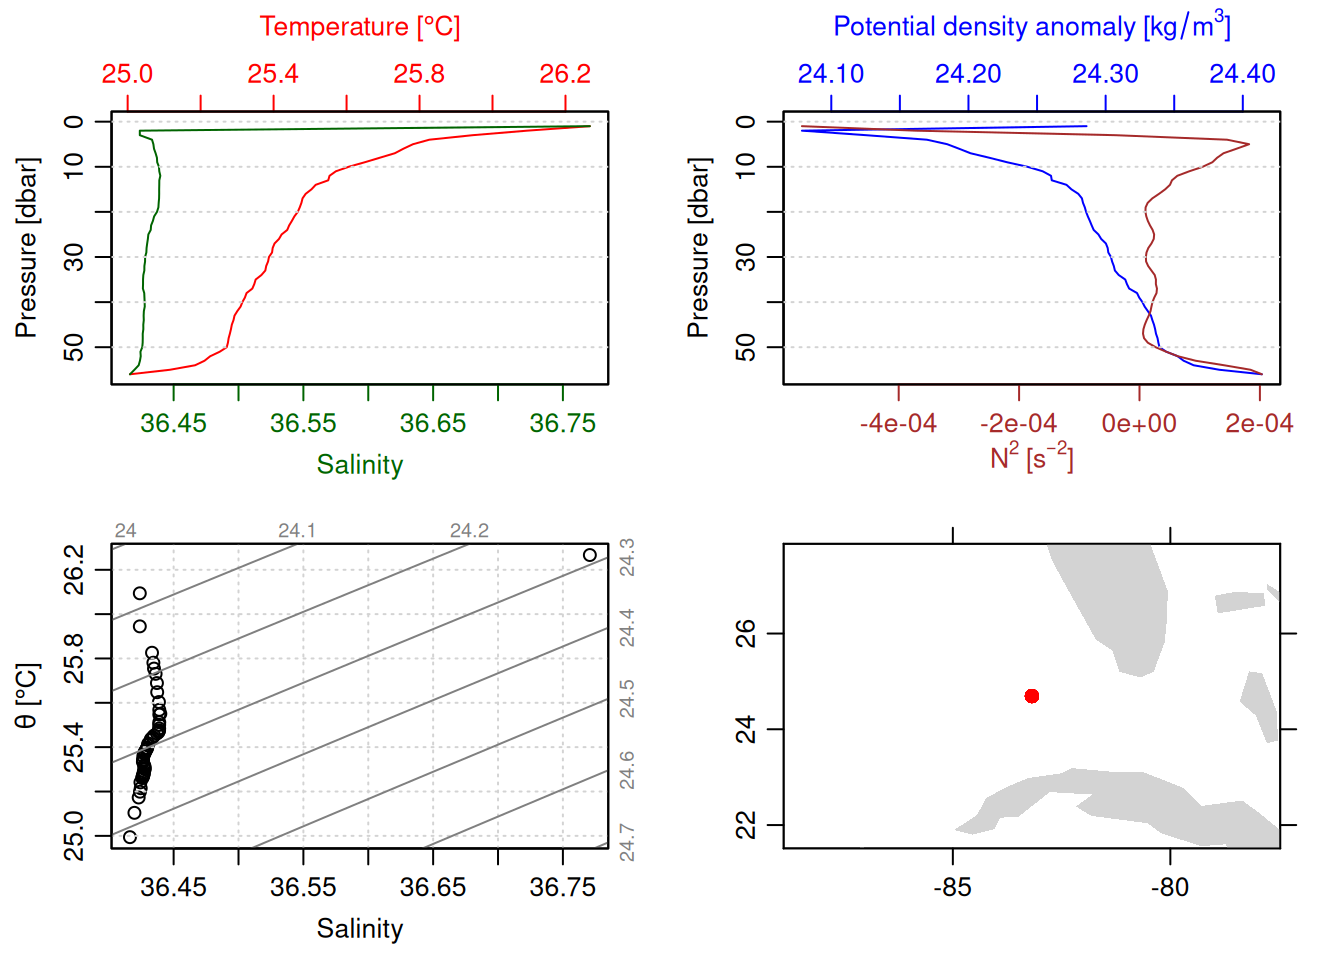
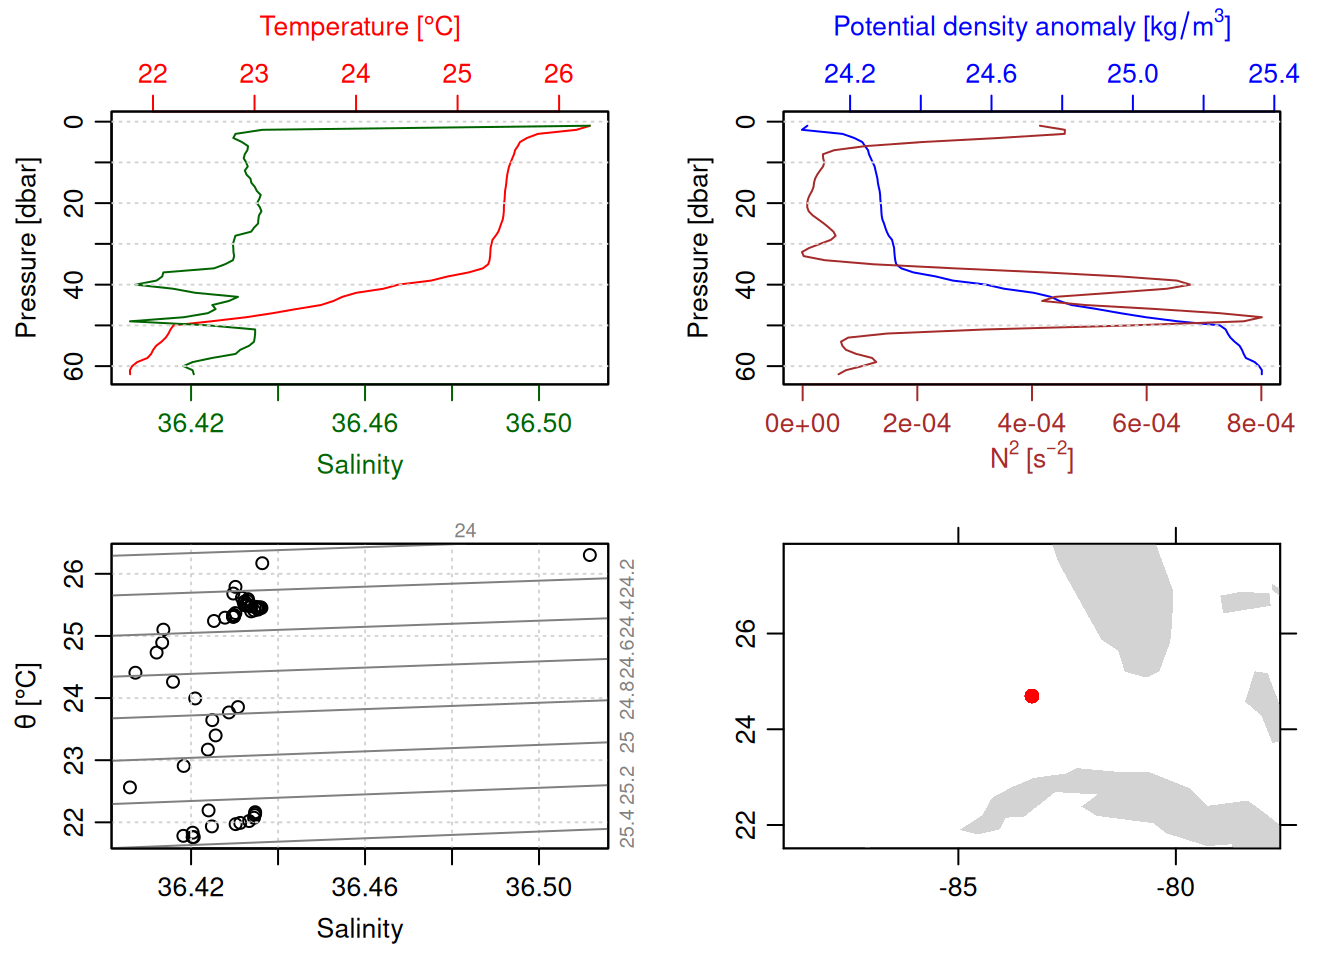
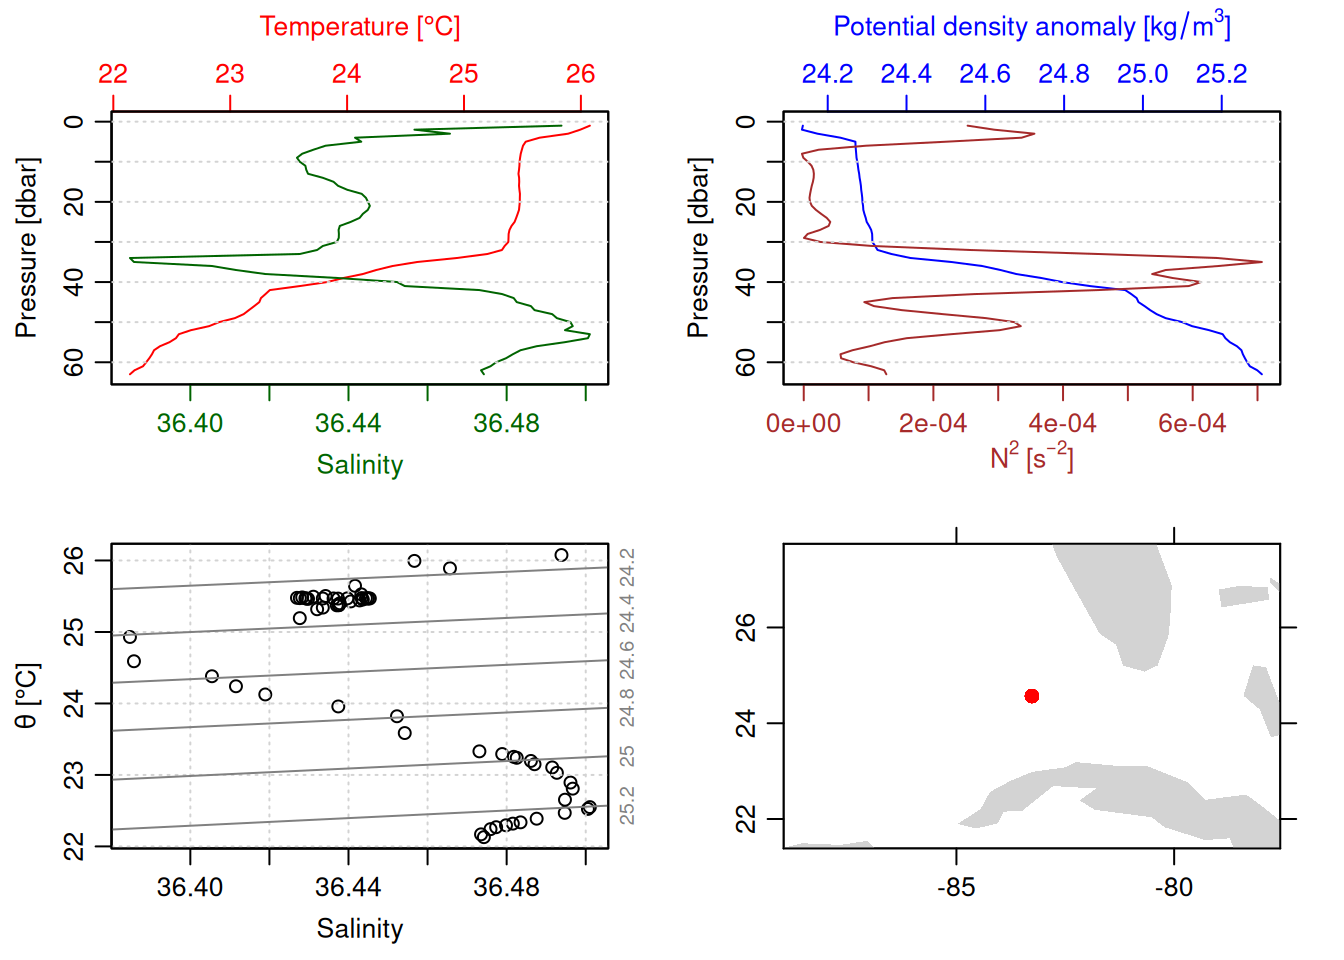
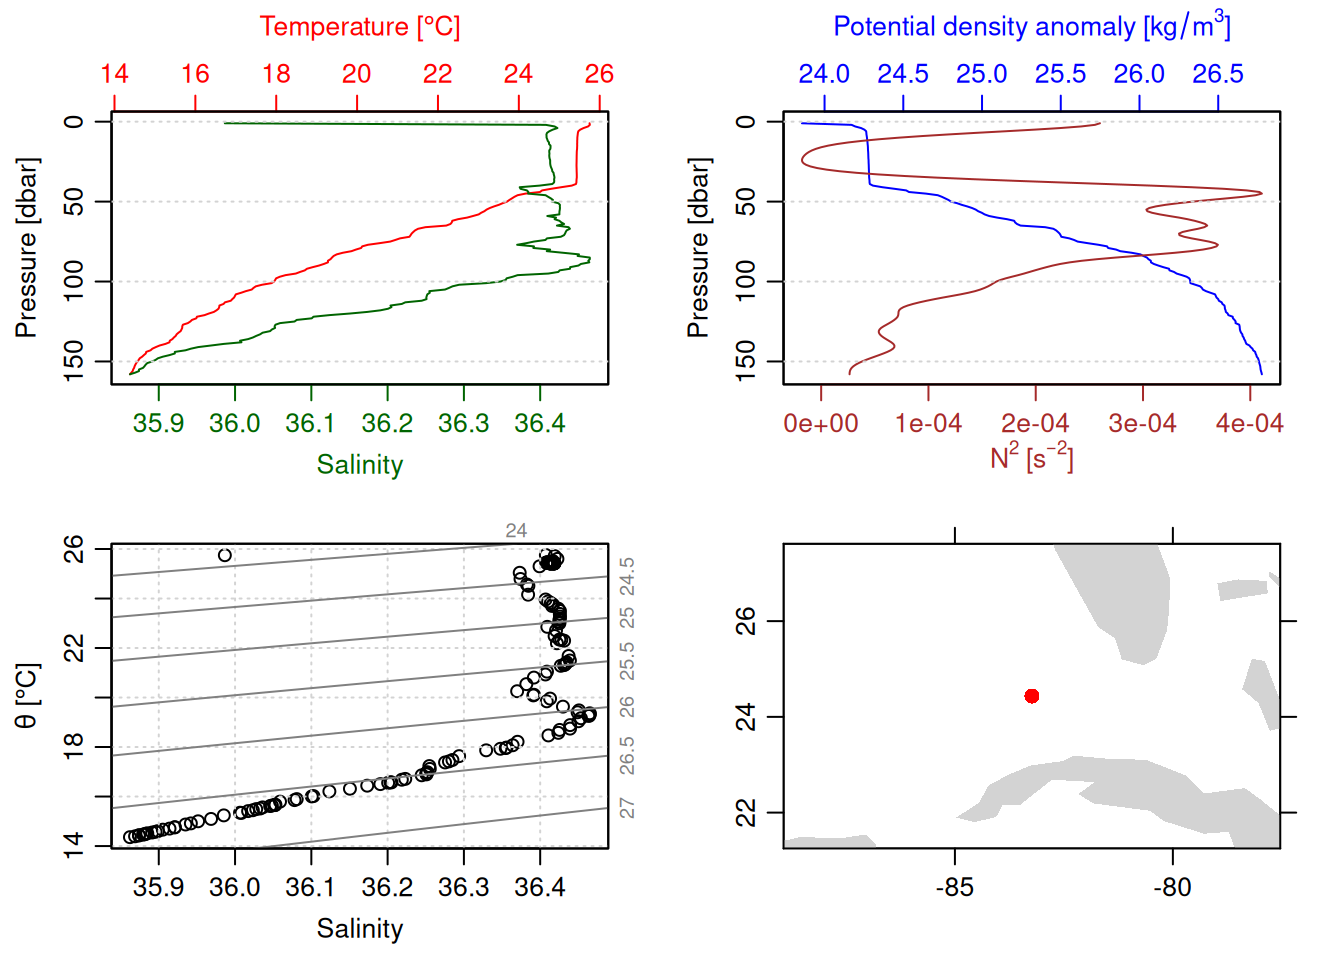
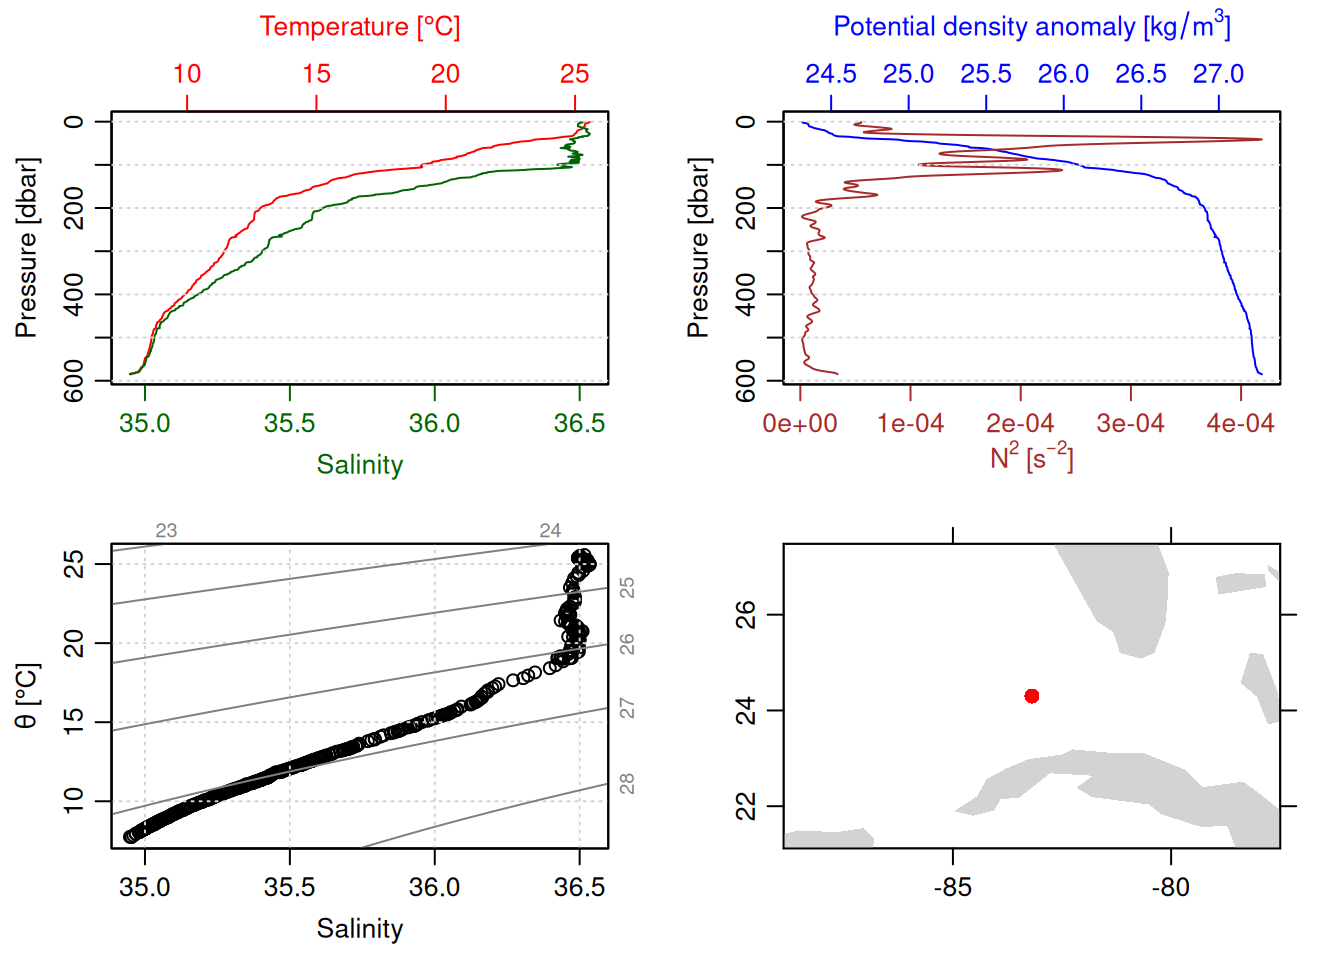
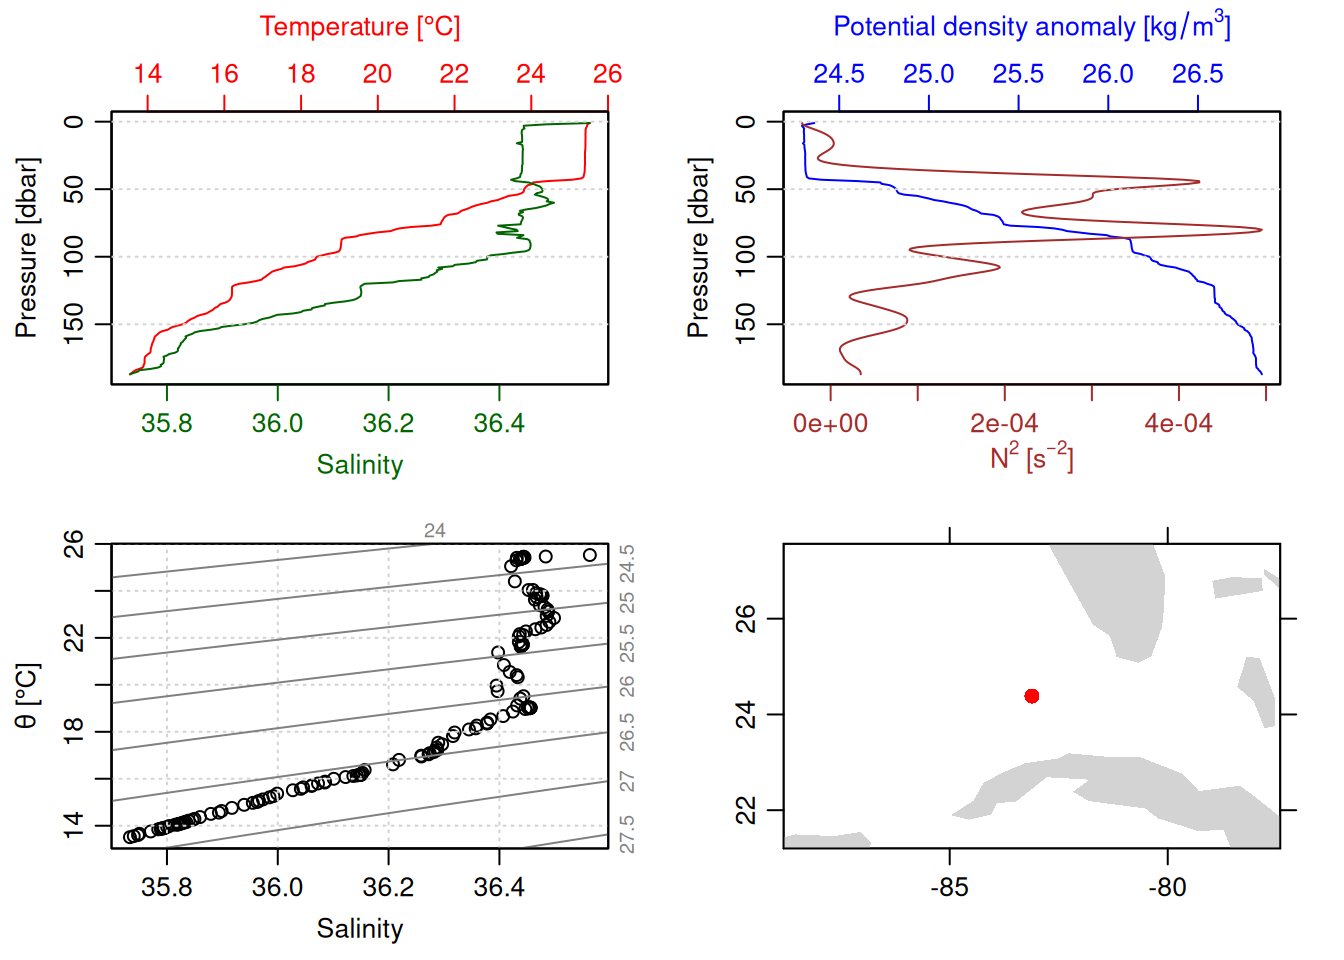
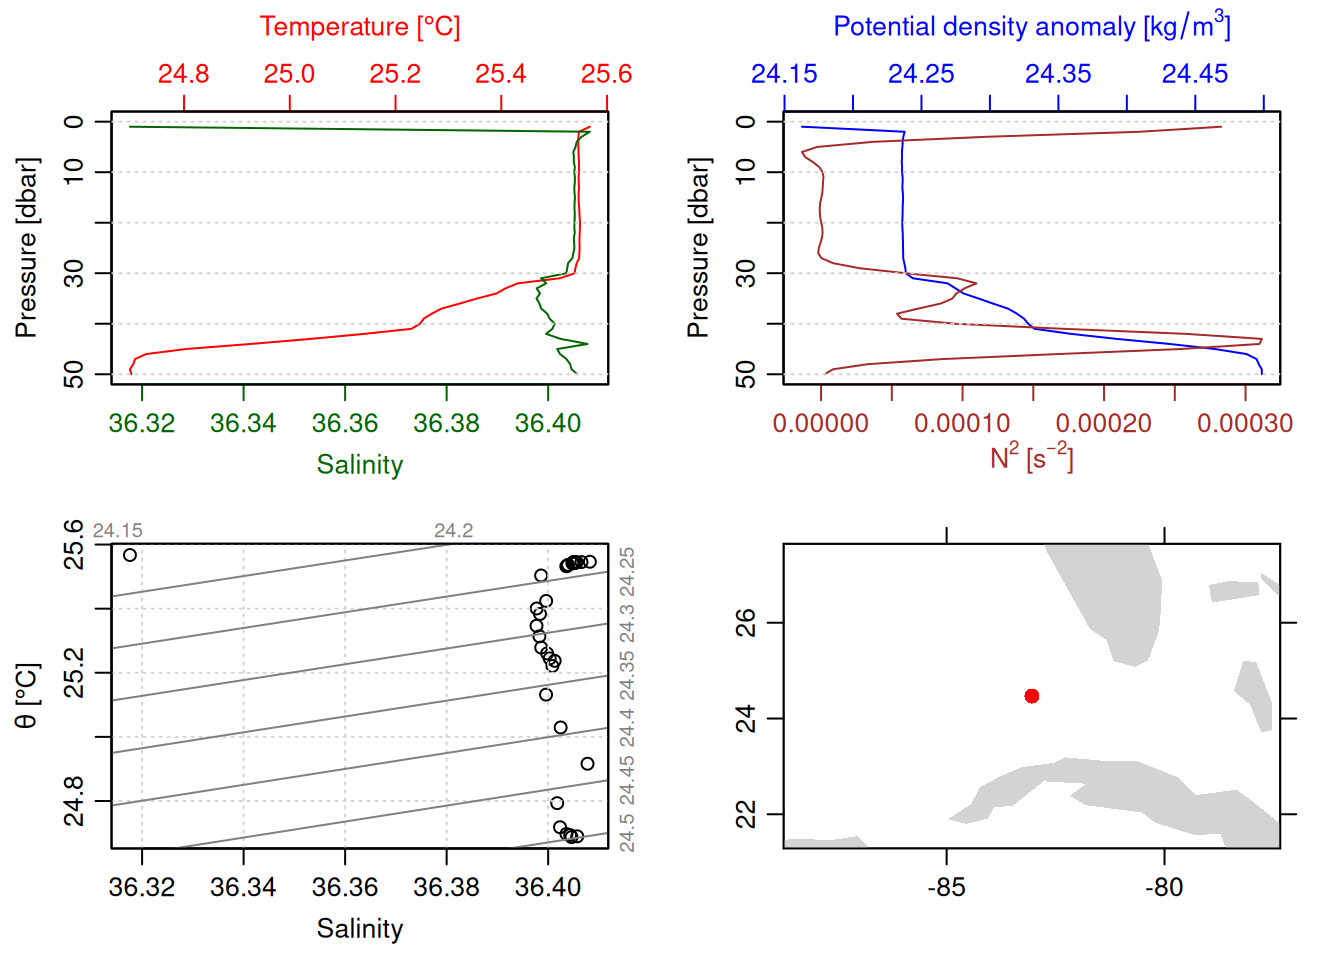
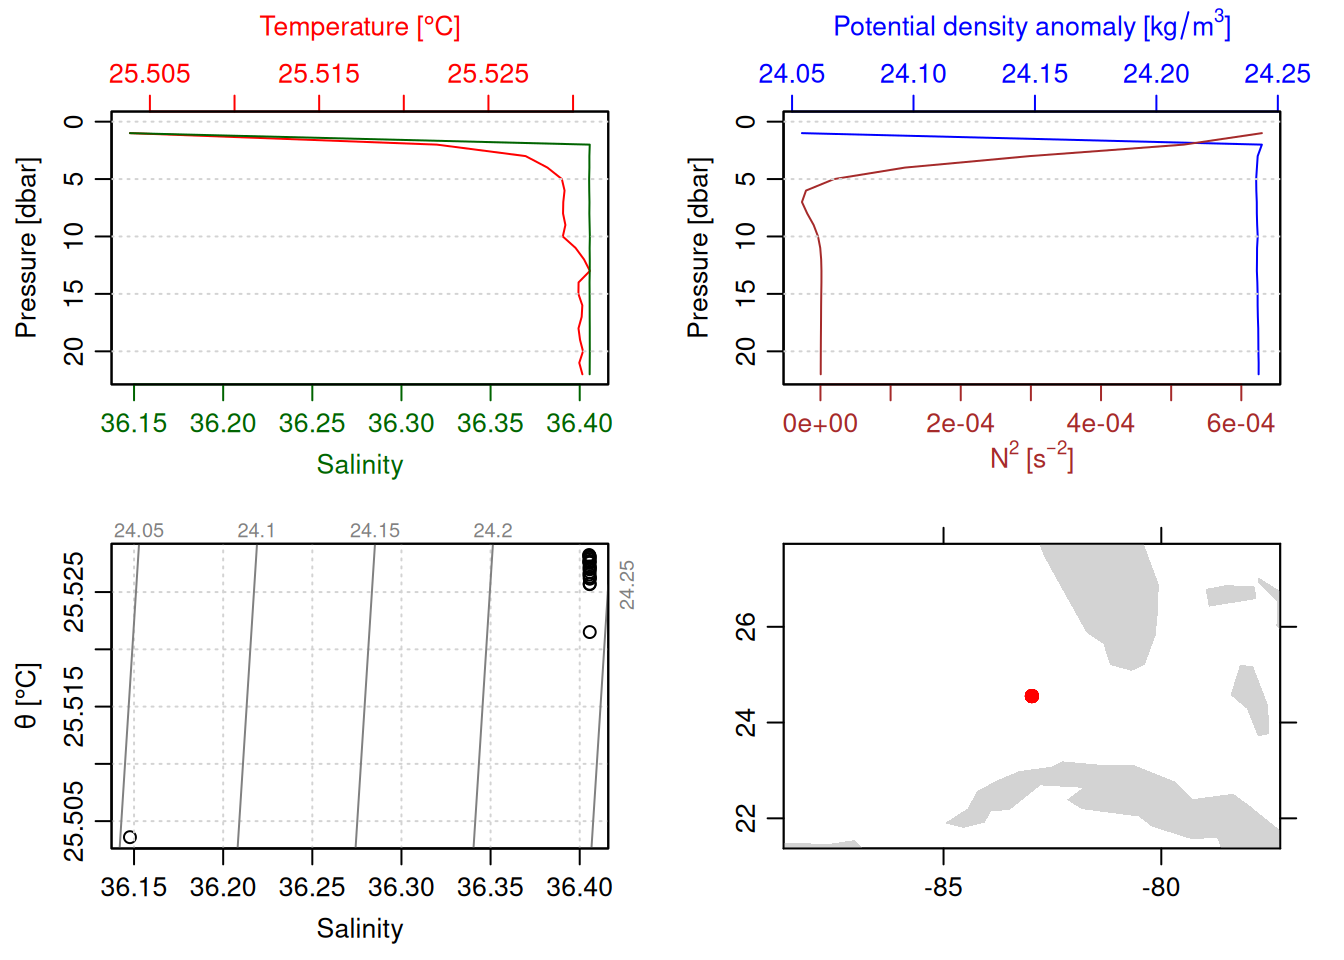
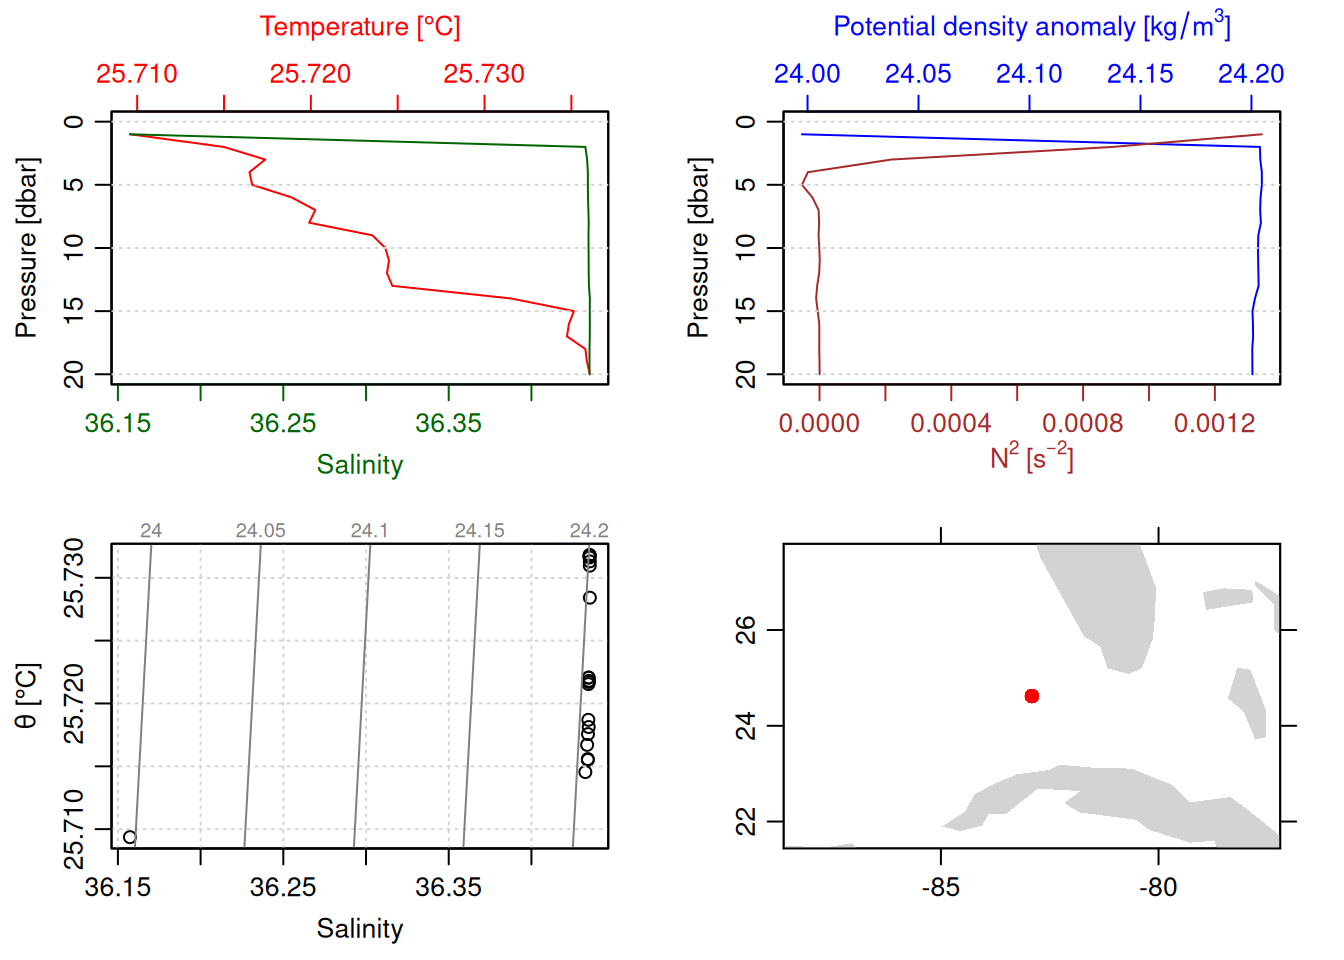
for (i inseq(ctd_FK)){ cast <- ctd_FK[[i]] # 1 is selecting only the first sublisttryCatch({plot(ctdDecimate(ctdTrim(cast))) }, error =function(e){print(e) })}
<simpleError in !is.null(x@metadata$station) && !is.na(x@metadata$station): 'length = 2163' in coercion to 'logical(1)'>
<simpleError in !is.null(x@metadata$station) && !is.na(x@metadata$station): 'length = 2343' in coercion to 'logical(1)'>
<simpleError in !is.null(x@metadata$station) && !is.na(x@metadata$station): 'length = 2428' in coercion to 'logical(1)'>
<simpleError in !is.null(x@metadata$station) && !is.na(x@metadata$station): 'length = 2949' in coercion to 'logical(1)'>
<simpleError in !is.null(x@metadata$station) && !is.na(x@metadata$station): 'length = 2431' in coercion to 'logical(1)'>
<simpleError in !is.null(x@metadata$station) && !is.na(x@metadata$station): 'length = 2227' in coercion to 'logical(1)'>
<simpleError in !is.null(x@metadata$station) && !is.na(x@metadata$station): 'length = 3413' in coercion to 'logical(1)'>
<simpleError in !is.null(x@metadata$station) && !is.na(x@metadata$station): 'length = 8025' in coercion to 'logical(1)'>
<simpleError in !is.null(x@metadata$station) && !is.na(x@metadata$station): 'length = 1565' in coercion to 'logical(1)'>
<simpleError in !is.null(x@metadata$station) && !is.na(x@metadata$station): 'length = 2178' in coercion to 'logical(1)'>
<simpleError in !is.null(x@metadata$station) && !is.na(x@metadata$station): 'length = 2990' in coercion to 'logical(1)'>
<simpleError in !is.null(x@metadata$station) && !is.na(x@metadata$station): 'length = 1720' in coercion to 'logical(1)'>
<simpleError in !is.null(x@metadata$station) && !is.na(x@metadata$station): 'length = 1723' in coercion to 'logical(1)'>
<simpleError in !is.null(x@metadata$station) && !is.na(x@metadata$station): 'length = 2174' in coercion to 'logical(1)'>
<simpleError in !is.null(x@metadata$station) && !is.na(x@metadata$station): 'length = 2952' in coercion to 'logical(1)'>
<simpleError in !is.null(x@metadata$station) && !is.na(x@metadata$station): 'length = 8665' in coercion to 'logical(1)'>
<simpleError in !is.null(x@metadata$station) && !is.na(x@metadata$station): 'length = 3052' in coercion to 'logical(1)'>
<simpleError in !is.null(x@metadata$station) && !is.na(x@metadata$station): 'length = 7534' in coercion to 'logical(1)'>
<simpleError in !is.null(x@metadata$station) && !is.na(x@metadata$station): 'length = 1885' in coercion to 'logical(1)'>
<simpleError in !is.null(x@metadata$station) && !is.na(x@metadata$station): 'length = 2222' in coercion to 'logical(1)'>
<simpleError in !is.null(x@metadata$station) && !is.na(x@metadata$station): 'length = 4505' in coercion to 'logical(1)'>
<simpleError in !is.null(x@metadata$station) && !is.na(x@metadata$station): 'length = 13944' in coercion to 'logical(1)'>
<simpleError in !is.null(x@metadata$station) && !is.na(x@metadata$station): 'length = 1902' in coercion to 'logical(1)'>
<simpleError in !is.null(x@metadata$station) && !is.na(x@metadata$station): 'length = 2479' in coercion to 'logical(1)'>
<simpleError in !is.null(x@metadata$station) && !is.na(x@metadata$station): 'length = 2904' in coercion to 'logical(1)'>
<simpleError in !is.null(x@metadata$station) && !is.na(x@metadata$station): 'length = 3383' in coercion to 'logical(1)'>
<simpleError in !is.null(x@metadata$station) && !is.na(x@metadata$station): 'length = 3671' in coercion to 'logical(1)'>
<simpleError in !is.null(x@metadata$station) && !is.na(x@metadata$station): 'length = 3787' in coercion to 'logical(1)'>
<simpleError in !is.null(x@metadata$station) && !is.na(x@metadata$station): 'length = 4536' in coercion to 'logical(1)'>
<simpleError in !is.null(x@metadata$station) && !is.na(x@metadata$station): 'length = 3288' in coercion to 'logical(1)'>
<simpleError in !is.null(x@metadata$station) && !is.na(x@metadata$station): 'length = 2764' in coercion to 'logical(1)'>
<simpleError in !is.null(x@metadata$station) && !is.na(x@metadata$station): 'length = 2428' in coercion to 'logical(1)'>
<simpleError in !is.null(x@metadata$station) && !is.na(x@metadata$station): 'length = 1713' in coercion to 'logical(1)'>
<simpleError in !is.null(x@metadata$station) && !is.na(x@metadata$station): 'length = 2750' in coercion to 'logical(1)'>
<simpleError in !is.null(x@metadata$station) && !is.na(x@metadata$station): 'length = 1677' in coercion to 'logical(1)'>
<simpleError in !is.null(x@metadata$station) && !is.na(x@metadata$station): 'length = 2079' in coercion to 'logical(1)'>
<simpleError in !is.null(x@metadata$station) && !is.na(x@metadata$station): 'length = 1324' in coercion to 'logical(1)'>
<simpleError in !is.null(x@metadata$station) && !is.na(x@metadata$station): 'length = 2081' in coercion to 'logical(1)'>
<simpleError in !is.null(x@metadata$station) && !is.na(x@metadata$station): 'length = 2931' in coercion to 'logical(1)'>
<simpleError in !is.null(x@metadata$station) && !is.na(x@metadata$station): 'length = 638' in coercion to 'logical(1)'>
<simpleError in !is.null(x@metadata$station) && !is.na(x@metadata$station): 'length = 2443' in coercion to 'logical(1)'>
<simpleError in !is.null(x@metadata$station) && !is.na(x@metadata$station): 'length = 2665' in coercion to 'logical(1)'>
<simpleError in !is.null(x@metadata$station) && !is.na(x@metadata$station): 'length = 2516' in coercion to 'logical(1)'>
<simpleError in !is.null(x@metadata$station) && !is.na(x@metadata$station): 'length = 1949' in coercion to 'logical(1)'>
<simpleError in !is.null(x@metadata$station) && !is.na(x@metadata$station): 'length = 1632' in coercion to 'logical(1)'>
<simpleError in !is.null(x@metadata$station) && !is.na(x@metadata$station): 'length = 1867' in coercion to 'logical(1)'>
<simpleError in !is.null(x@metadata$station) && !is.na(x@metadata$station): 'length = 1860' in coercion to 'logical(1)'>
<simpleError in !is.null(x@metadata$station) && !is.na(x@metadata$station): 'length = 2314' in coercion to 'logical(1)'>
<simpleError in !is.null(x@metadata$station) && !is.na(x@metadata$station): 'length = 1563' in coercion to 'logical(1)'>
<simpleError in !is.null(x@metadata$station) && !is.na(x@metadata$station): 'length = 2683' in coercion to 'logical(1)'>
<simpleError in !is.null(x@metadata$station) && !is.na(x@metadata$station): 'length = 1257' in coercion to 'logical(1)'>
<simpleError in !is.null(x@metadata$station) && !is.na(x@metadata$station): 'length = 1122' in coercion to 'logical(1)'>
<simpleError in !is.null(x@metadata$station) && !is.na(x@metadata$station): 'length = 1906' in coercion to 'logical(1)'>
<simpleError in !is.null(x@metadata$station) && !is.na(x@metadata$station): 'length = 2307' in coercion to 'logical(1)'>
<simpleError in !is.null(x@metadata$station) && !is.na(x@metadata$station): 'length = 2189' in coercion to 'logical(1)'>
<simpleError in !is.null(x@metadata$station) && !is.na(x@metadata$station): 'length = 7225' in coercion to 'logical(1)'>
<simpleError in !is.null(x@metadata$station) && !is.na(x@metadata$station): 'length = 1629' in coercion to 'logical(1)'>
<simpleError in !is.null(x@metadata$station) && !is.na(x@metadata$station): 'length = 1538' in coercion to 'logical(1)'>
<simpleError in !is.null(x@metadata$station) && !is.na(x@metadata$station): 'length = 1782' in coercion to 'logical(1)'>
<simpleError in !is.null(x@metadata$station) && !is.na(x@metadata$station): 'length = 1887' in coercion to 'logical(1)'>
<simpleError in !is.null(x@metadata$station) && !is.na(x@metadata$station): 'length = 1460' in coercion to 'logical(1)'>
<simpleError in !is.null(x@metadata$station) && !is.na(x@metadata$station): 'length = 1556' in coercion to 'logical(1)'>
<simpleError in !is.null(x@metadata$station) && !is.na(x@metadata$station): 'length = 1801' in coercion to 'logical(1)'>
<simpleError in !is.null(x@metadata$station) && !is.na(x@metadata$station): 'length = 1843' in coercion to 'logical(1)'>
<simpleError in !is.null(x@metadata$station) && !is.na(x@metadata$station): 'length = 1675' in coercion to 'logical(1)'>
<simpleError in !is.null(x@metadata$station) && !is.na(x@metadata$station): 'length = 1776' in coercion to 'logical(1)'>
<simpleError in !is.null(x@metadata$station) && !is.na(x@metadata$station): 'length = 2274' in coercion to 'logical(1)'>
<simpleError in !is.null(x@metadata$station) && !is.na(x@metadata$station): 'length = 2083' in coercion to 'logical(1)'>
<simpleError in !is.null(x@metadata$station) && !is.na(x@metadata$station): 'length = 2272' in coercion to 'logical(1)'>
<simpleError in !is.null(x@metadata$station) && !is.na(x@metadata$station): 'length = 3483' in coercion to 'logical(1)'>
<simpleError in !is.null(x@metadata$station) && !is.na(x@metadata$station): 'length = 7644' in coercion to 'logical(1)'>
<simpleError in !is.null(x@metadata$station) && !is.na(x@metadata$station): 'length = 2611' in coercion to 'logical(1)'>
<simpleError in !is.null(x@metadata$station) && !is.na(x@metadata$station): 'length = 1364' in coercion to 'logical(1)'>
<simpleError in !is.null(x@metadata$station) && !is.na(x@metadata$station): 'length = 2714' in coercion to 'logical(1)'>
<simpleError in !is.null(x@metadata$station) && !is.na(x@metadata$station): 'length = 2748' in coercion to 'logical(1)'>
<simpleError in !is.null(x@metadata$station) && !is.na(x@metadata$station): 'length = 3267' in coercion to 'logical(1)'>
<simpleError in !is.null(x@metadata$station) && !is.na(x@metadata$station): 'length = 2871' in coercion to 'logical(1)'>
<simpleError in !is.null(x@metadata$station) && !is.na(x@metadata$station): 'length = 2856' in coercion to 'logical(1)'>
<simpleError in !is.null(x@metadata$station) && !is.na(x@metadata$station): 'length = 2543' in coercion to 'logical(1)'>
<simpleError in !is.null(x@metadata$station) && !is.na(x@metadata$station): 'length = 3251' in coercion to 'logical(1)'>
<simpleError in !is.null(x@metadata$station) && !is.na(x@metadata$station): 'length = 4048' in coercion to 'logical(1)'>
<simpleError in !is.null(x@metadata$station) && !is.na(x@metadata$station): 'length = 3024' in coercion to 'logical(1)'>
<simpleError in !is.null(x@metadata$station) && !is.na(x@metadata$station): 'length = 2604' in coercion to 'logical(1)'>
<simpleError in !is.null(x@metadata$station) && !is.na(x@metadata$station): 'length = 4488' in coercion to 'logical(1)'>
<simpleError in !is.null(x@metadata$station) && !is.na(x@metadata$station): 'length = 5008' in coercion to 'logical(1)'>
<simpleError in !is.null(x@metadata$station) && !is.na(x@metadata$station): 'length = 4623' in coercion to 'logical(1)'>
<simpleError in !is.null(x@metadata$station) && !is.na(x@metadata$station): 'length = 8535' in coercion to 'logical(1)'>
<simpleError in !is.null(x@metadata$station) && !is.na(x@metadata$station): 'length = 19828' in coercion to 'logical(1)'>
<simpleError in !is.null(x@metadata$station) && !is.na(x@metadata$station): 'length = 9116' in coercion to 'logical(1)'>
<simpleError in !is.null(x@metadata$station) && !is.na(x@metadata$station): 'length = 4978' in coercion to 'logical(1)'>
<simpleError in !is.null(x@metadata$station) && !is.na(x@metadata$station): 'length = 2648' in coercion to 'logical(1)'>
<simpleError in !is.null(x@metadata$station) && !is.na(x@metadata$station): 'length = 2443' in coercion to 'logical(1)'>
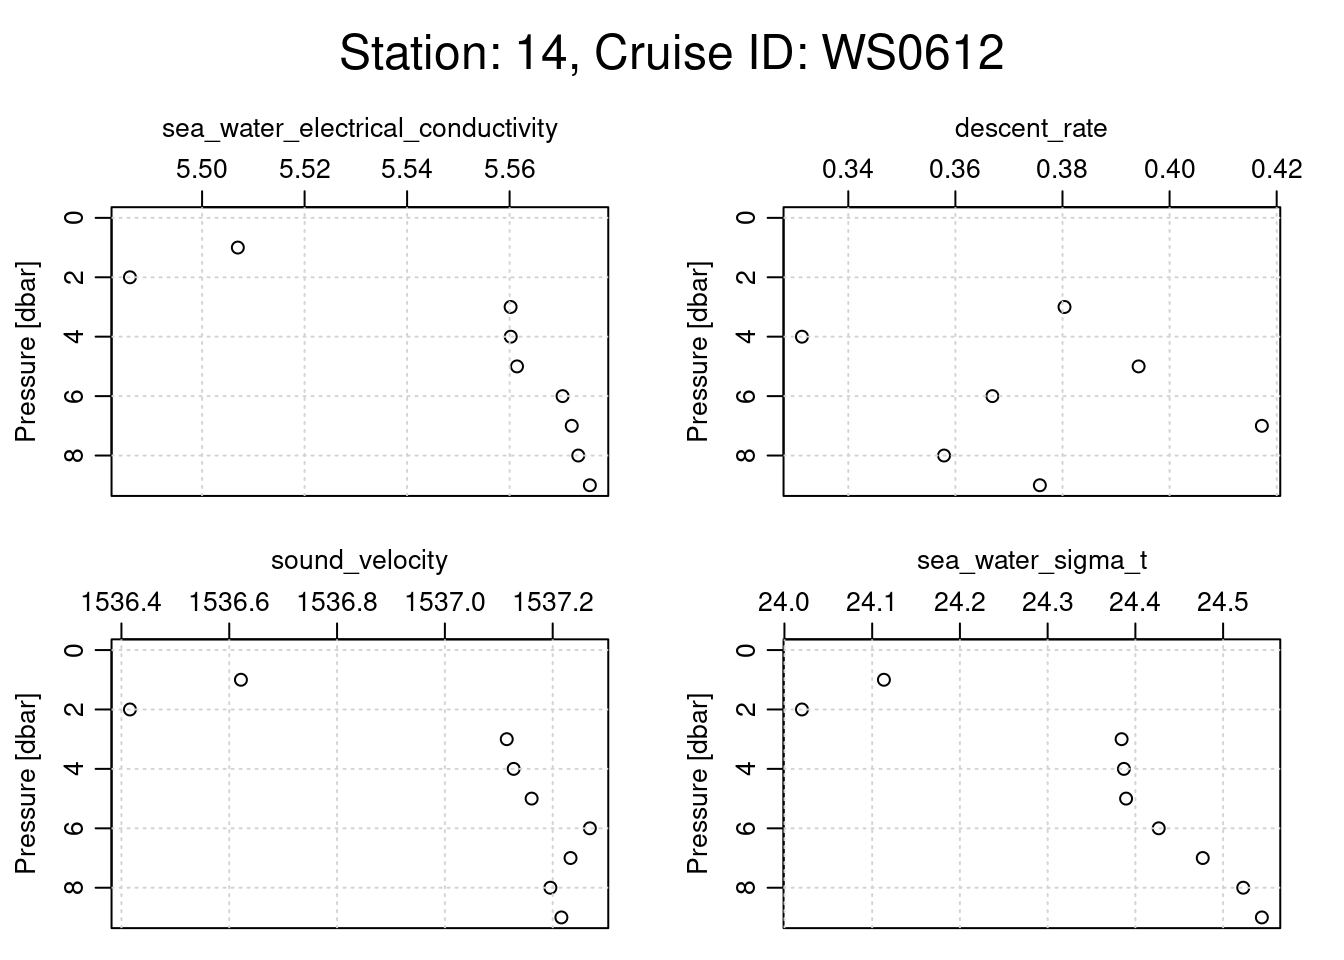
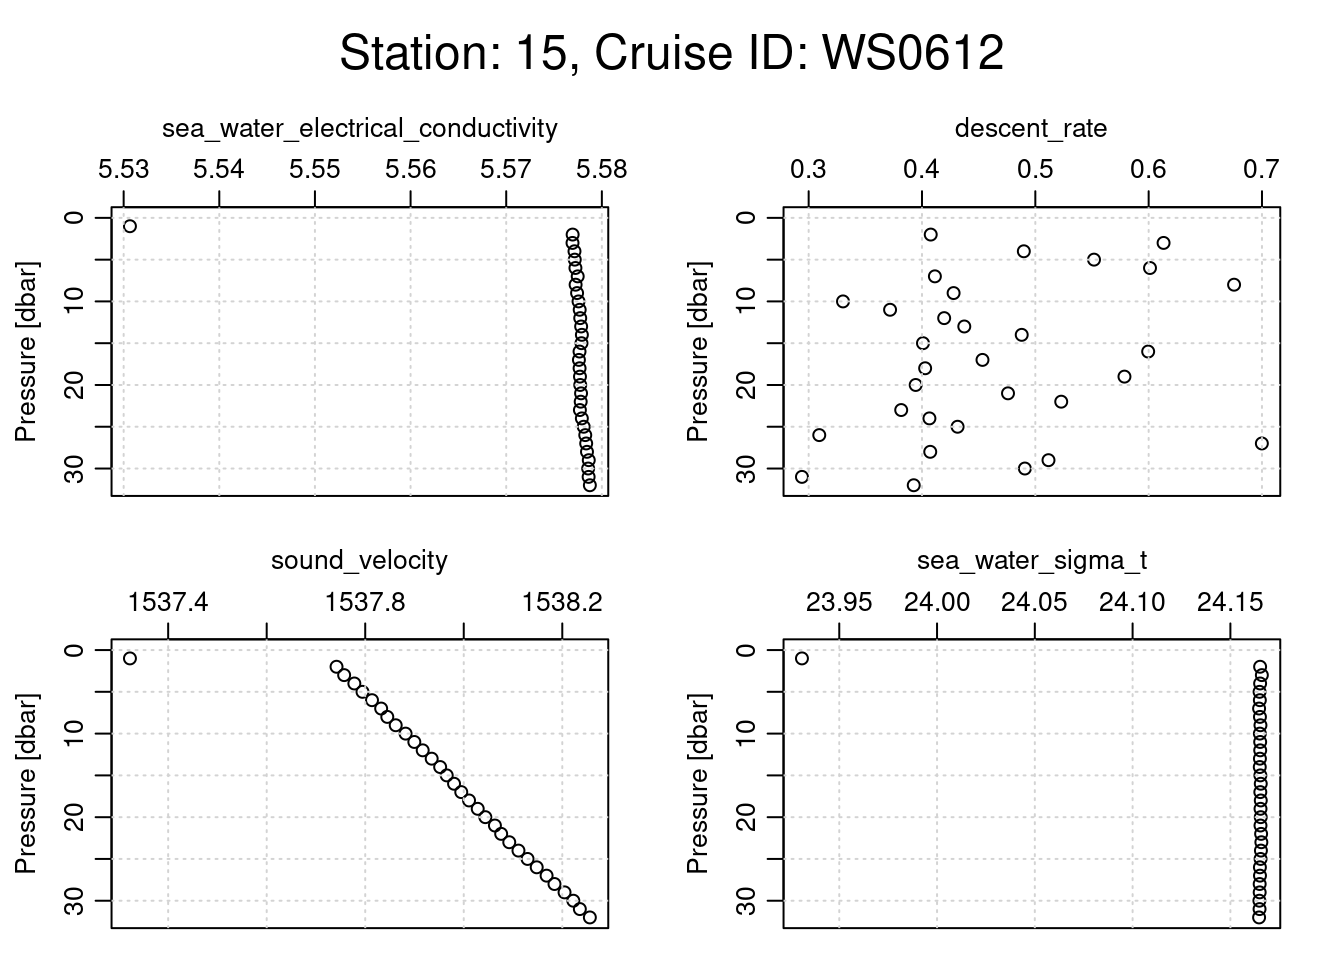
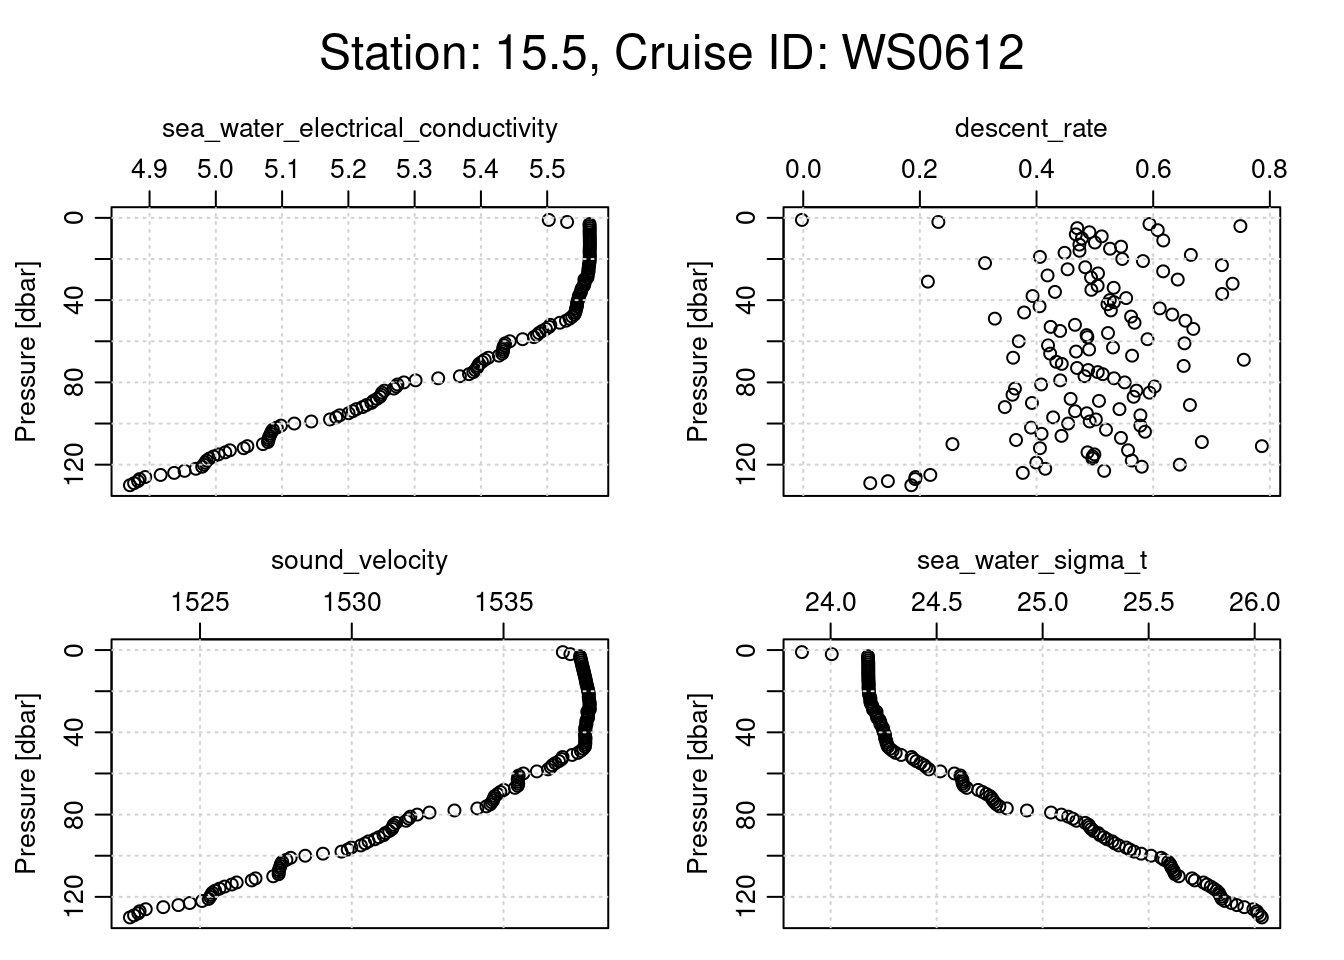
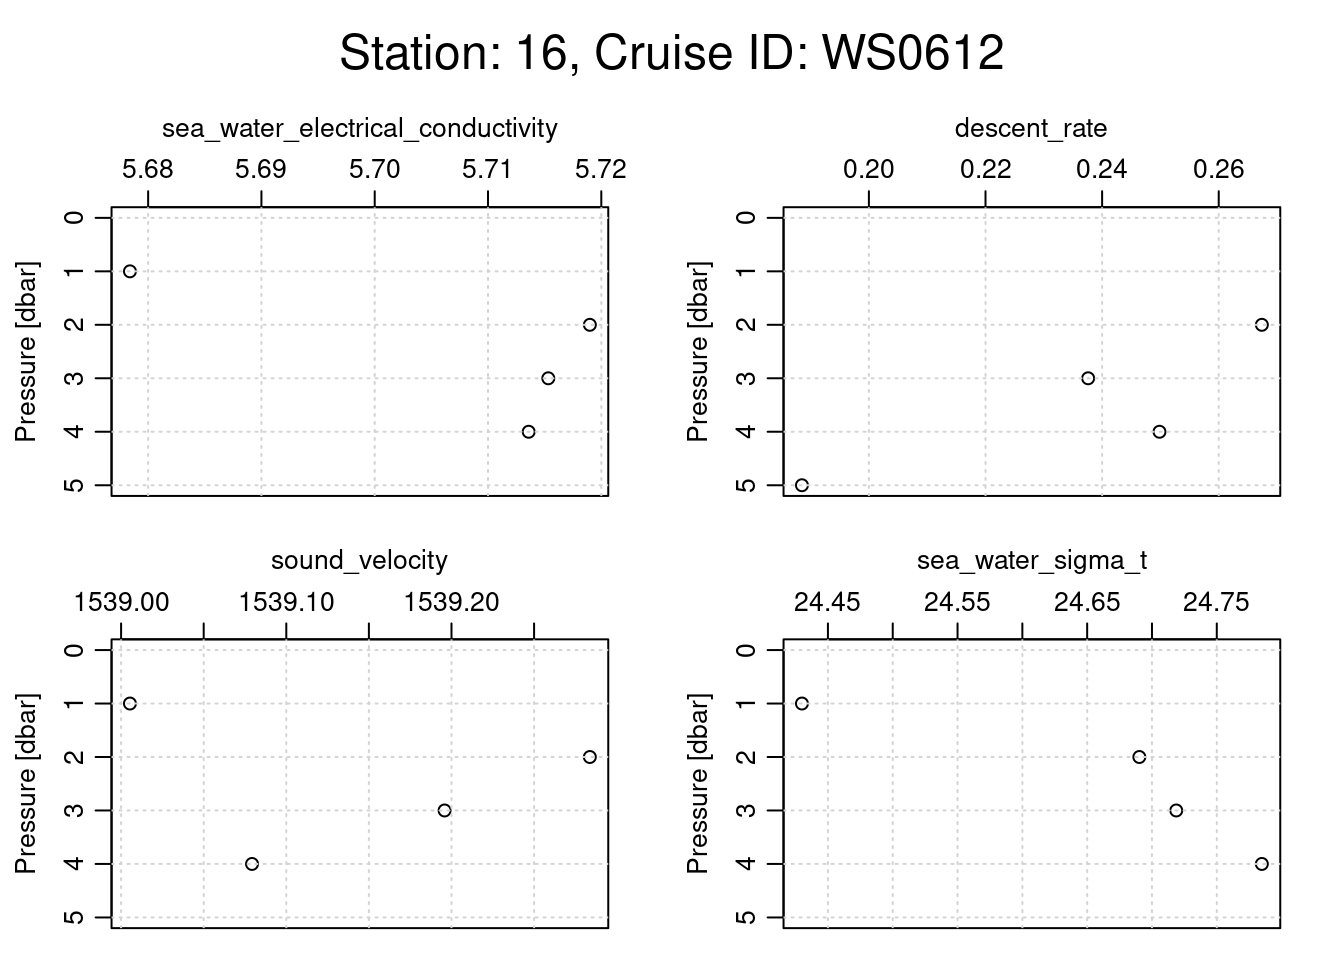
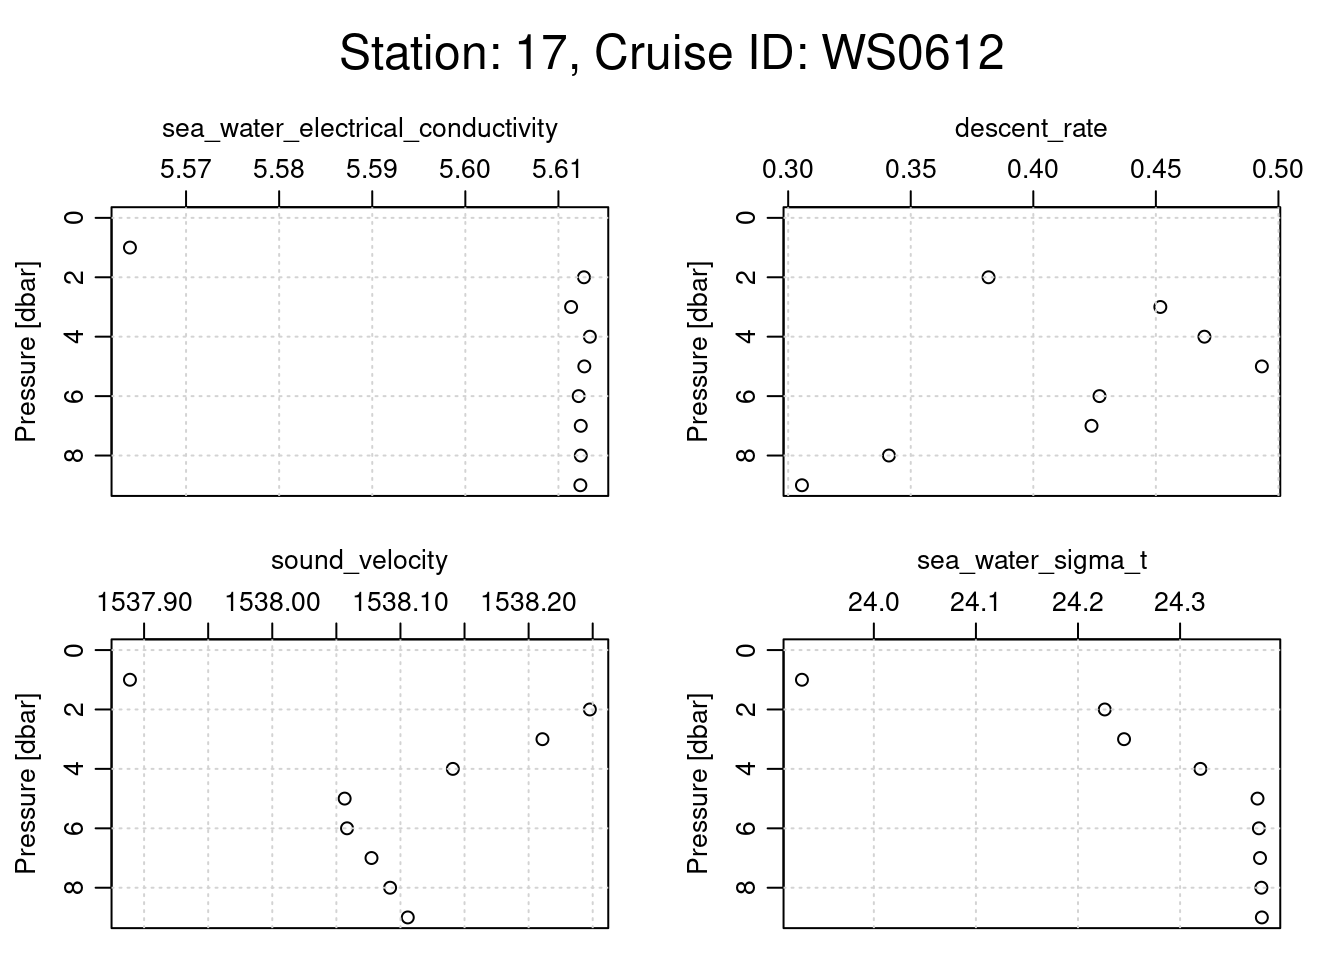
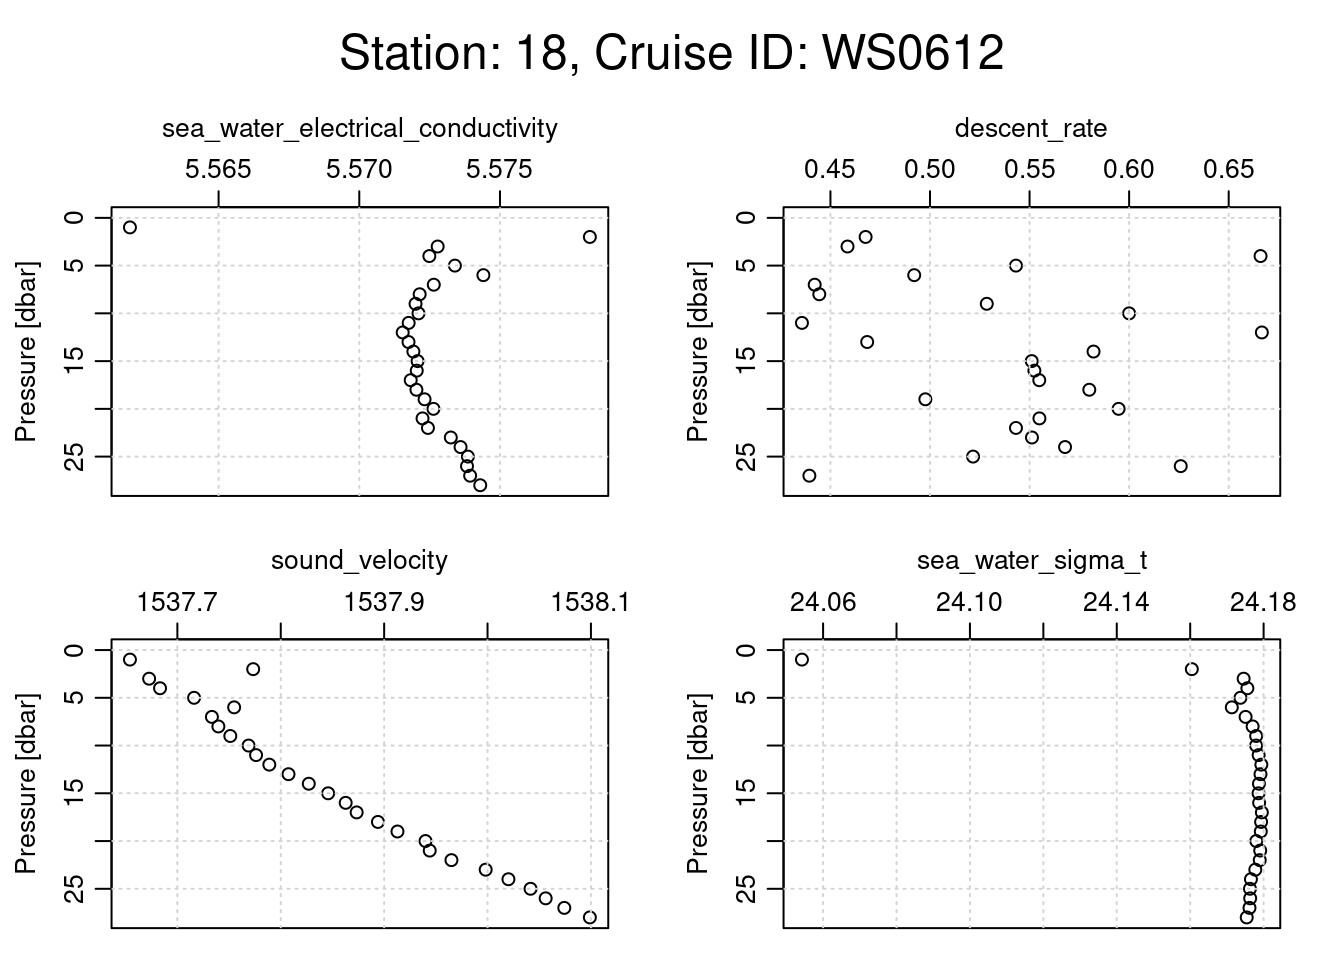
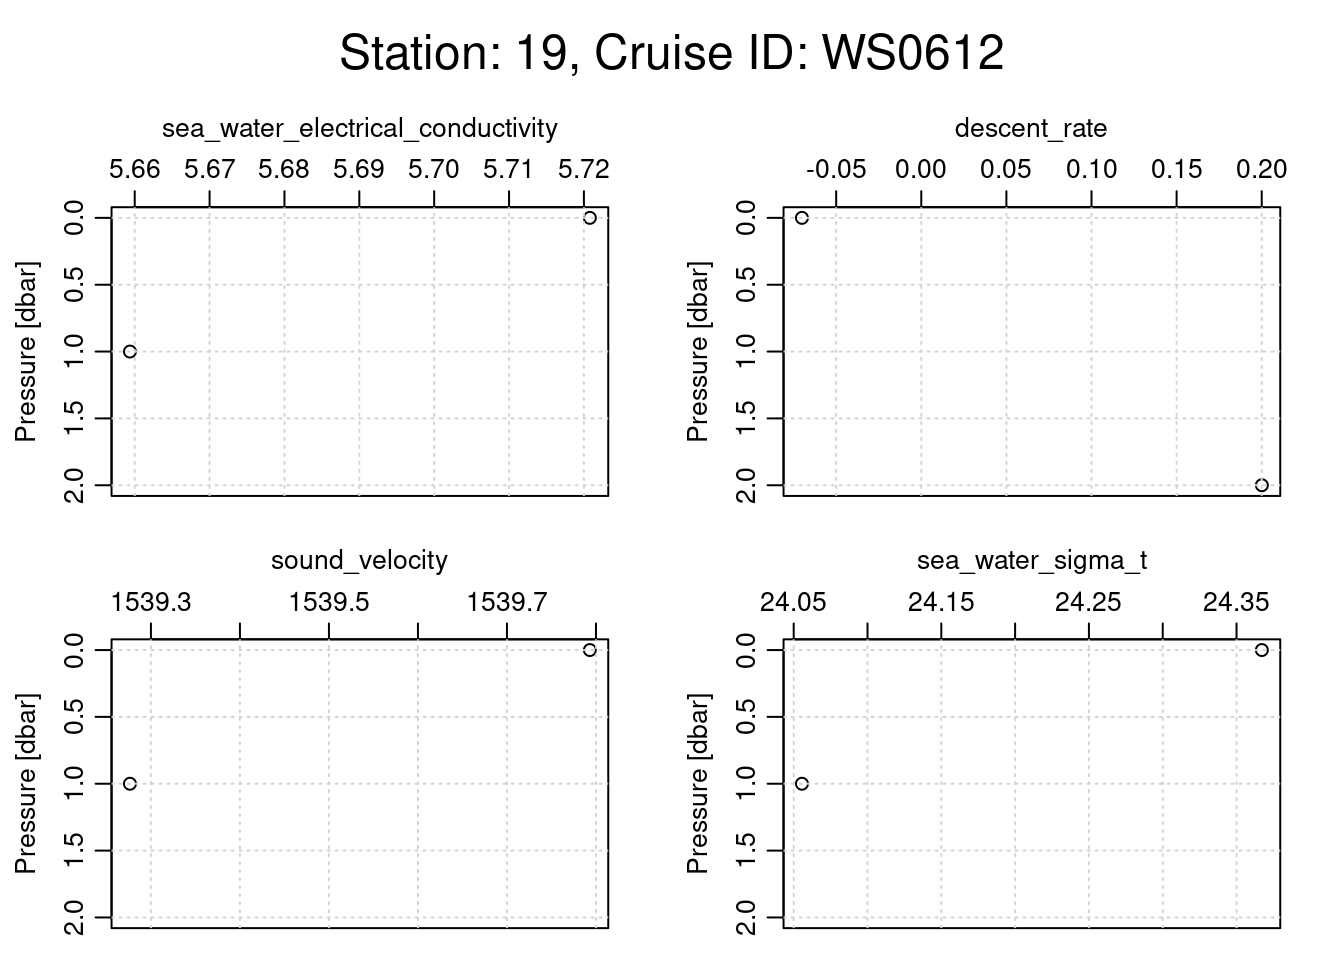
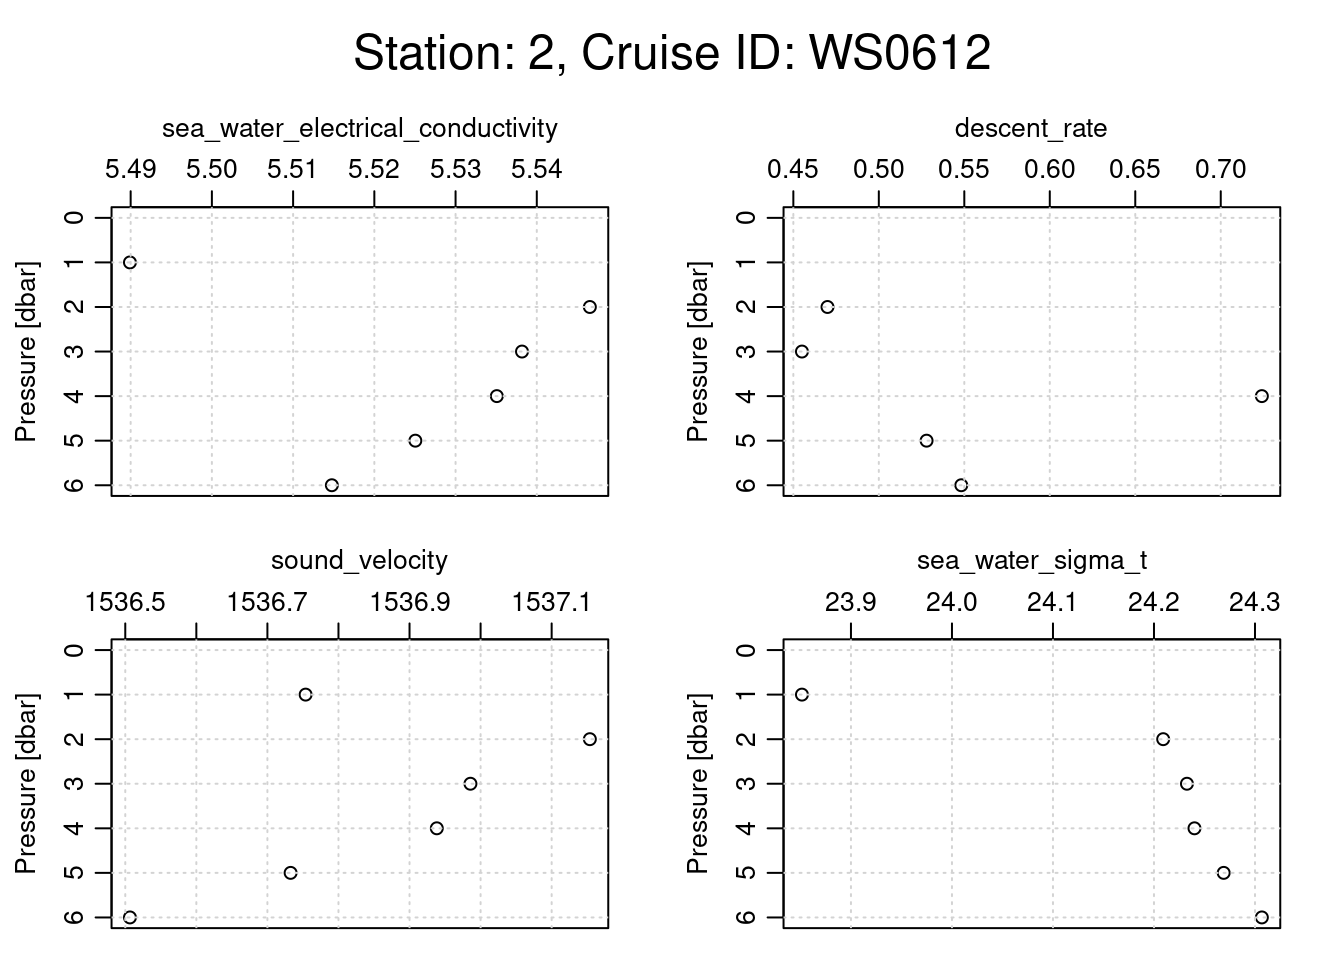
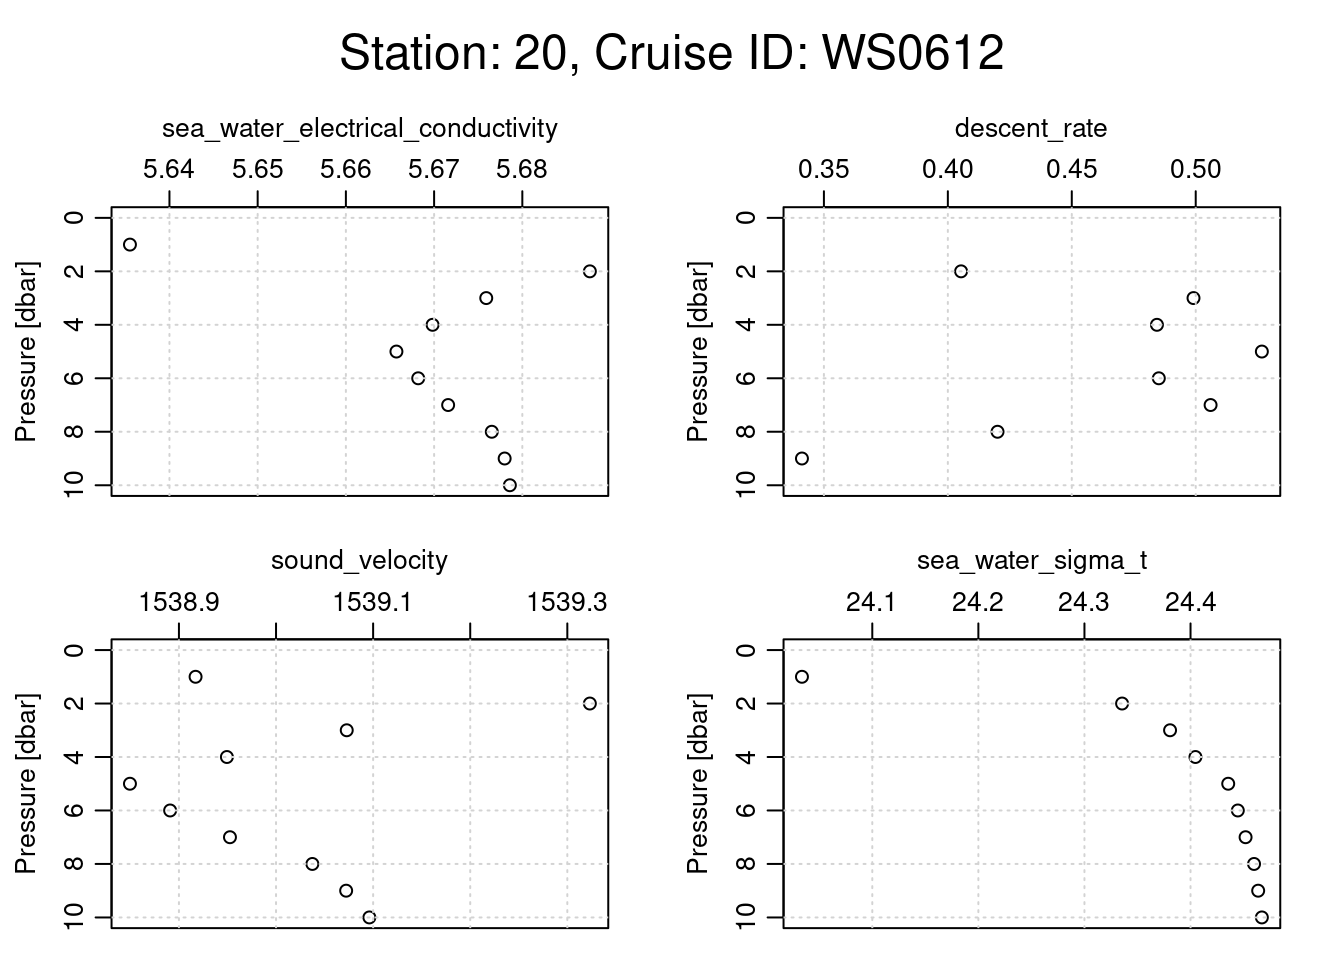
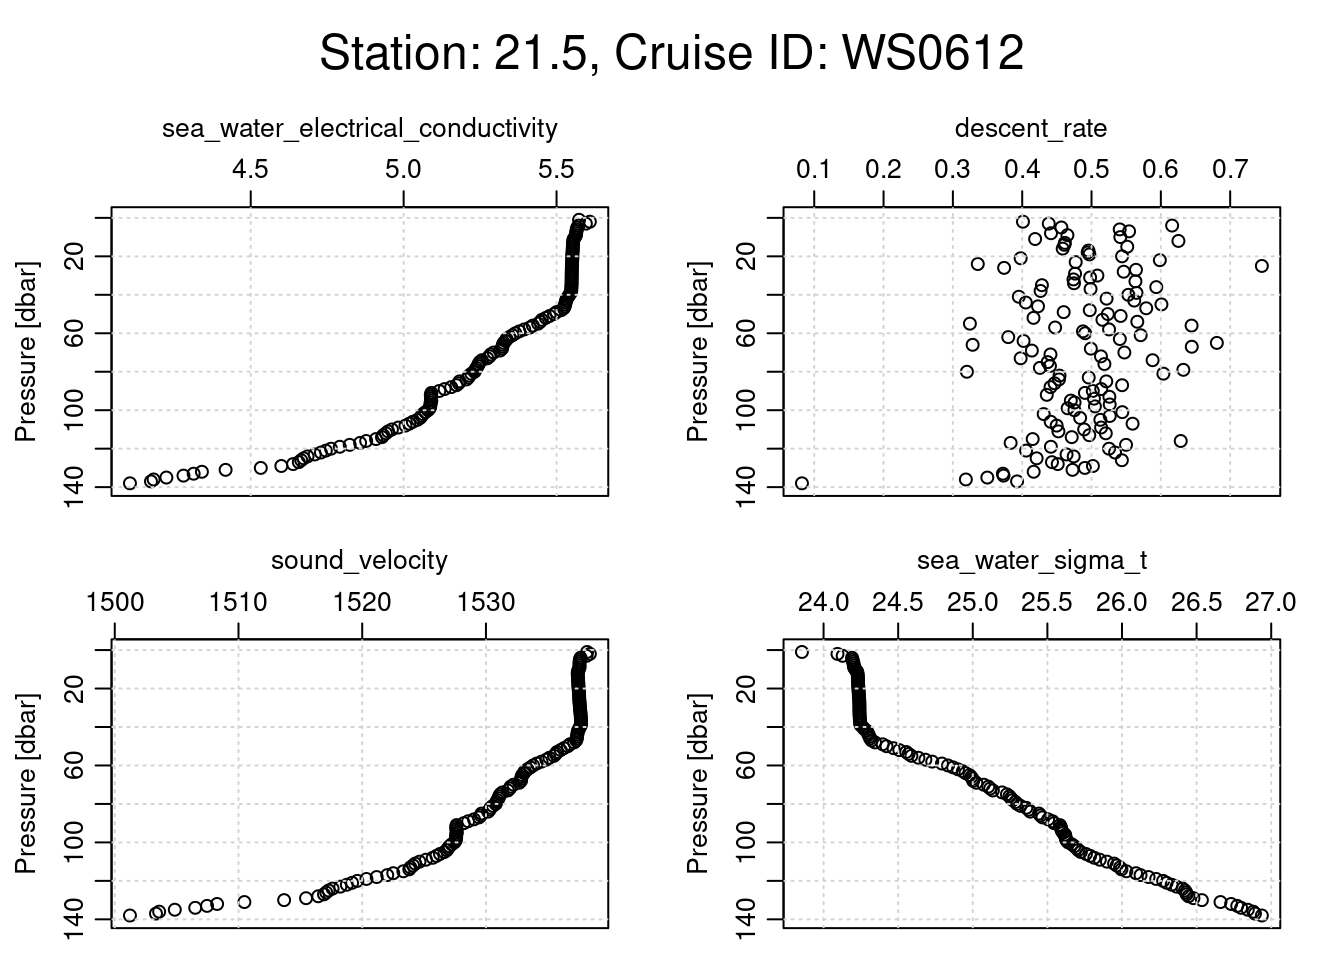
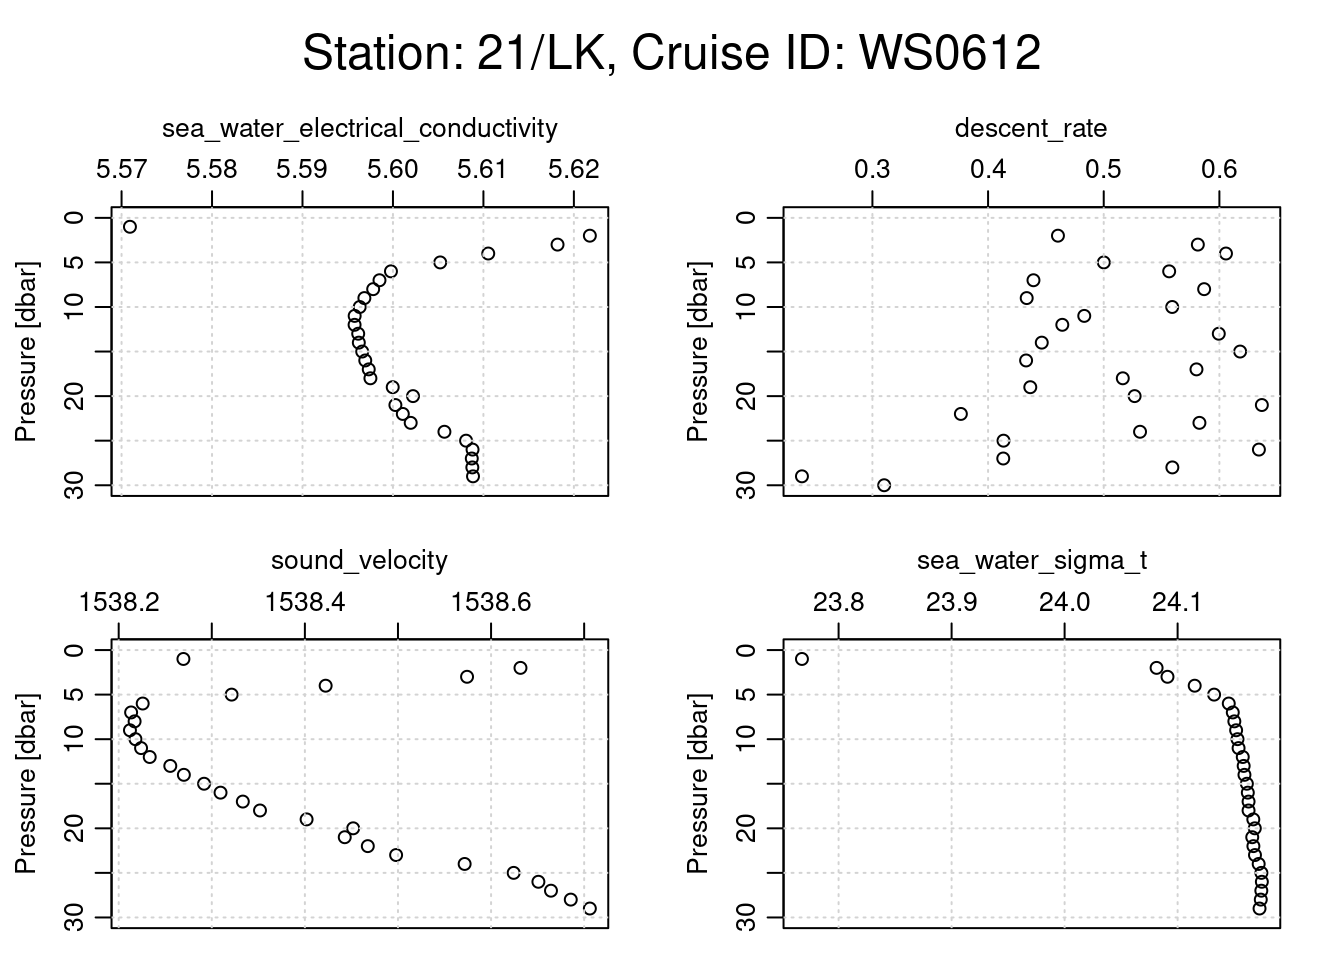
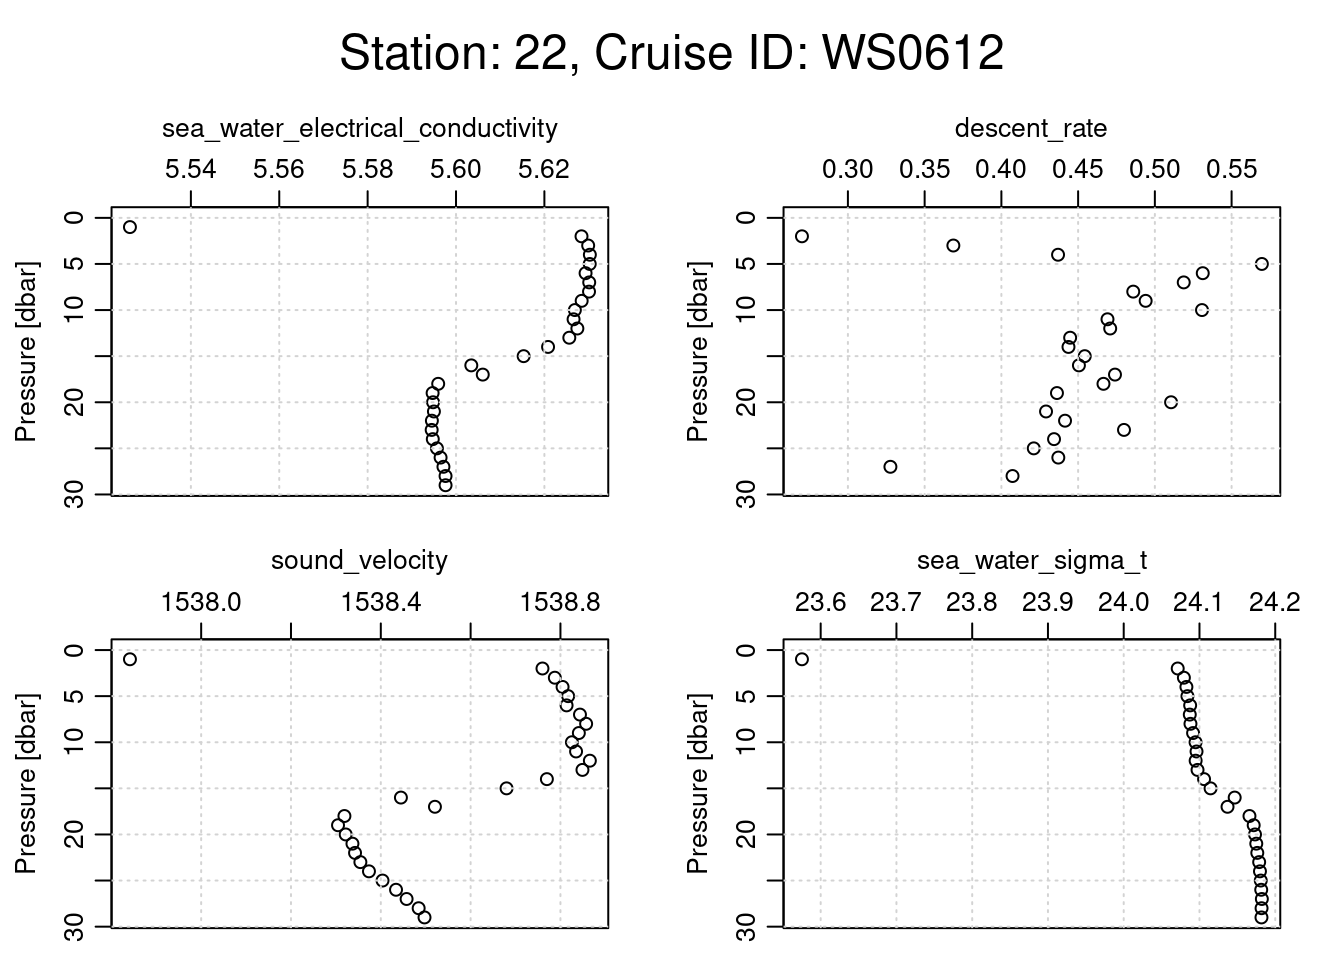
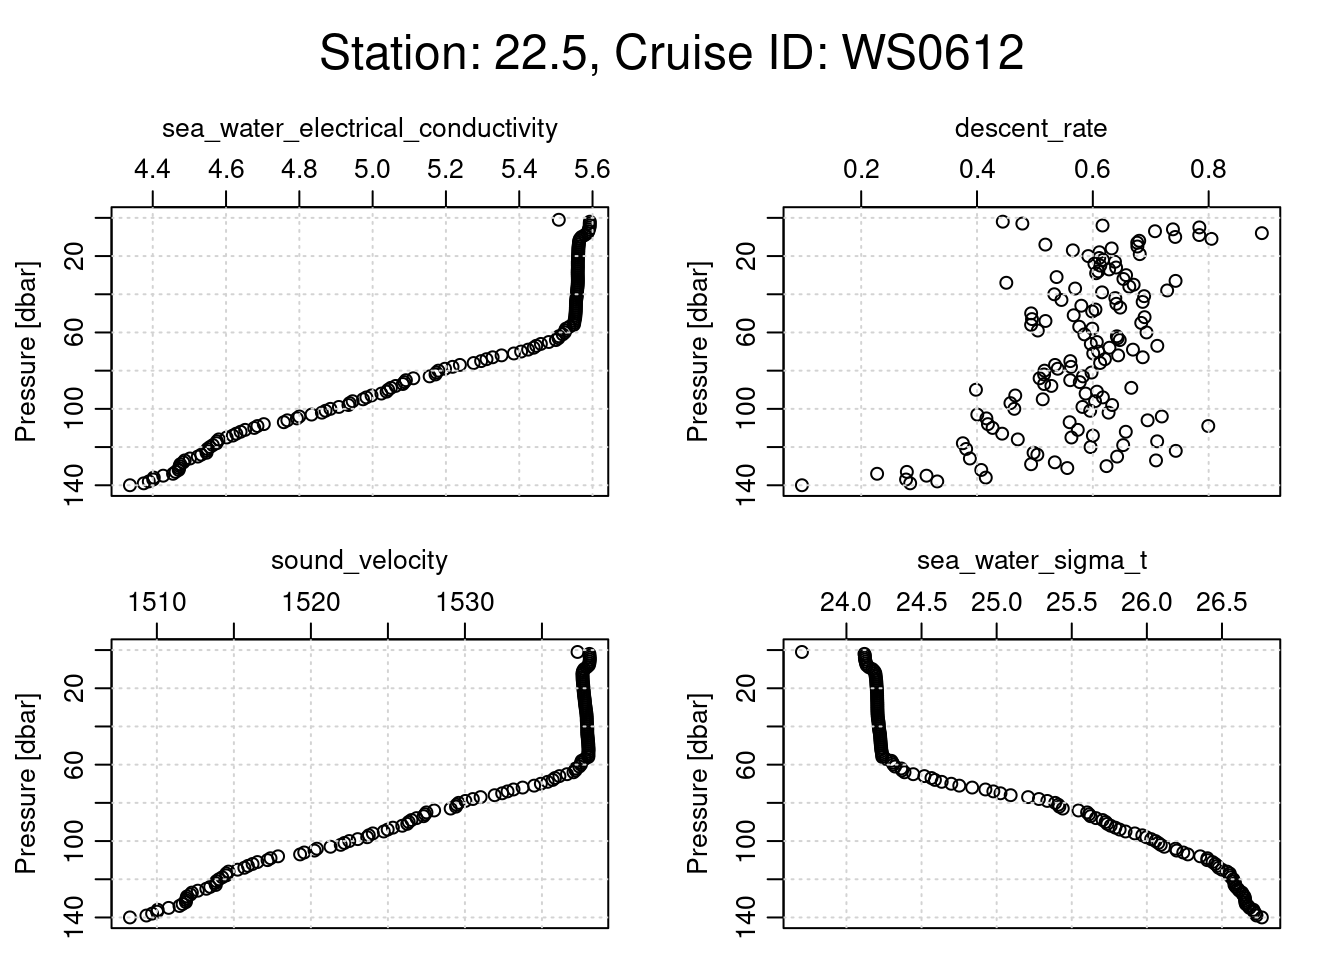
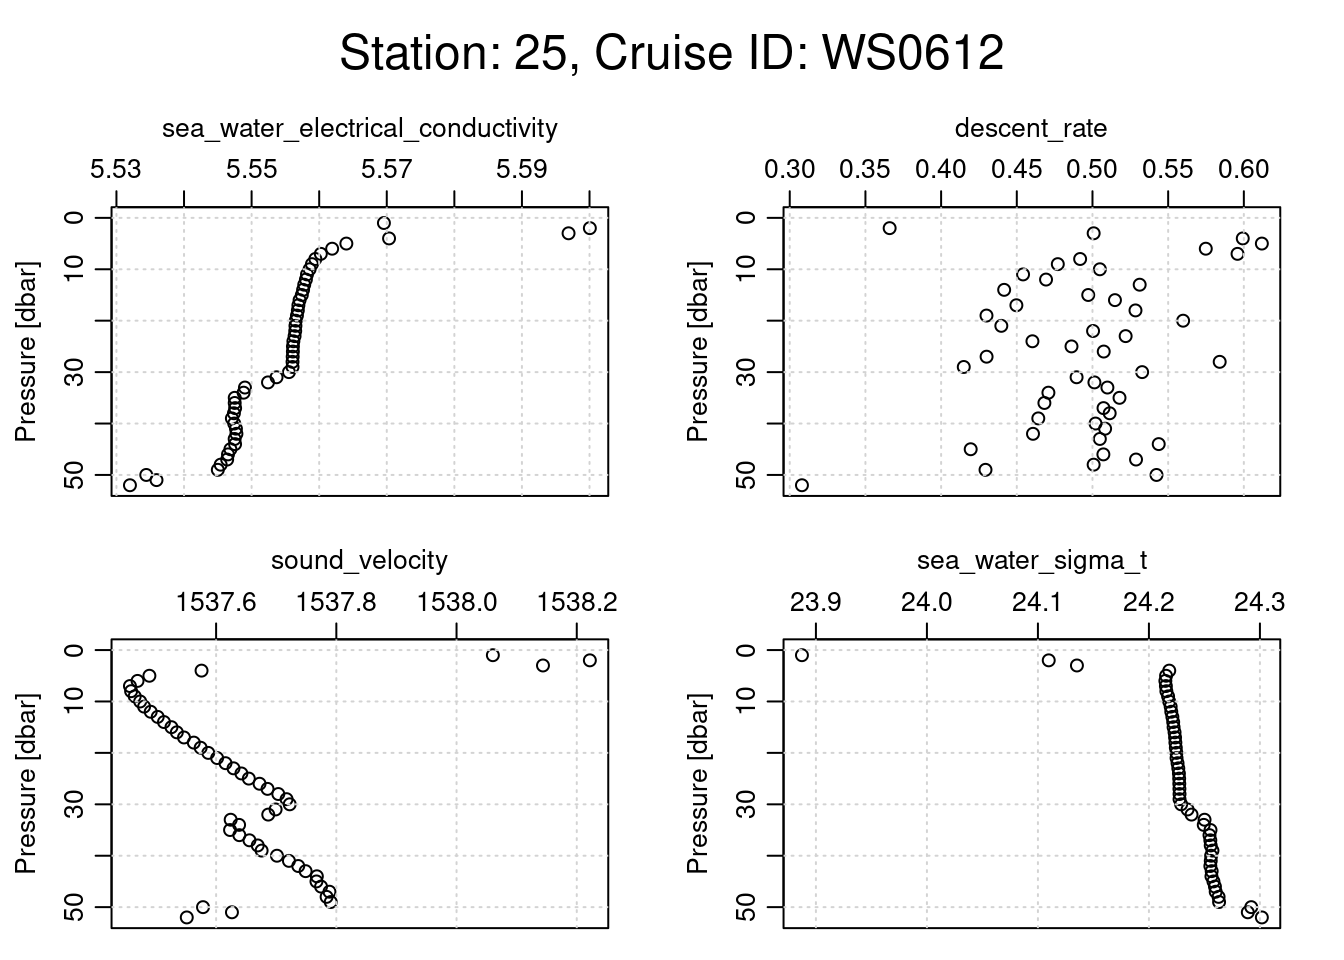
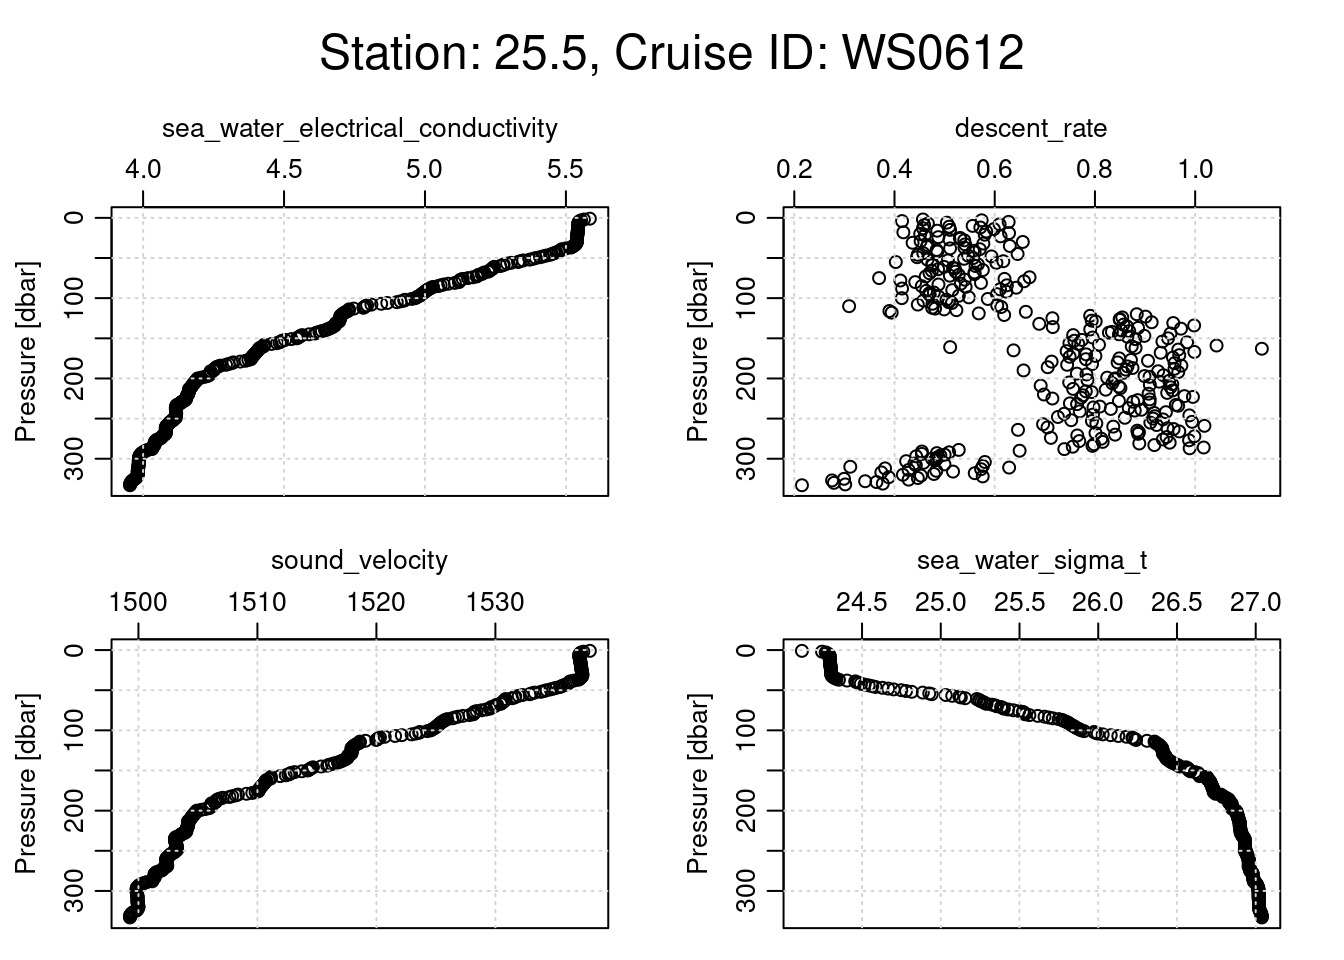
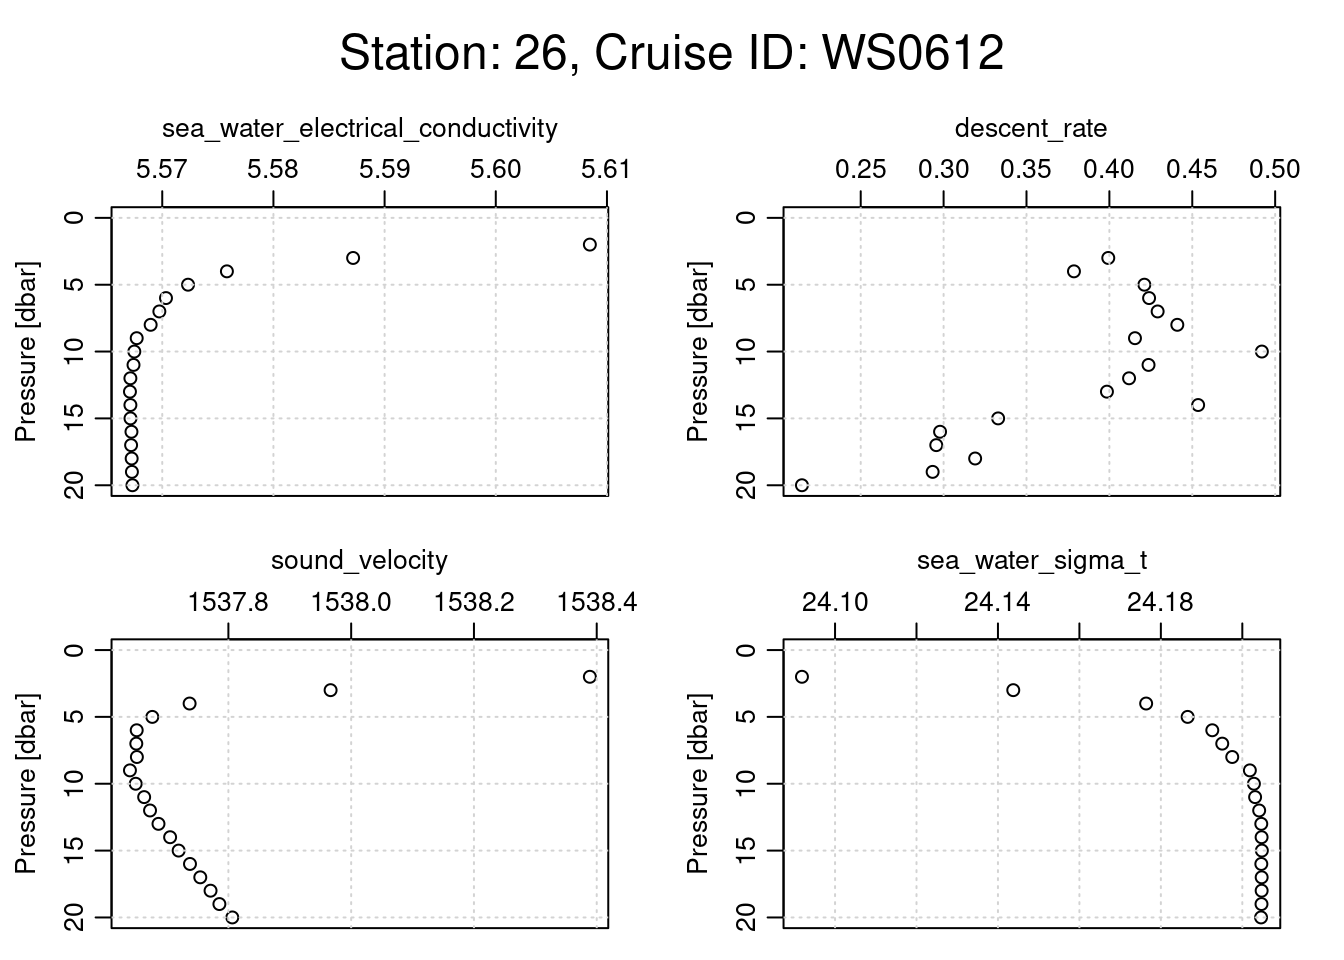
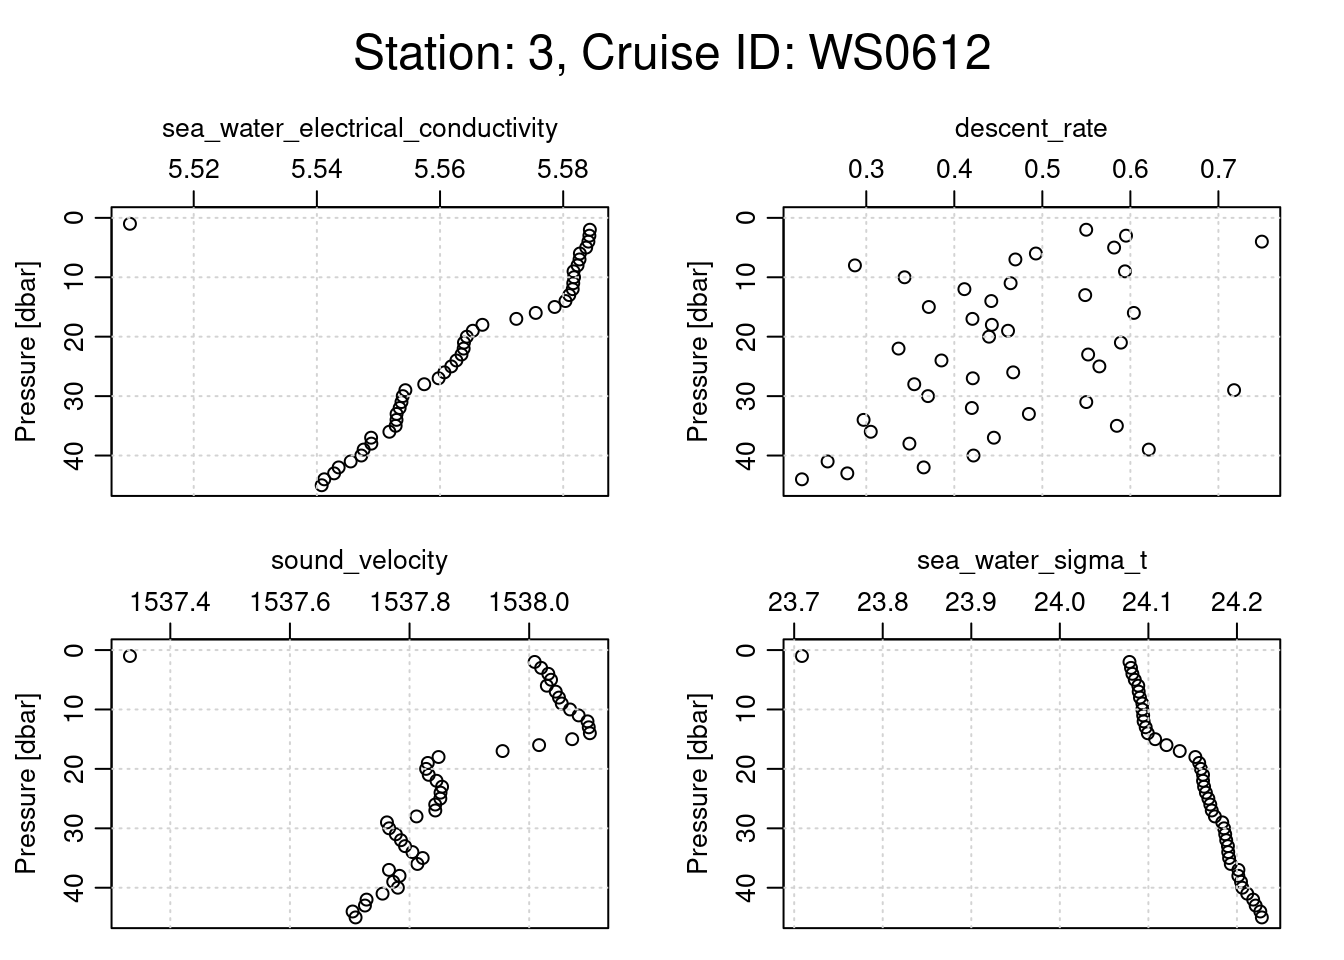
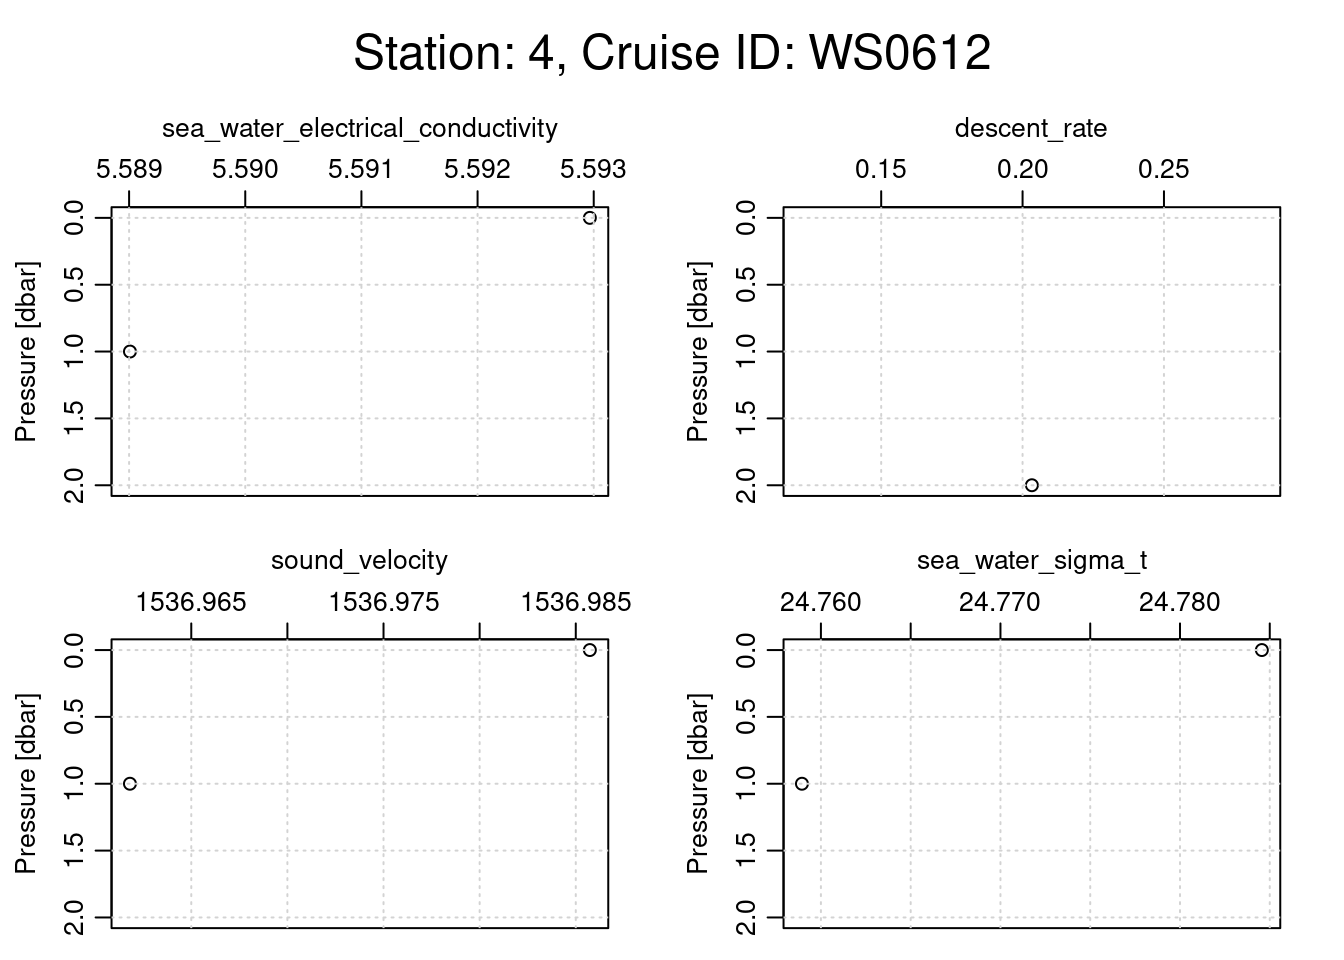
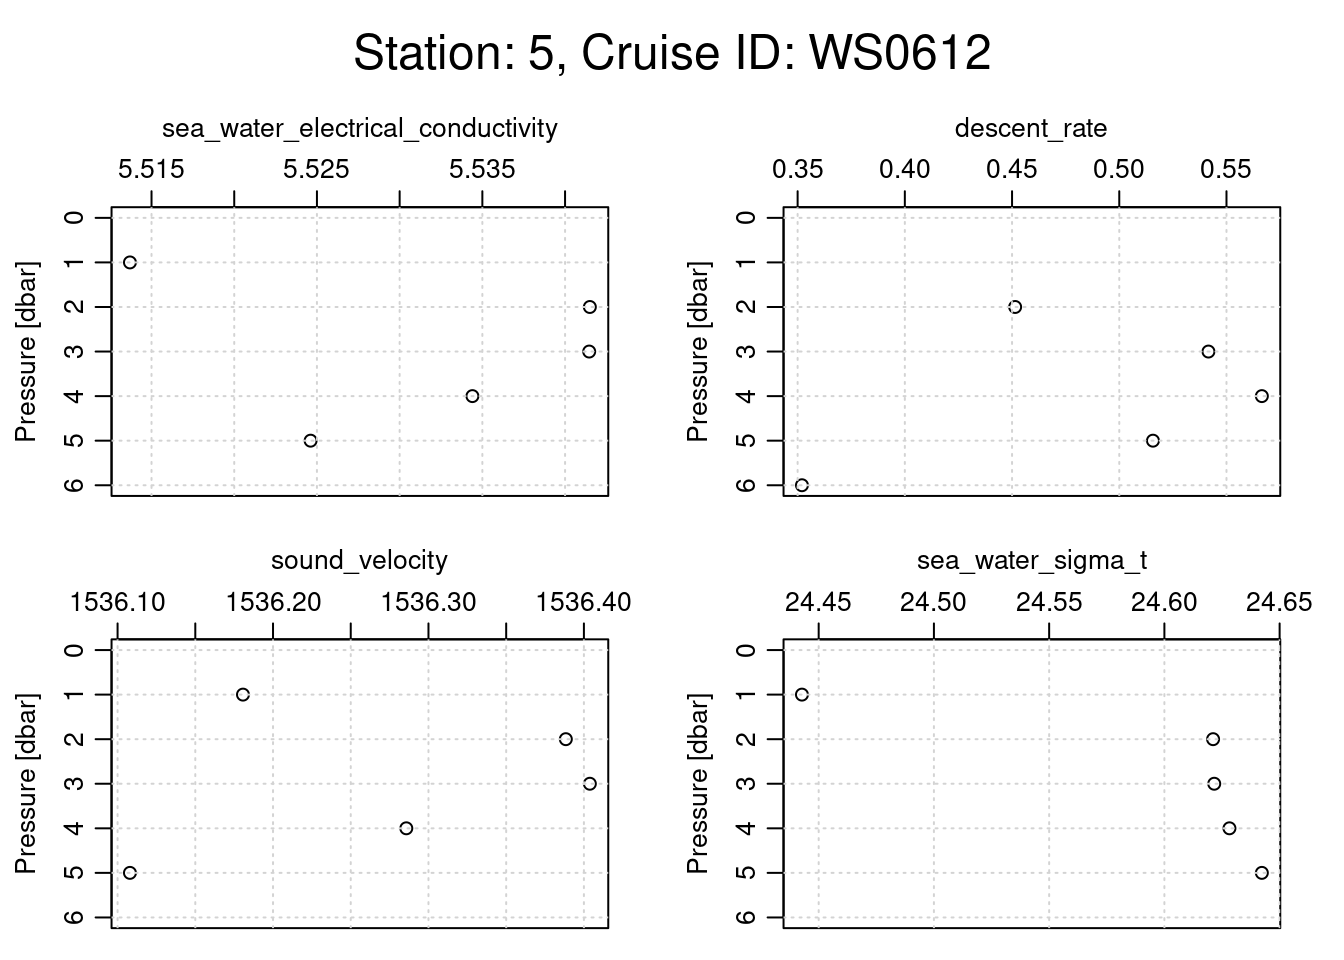
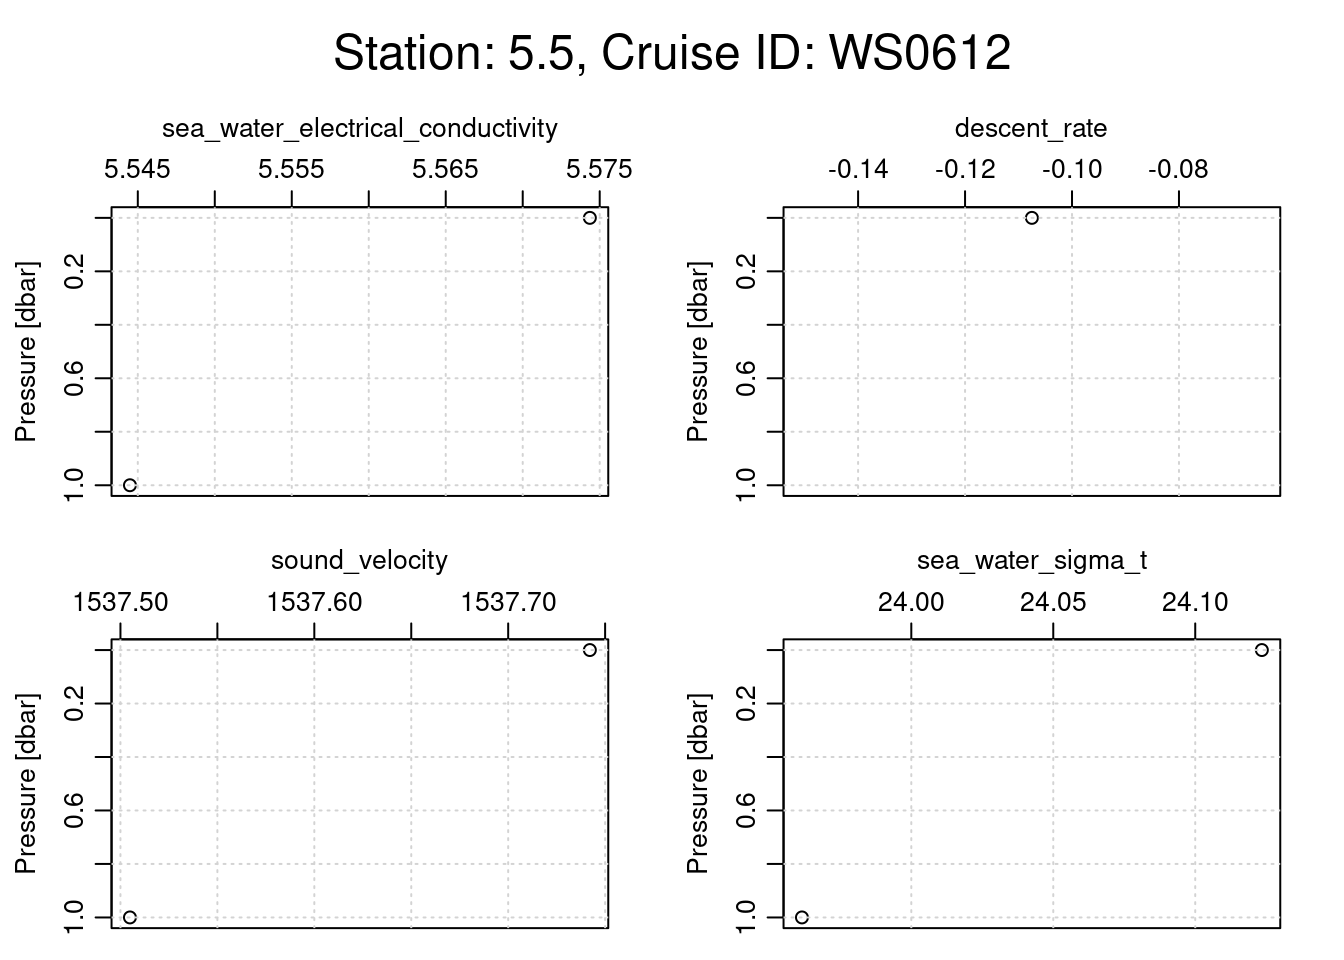
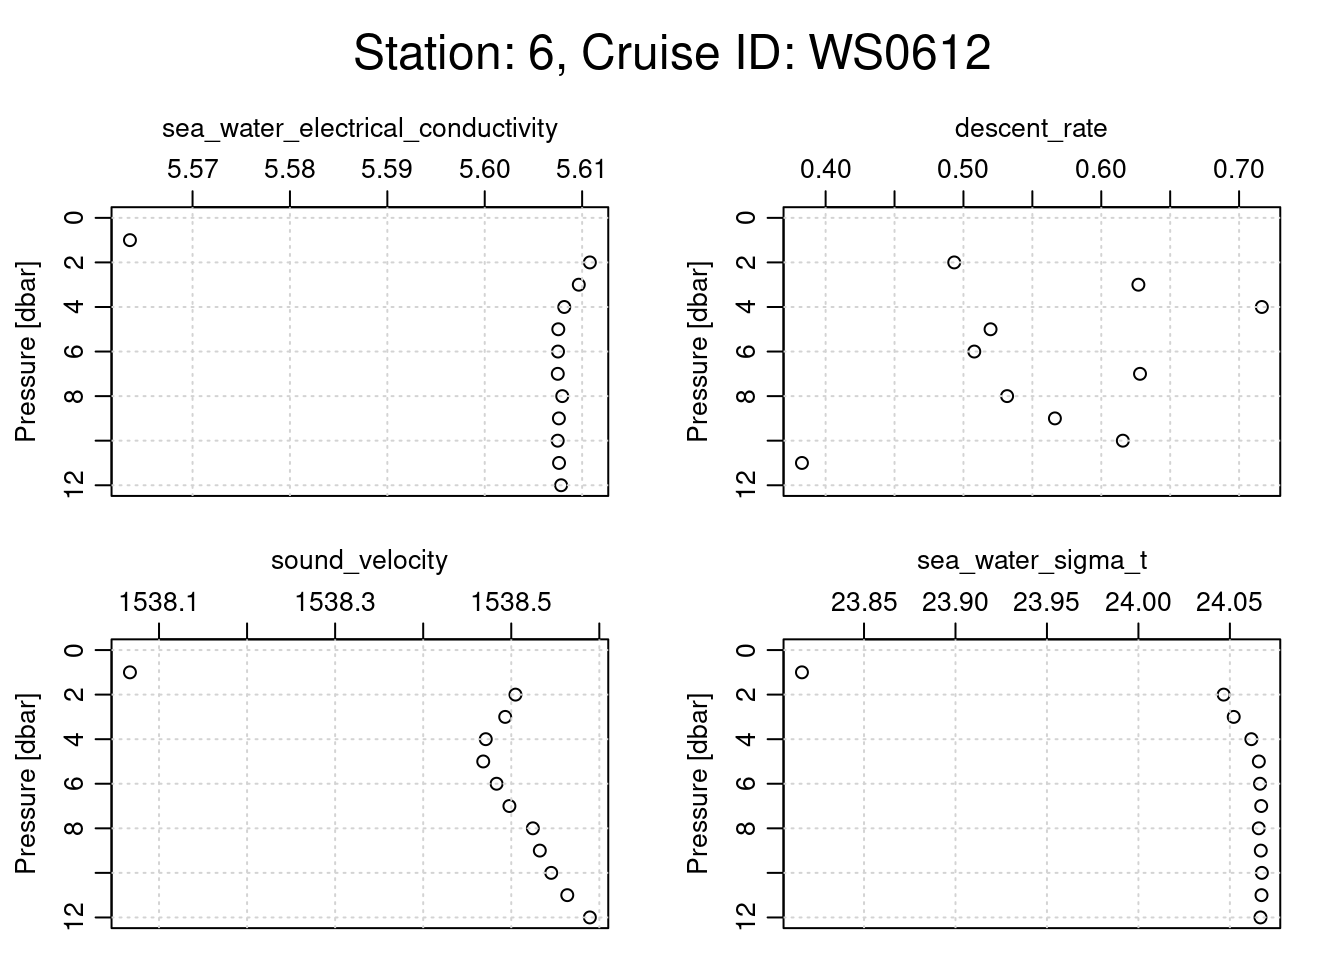
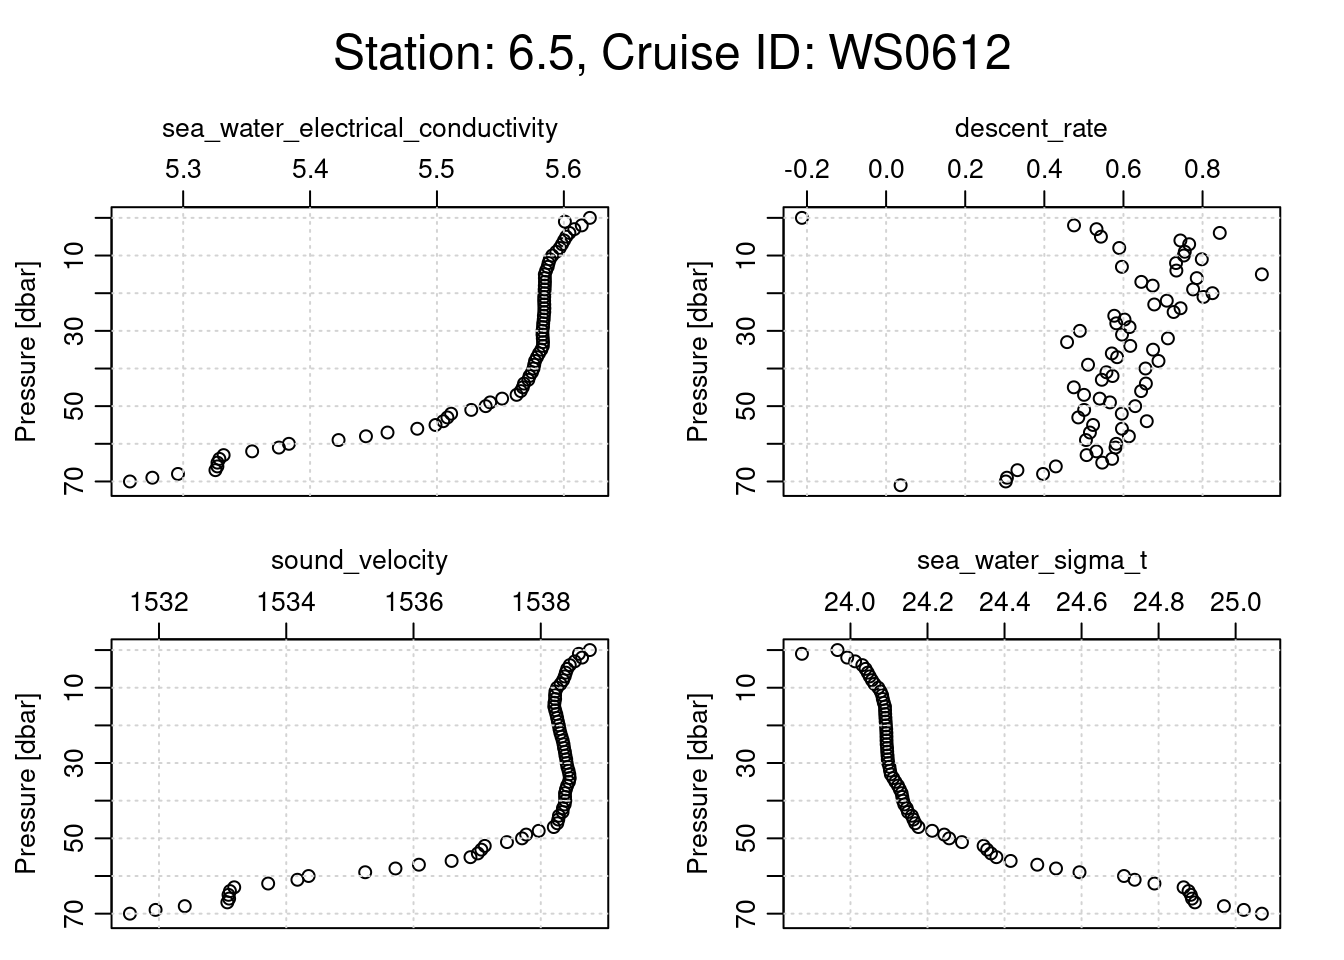
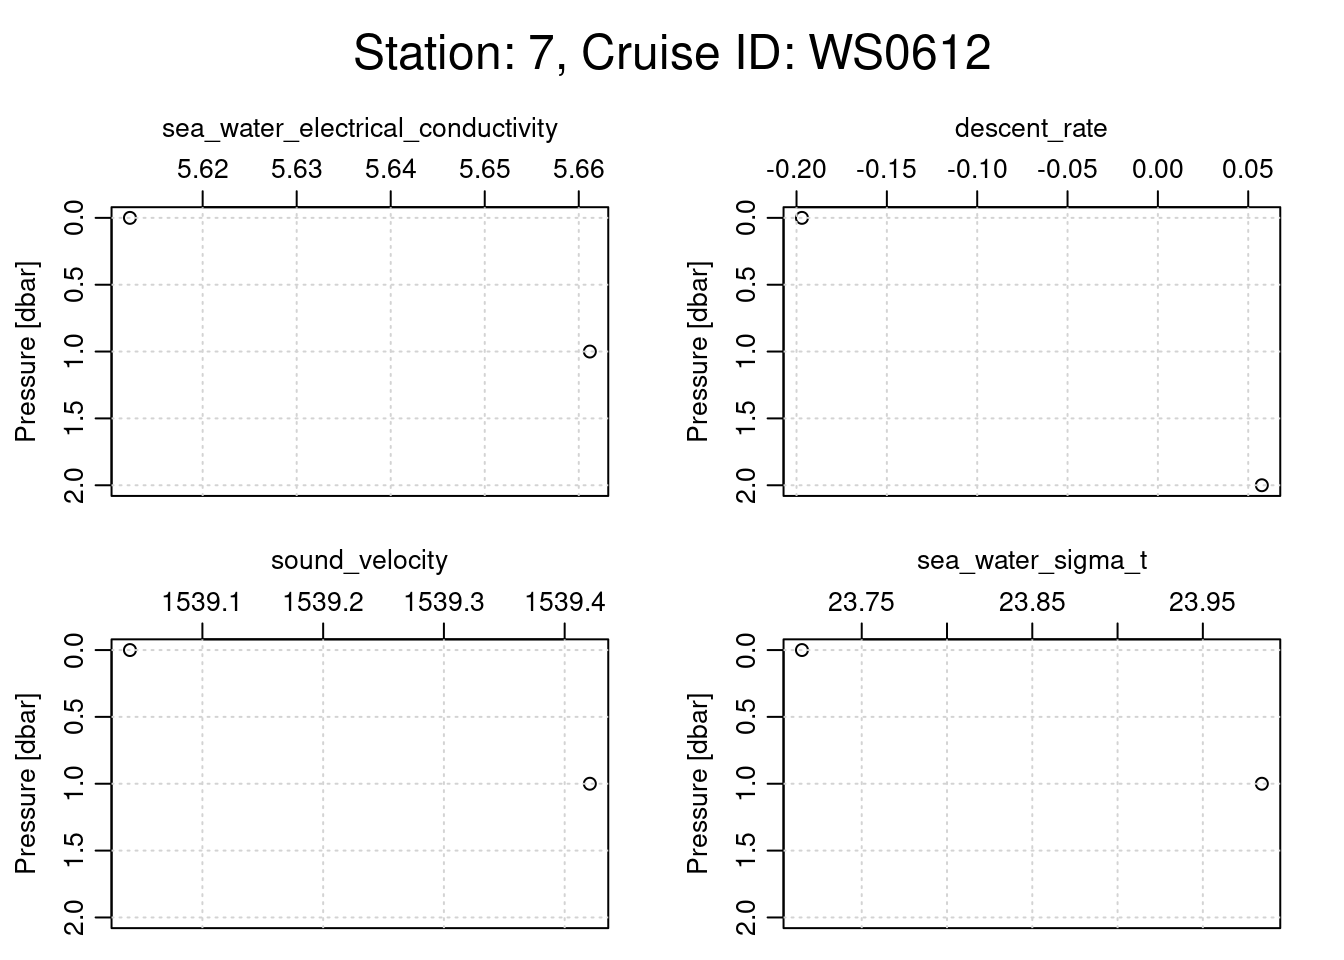
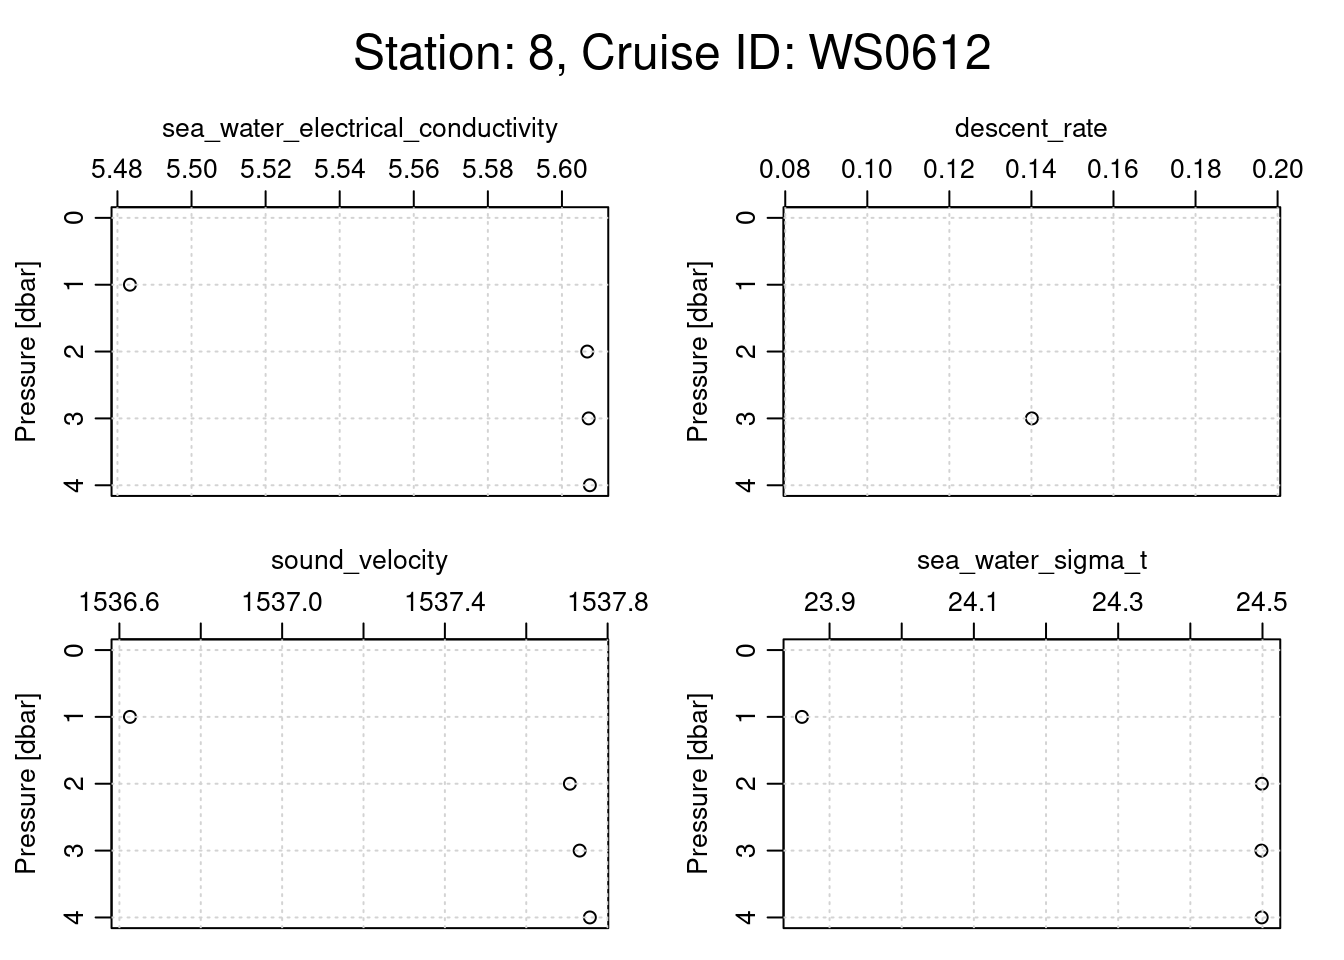
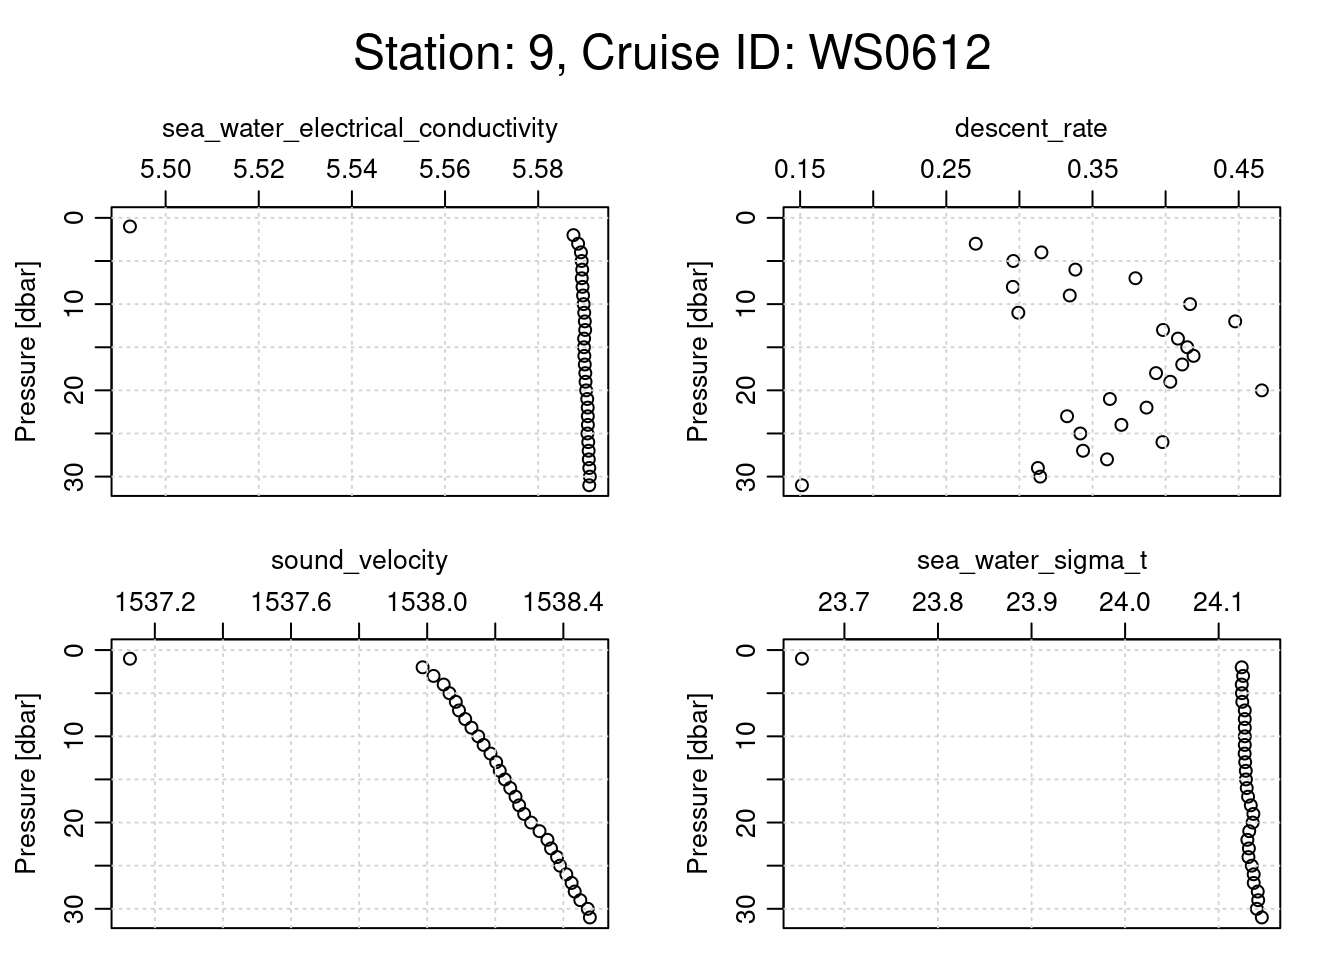
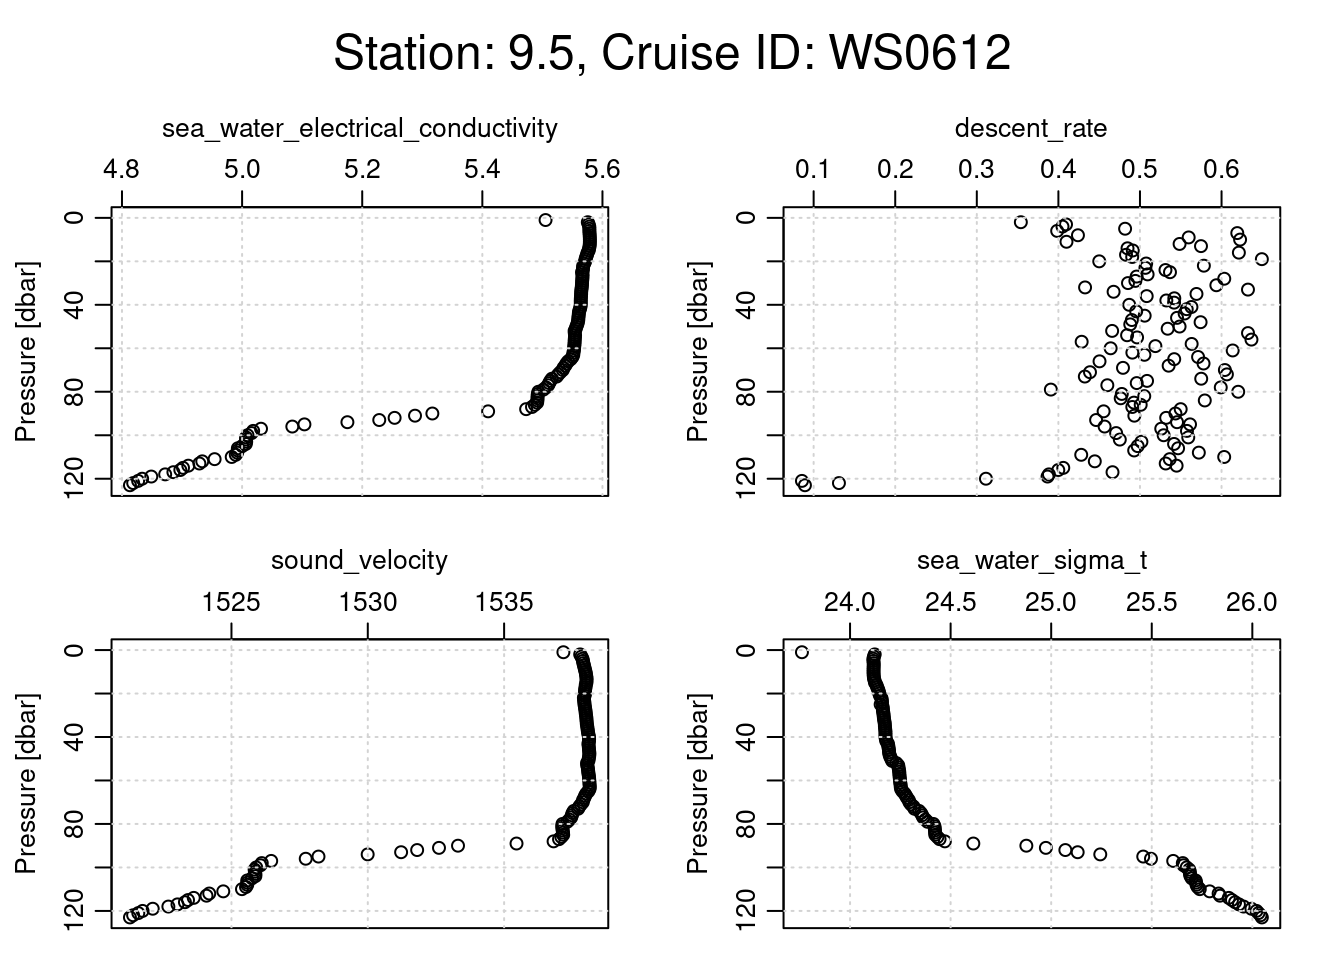
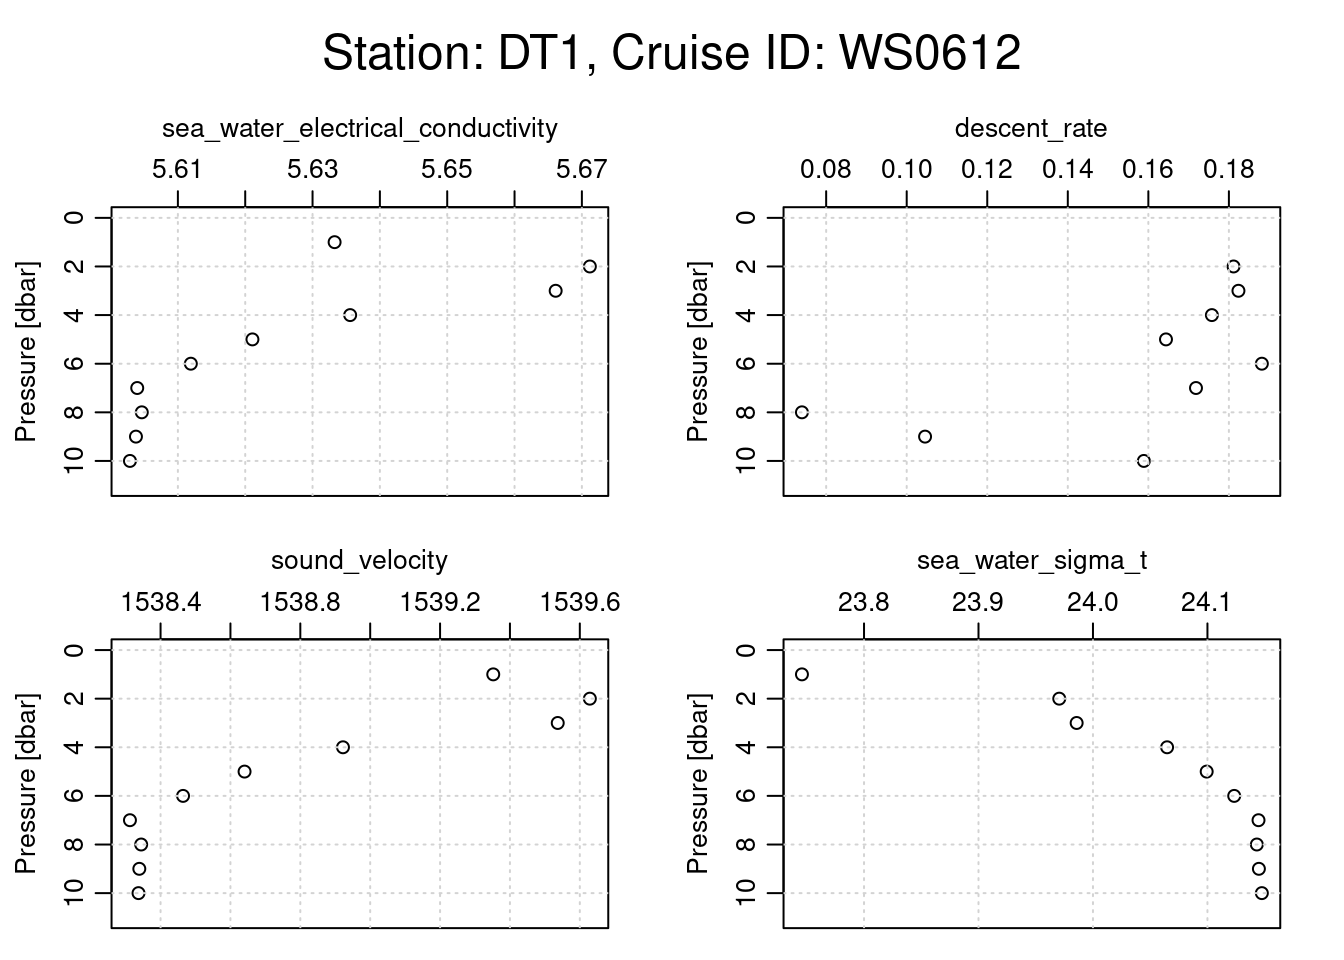
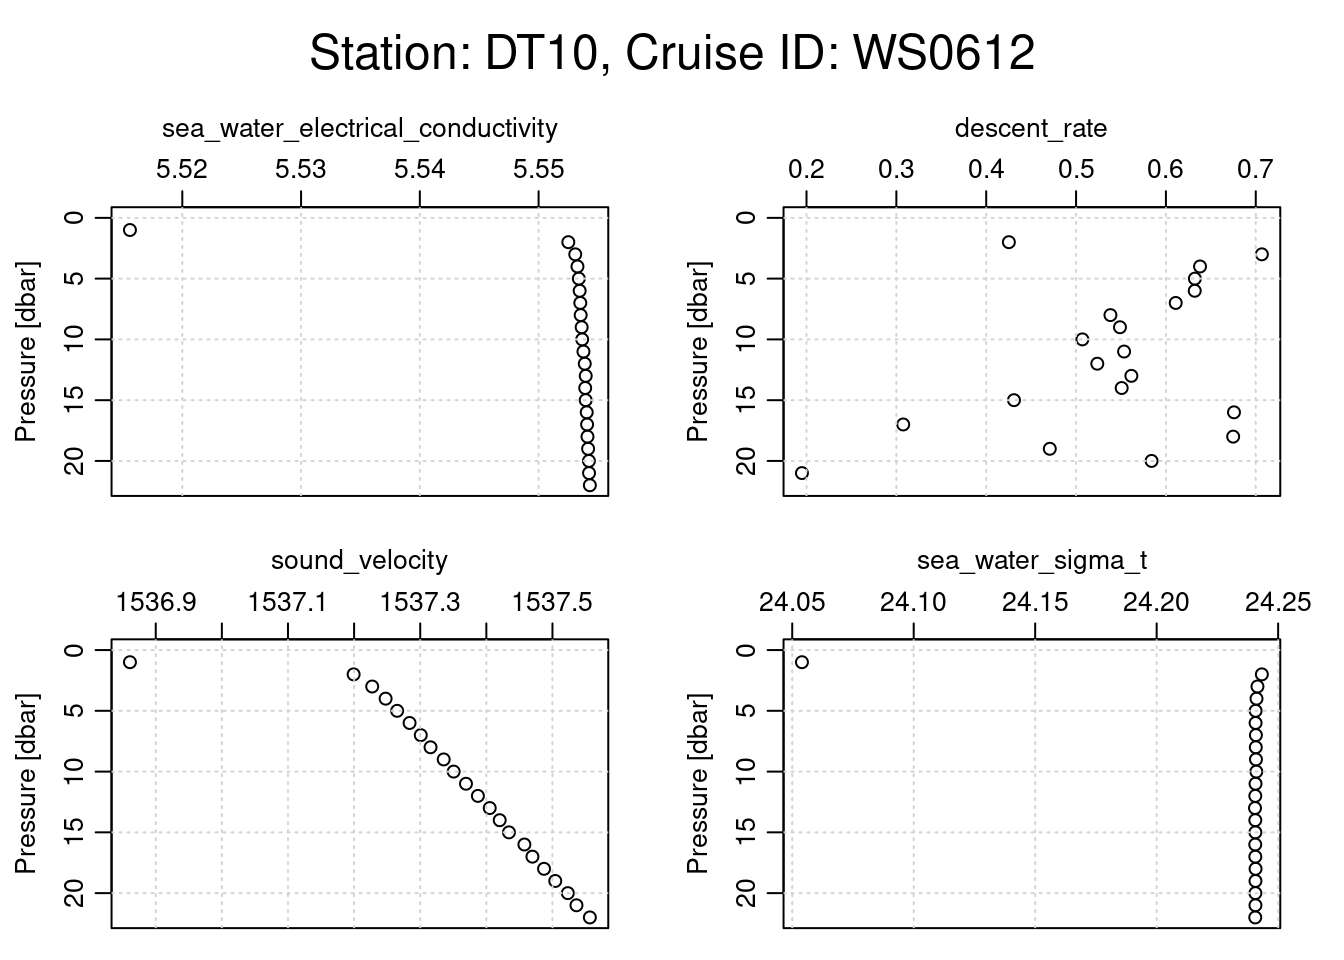
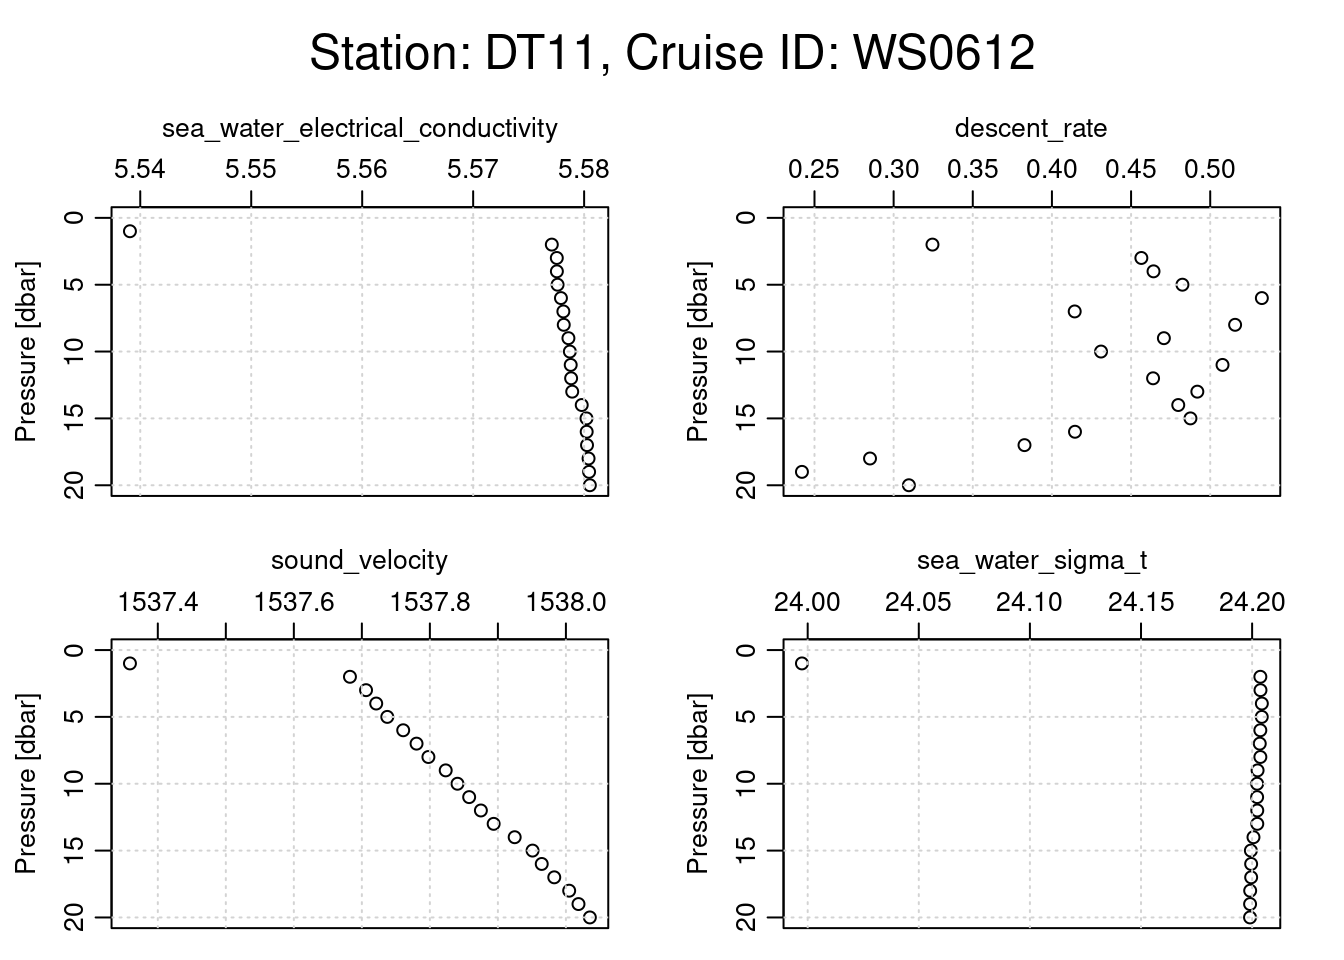
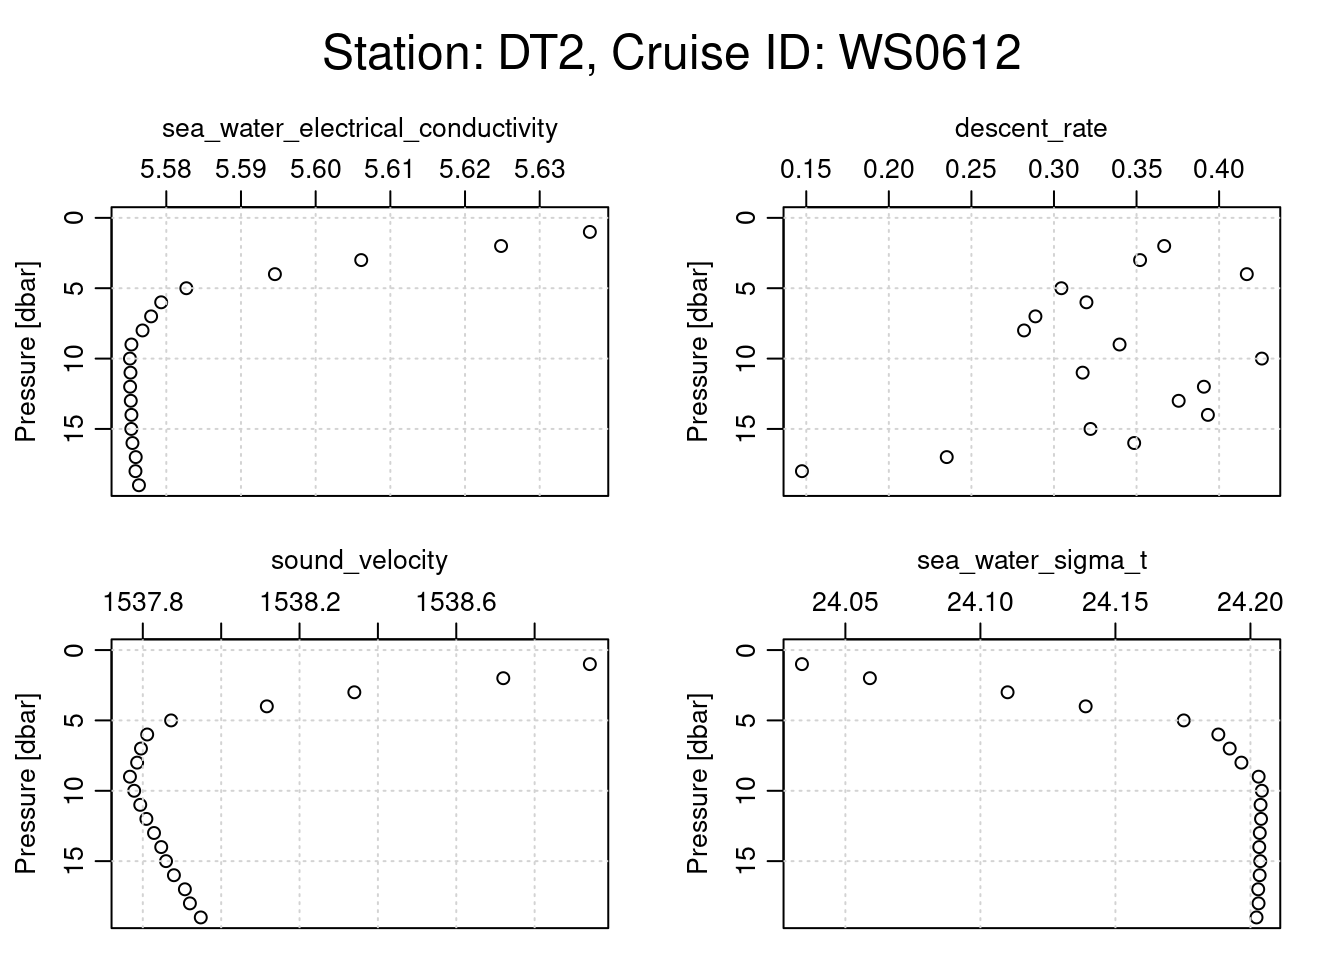
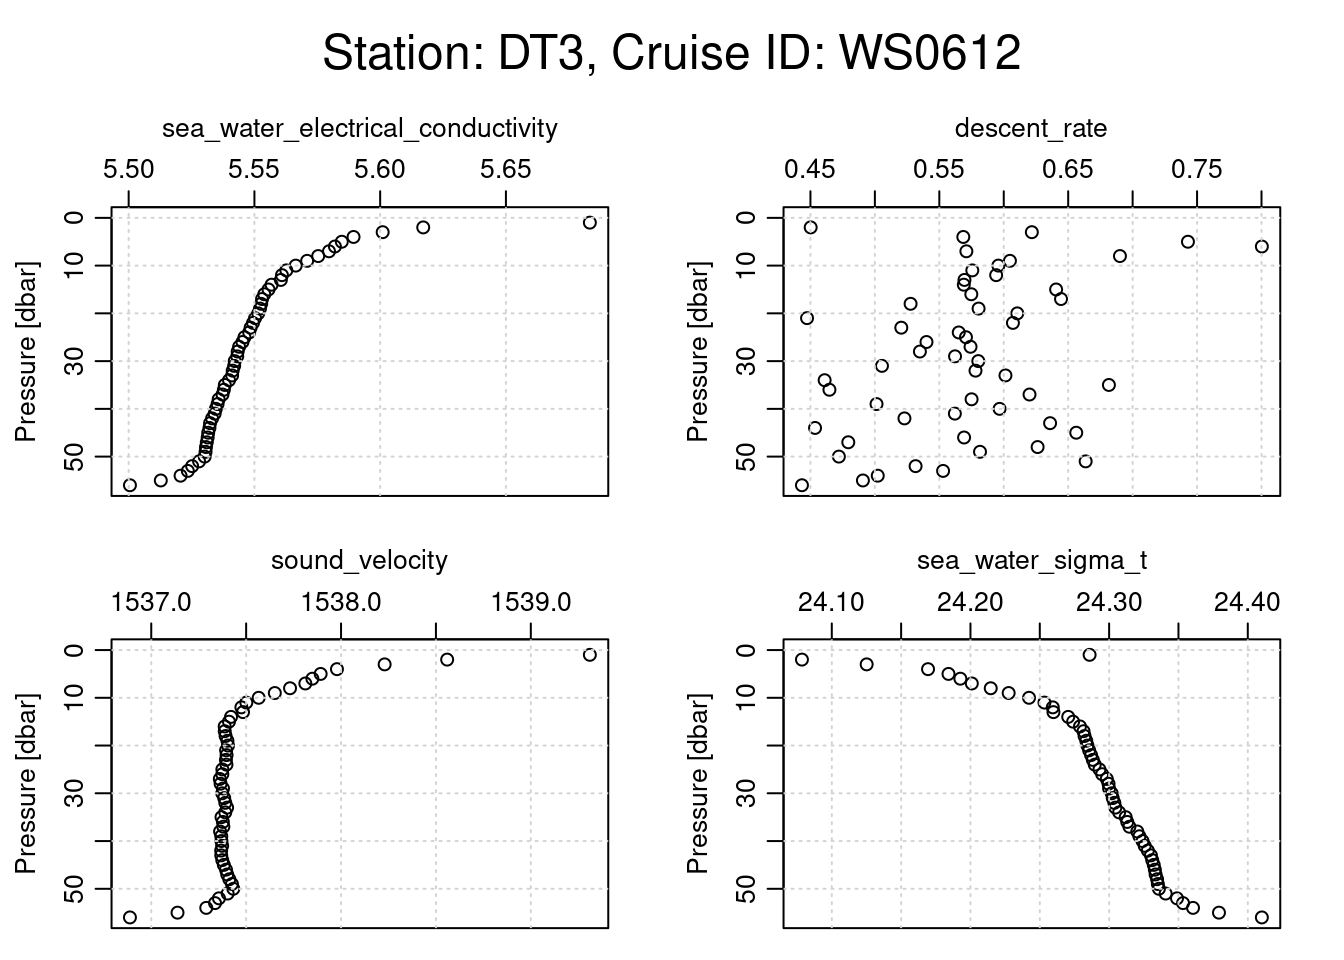
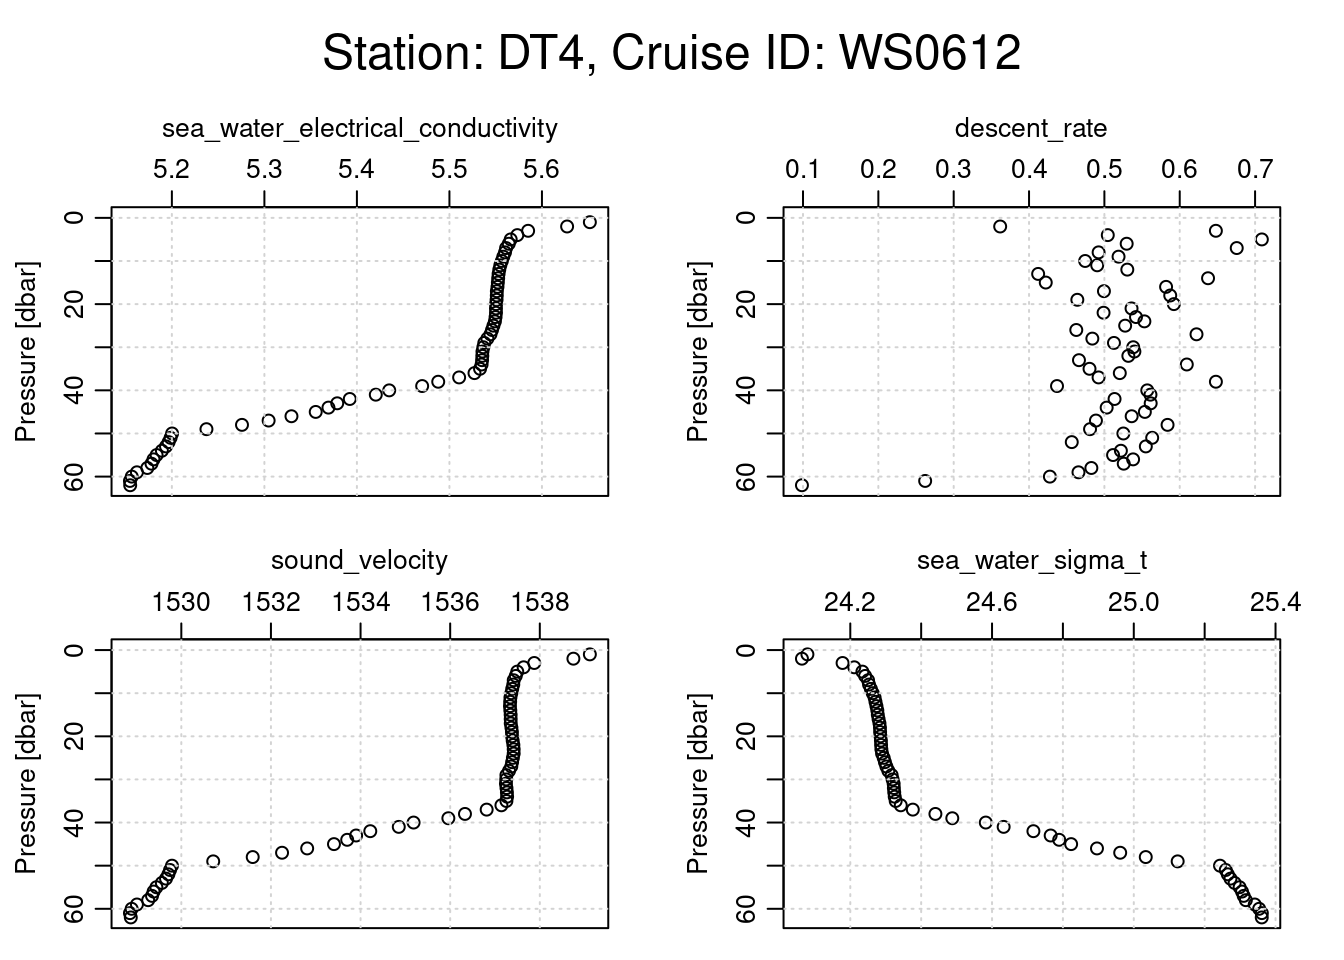
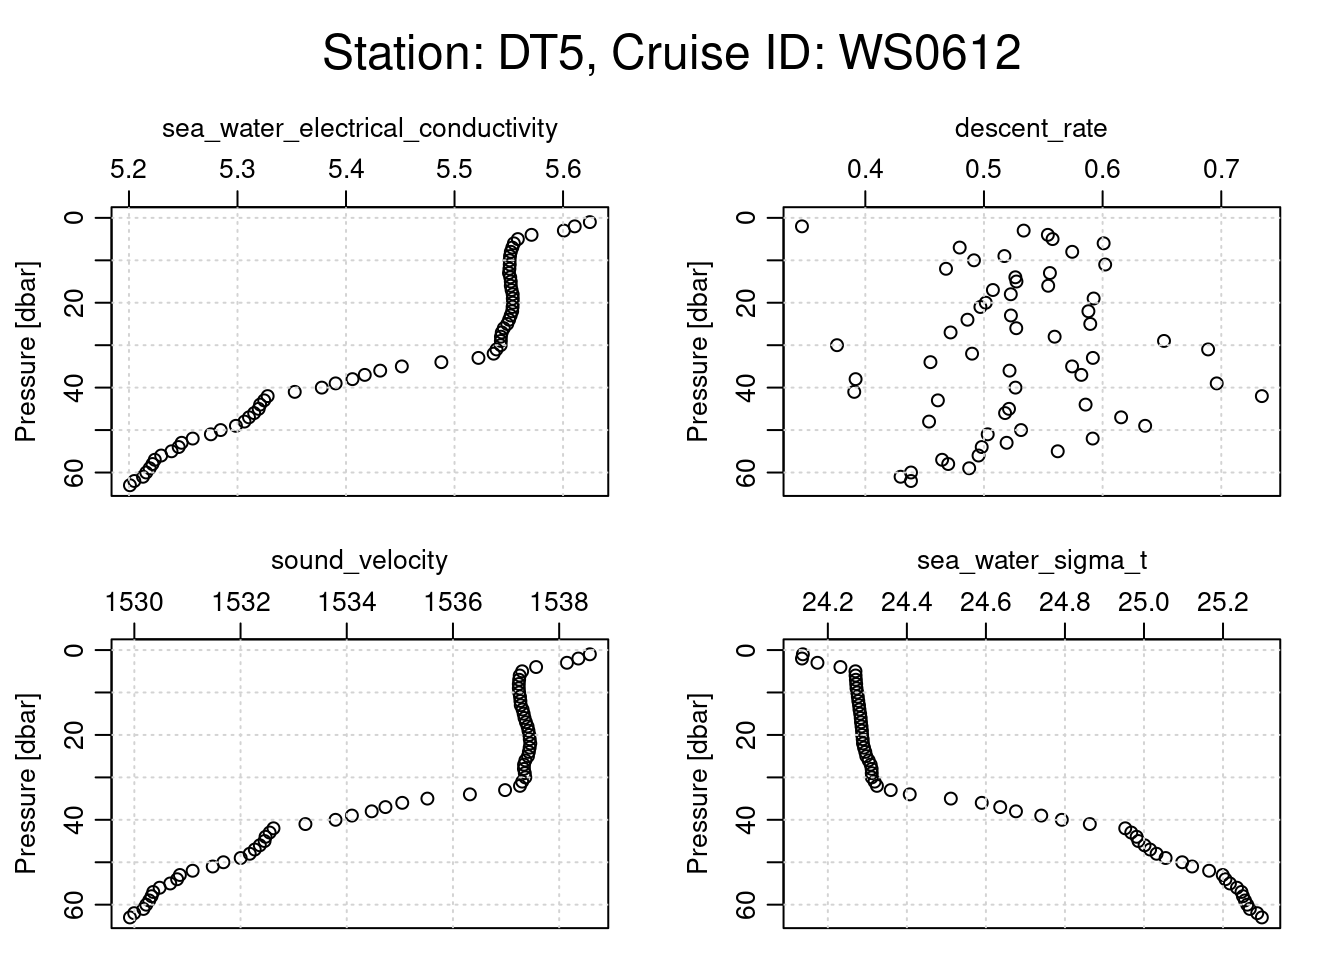
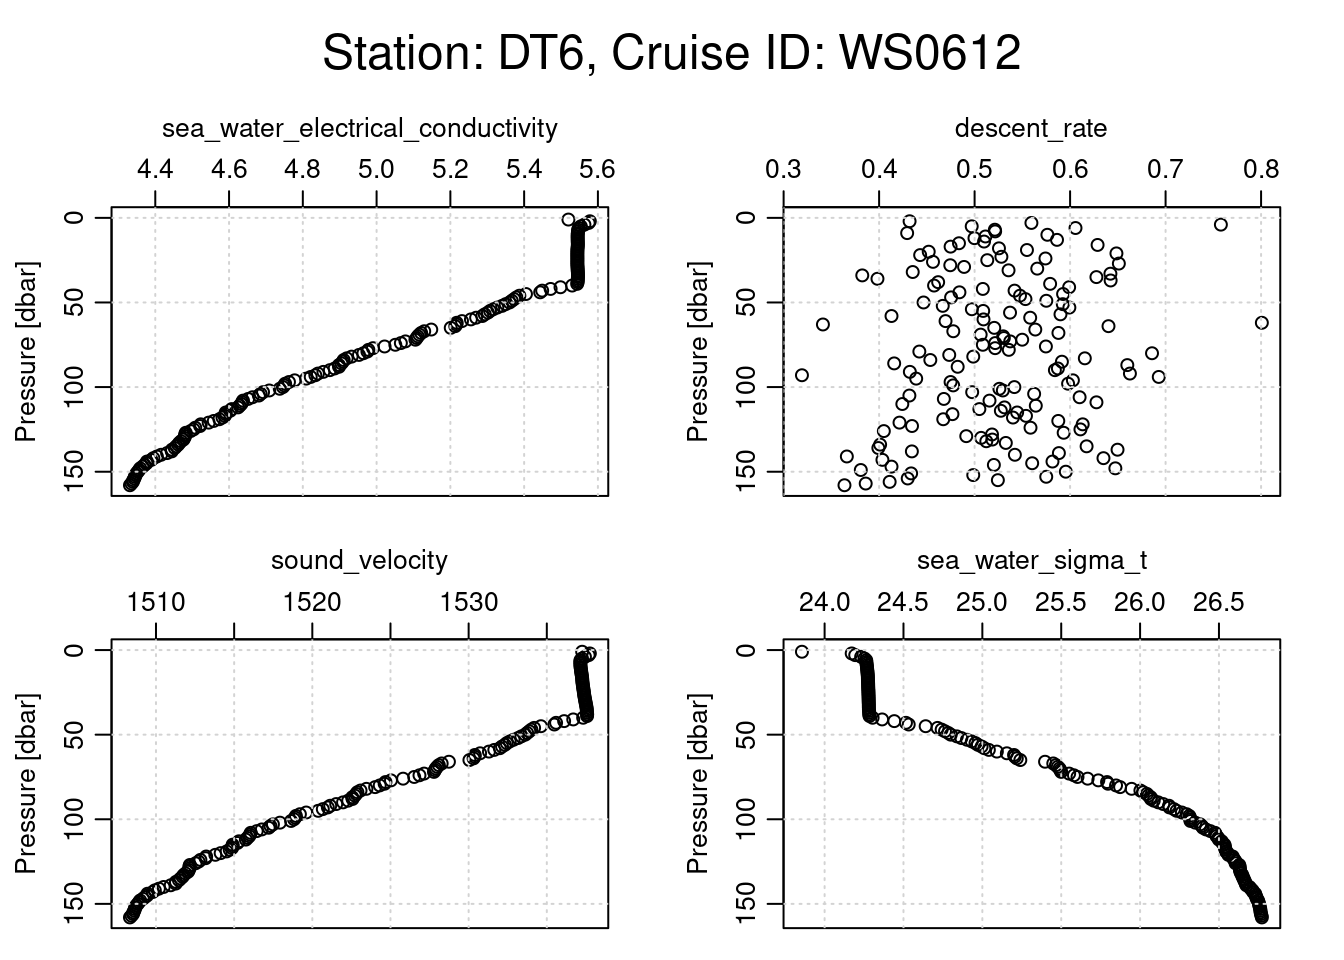
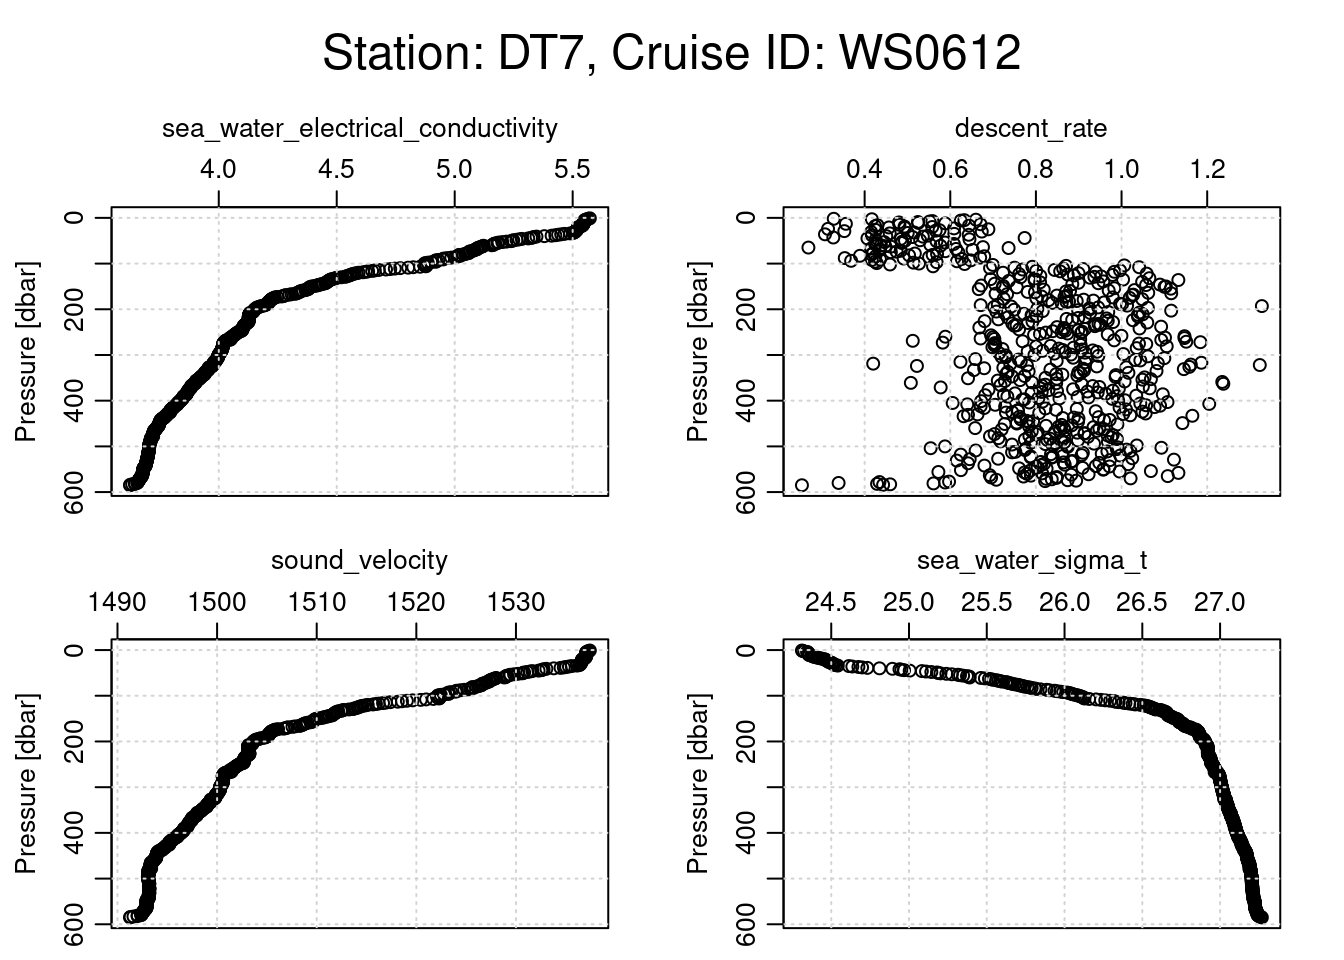
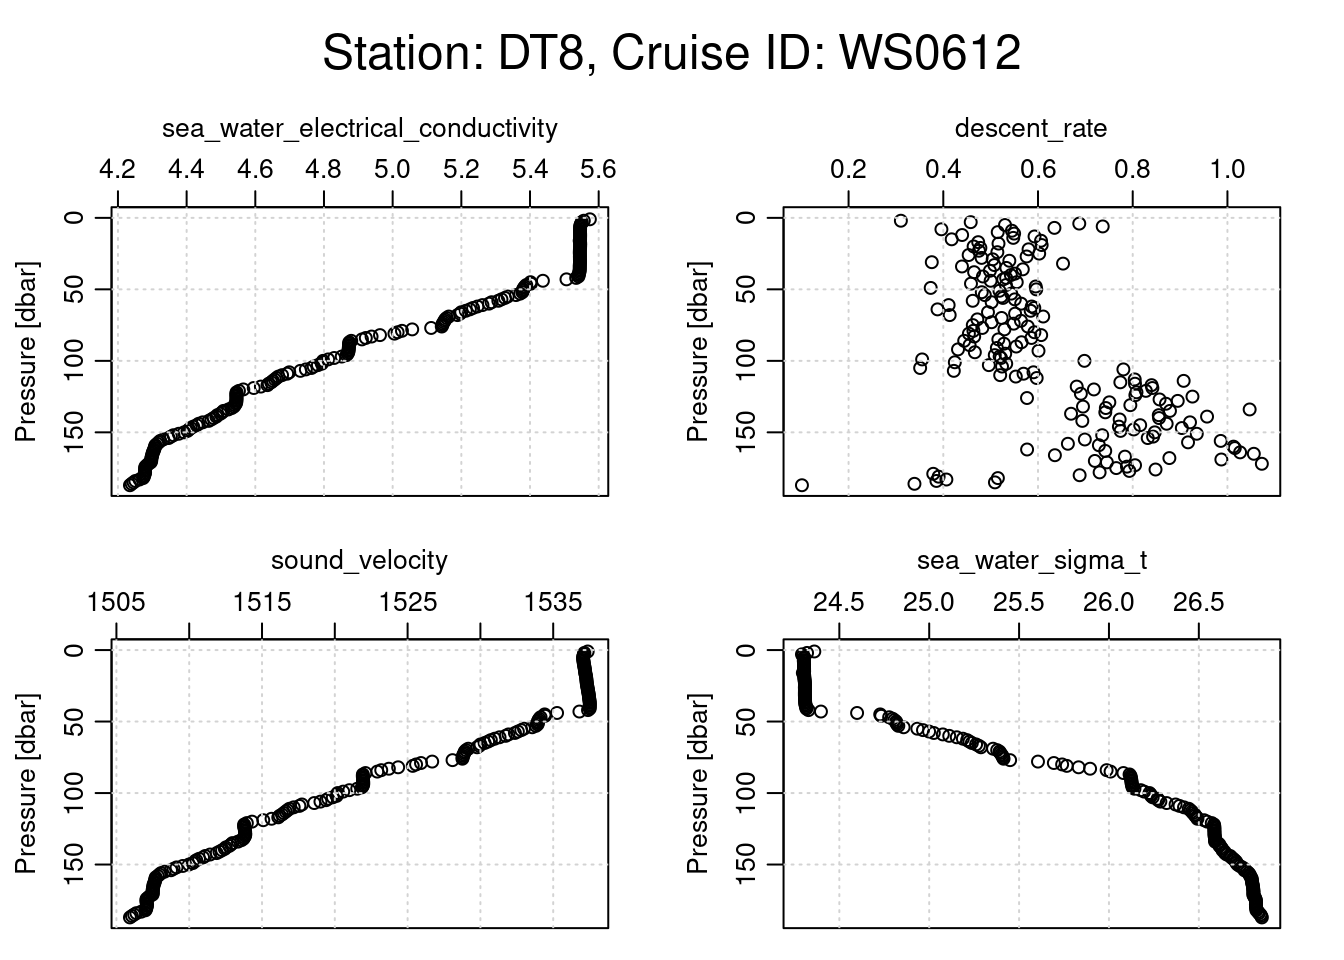
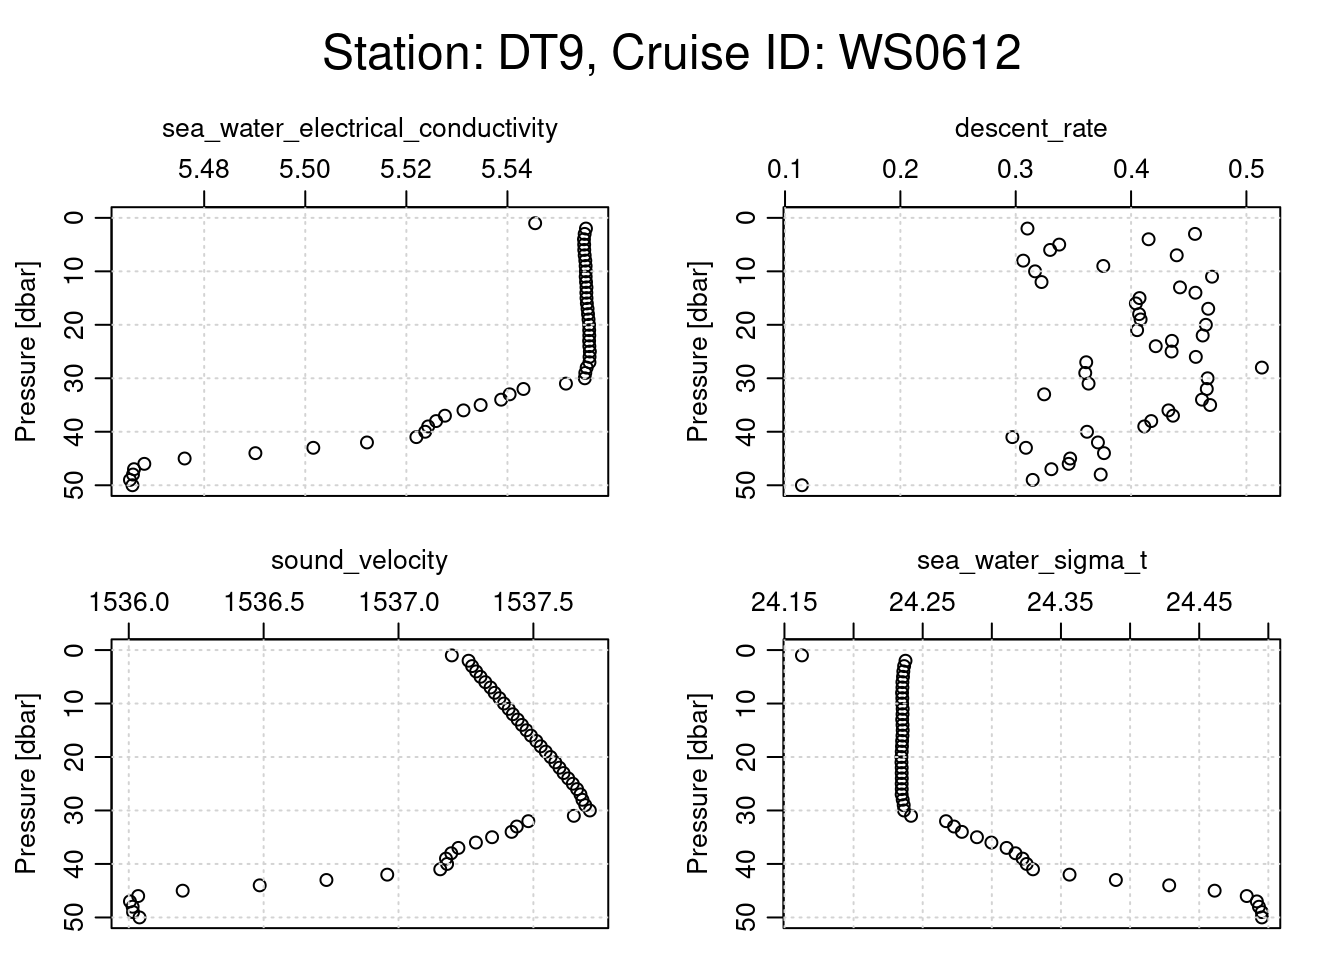
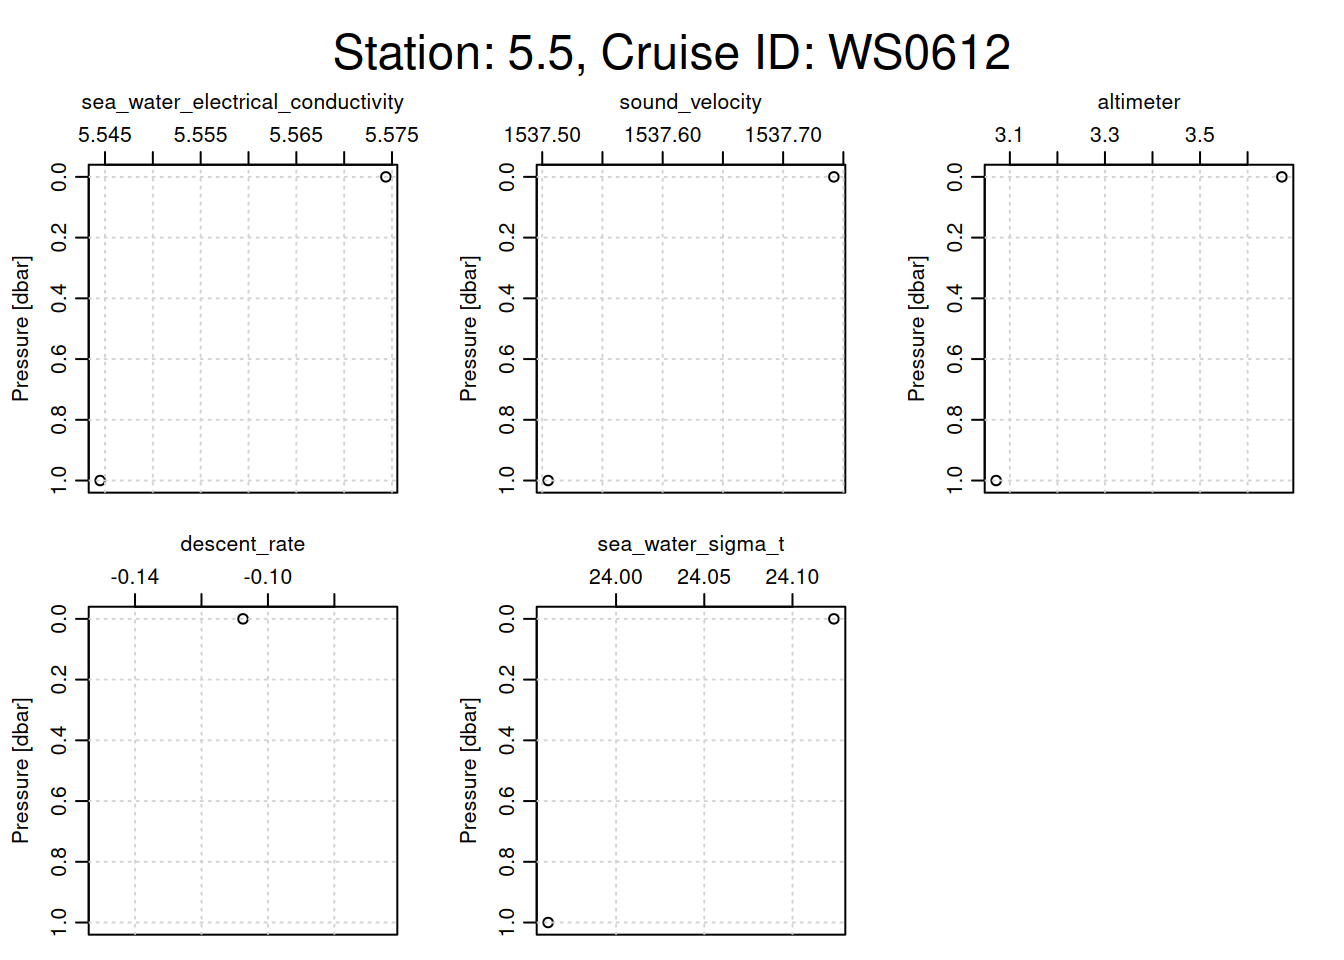
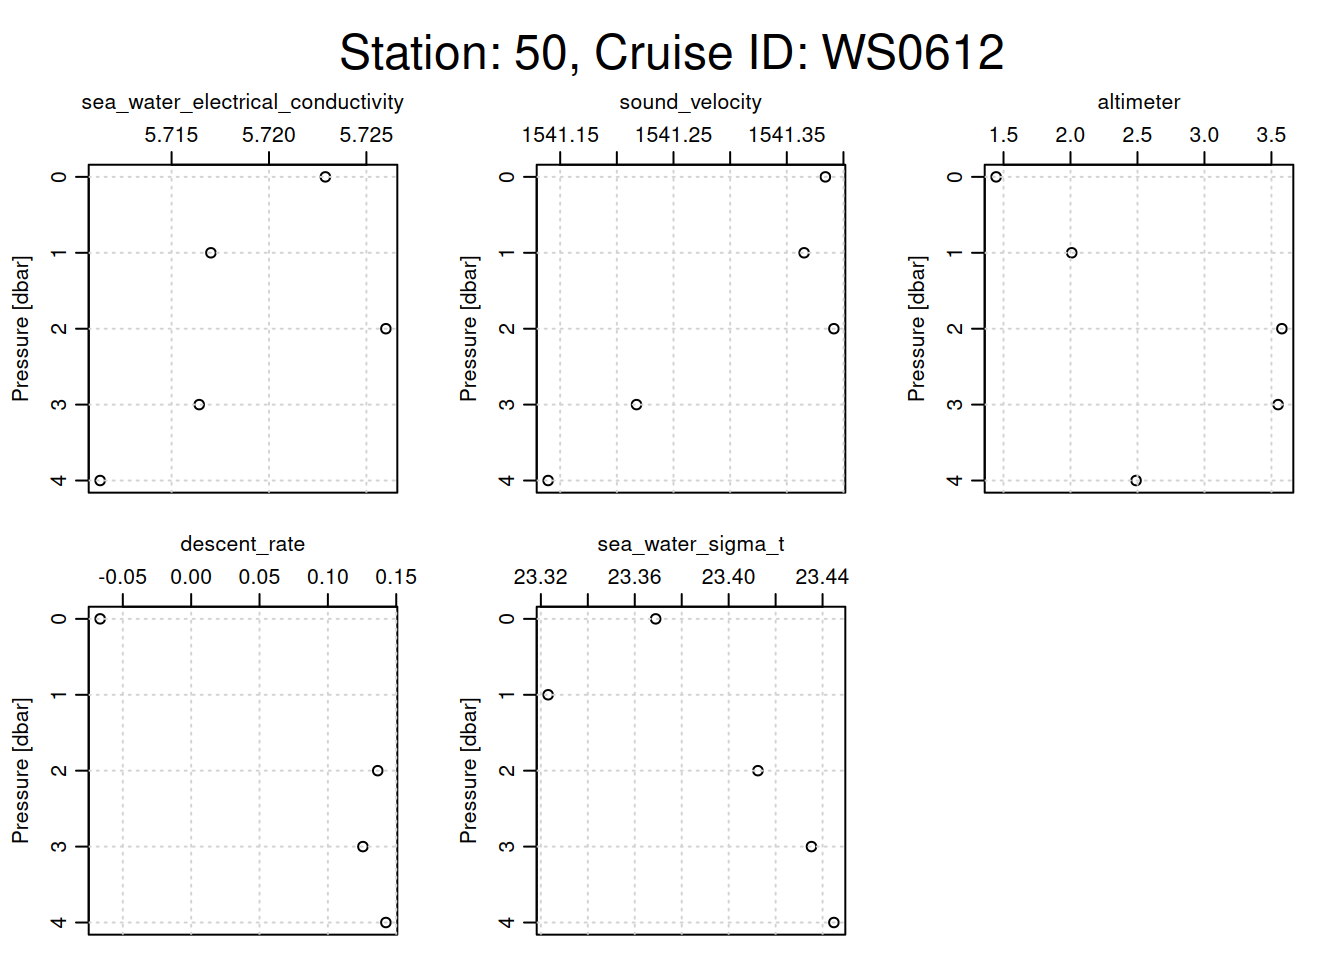
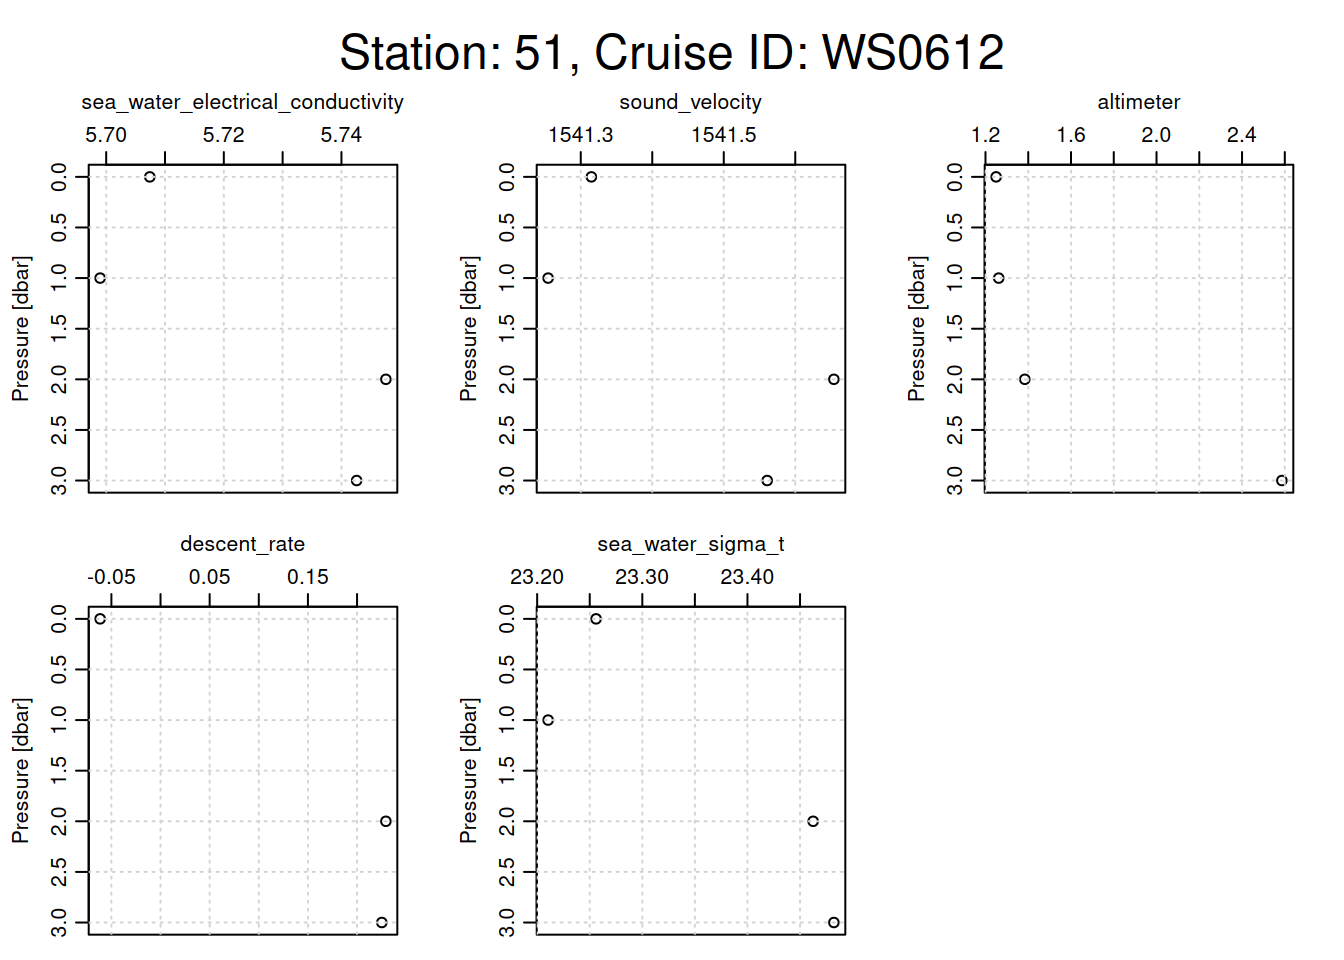
plotting other physical parameters for each cast
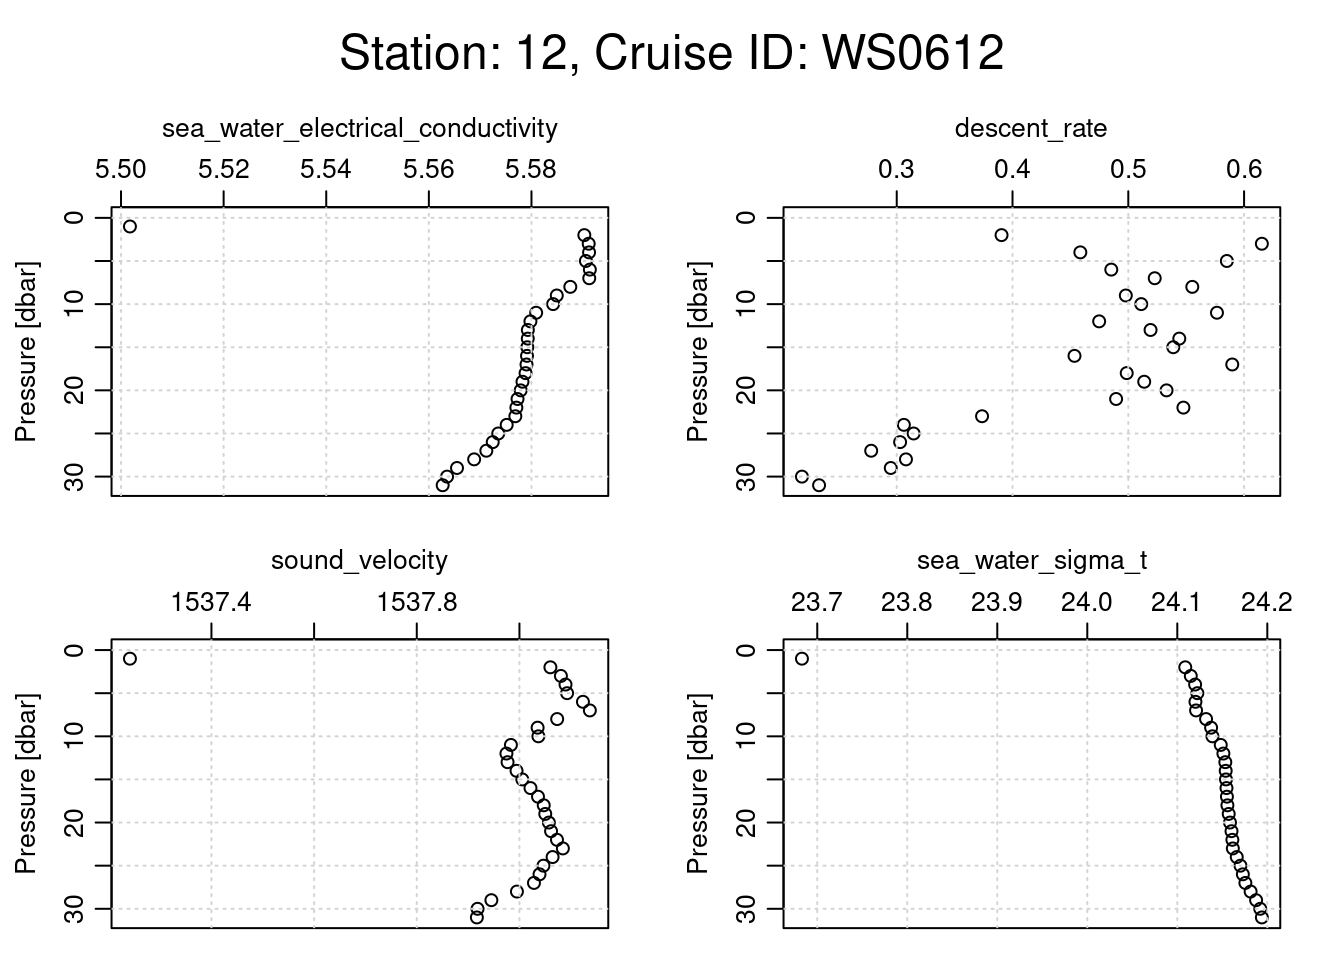
# Loop through each CTD castfor (i inseq(ctd_FK)){ cast <- ctd_FK[[i]] # Assuming each sublist contains only one relevant CTD objecttryCatch({# Extract metadata for station name and cruise ID station_name <- cast@metadata$station[1] cruise_id <- cast@data$cruise_id[1]# Generate a title with station name and cruise ID overall_title <- glue::glue("Station: {station_name}, Cruise ID: {cruise_id}")# Set margins: increase the outer margin for the titlepar(oma =c(0, 0, 3, 0)) # Top outer margin increased for title# Plotting function with specific parameters oce::plot(x =ctdDecimate(ctdTrim(cast)),which =c("sea_water_electrical_conductivity","descent_rate", "sound_velocity","sea_water_sigma_t","altimeter" ),main =""# No main title for individual subplots )# Place a single overall title at the top of the plot framemtext(overall_title, side =3, line =1, outer =TRUE, cex =1.5)# Reset outer margins to defaultpar(oma =c(0, 0, 0, 0)) }, error =function(e) {print(e$message) # Print any errors that occur during plotting })}
[1] "need finite 'xlim' values"
[1] "need finite 'xlim' values"
[1] "need finite 'xlim' values"
[1] "need finite 'xlim' values"
[1] "need finite 'xlim' values"
[1] "need finite 'xlim' values"
[1] "need finite 'xlim' values"
[1] "need finite 'xlim' values"
[1] "need finite 'xlim' values"
[1] "need finite 'xlim' values"
[1] "need finite 'xlim' values"
plotting other nutrient parameters for each cast
# Loop through each CTD castfor (i inseq(ctd_FK)){ cast <- ctd_FK[[i]] # Assuming each sublist contains only one relevant CTD objecttryCatch({# Extract metadata for station name and cruise ID station_name <- cast@metadata$station[1] cruise_id <- cast@data$cruise_id[1]# Generate a title with station name and cruise ID overall_title <- glue::glue("Station: {station_name}, Cruise ID: {cruise_id}")# Set margins: increase the outer margin for the titlepar(oma =c(0, 0, 3, 0)) # Top outer margin increased for title# Plotting function with specific parameters oce::plot(x =ctdDecimate(ctdTrim(cast)),which =c("CDOM", "dissolved_oxygen","oxygen_saturation","chlorophyll_concentration", "chlorophyll_fluorescence" ),main =""# No main title for individual subplots )# Place a single overall title at the top of the plot framemtext(overall_title, side =3, line =1, outer =TRUE, cex =1.5)# Reset outer margins to defaultpar(oma =c(0, 0, 0, 0)) }, error =function(e) {print(e$message) # Print any errors that occur during plotting })}
[1] "In plot,ctd-method() : which=\"CDOMdissolved_oxygenoxygen_saturationchlorophyll_concentrationchlorophyll_fluorescence\" cannot be handled"
[1] "In plot,ctd-method() : which=\"CDOMdissolved_oxygenoxygen_saturationchlorophyll_concentrationchlorophyll_fluorescence\" cannot be handled"
[1] "In plot,ctd-method() : which=\"CDOMdissolved_oxygenoxygen_saturationchlorophyll_concentrationchlorophyll_fluorescence\" cannot be handled"
[1] "In plot,ctd-method() : which=\"CDOMdissolved_oxygenoxygen_saturationchlorophyll_concentrationchlorophyll_fluorescence\" cannot be handled"
[1] "In plot,ctd-method() : which=\"CDOMdissolved_oxygenoxygen_saturationchlorophyll_concentrationchlorophyll_fluorescence\" cannot be handled"
[1] "In plot,ctd-method() : which=\"CDOMdissolved_oxygenoxygen_saturationchlorophyll_concentrationchlorophyll_fluorescence\" cannot be handled"
[1] "In plot,ctd-method() : which=\"CDOMdissolved_oxygenoxygen_saturationchlorophyll_concentrationchlorophyll_fluorescence\" cannot be handled"
[1] "In plot,ctd-method() : which=\"CDOMdissolved_oxygenoxygen_saturationchlorophyll_concentrationchlorophyll_fluorescence\" cannot be handled"
[1] "In plot,ctd-method() : which=\"CDOMdissolved_oxygenoxygen_saturationchlorophyll_concentrationchlorophyll_fluorescence\" cannot be handled"
[1] "In plot,ctd-method() : which=\"CDOMdissolved_oxygenoxygen_saturationchlorophyll_concentrationchlorophyll_fluorescence\" cannot be handled"
[1] "In plot,ctd-method() : which=\"CDOMdissolved_oxygenoxygen_saturationchlorophyll_concentrationchlorophyll_fluorescence\" cannot be handled"
[1] "In plot,ctd-method() : which=\"CDOMdissolved_oxygenoxygen_saturationchlorophyll_concentrationchlorophyll_fluorescence\" cannot be handled"
[1] "In plot,ctd-method() : which=\"CDOMdissolved_oxygenoxygen_saturationchlorophyll_concentrationchlorophyll_fluorescence\" cannot be handled"
[1] "In plot,ctd-method() : which=\"CDOMdissolved_oxygenoxygen_saturationchlorophyll_concentrationchlorophyll_fluorescence\" cannot be handled"
[1] "In plot,ctd-method() : which=\"CDOMdissolved_oxygenoxygen_saturationchlorophyll_concentrationchlorophyll_fluorescence\" cannot be handled"
[1] "In plot,ctd-method() : which=\"CDOMdissolved_oxygenoxygen_saturationchlorophyll_concentrationchlorophyll_fluorescence\" cannot be handled"
[1] "In plot,ctd-method() : which=\"CDOMdissolved_oxygenoxygen_saturationchlorophyll_concentrationchlorophyll_fluorescence\" cannot be handled"
[1] "In plot,ctd-method() : which=\"CDOMdissolved_oxygenoxygen_saturationchlorophyll_concentrationchlorophyll_fluorescence\" cannot be handled"
[1] "In plot,ctd-method() : which=\"CDOMdissolved_oxygenoxygen_saturationchlorophyll_concentrationchlorophyll_fluorescence\" cannot be handled"
[1] "In plot,ctd-method() : which=\"CDOMdissolved_oxygenoxygen_saturationchlorophyll_concentrationchlorophyll_fluorescence\" cannot be handled"
[1] "In plot,ctd-method() : which=\"CDOMdissolved_oxygenoxygen_saturationchlorophyll_concentrationchlorophyll_fluorescence\" cannot be handled"
[1] "In plot,ctd-method() : which=\"CDOMdissolved_oxygenoxygen_saturationchlorophyll_concentrationchlorophyll_fluorescence\" cannot be handled"
[1] "In plot,ctd-method() : which=\"CDOMdissolved_oxygenoxygen_saturationchlorophyll_concentrationchlorophyll_fluorescence\" cannot be handled"
[1] "In plot,ctd-method() : which=\"CDOMdissolved_oxygenoxygen_saturationchlorophyll_concentrationchlorophyll_fluorescence\" cannot be handled"
[1] "In plot,ctd-method() : which=\"CDOMdissolved_oxygenoxygen_saturationchlorophyll_concentrationchlorophyll_fluorescence\" cannot be handled"
[1] "In plot,ctd-method() : which=\"CDOMdissolved_oxygenoxygen_saturationchlorophyll_concentrationchlorophyll_fluorescence\" cannot be handled"
[1] "In plot,ctd-method() : which=\"CDOMdissolved_oxygenoxygen_saturationchlorophyll_concentrationchlorophyll_fluorescence\" cannot be handled"
[1] "In plot,ctd-method() : which=\"CDOMdissolved_oxygenoxygen_saturationchlorophyll_concentrationchlorophyll_fluorescence\" cannot be handled"
[1] "In plot,ctd-method() : which=\"CDOMdissolved_oxygenoxygen_saturationchlorophyll_concentrationchlorophyll_fluorescence\" cannot be handled"
[1] "In plot,ctd-method() : which=\"CDOMdissolved_oxygenoxygen_saturationchlorophyll_concentrationchlorophyll_fluorescence\" cannot be handled"
[1] "In plot,ctd-method() : which=\"CDOMdissolved_oxygenoxygen_saturationchlorophyll_concentrationchlorophyll_fluorescence\" cannot be handled"
[1] "In plot,ctd-method() : which=\"CDOMdissolved_oxygenoxygen_saturationchlorophyll_concentrationchlorophyll_fluorescence\" cannot be handled"
[1] "In plot,ctd-method() : which=\"CDOMdissolved_oxygenoxygen_saturationchlorophyll_concentrationchlorophyll_fluorescence\" cannot be handled"
[1] "In plot,ctd-method() : which=\"CDOMdissolved_oxygenoxygen_saturationchlorophyll_concentrationchlorophyll_fluorescence\" cannot be handled"
[1] "In plot,ctd-method() : which=\"CDOMdissolved_oxygenoxygen_saturationchlorophyll_concentrationchlorophyll_fluorescence\" cannot be handled"
[1] "In plot,ctd-method() : which=\"CDOMdissolved_oxygenoxygen_saturationchlorophyll_concentrationchlorophyll_fluorescence\" cannot be handled"
[1] "In plot,ctd-method() : which=\"CDOMdissolved_oxygenoxygen_saturationchlorophyll_concentrationchlorophyll_fluorescence\" cannot be handled"
[1] "In plot,ctd-method() : which=\"CDOMdissolved_oxygenoxygen_saturationchlorophyll_concentrationchlorophyll_fluorescence\" cannot be handled"
[1] "In plot,ctd-method() : which=\"CDOMdissolved_oxygenoxygen_saturationchlorophyll_concentrationchlorophyll_fluorescence\" cannot be handled"
[1] "In plot,ctd-method() : which=\"CDOMdissolved_oxygenoxygen_saturationchlorophyll_concentrationchlorophyll_fluorescence\" cannot be handled"
[1] "In plot,ctd-method() : which=\"CDOMdissolved_oxygenoxygen_saturationchlorophyll_concentrationchlorophyll_fluorescence\" cannot be handled"
[1] "In plot,ctd-method() : which=\"CDOMdissolved_oxygenoxygen_saturationchlorophyll_concentrationchlorophyll_fluorescence\" cannot be handled"
[1] "In plot,ctd-method() : which=\"CDOMdissolved_oxygenoxygen_saturationchlorophyll_concentrationchlorophyll_fluorescence\" cannot be handled"
[1] "In plot,ctd-method() : which=\"CDOMdissolved_oxygenoxygen_saturationchlorophyll_concentrationchlorophyll_fluorescence\" cannot be handled"
[1] "In plot,ctd-method() : which=\"CDOMdissolved_oxygenoxygen_saturationchlorophyll_concentrationchlorophyll_fluorescence\" cannot be handled"
[1] "In plot,ctd-method() : which=\"CDOMdissolved_oxygenoxygen_saturationchlorophyll_concentrationchlorophyll_fluorescence\" cannot be handled"
[1] "In plot,ctd-method() : which=\"CDOMdissolved_oxygenoxygen_saturationchlorophyll_concentrationchlorophyll_fluorescence\" cannot be handled"
[1] "In plot,ctd-method() : which=\"CDOMdissolved_oxygenoxygen_saturationchlorophyll_concentrationchlorophyll_fluorescence\" cannot be handled"
[1] "In plot,ctd-method() : which=\"CDOMdissolved_oxygenoxygen_saturationchlorophyll_concentrationchlorophyll_fluorescence\" cannot be handled"
[1] "In plot,ctd-method() : which=\"CDOMdissolved_oxygenoxygen_saturationchlorophyll_concentrationchlorophyll_fluorescence\" cannot be handled"
[1] "In plot,ctd-method() : which=\"CDOMdissolved_oxygenoxygen_saturationchlorophyll_concentrationchlorophyll_fluorescence\" cannot be handled"
[1] "In plot,ctd-method() : which=\"CDOMdissolved_oxygenoxygen_saturationchlorophyll_concentrationchlorophyll_fluorescence\" cannot be handled"
[1] "In plot,ctd-method() : which=\"CDOMdissolved_oxygenoxygen_saturationchlorophyll_concentrationchlorophyll_fluorescence\" cannot be handled"
[1] "In plot,ctd-method() : which=\"CDOMdissolved_oxygenoxygen_saturationchlorophyll_concentrationchlorophyll_fluorescence\" cannot be handled"
[1] "In plot,ctd-method() : which=\"CDOMdissolved_oxygenoxygen_saturationchlorophyll_concentrationchlorophyll_fluorescence\" cannot be handled"
[1] "In plot,ctd-method() : which=\"CDOMdissolved_oxygenoxygen_saturationchlorophyll_concentrationchlorophyll_fluorescence\" cannot be handled"
[1] "In plot,ctd-method() : which=\"CDOMdissolved_oxygenoxygen_saturationchlorophyll_concentrationchlorophyll_fluorescence\" cannot be handled"
[1] "In plot,ctd-method() : which=\"CDOMdissolved_oxygenoxygen_saturationchlorophyll_concentrationchlorophyll_fluorescence\" cannot be handled"
[1] "In plot,ctd-method() : which=\"CDOMdissolved_oxygenoxygen_saturationchlorophyll_concentrationchlorophyll_fluorescence\" cannot be handled"
[1] "In plot,ctd-method() : which=\"CDOMdissolved_oxygenoxygen_saturationchlorophyll_concentrationchlorophyll_fluorescence\" cannot be handled"
[1] "In plot,ctd-method() : which=\"CDOMdissolved_oxygenoxygen_saturationchlorophyll_concentrationchlorophyll_fluorescence\" cannot be handled"
[1] "In plot,ctd-method() : which=\"CDOMdissolved_oxygenoxygen_saturationchlorophyll_concentrationchlorophyll_fluorescence\" cannot be handled"
[1] "In plot,ctd-method() : which=\"CDOMdissolved_oxygenoxygen_saturationchlorophyll_concentrationchlorophyll_fluorescence\" cannot be handled"
[1] "In plot,ctd-method() : which=\"CDOMdissolved_oxygenoxygen_saturationchlorophyll_concentrationchlorophyll_fluorescence\" cannot be handled"
[1] "In plot,ctd-method() : which=\"CDOMdissolved_oxygenoxygen_saturationchlorophyll_concentrationchlorophyll_fluorescence\" cannot be handled"
[1] "In plot,ctd-method() : which=\"CDOMdissolved_oxygenoxygen_saturationchlorophyll_concentrationchlorophyll_fluorescence\" cannot be handled"
[1] "In plot,ctd-method() : which=\"CDOMdissolved_oxygenoxygen_saturationchlorophyll_concentrationchlorophyll_fluorescence\" cannot be handled"
[1] "In plot,ctd-method() : which=\"CDOMdissolved_oxygenoxygen_saturationchlorophyll_concentrationchlorophyll_fluorescence\" cannot be handled"
[1] "In plot,ctd-method() : which=\"CDOMdissolved_oxygenoxygen_saturationchlorophyll_concentrationchlorophyll_fluorescence\" cannot be handled"
[1] "In plot,ctd-method() : which=\"CDOMdissolved_oxygenoxygen_saturationchlorophyll_concentrationchlorophyll_fluorescence\" cannot be handled"
[1] "In plot,ctd-method() : which=\"CDOMdissolved_oxygenoxygen_saturationchlorophyll_concentrationchlorophyll_fluorescence\" cannot be handled"
[1] "In plot,ctd-method() : which=\"CDOMdissolved_oxygenoxygen_saturationchlorophyll_concentrationchlorophyll_fluorescence\" cannot be handled"
[1] "In plot,ctd-method() : which=\"CDOMdissolved_oxygenoxygen_saturationchlorophyll_concentrationchlorophyll_fluorescence\" cannot be handled"
[1] "In plot,ctd-method() : which=\"CDOMdissolved_oxygenoxygen_saturationchlorophyll_concentrationchlorophyll_fluorescence\" cannot be handled"
[1] "In plot,ctd-method() : which=\"CDOMdissolved_oxygenoxygen_saturationchlorophyll_concentrationchlorophyll_fluorescence\" cannot be handled"
[1] "In plot,ctd-method() : which=\"CDOMdissolved_oxygenoxygen_saturationchlorophyll_concentrationchlorophyll_fluorescence\" cannot be handled"
[1] "In plot,ctd-method() : which=\"CDOMdissolved_oxygenoxygen_saturationchlorophyll_concentrationchlorophyll_fluorescence\" cannot be handled"
[1] "In plot,ctd-method() : which=\"CDOMdissolved_oxygenoxygen_saturationchlorophyll_concentrationchlorophyll_fluorescence\" cannot be handled"
[1] "In plot,ctd-method() : which=\"CDOMdissolved_oxygenoxygen_saturationchlorophyll_concentrationchlorophyll_fluorescence\" cannot be handled"
[1] "In plot,ctd-method() : which=\"CDOMdissolved_oxygenoxygen_saturationchlorophyll_concentrationchlorophyll_fluorescence\" cannot be handled"
[1] "In plot,ctd-method() : which=\"CDOMdissolved_oxygenoxygen_saturationchlorophyll_concentrationchlorophyll_fluorescence\" cannot be handled"
[1] "In plot,ctd-method() : which=\"CDOMdissolved_oxygenoxygen_saturationchlorophyll_concentrationchlorophyll_fluorescence\" cannot be handled"
[1] "In plot,ctd-method() : which=\"CDOMdissolved_oxygenoxygen_saturationchlorophyll_concentrationchlorophyll_fluorescence\" cannot be handled"
[1] "In plot,ctd-method() : which=\"CDOMdissolved_oxygenoxygen_saturationchlorophyll_concentrationchlorophyll_fluorescence\" cannot be handled"
[1] "In plot,ctd-method() : which=\"CDOMdissolved_oxygenoxygen_saturationchlorophyll_concentrationchlorophyll_fluorescence\" cannot be handled"
[1] "In plot,ctd-method() : which=\"CDOMdissolved_oxygenoxygen_saturationchlorophyll_concentrationchlorophyll_fluorescence\" cannot be handled"
[1] "In plot,ctd-method() : which=\"CDOMdissolved_oxygenoxygen_saturationchlorophyll_concentrationchlorophyll_fluorescence\" cannot be handled"
[1] "In plot,ctd-method() : which=\"CDOMdissolved_oxygenoxygen_saturationchlorophyll_concentrationchlorophyll_fluorescence\" cannot be handled"
[1] "In plot,ctd-method() : which=\"CDOMdissolved_oxygenoxygen_saturationchlorophyll_concentrationchlorophyll_fluorescence\" cannot be handled"
[1] "In plot,ctd-method() : which=\"CDOMdissolved_oxygenoxygen_saturationchlorophyll_concentrationchlorophyll_fluorescence\" cannot be handled"
[1] "In plot,ctd-method() : which=\"CDOMdissolved_oxygenoxygen_saturationchlorophyll_concentrationchlorophyll_fluorescence\" cannot be handled"
[1] "In plot,ctd-method() : which=\"CDOMdissolved_oxygenoxygen_saturationchlorophyll_concentrationchlorophyll_fluorescence\" cannot be handled"
[1] "In plot,ctd-method() : which=\"CDOMdissolved_oxygenoxygen_saturationchlorophyll_concentrationchlorophyll_fluorescence\" cannot be handled"
[1] "In plot,ctd-method() : which=\"CDOMdissolved_oxygenoxygen_saturationchlorophyll_concentrationchlorophyll_fluorescence\" cannot be handled"
[1] "In plot,ctd-method() : which=\"CDOMdissolved_oxygenoxygen_saturationchlorophyll_concentrationchlorophyll_fluorescence\" cannot be handled"
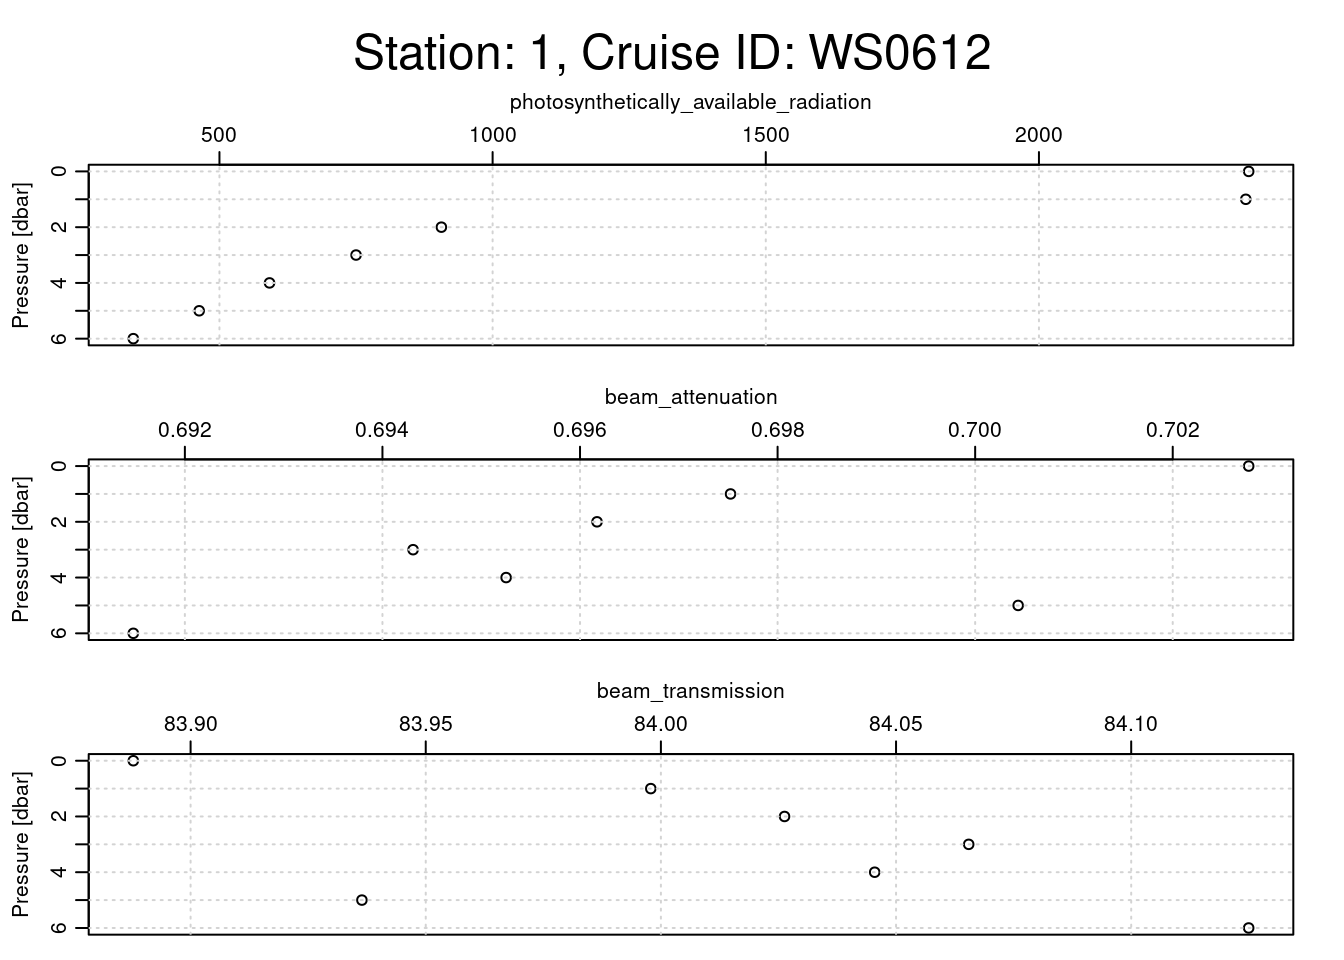
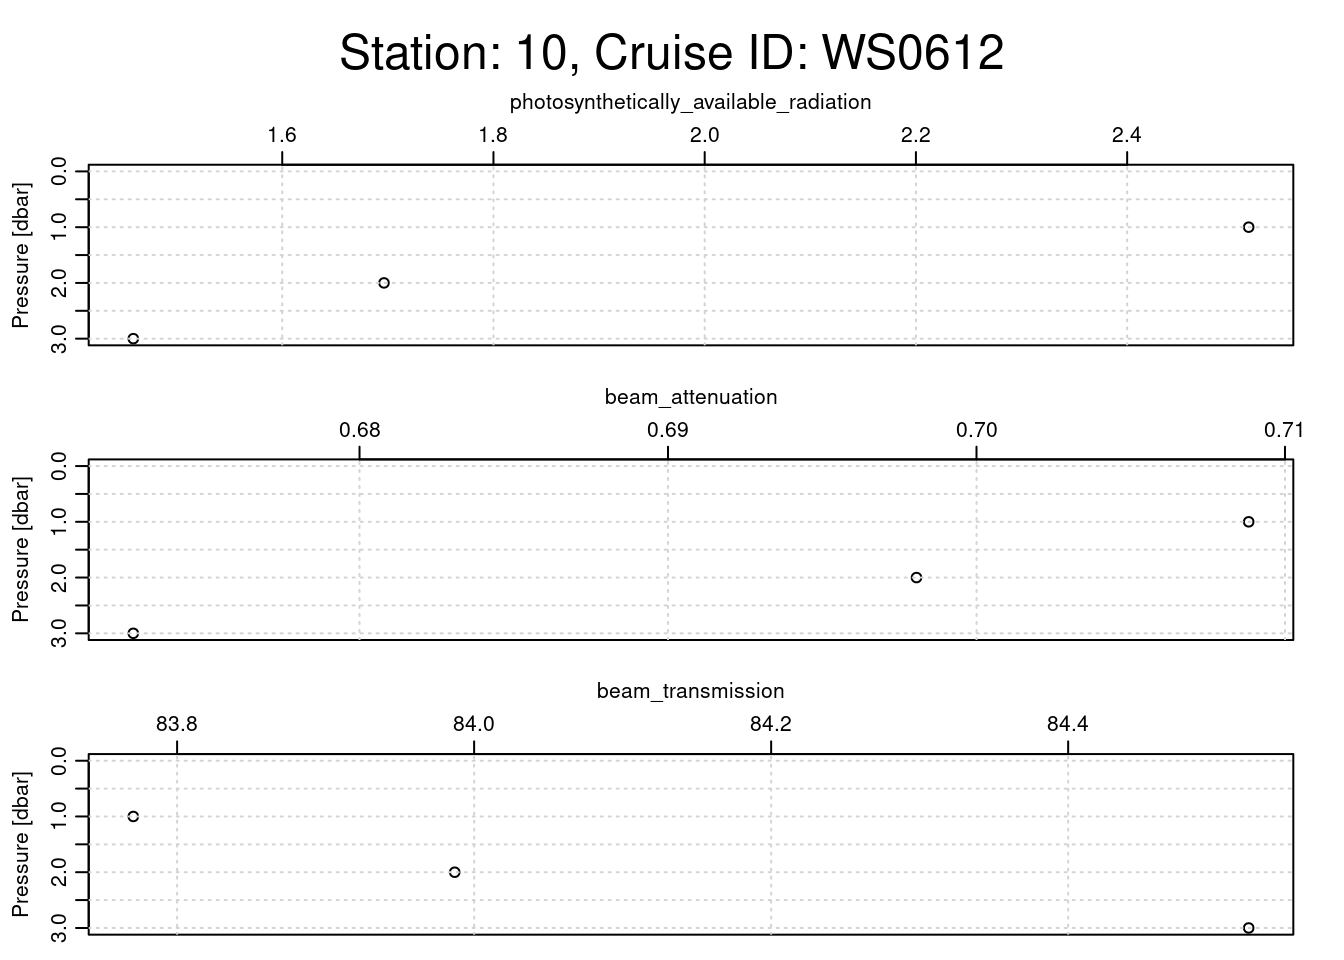
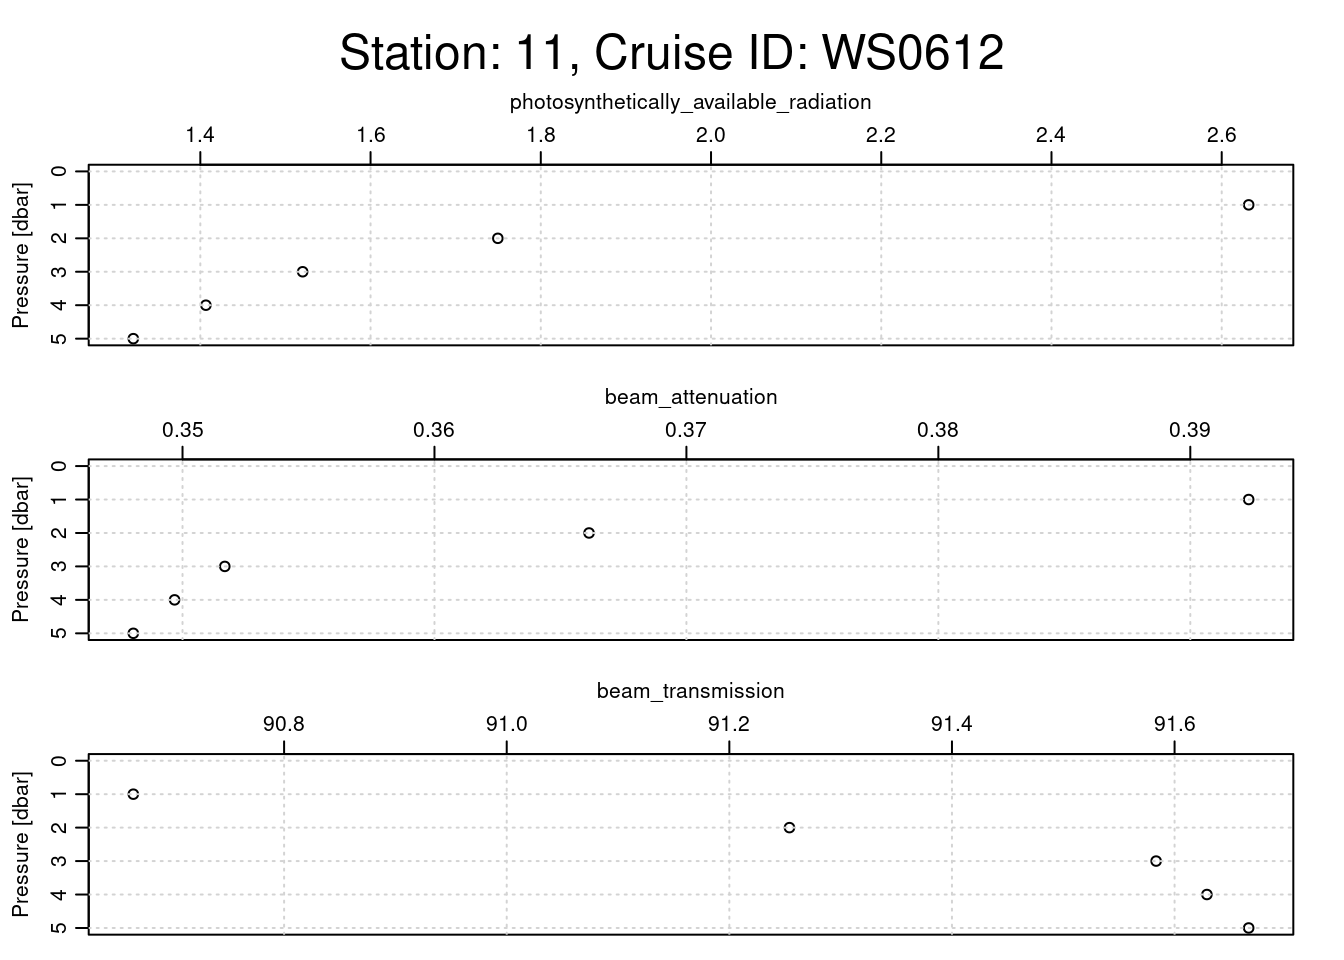
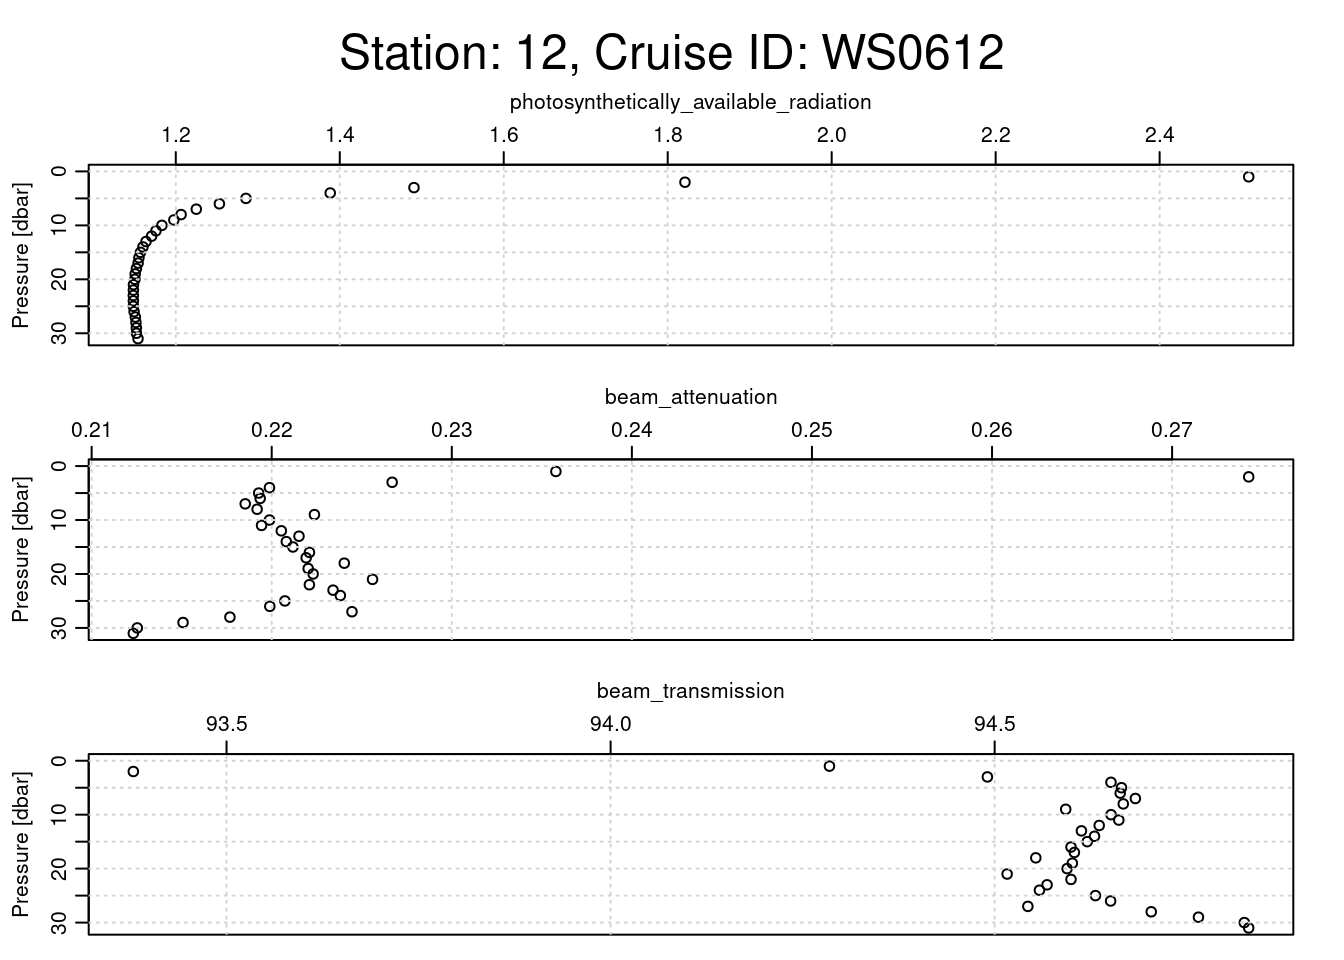
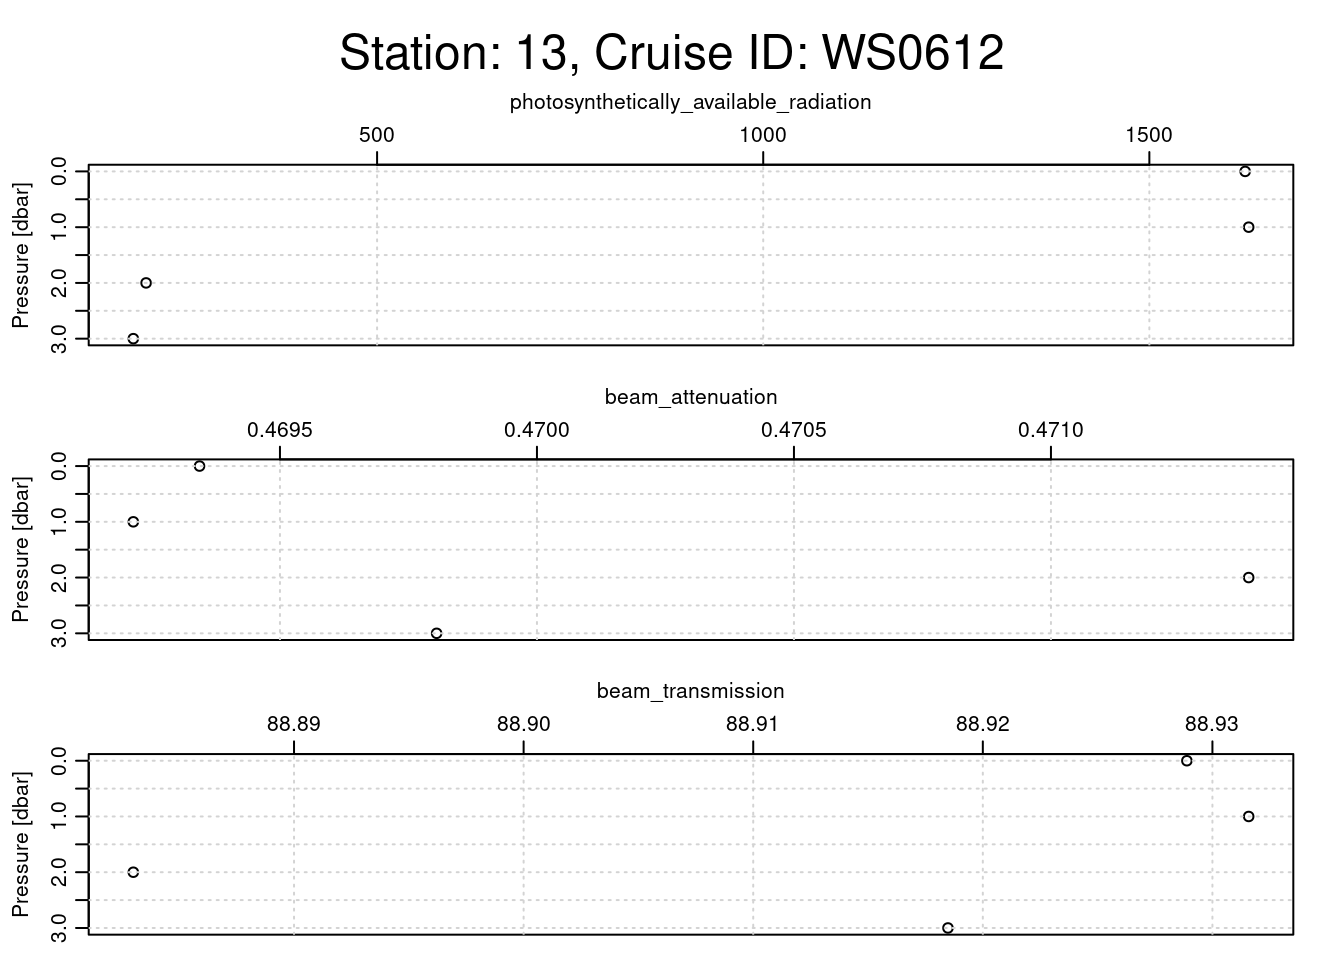
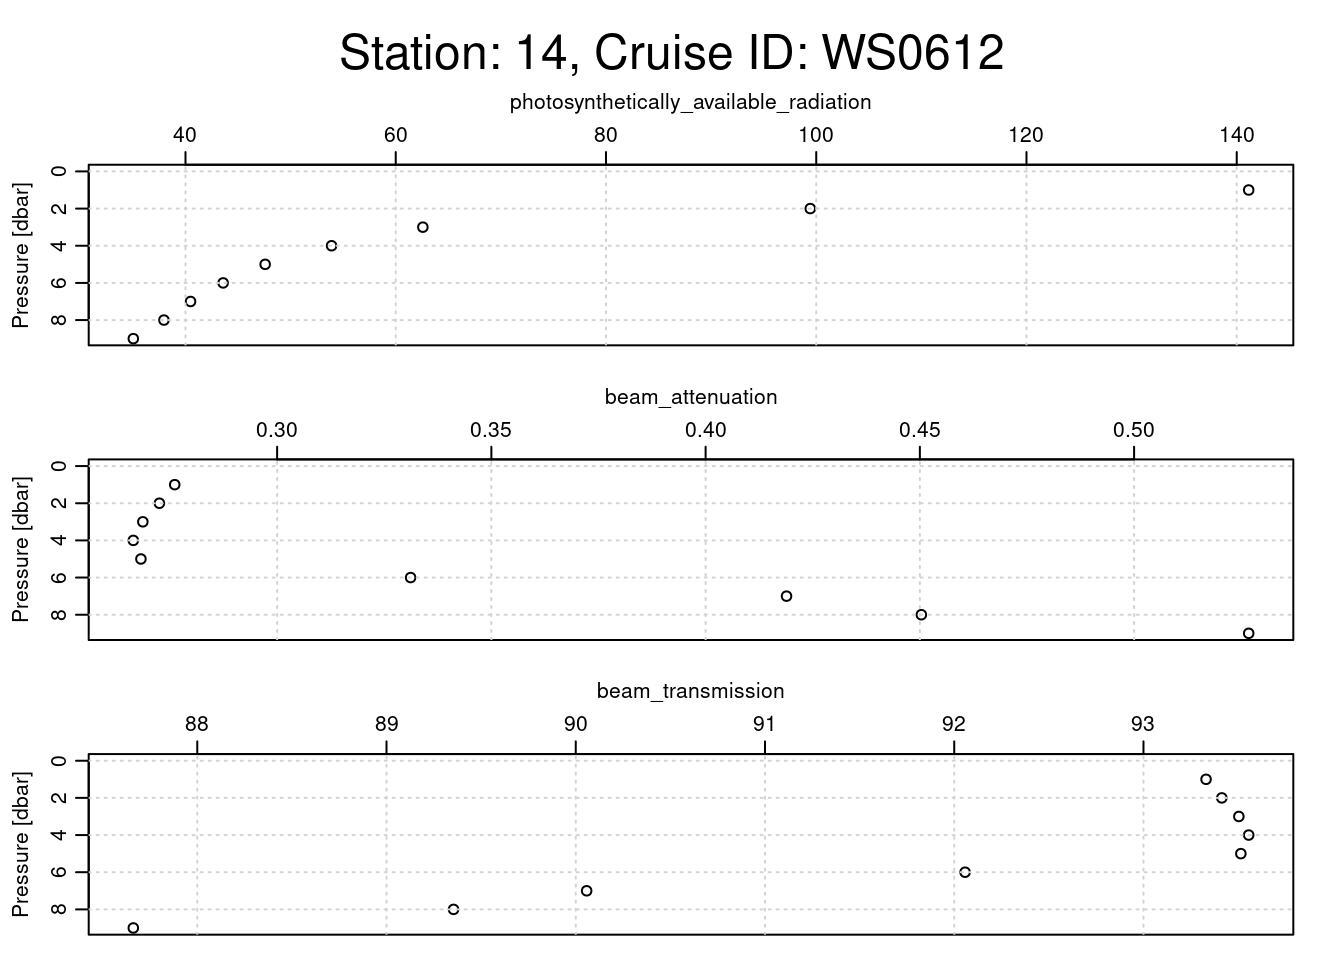
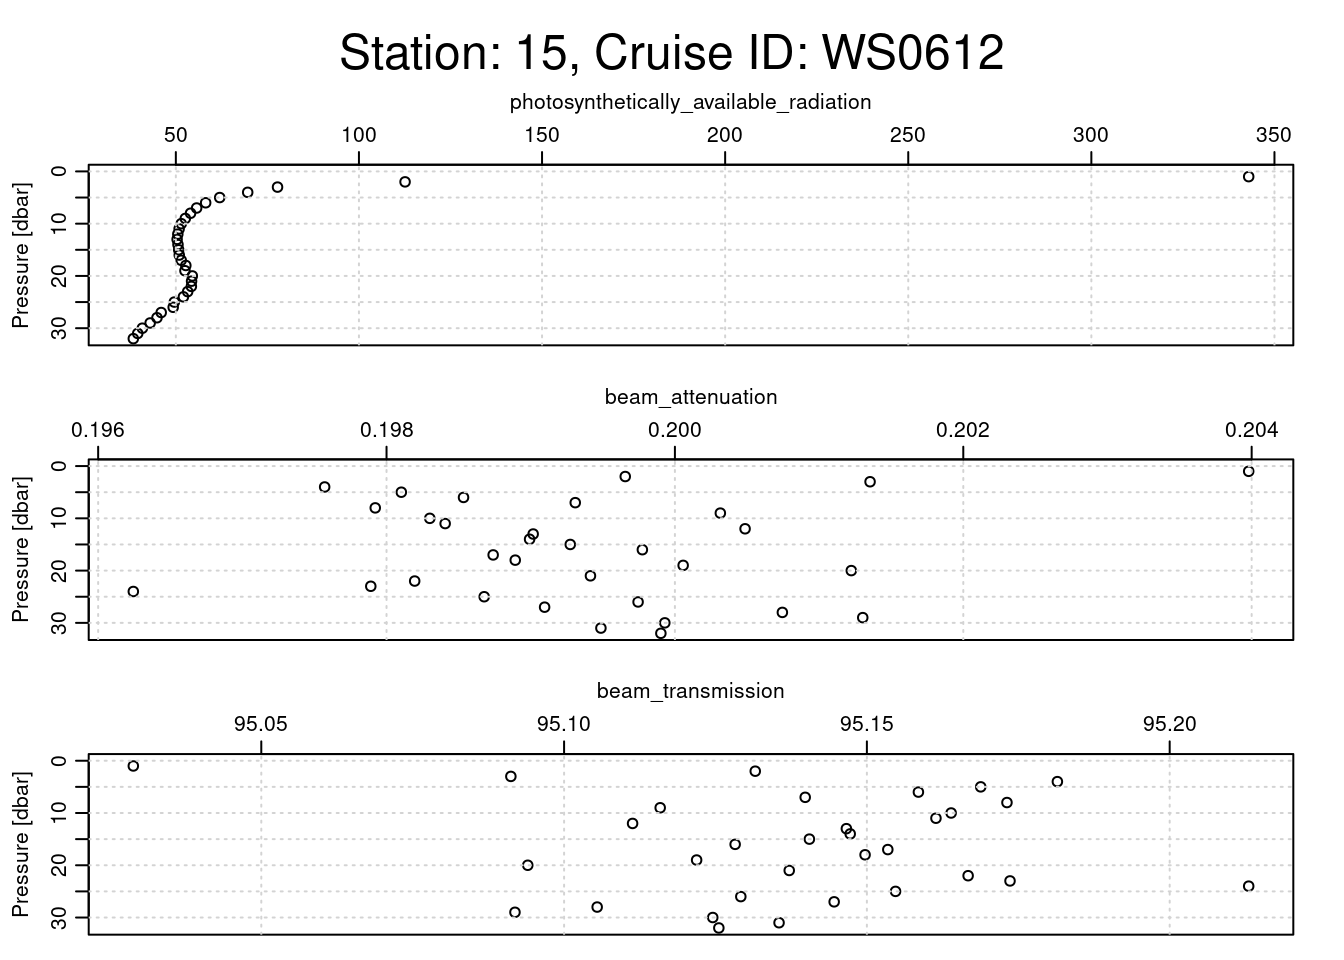
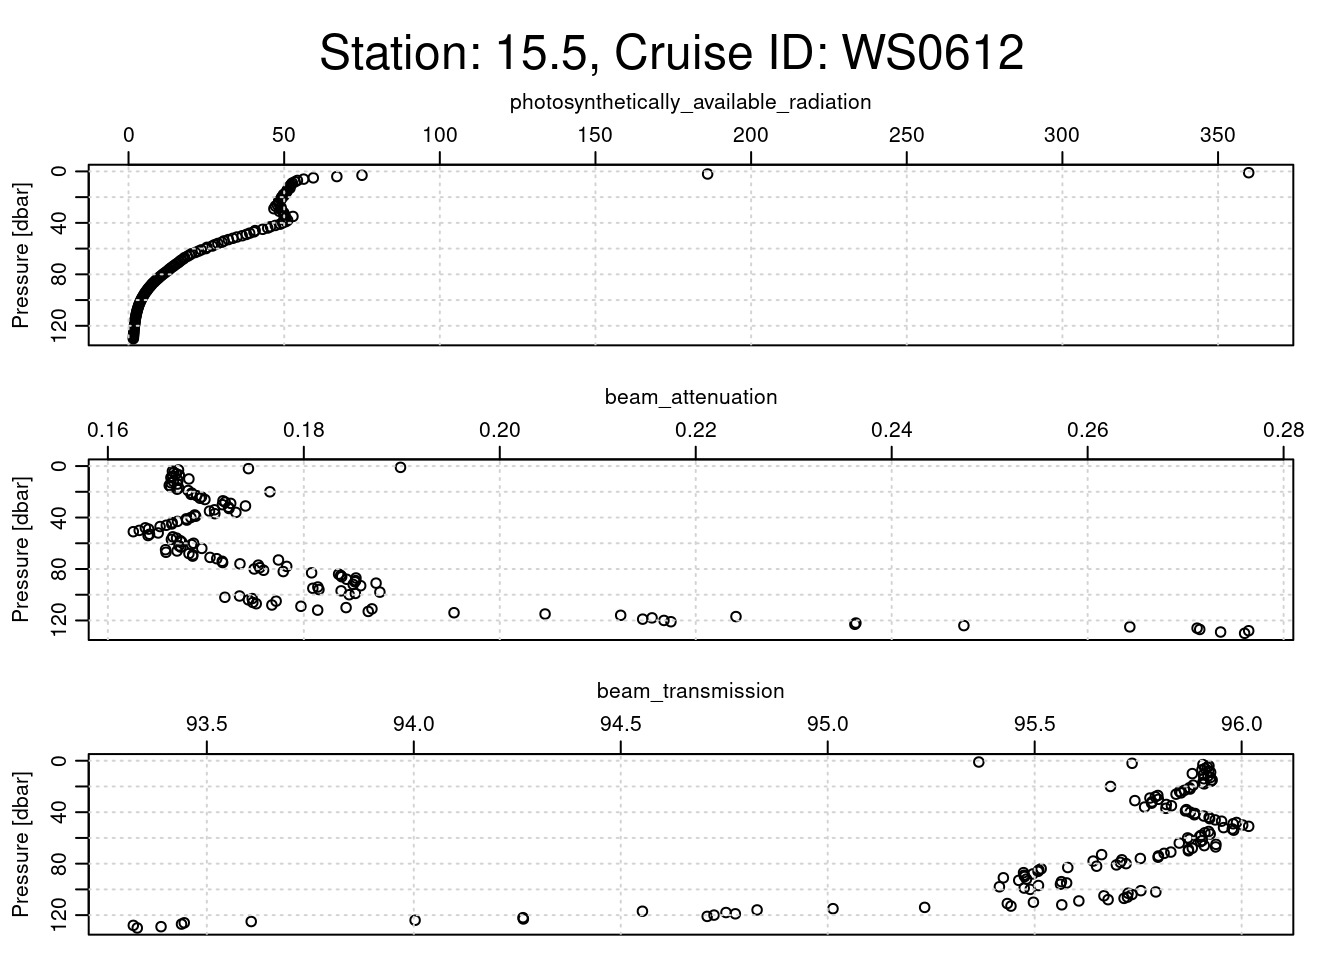
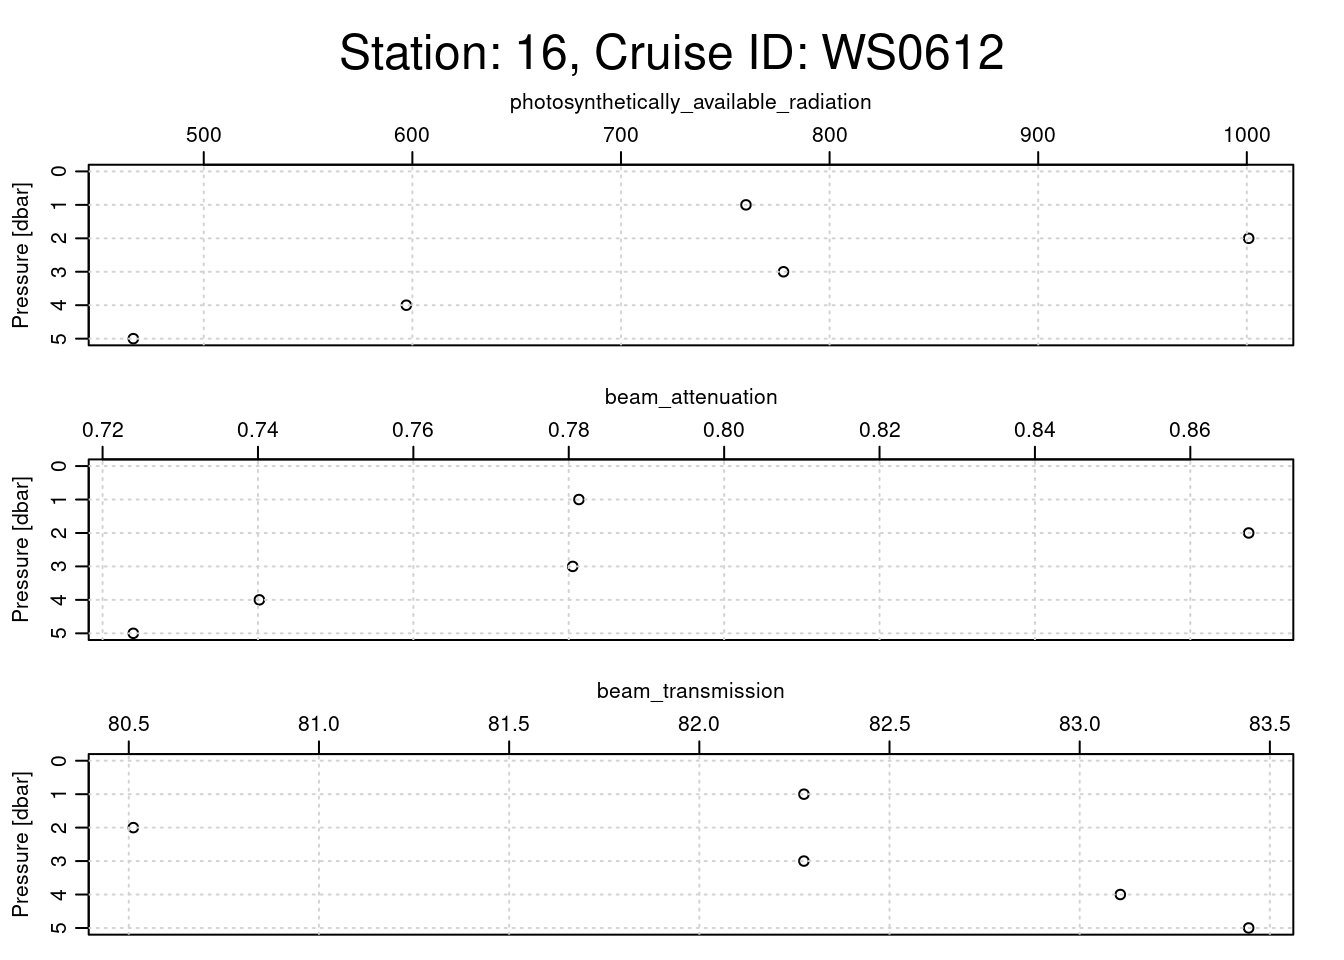
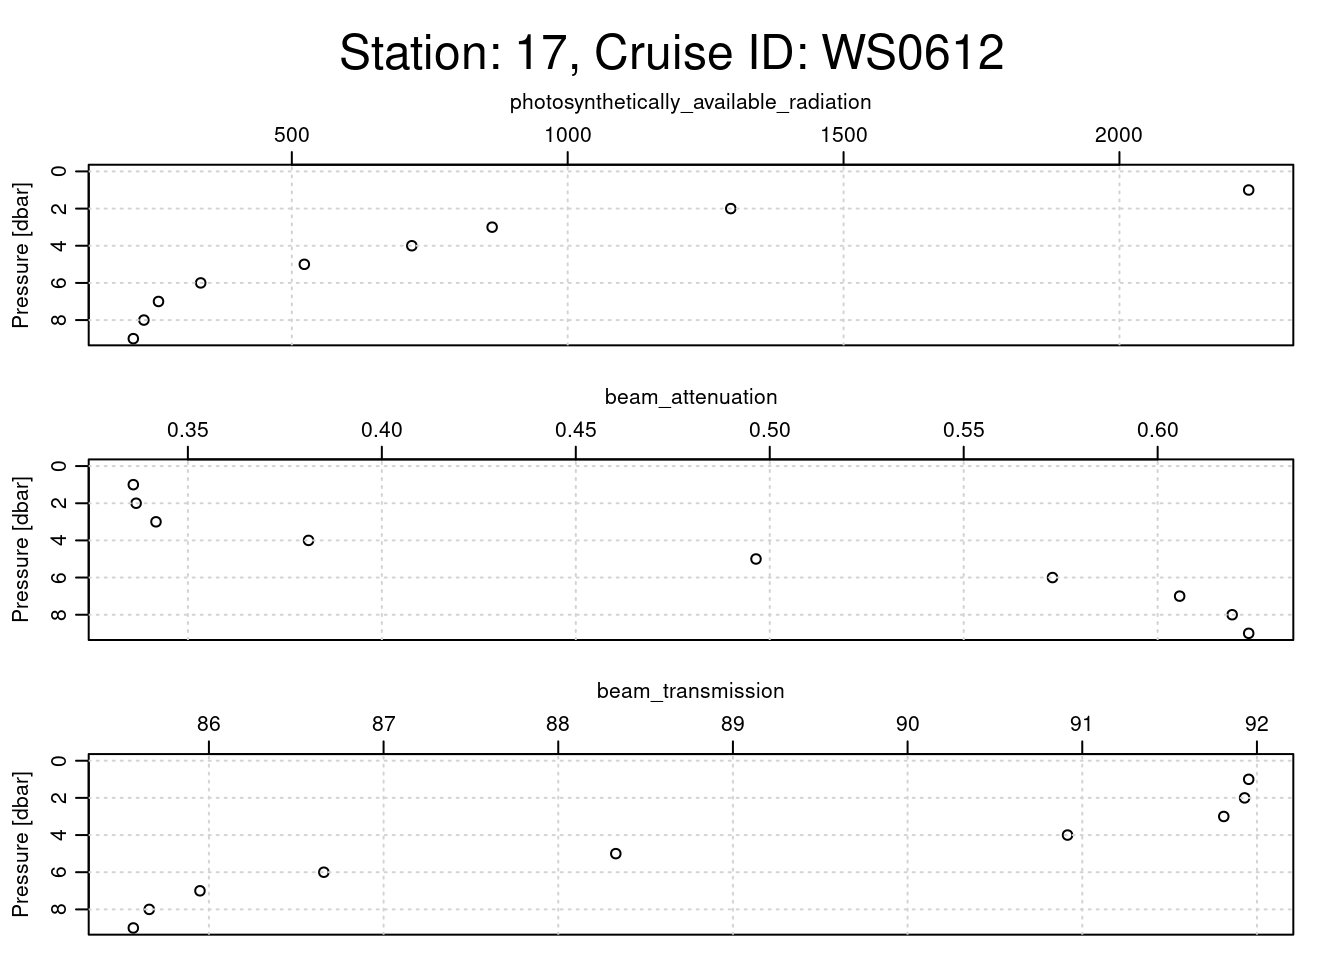
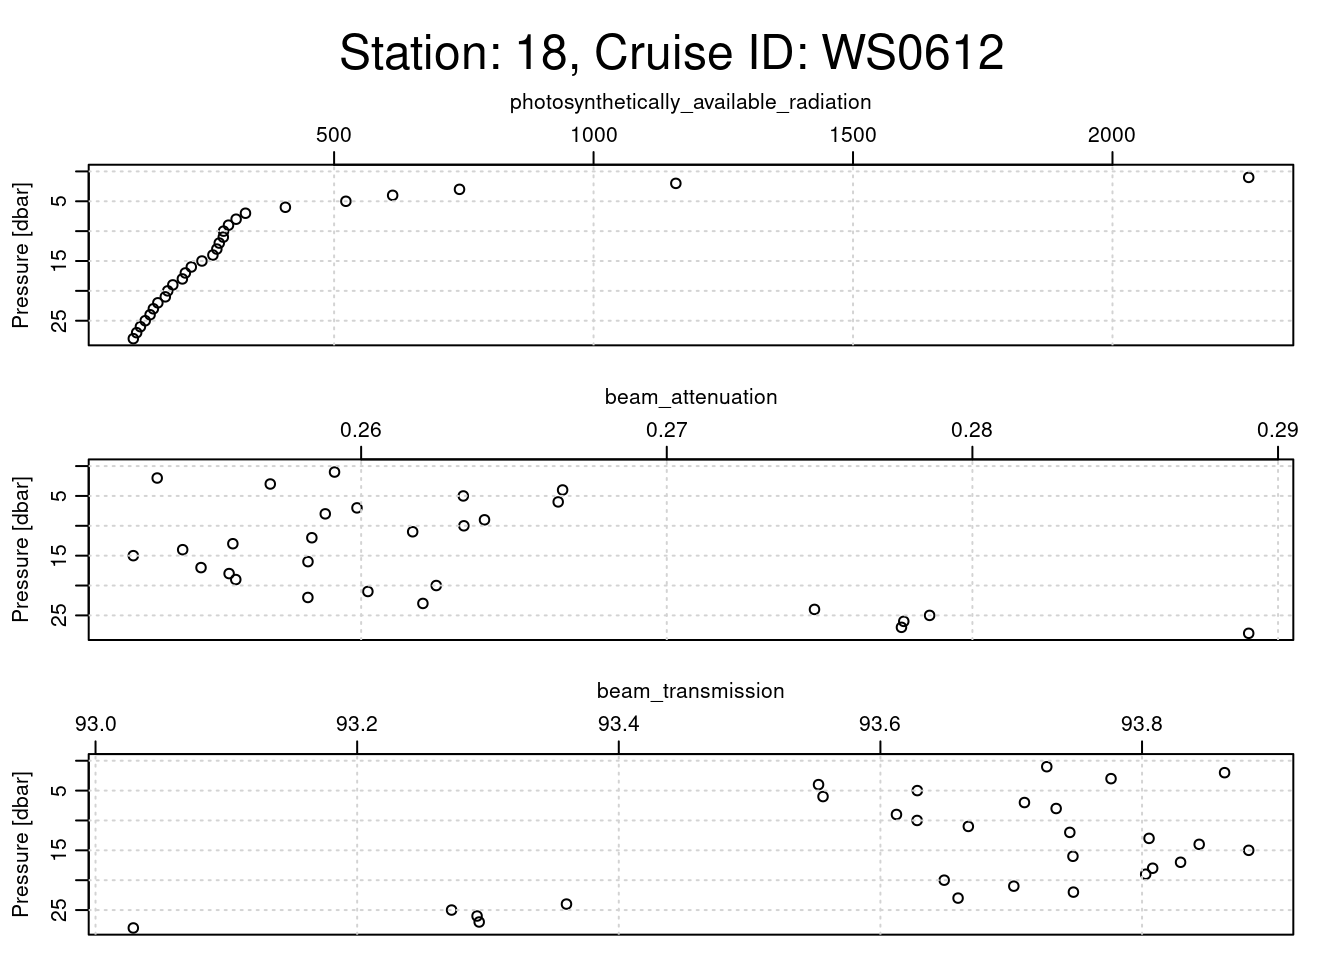
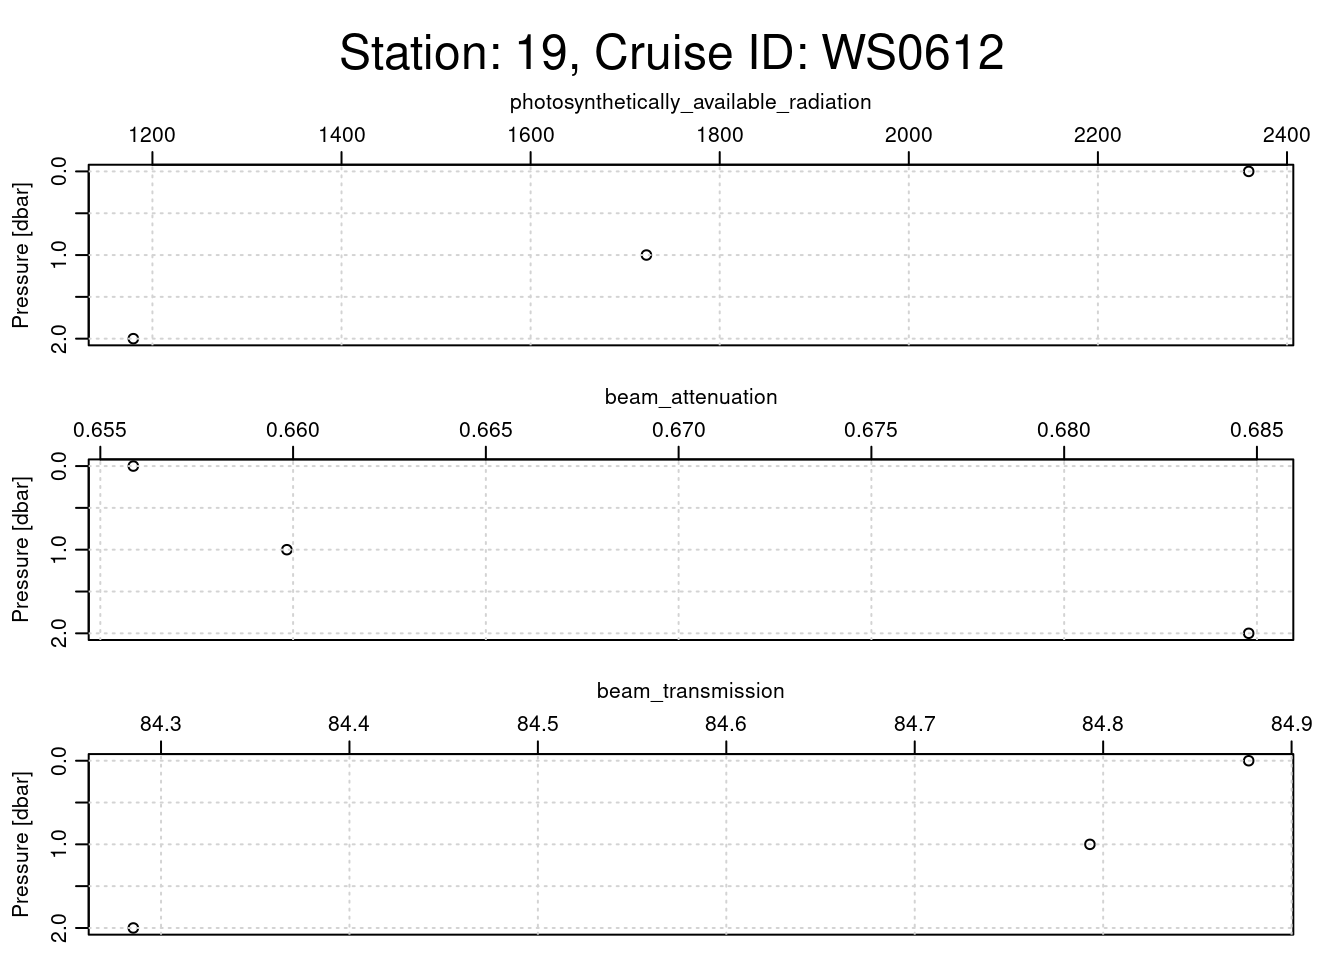
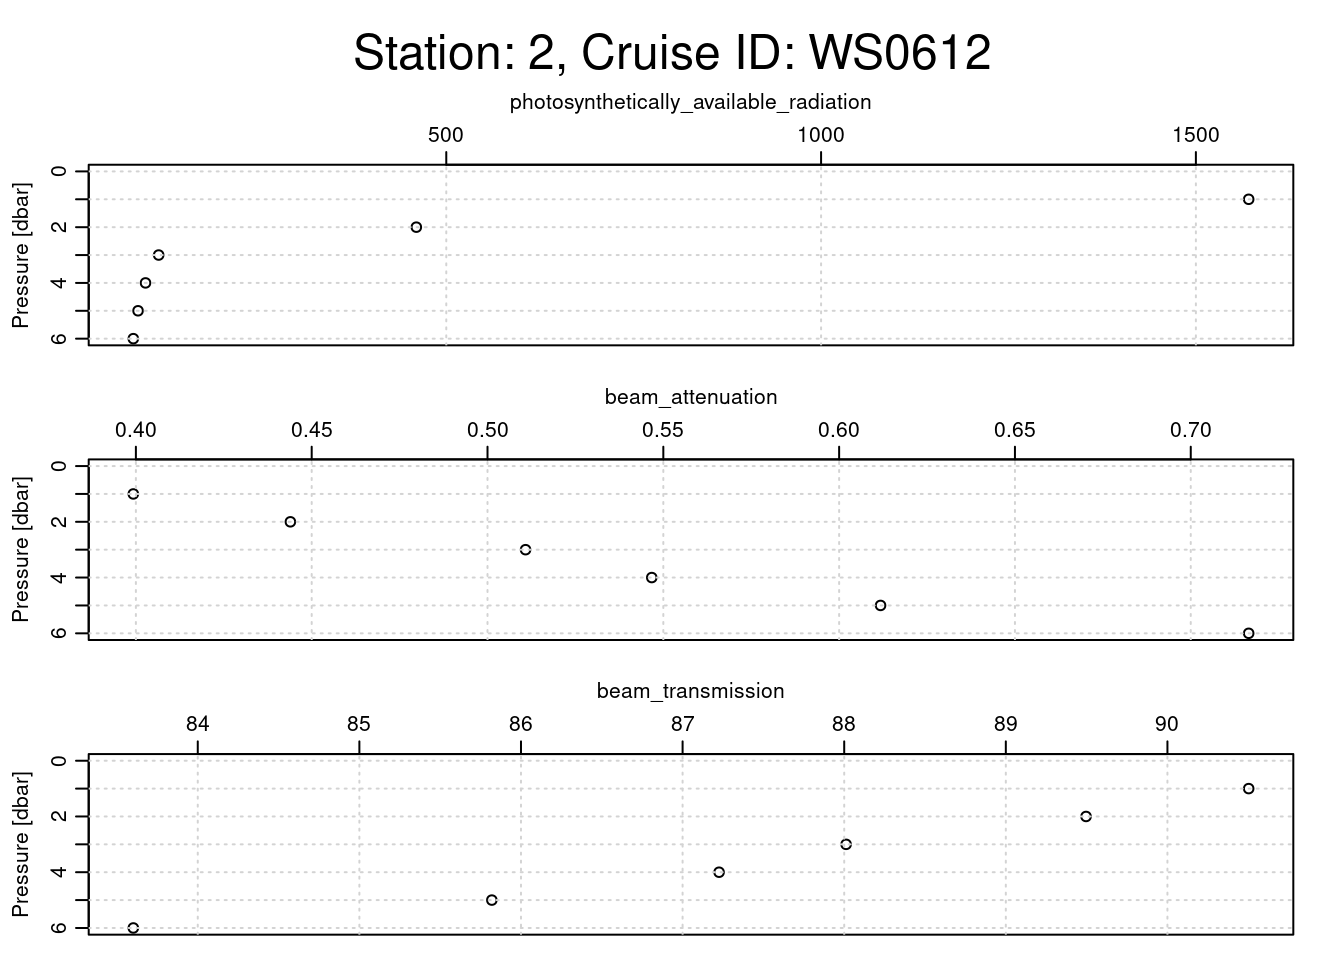
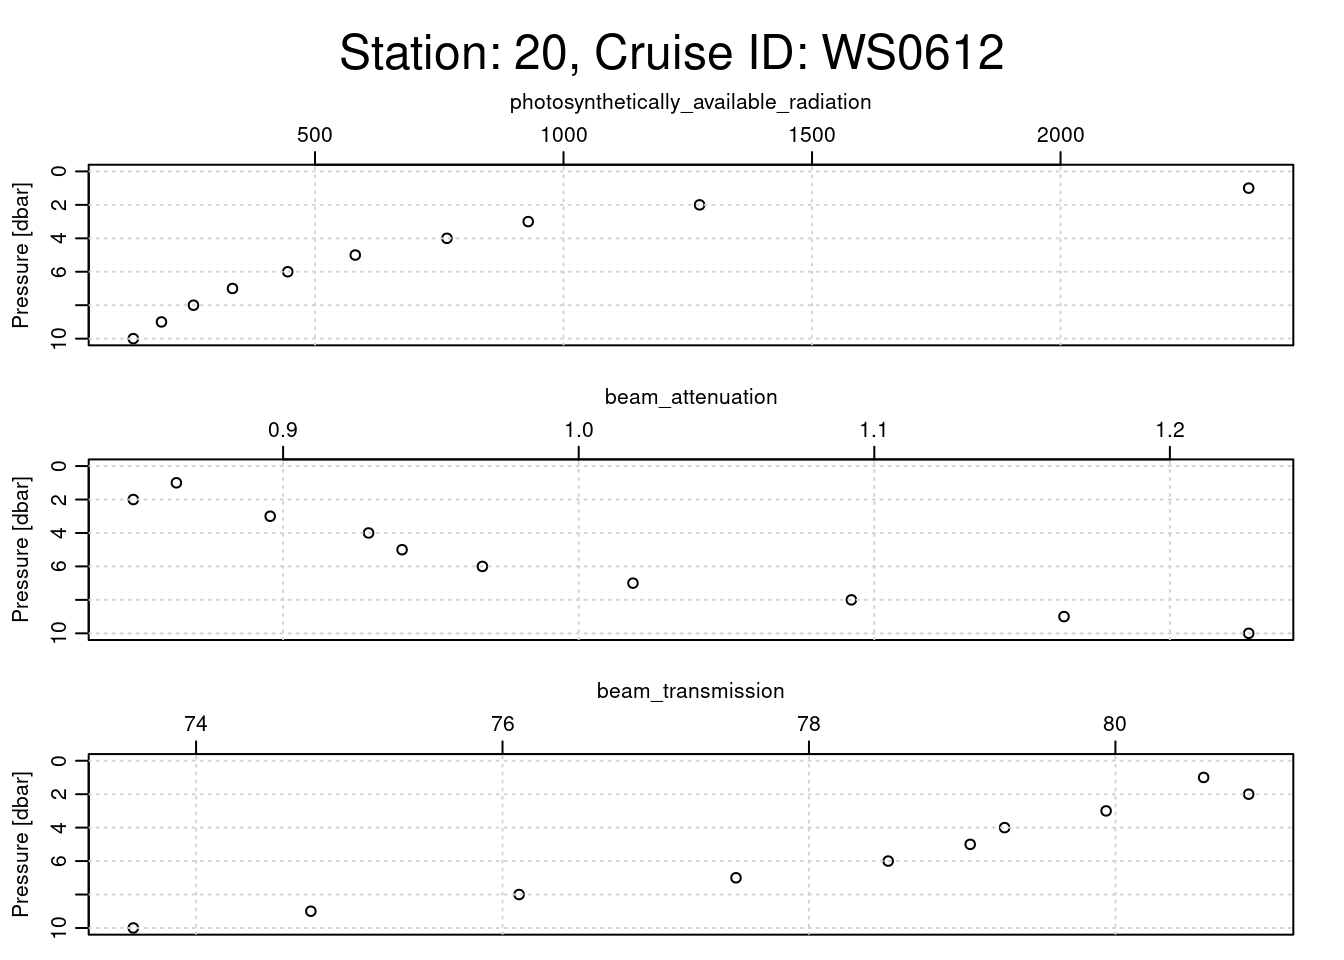
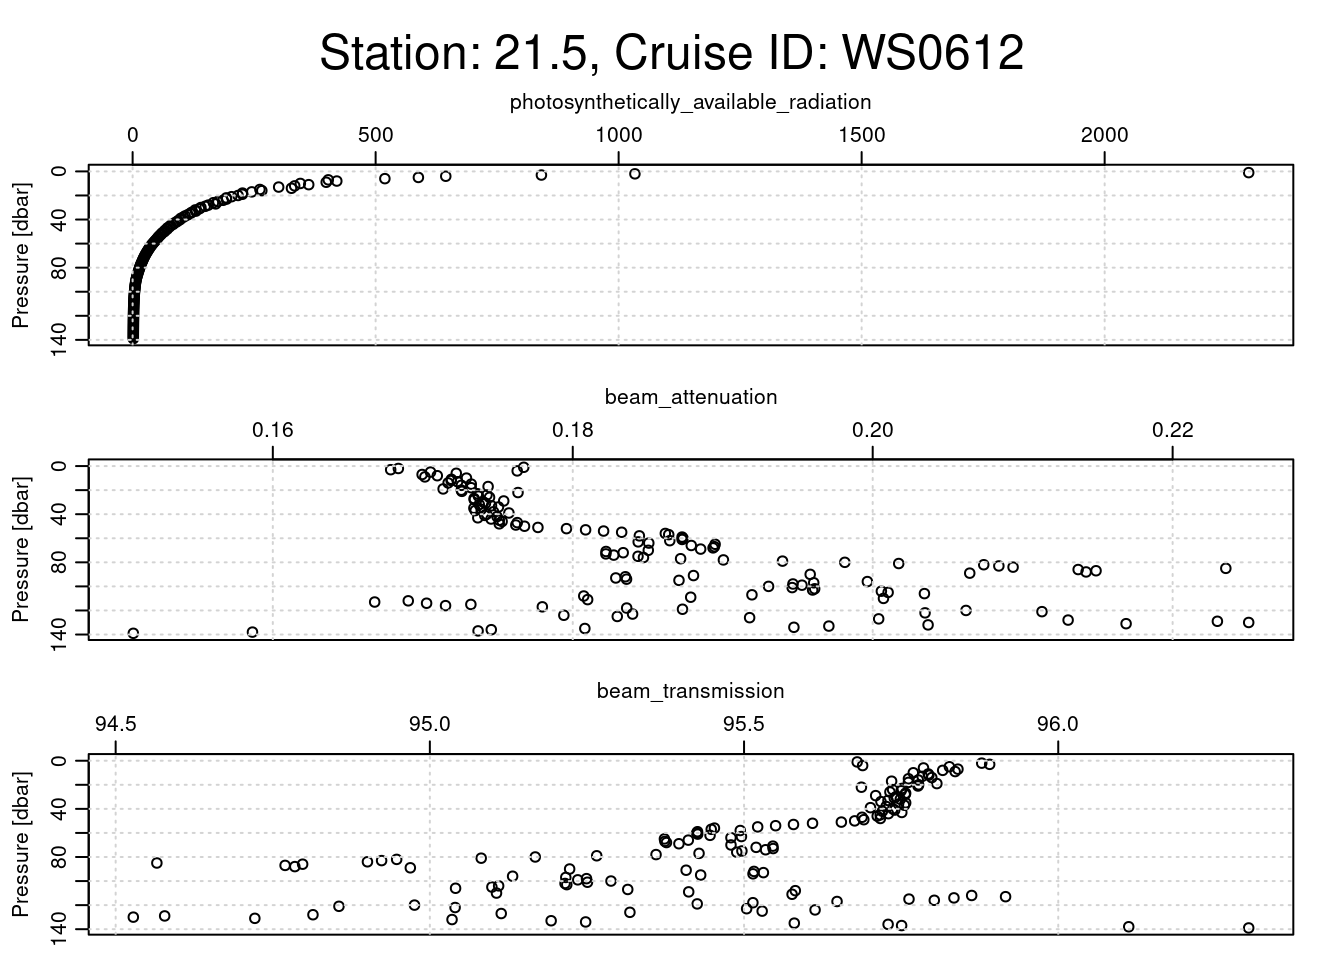
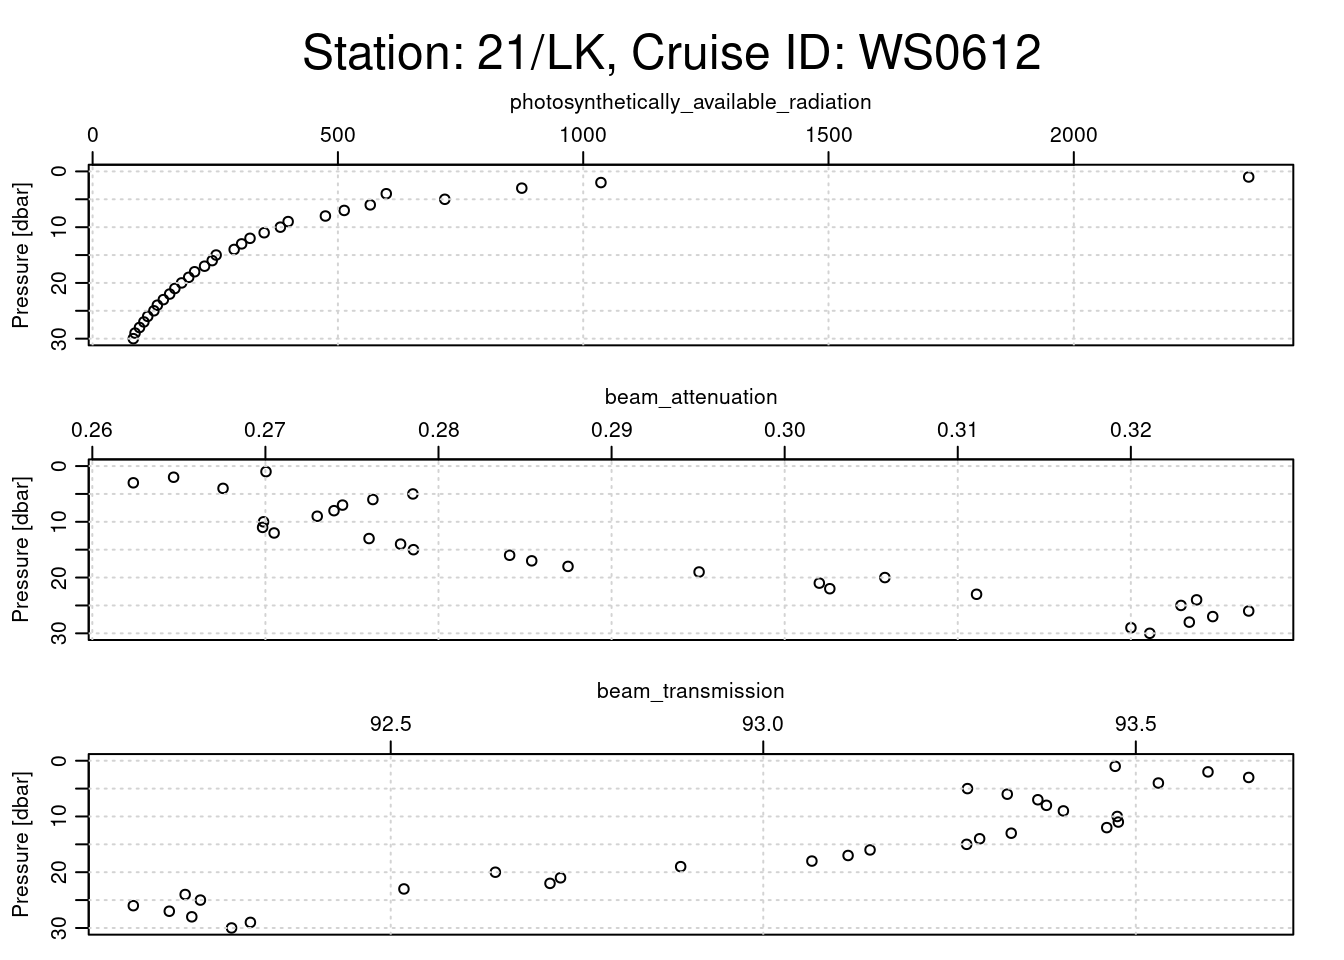
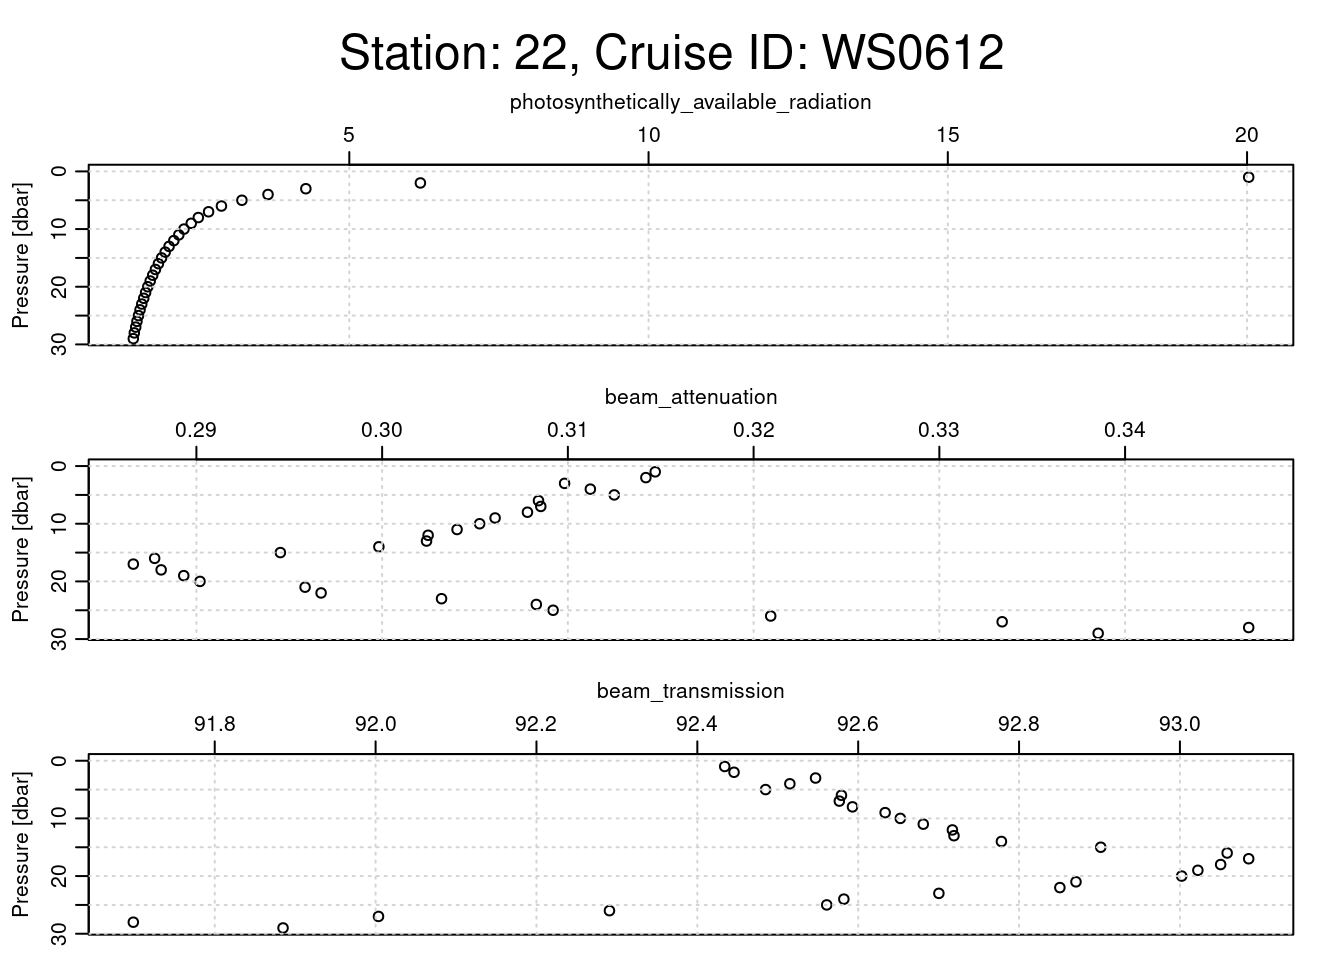
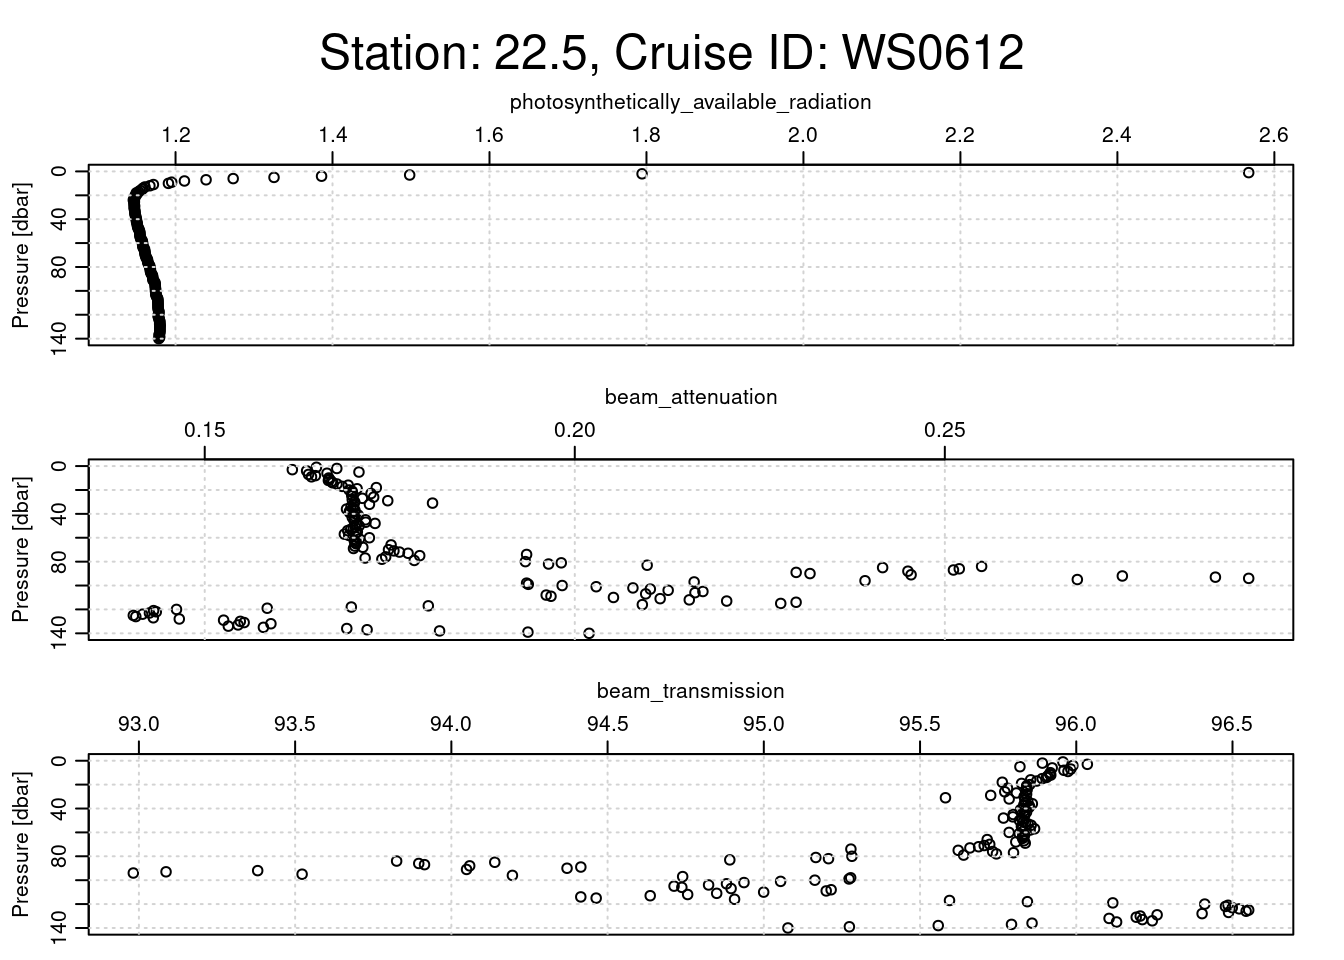
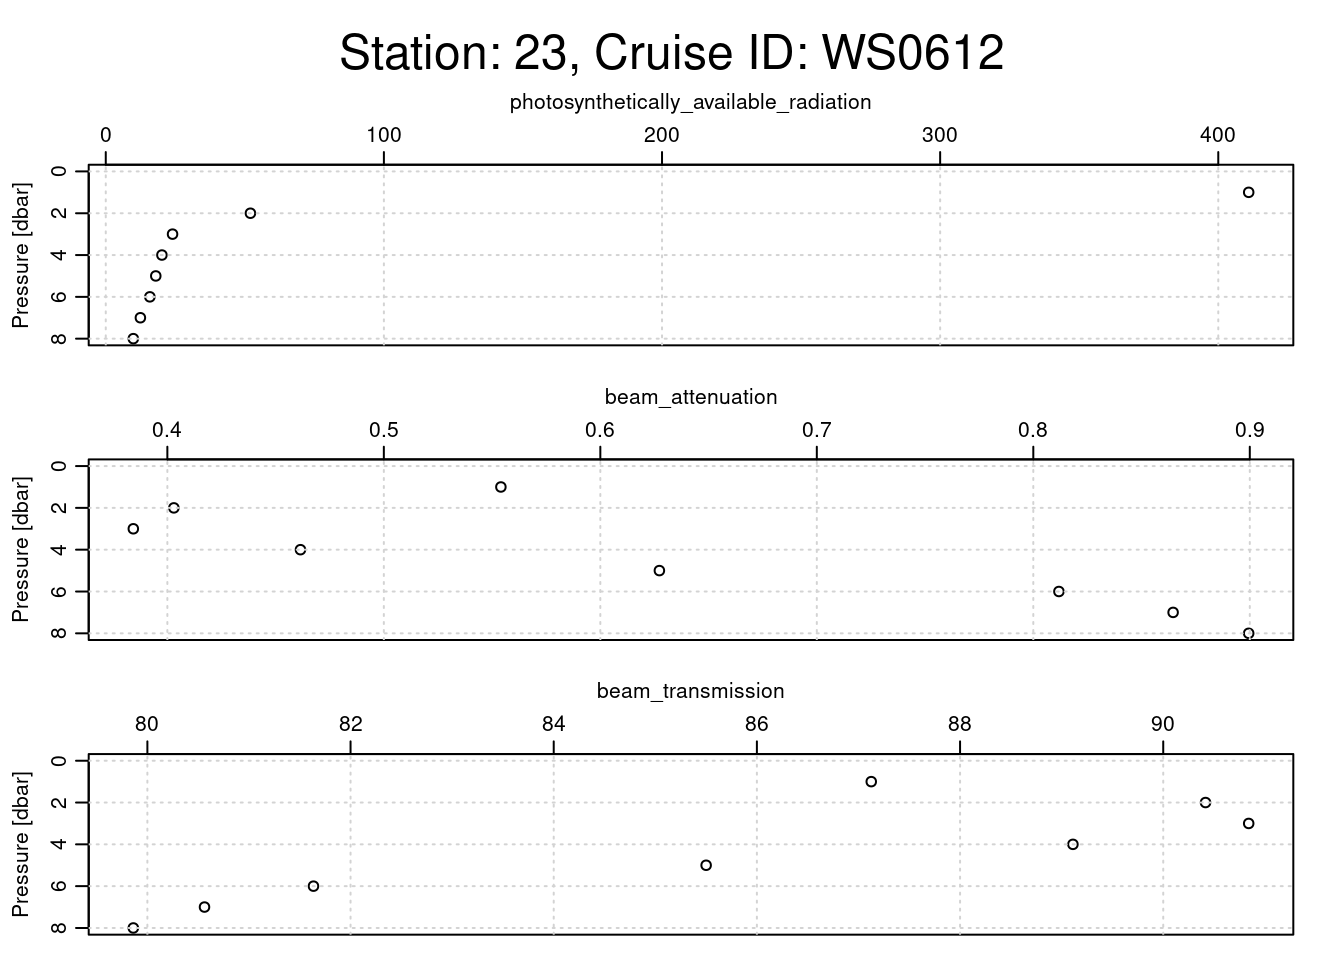
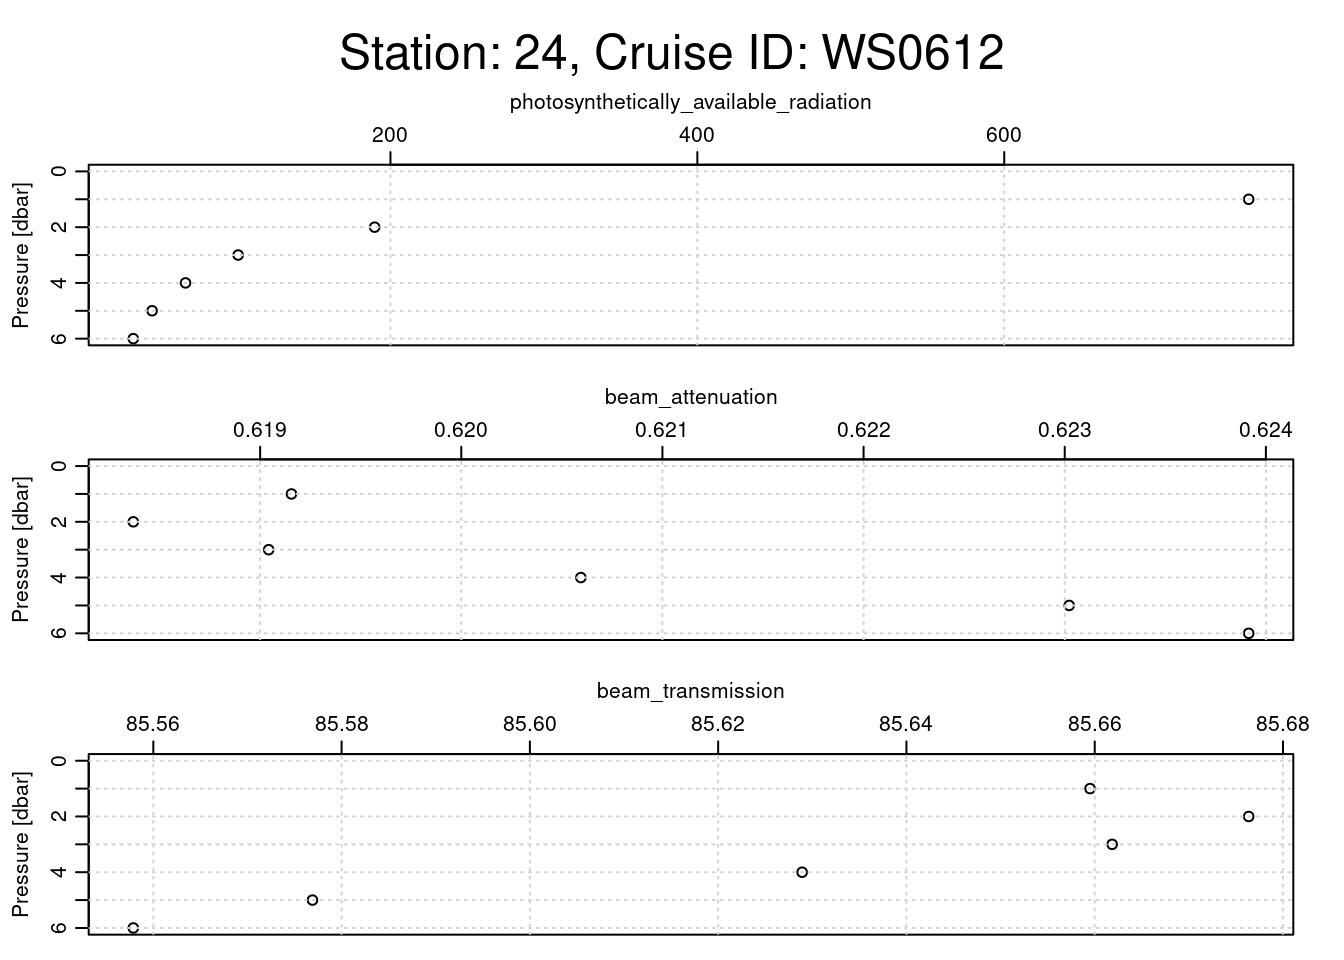
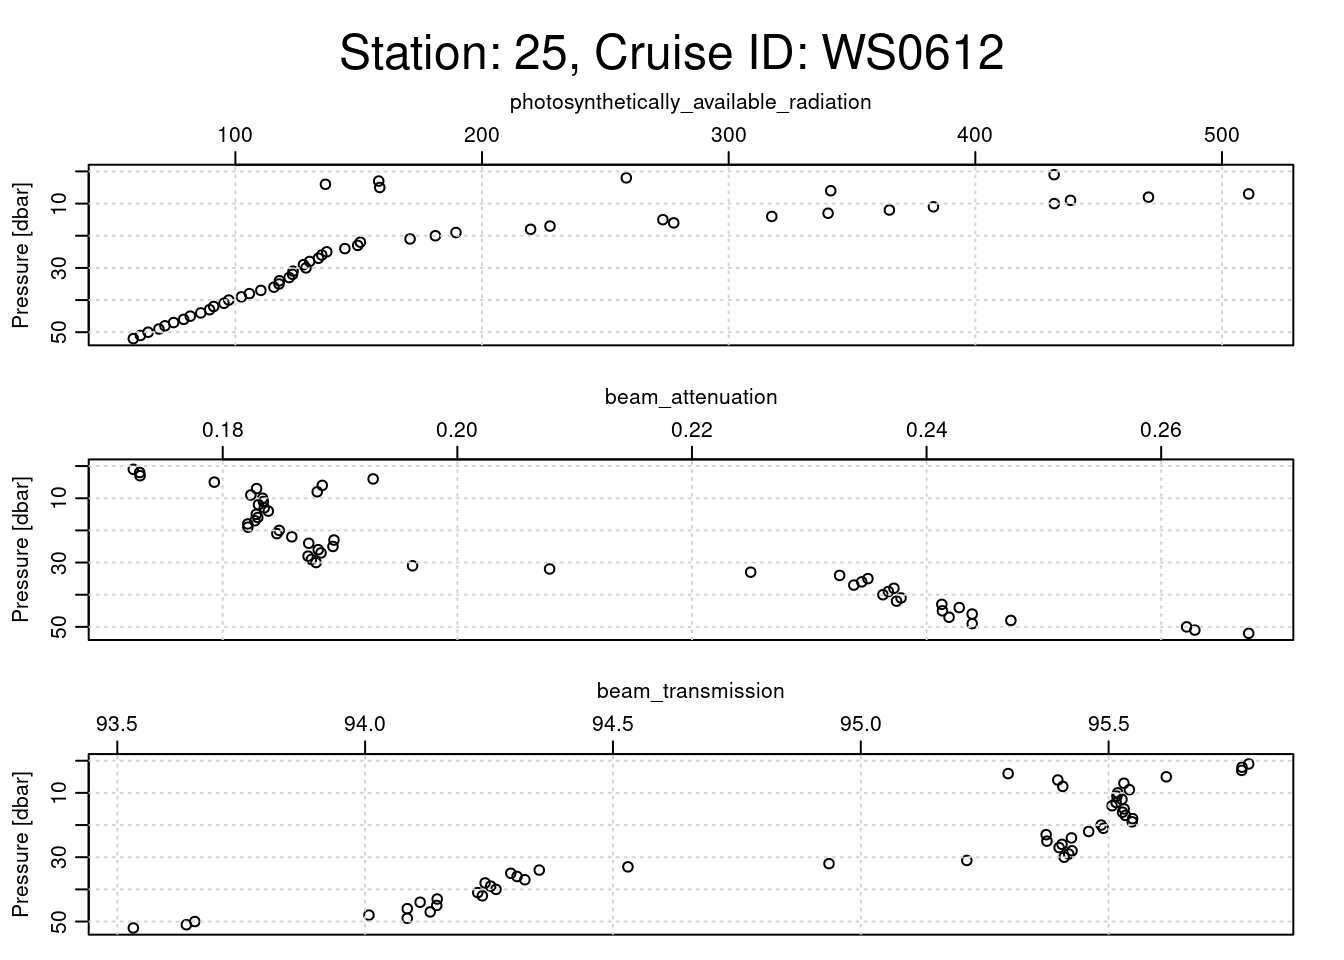
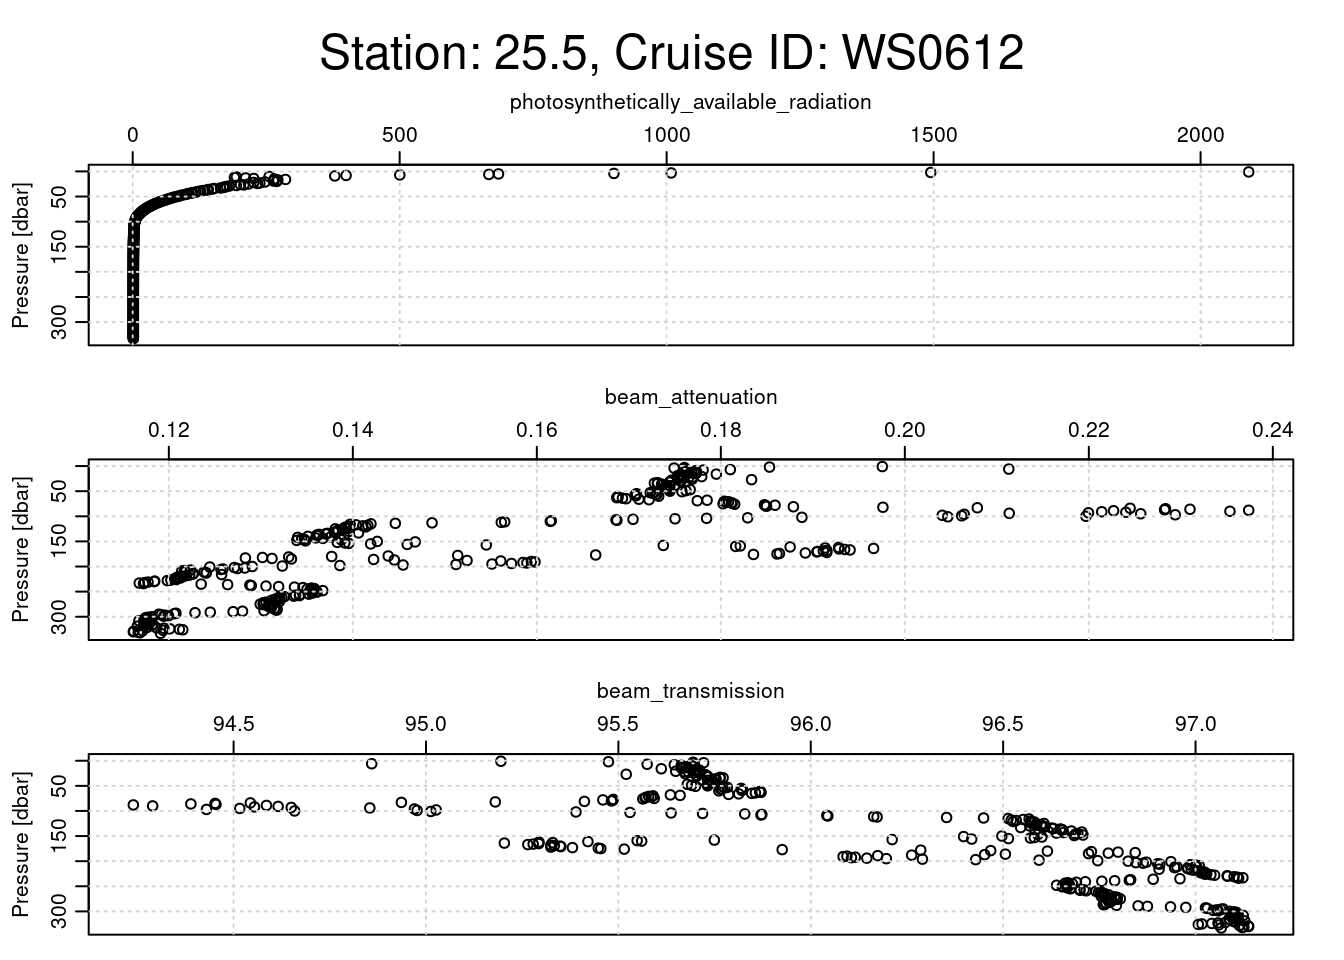
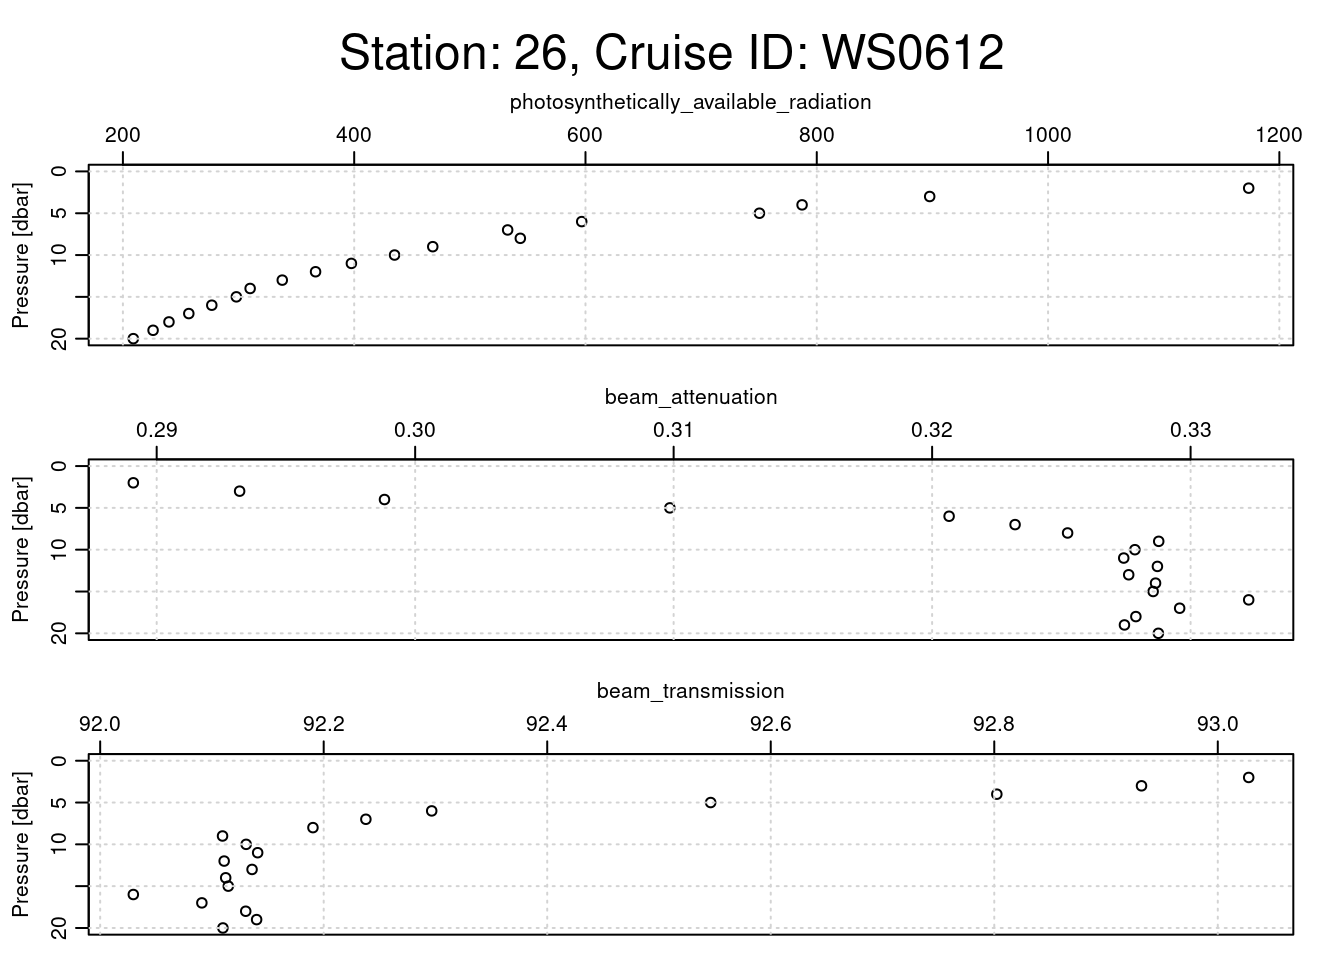
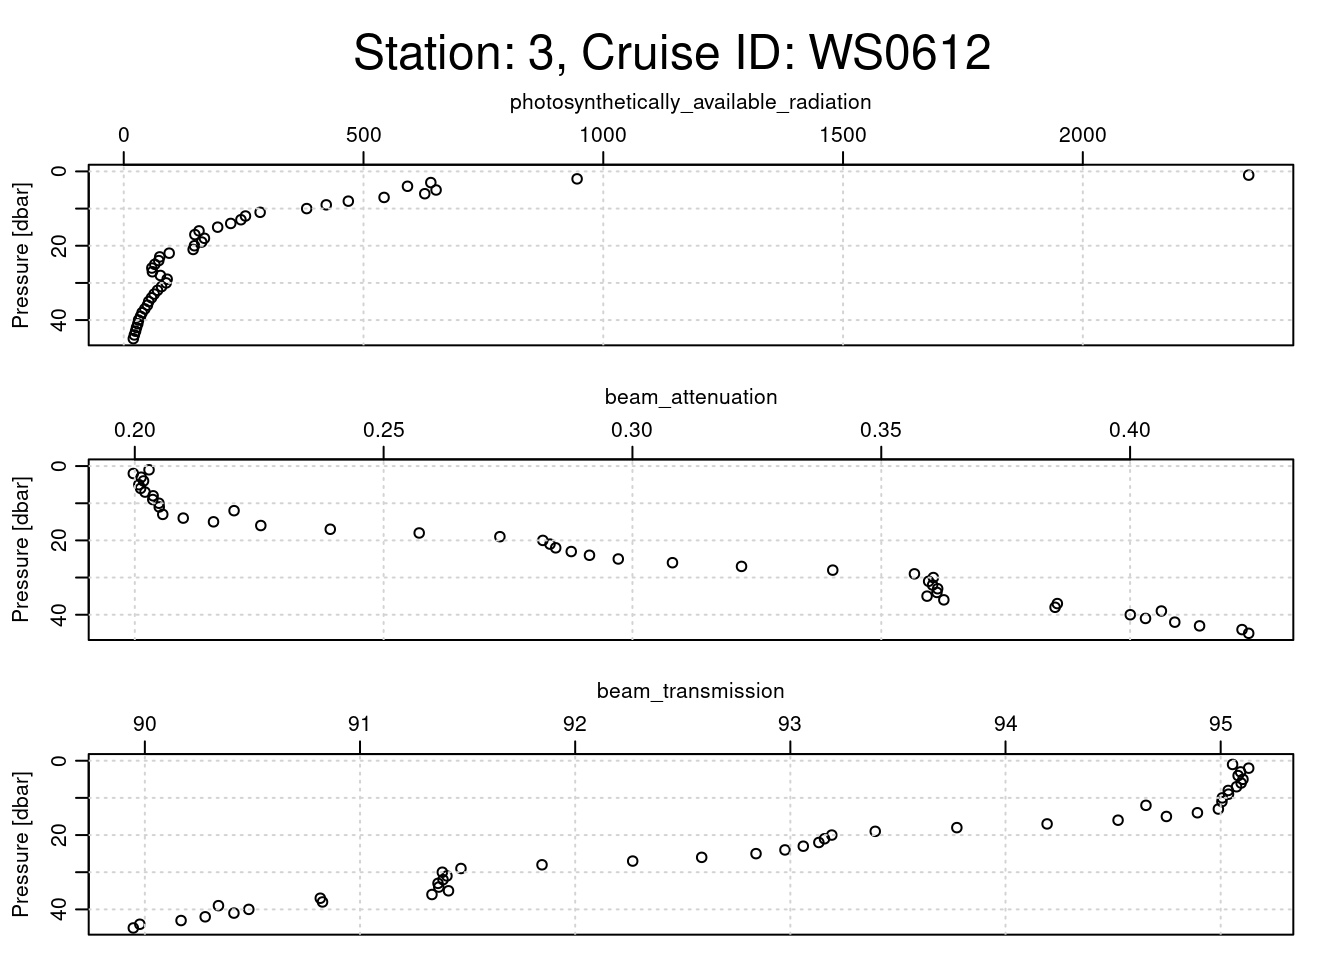
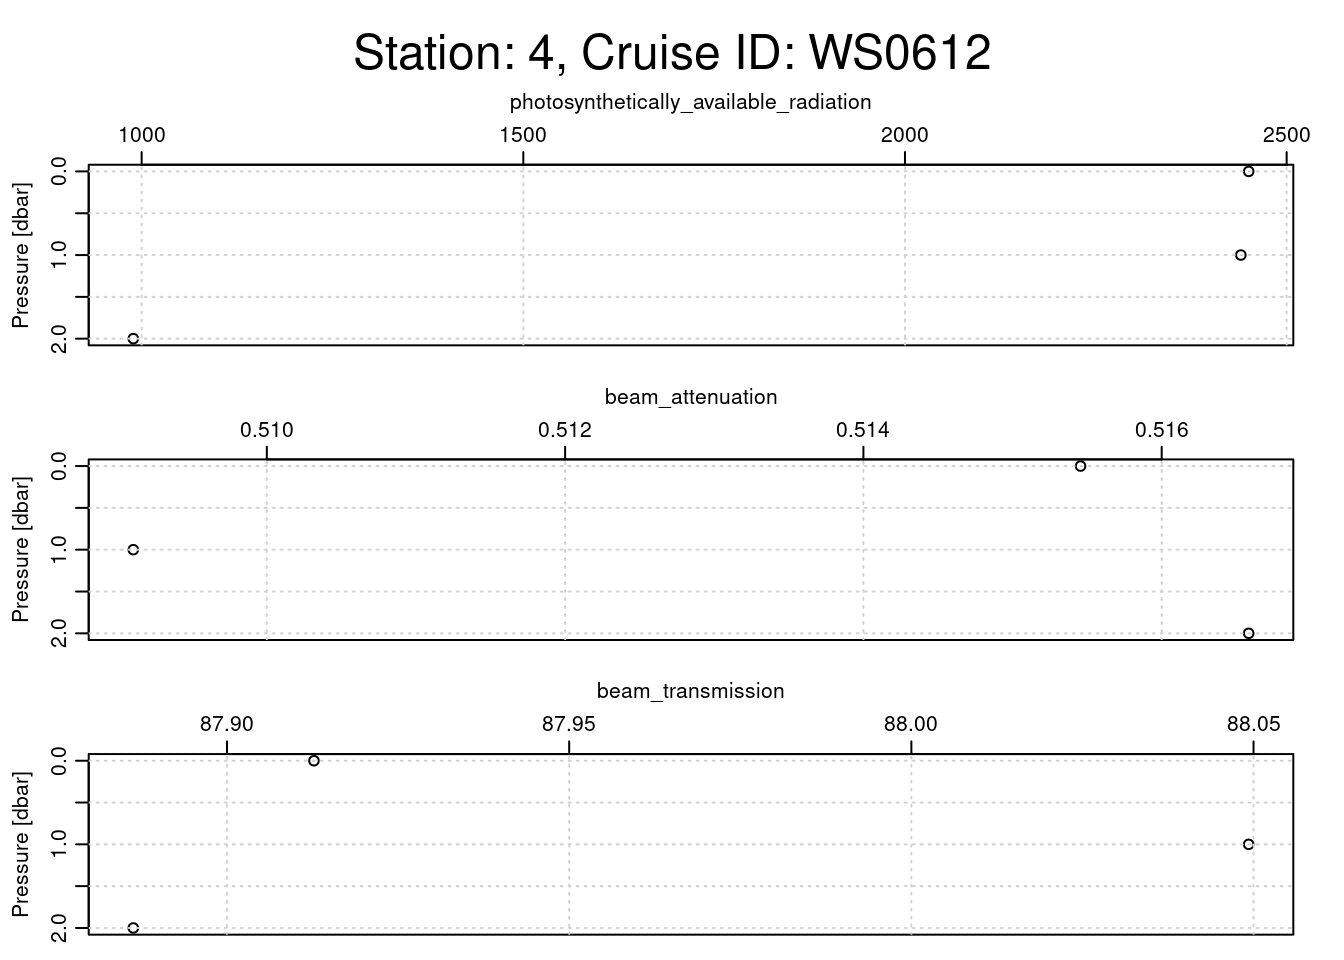
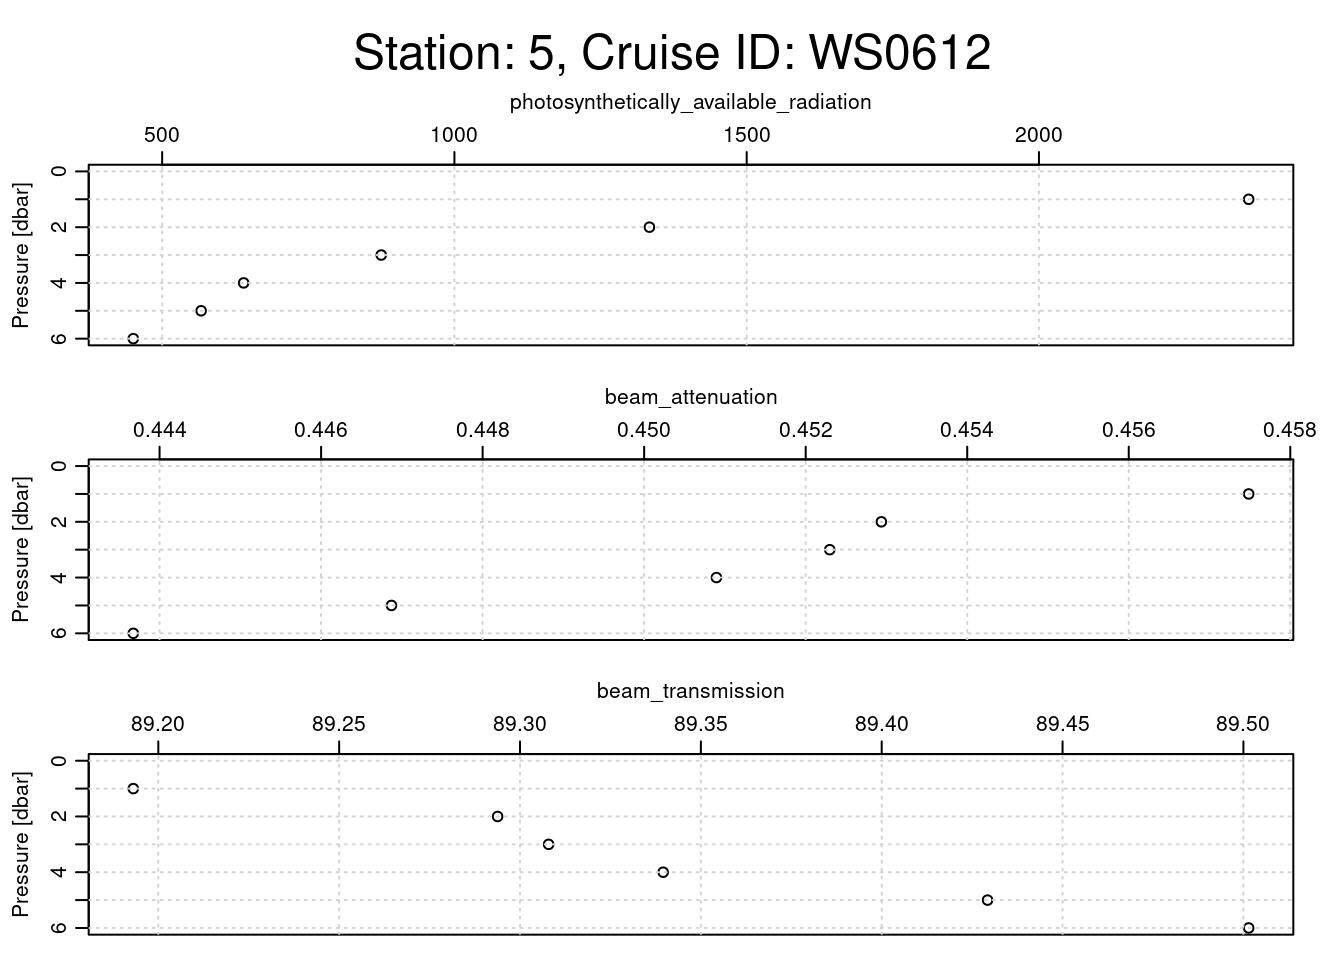
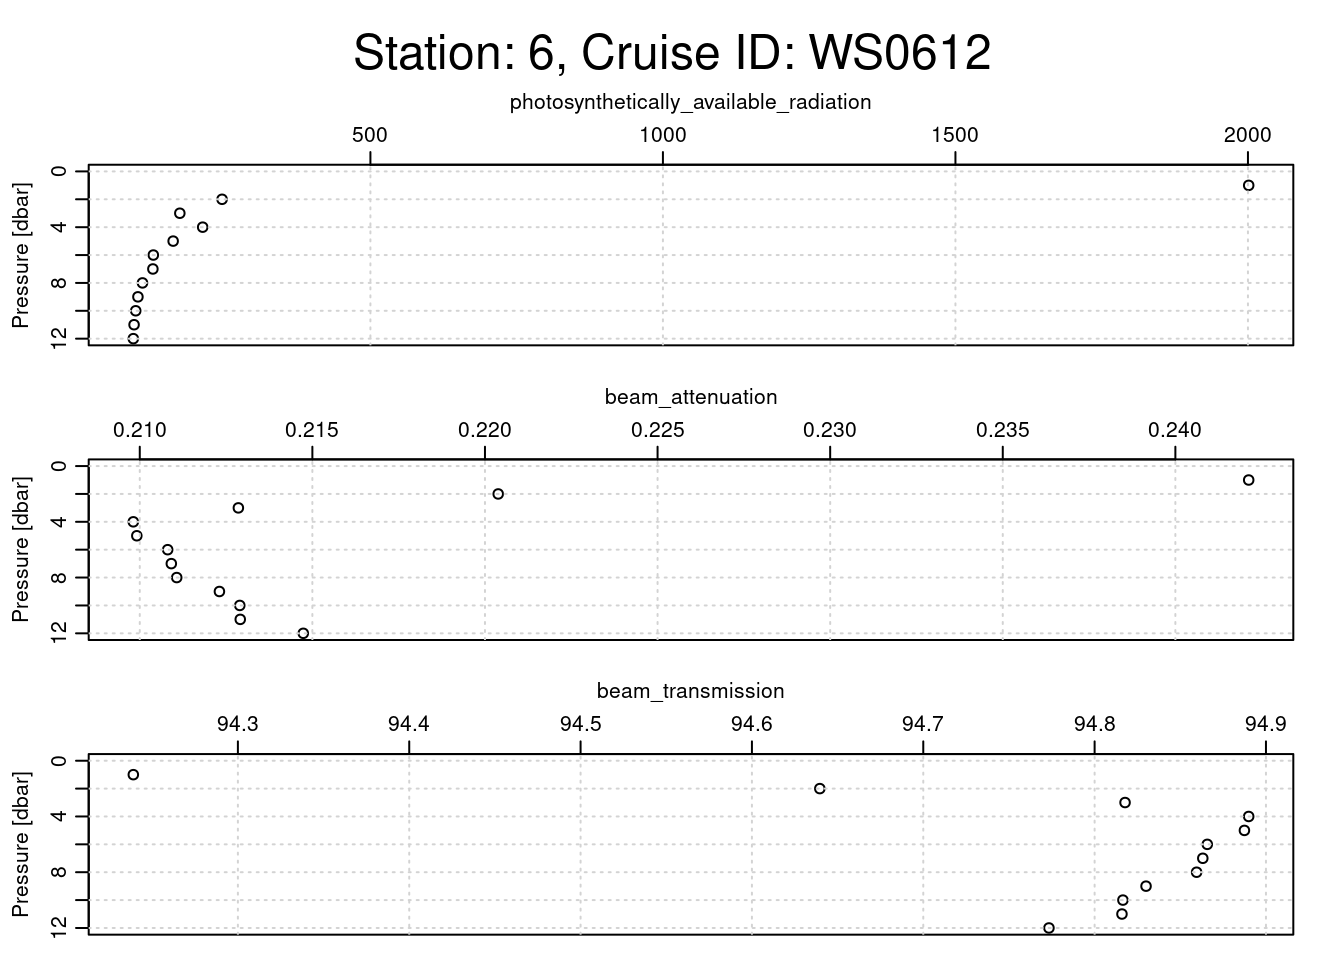
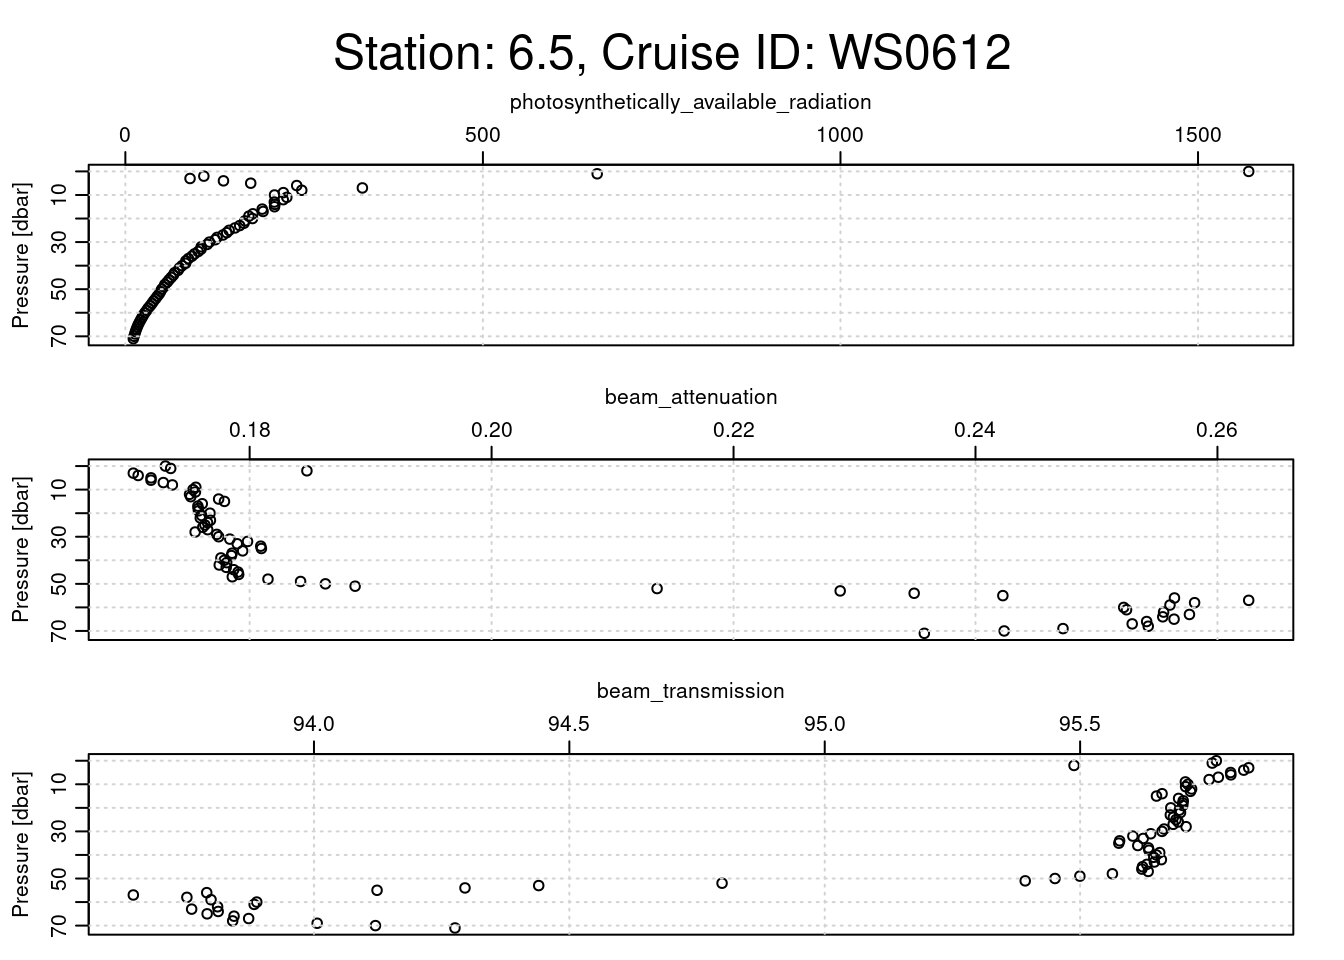
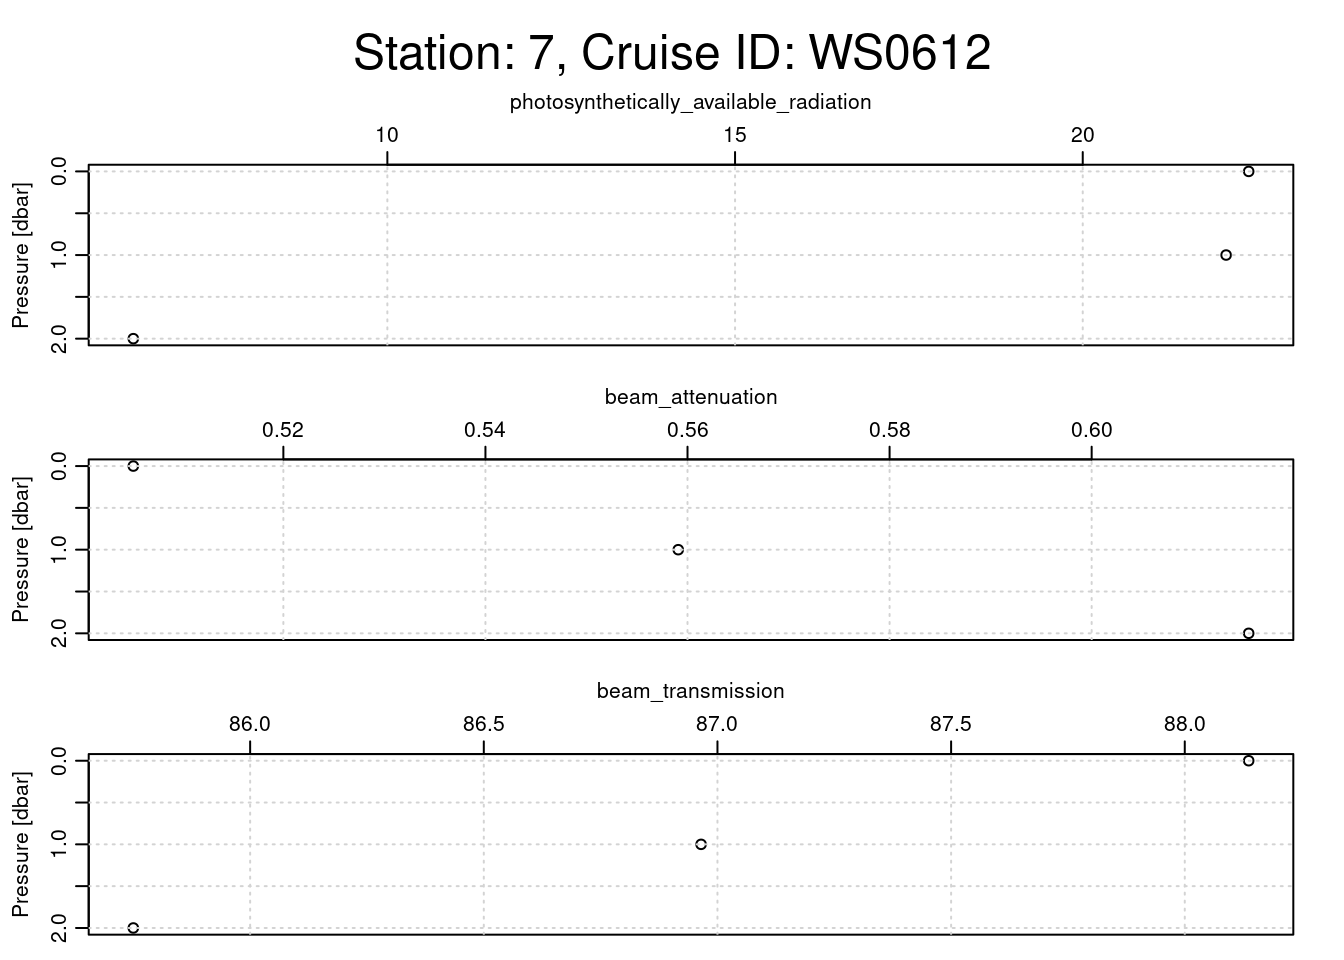
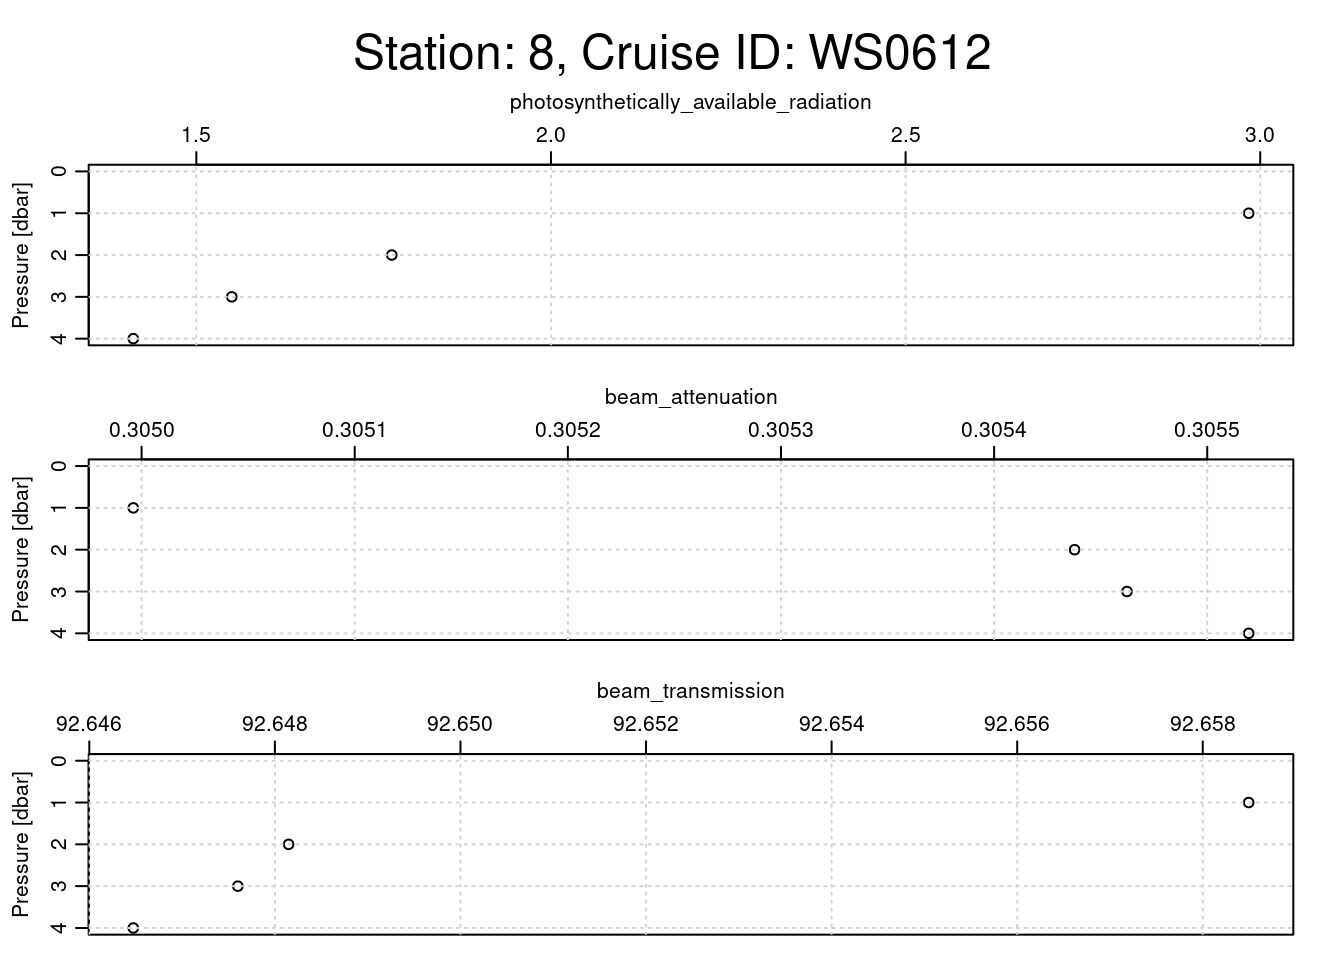
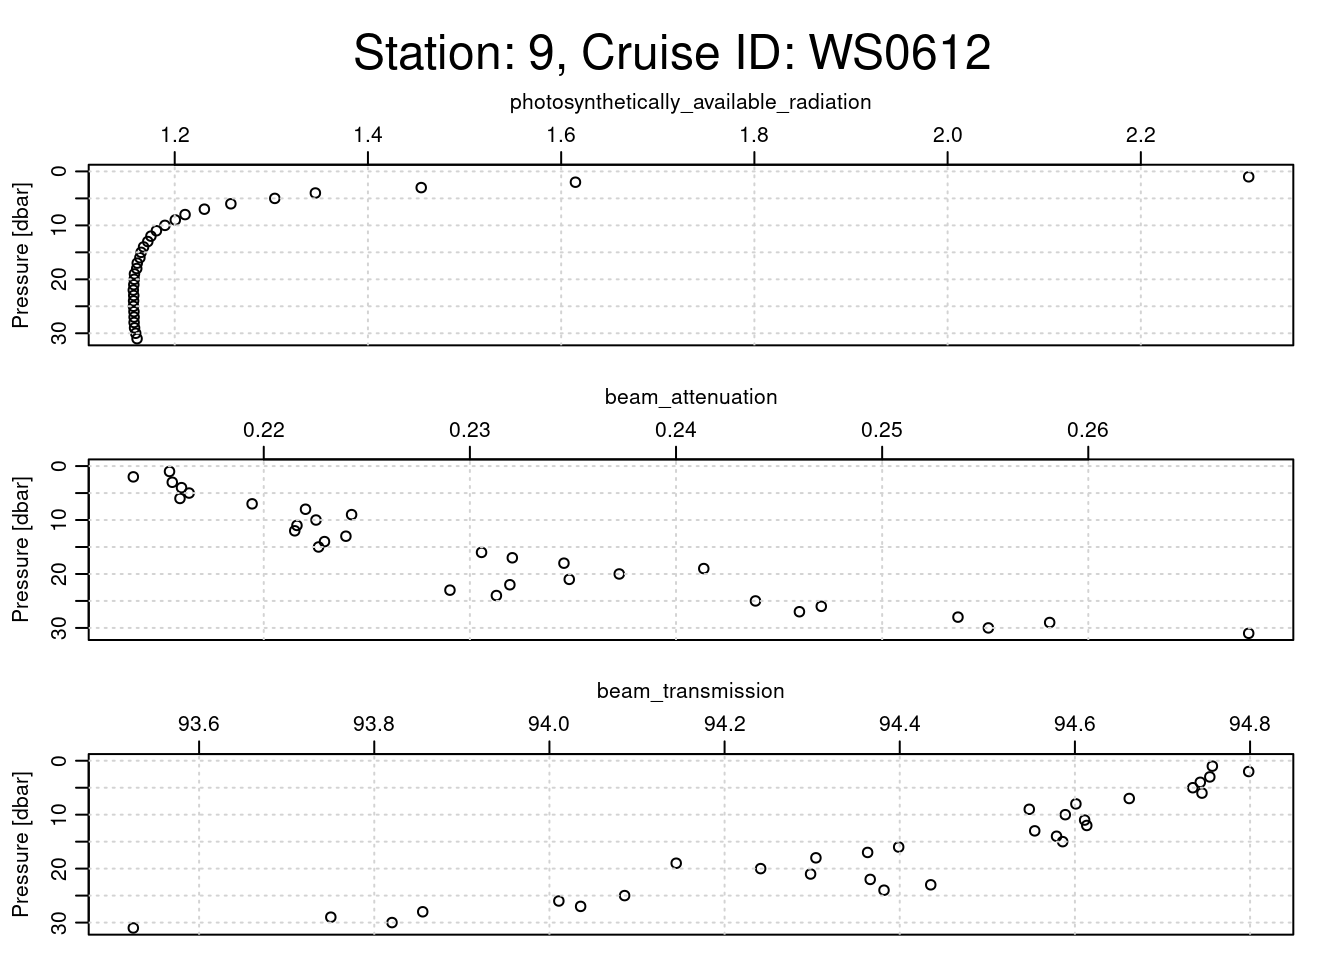
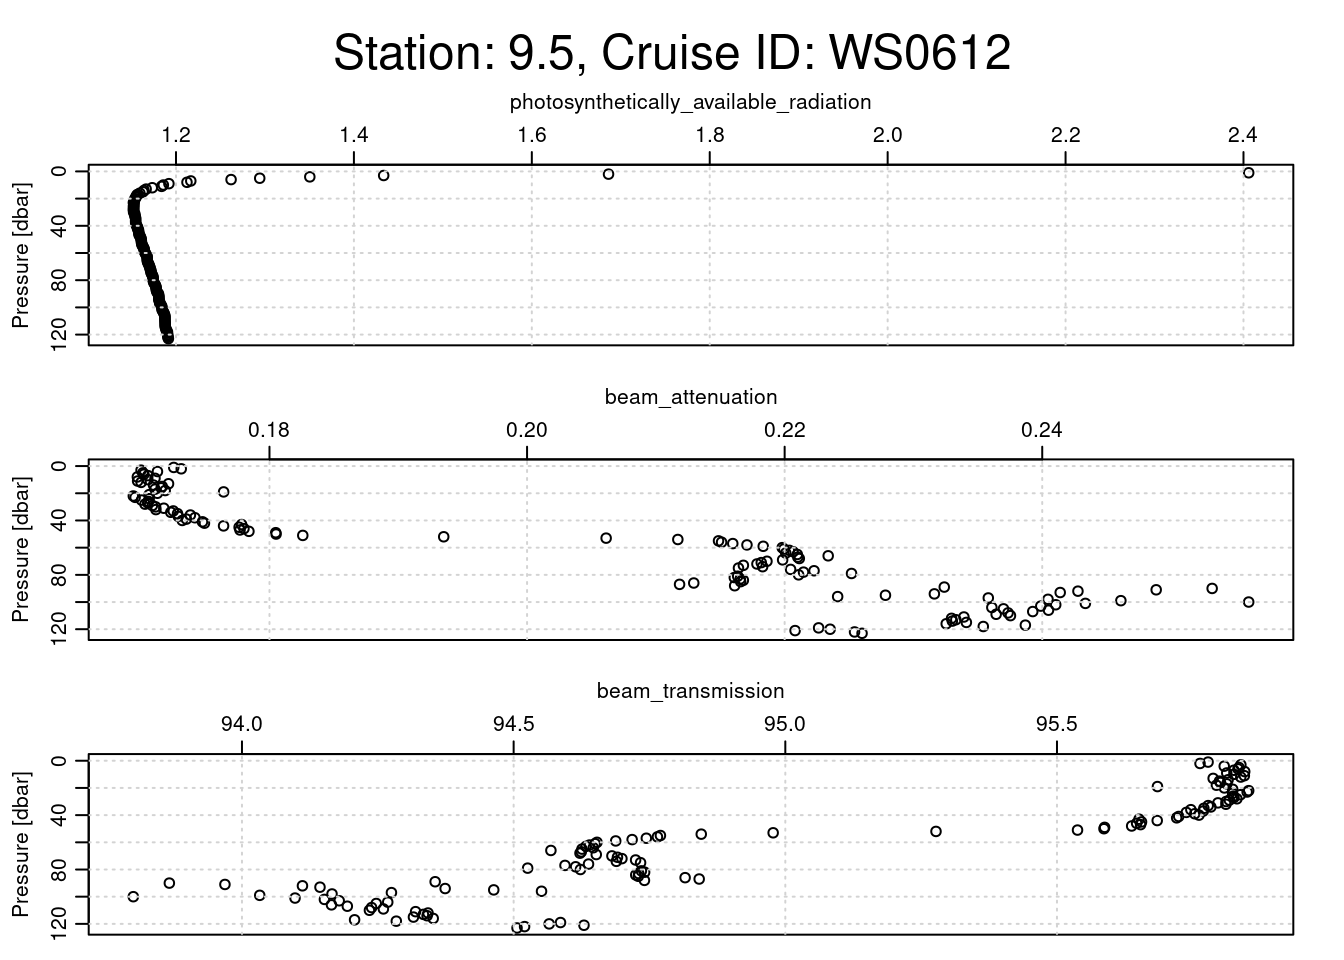
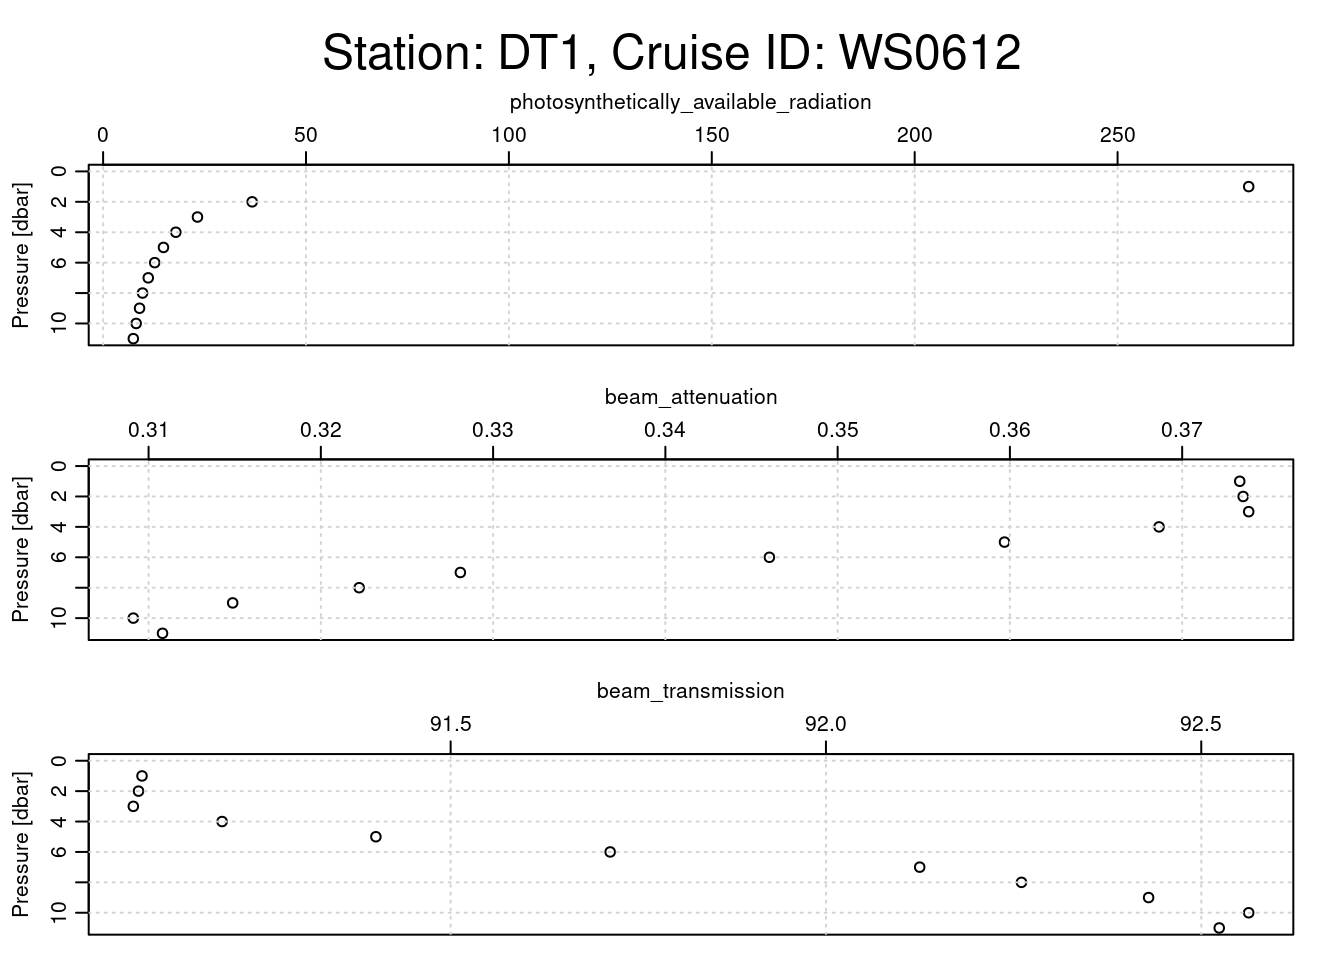
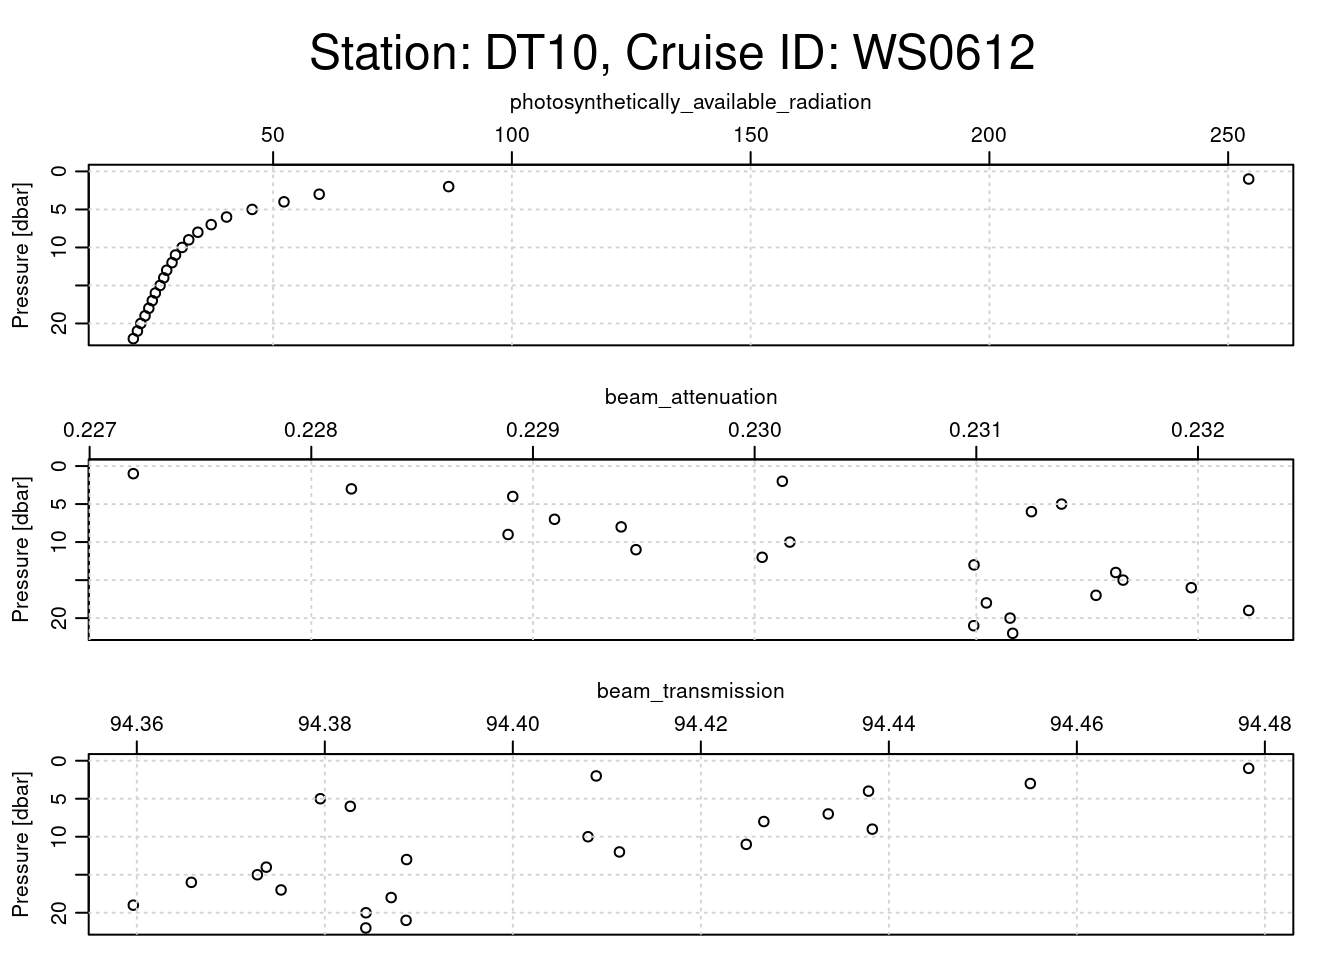
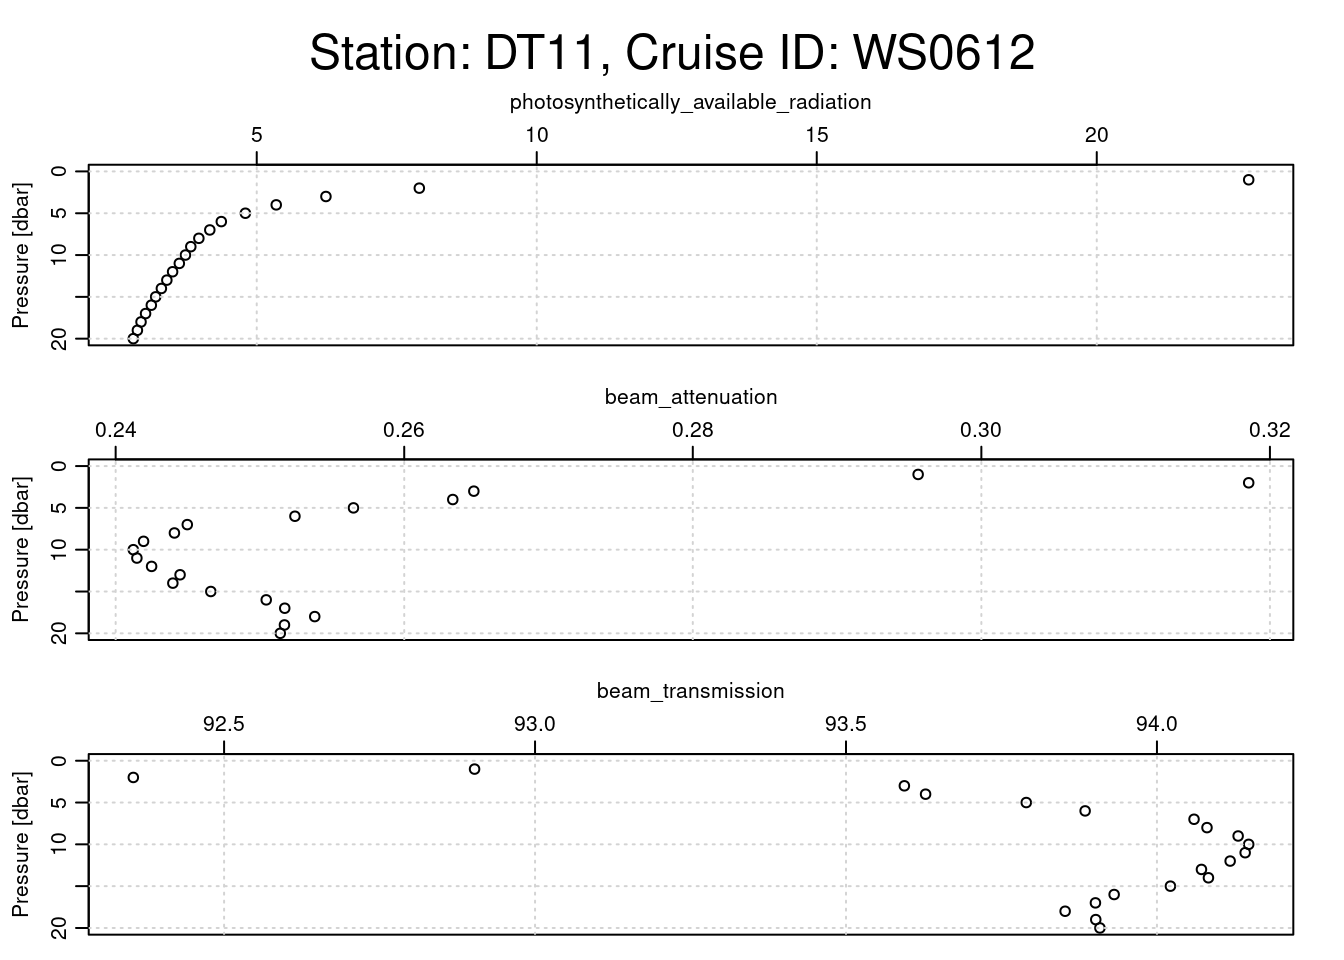
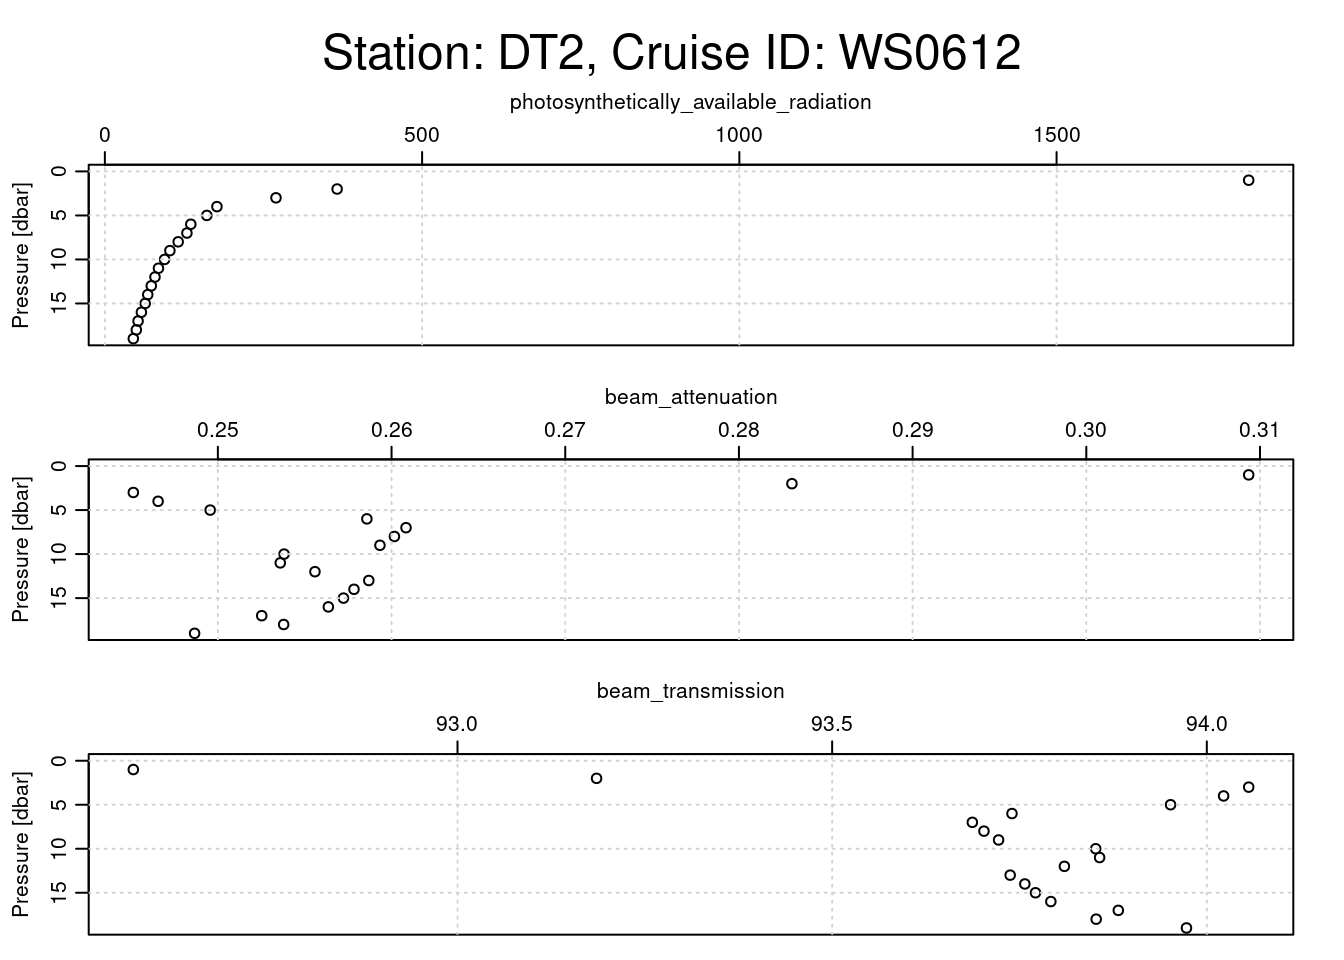
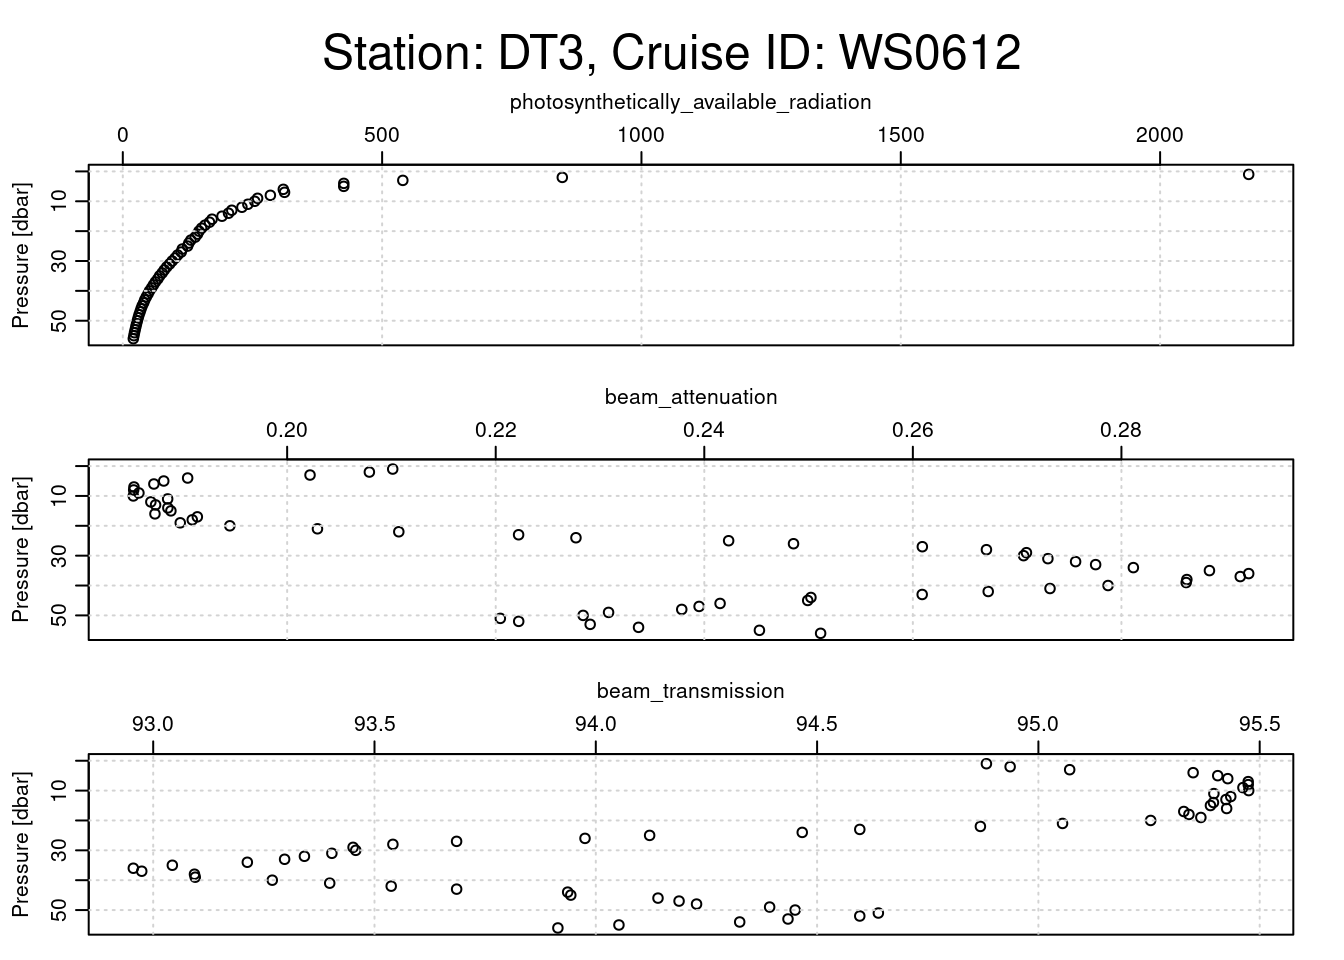
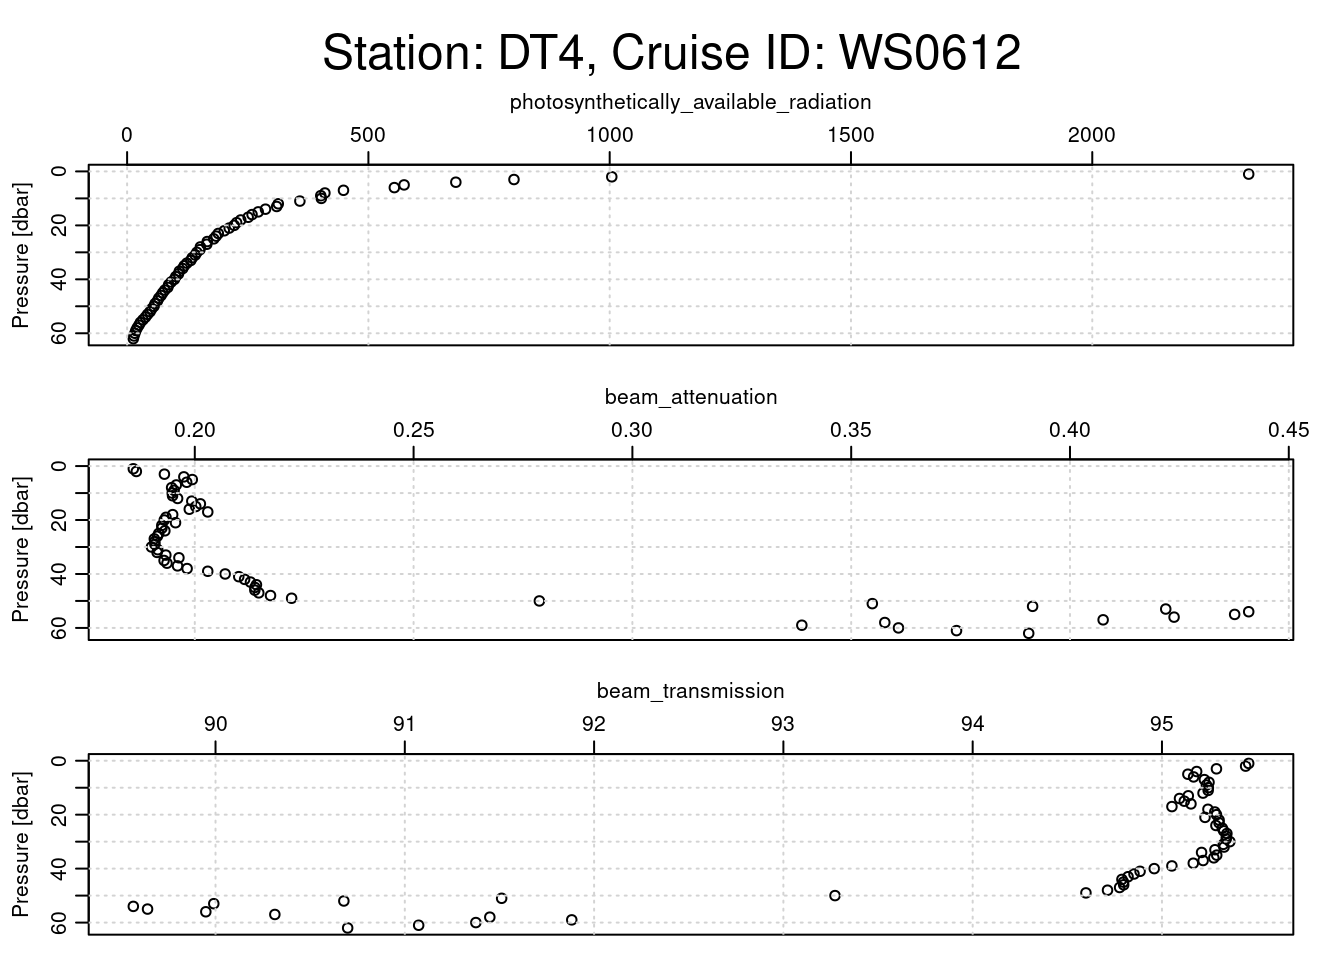
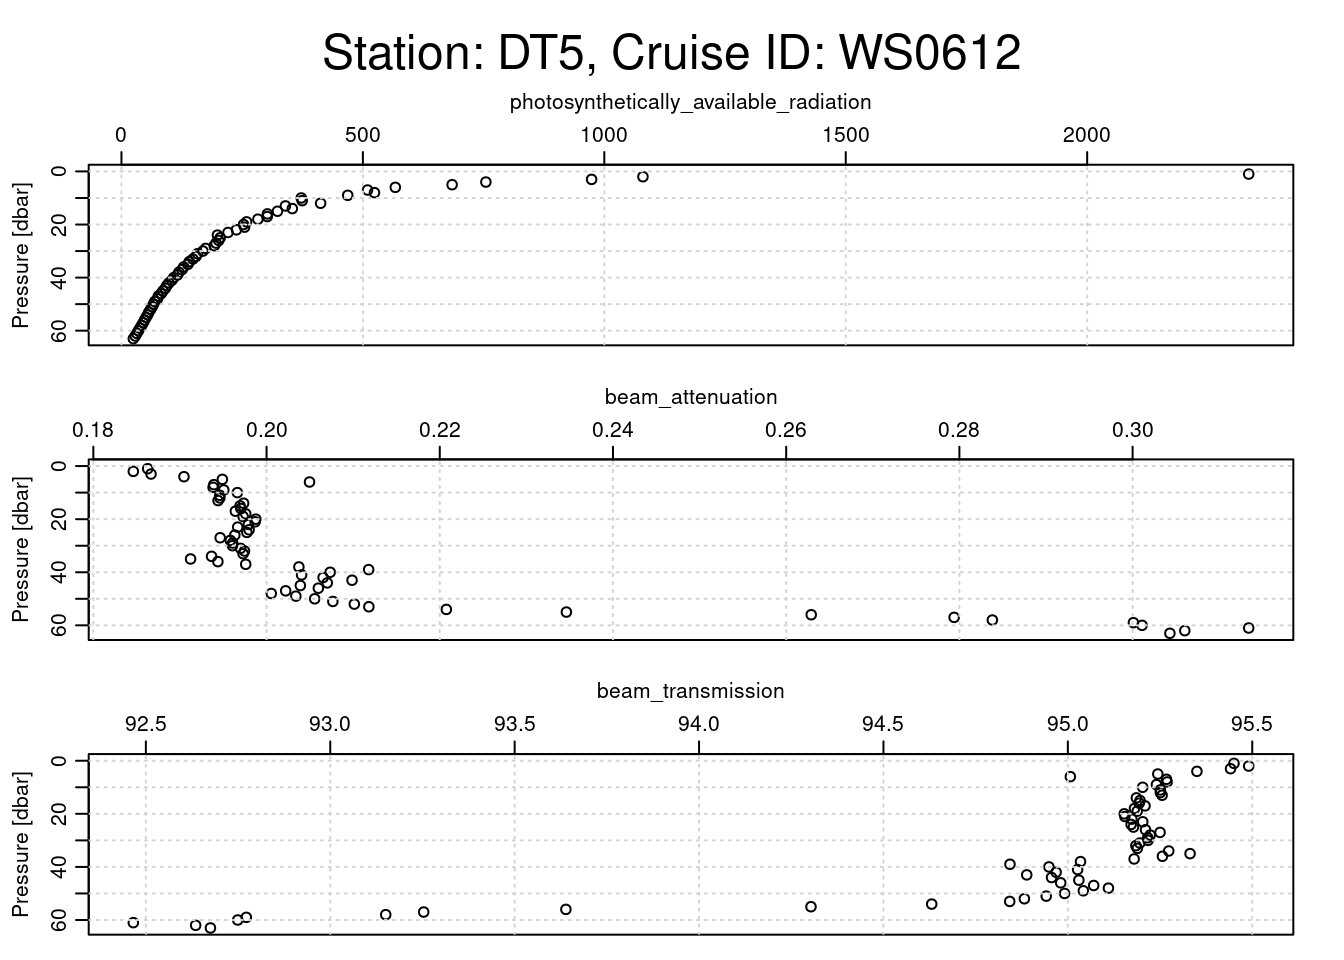
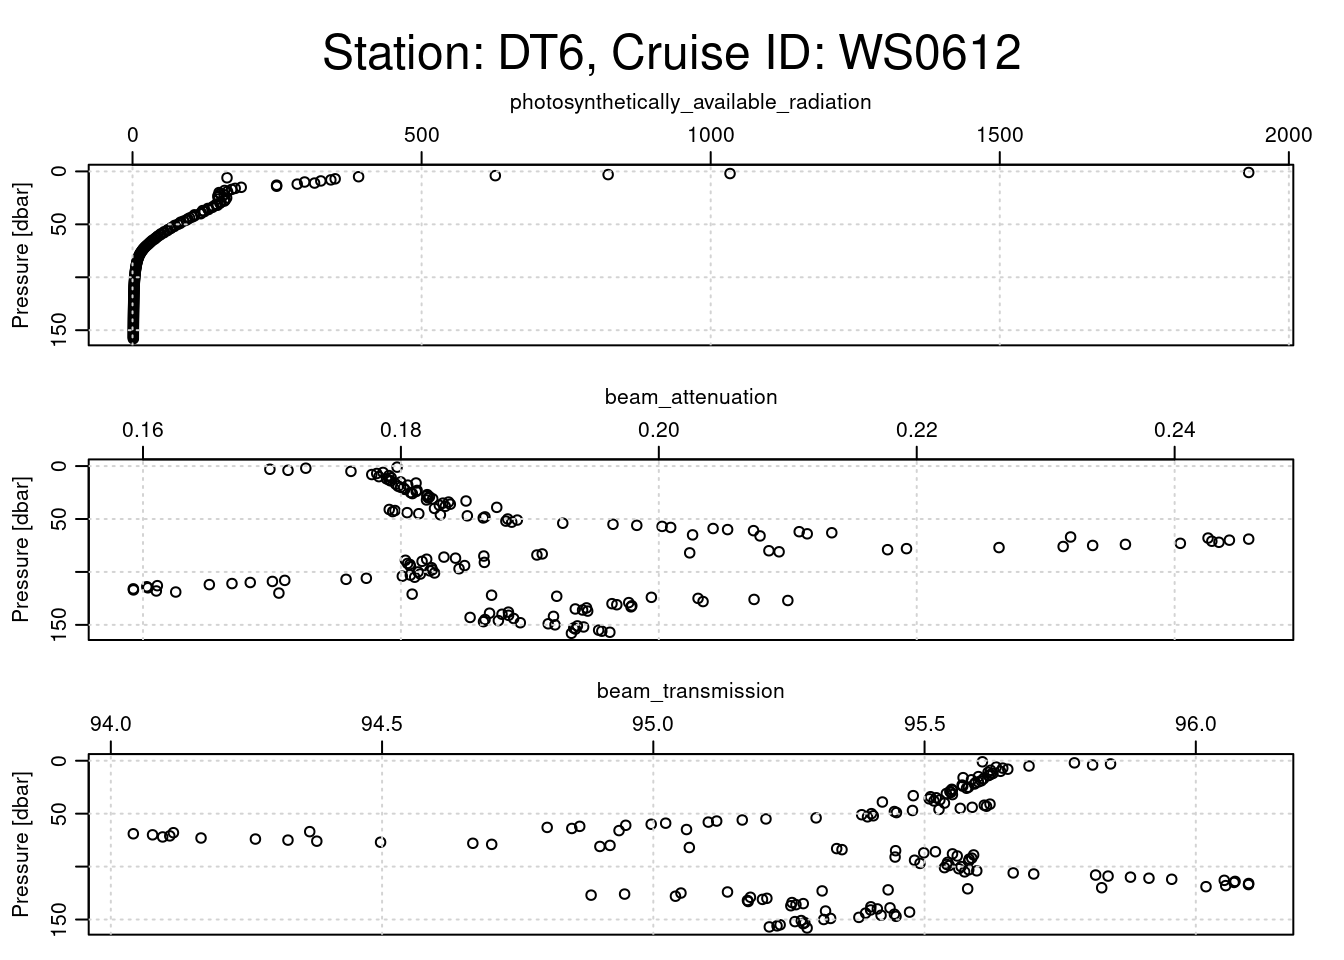
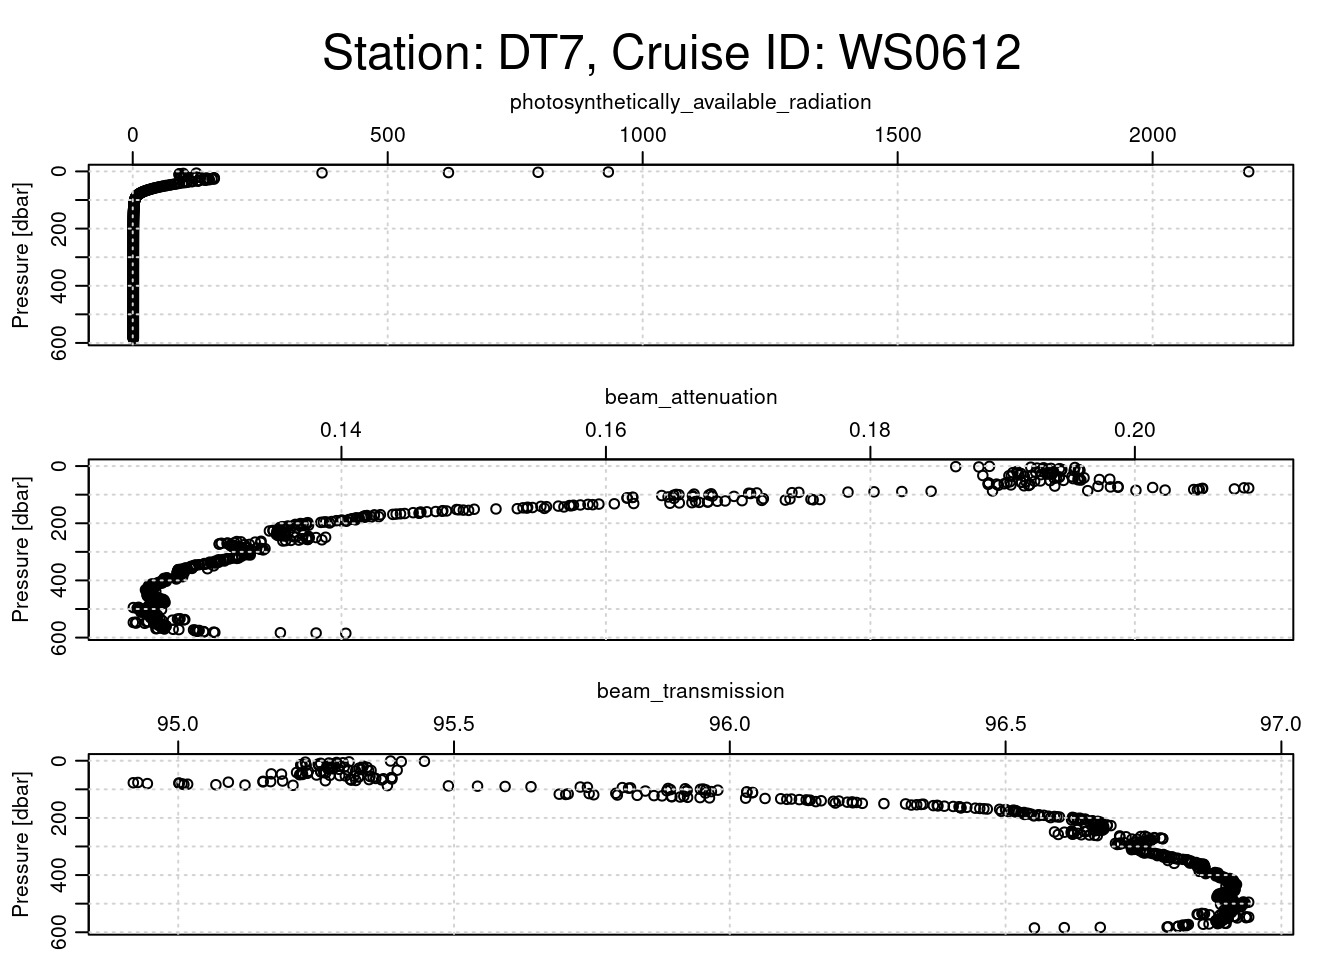
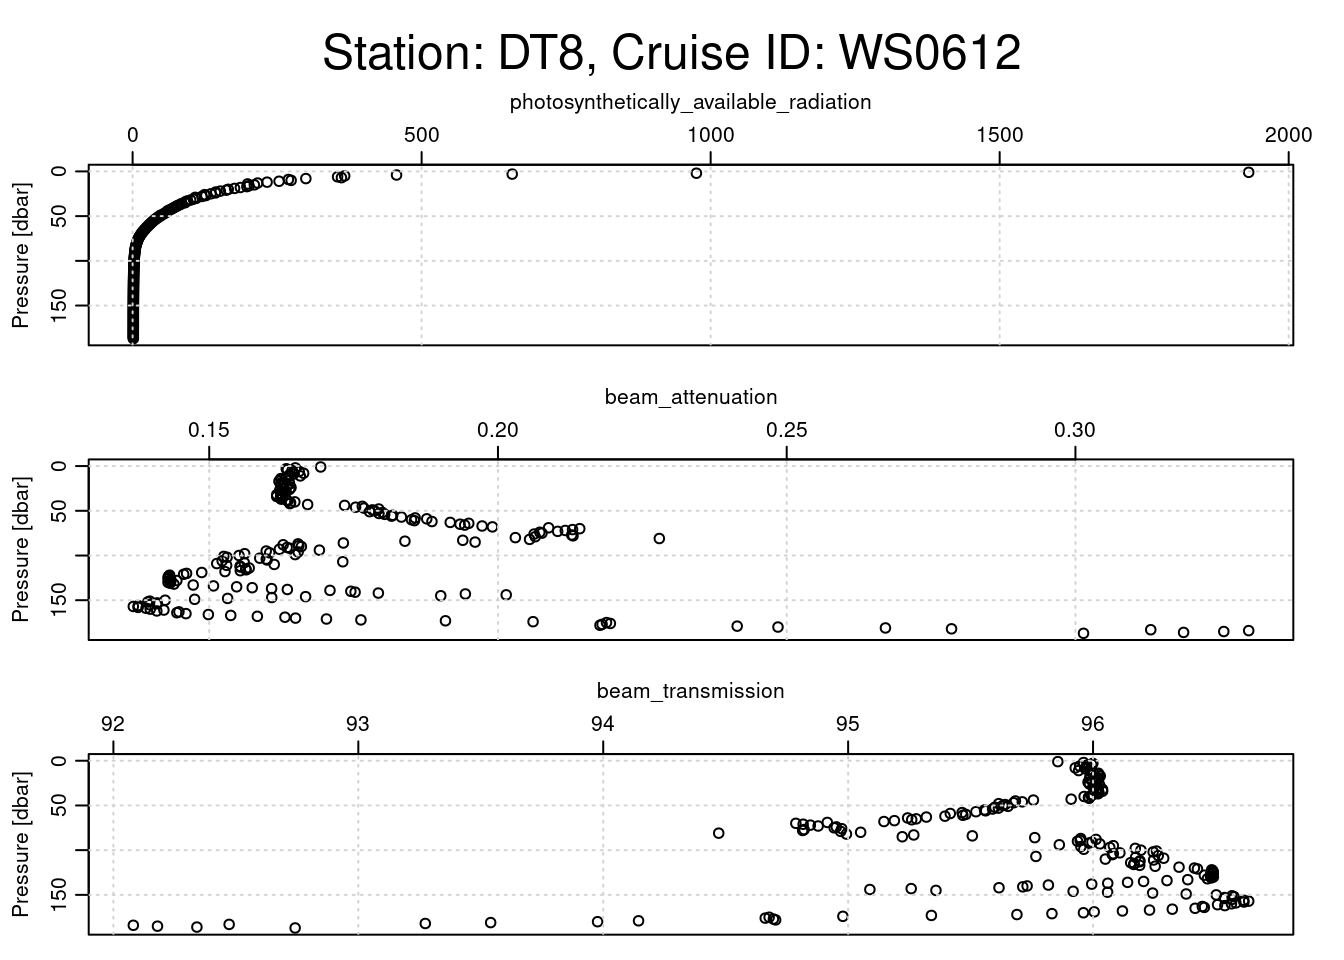
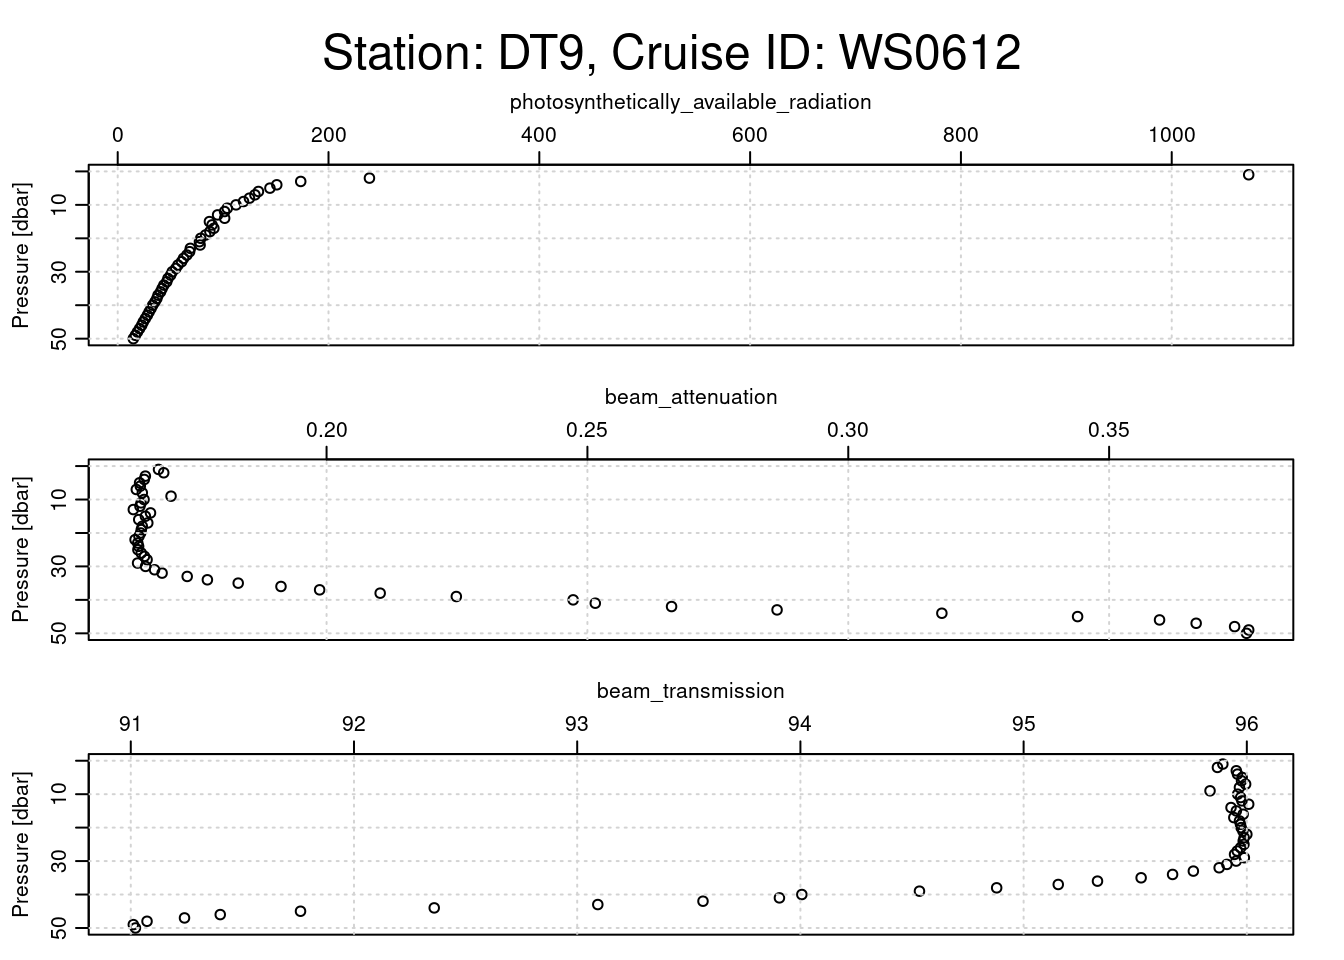
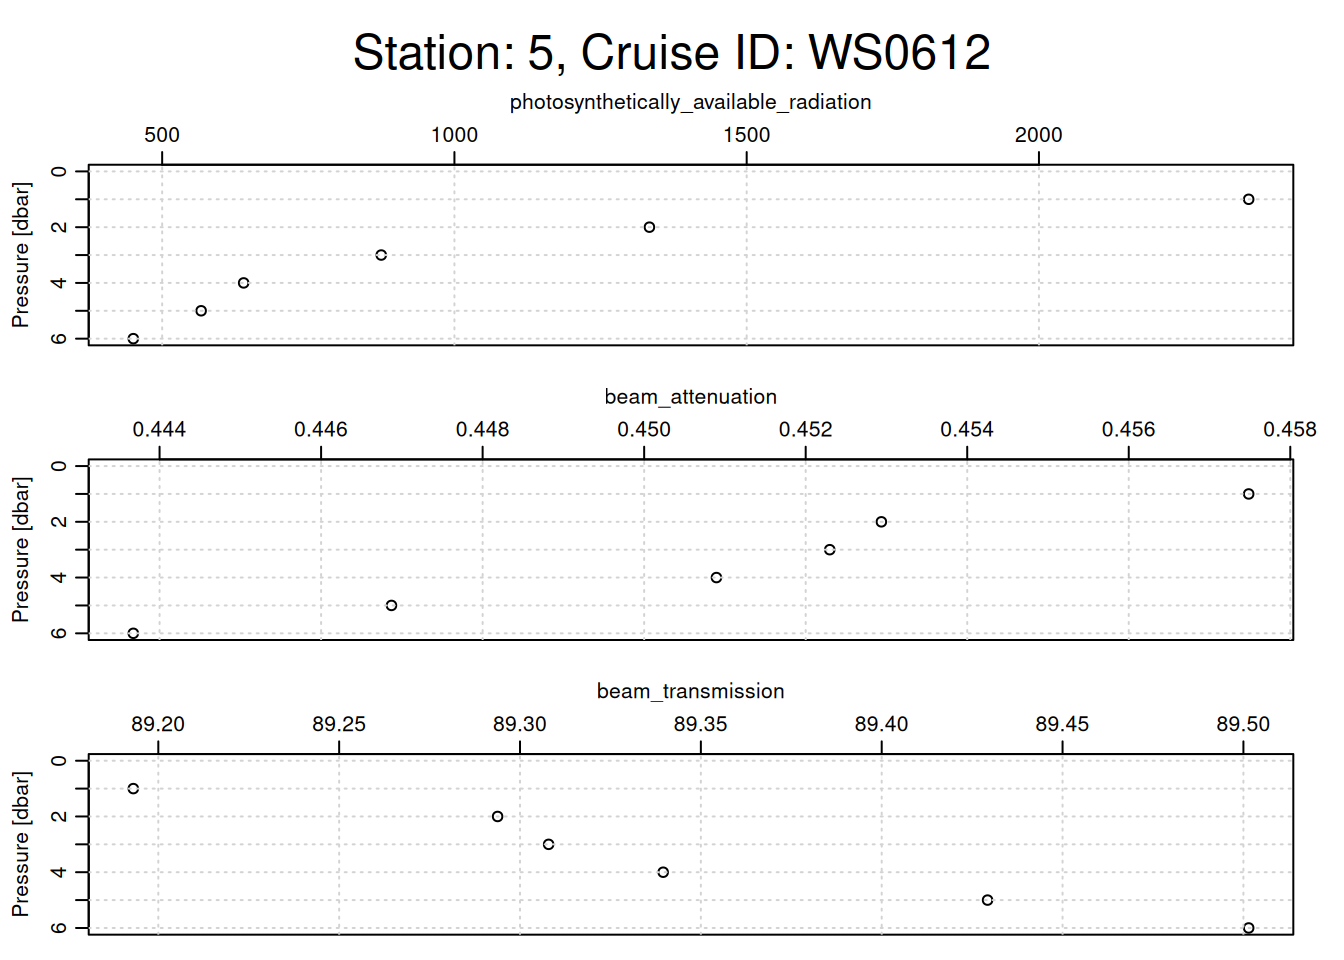
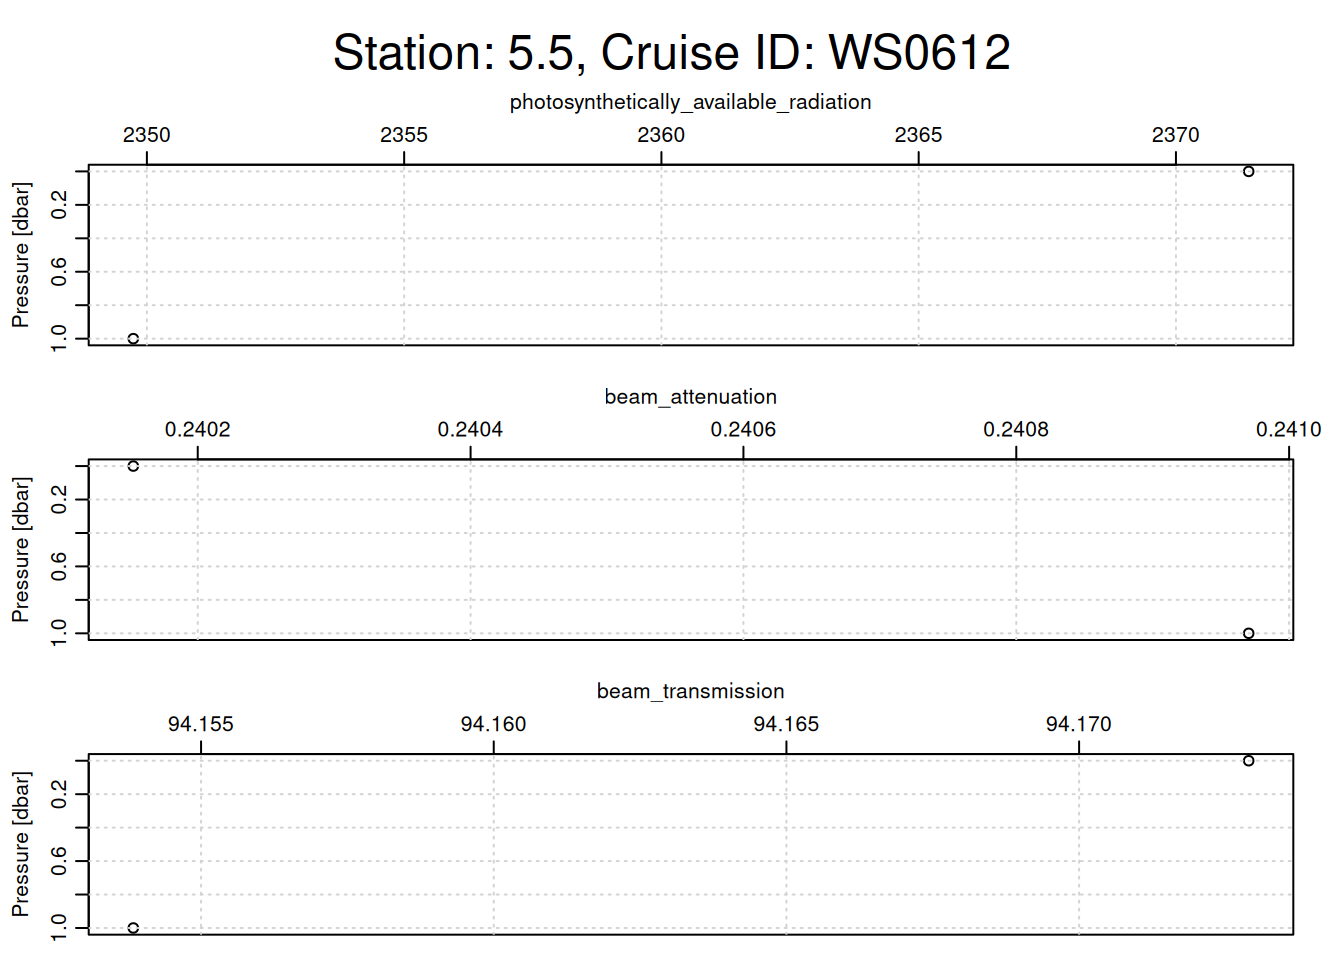
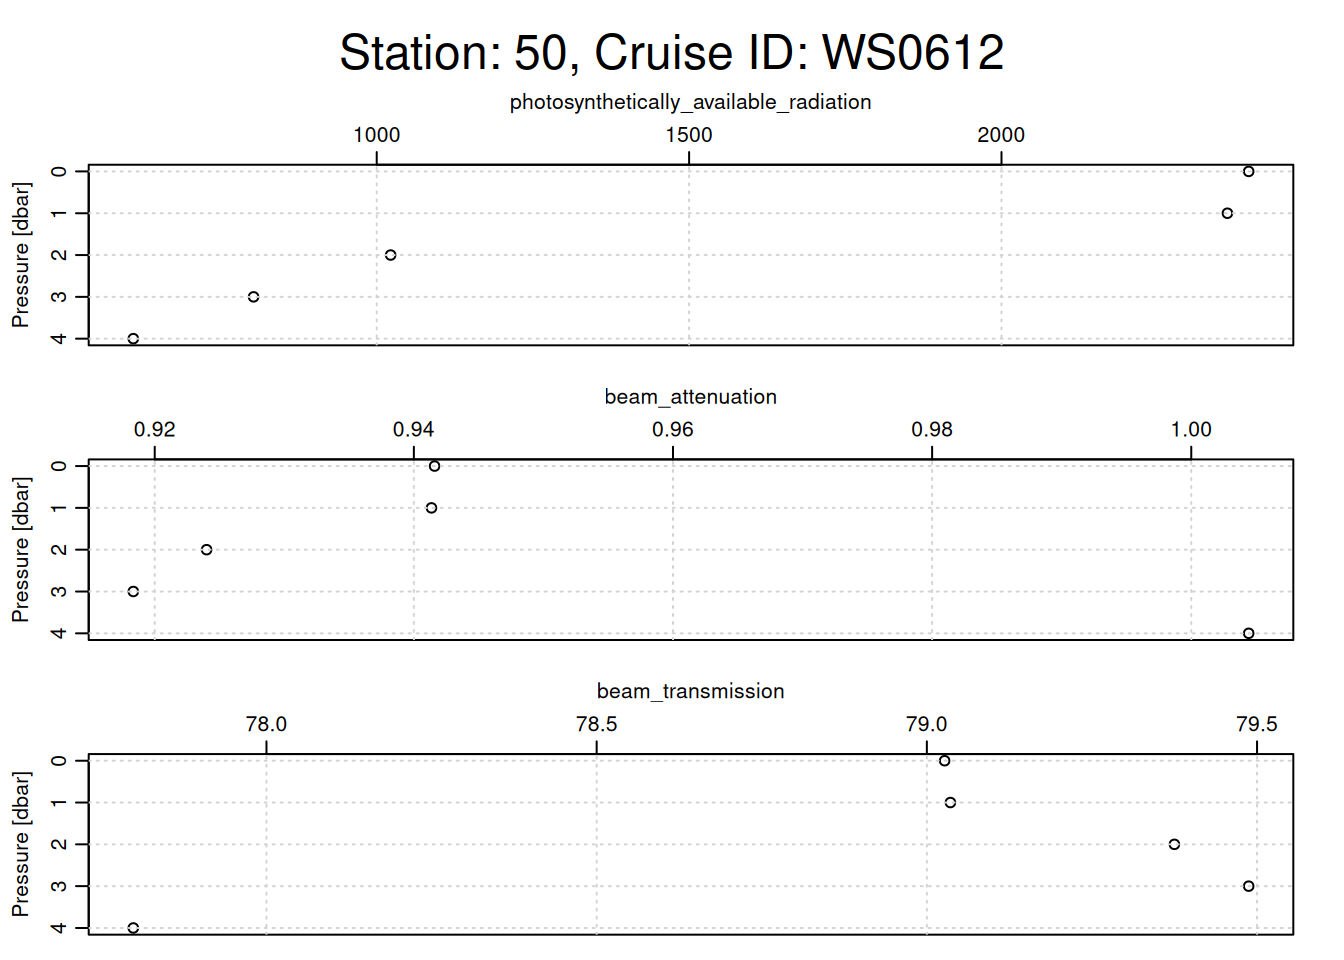
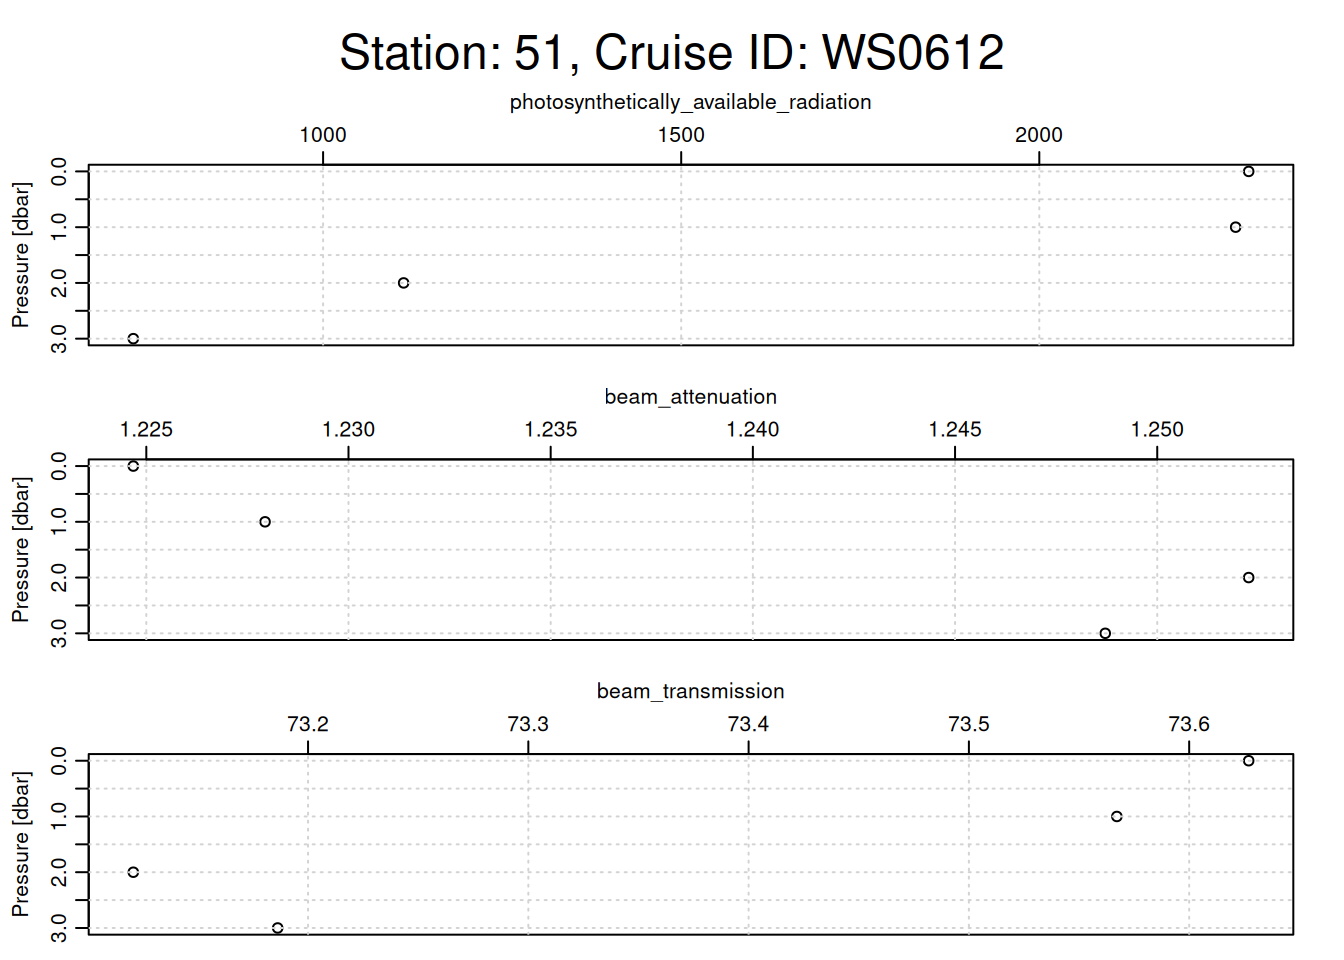
plotting other optical parameters for each cast
# Loop through each CTD castfor (i inseq(ctd_FK)){ cast <- ctd_FK[[i]] # Assuming each sublist contains only one relevant CTD objecttryCatch({# Extract metadata for station name and cruise ID station_name <- cast@metadata$station[1] cruise_id <- cast@data$cruise_id[1]# Generate a title with station name and cruise ID overall_title <- glue::glue("Station: {station_name}, Cruise ID: {cruise_id}")# Set margins: increase the outer margin for the titlepar(oma =c(0, 0, 3, 0)) # Top outer margin increased for title# Plotting function with specific parameters oce::plot(x =ctdDecimate(ctdTrim(cast)),which =c("photosynthetically_available_radiation","beam_attenuation","beam_transmission" ),main =""# No main title for individual subplots )# Place a single overall title at the top of the plot framemtext(overall_title, side =3, line =1, outer =TRUE, cex =1.5)# Reset outer margins to defaultpar(oma =c(0, 0, 0, 0)) }, error =function(e) {print(e$message) # Print any errors that occur during plotting })}
[1] "need finite 'xlim' values"
[1] "need finite 'xlim' values"
[1] "need finite 'xlim' values"
loop through every cast, clean, & save
combined_df <-data.frame()for (i inseq(ctd_FK)){tryCatch({ cast <- ctd_FK[[i]] # 1 is selecting only the first sublist# print(class(cast))# clean cast trimmed_cast <-ctdTrim(cast) decimated_cast <-ctdDecimate(trimmed_cast, p =0.5) # binned to 0.5 m# convert to df cast_df <-as.data.frame(decimated_cast@data)# Add metadata# assumes station ID and cruise ID the same for all & just uses 1st one cast_df <-mutate( cast_df,station = cast@data$station[1],cruise_id = cast@data$cruise_id[1] )# drop NA rows left by cleaning cast_df <-subset(cast_df, !is.na(scan))# Append the data to the combined dataframe combined_df <-rbind(combined_df, cast_df) }, error =function(e){print(glue("error in cast {cast@metadata$station[1]}"))print(e) })}# Save to CSVfile_path <-here(glue("data/cleaned/{cruise_id}.csv"))write.csv(combined_df, file_path, row.names =FALSE)