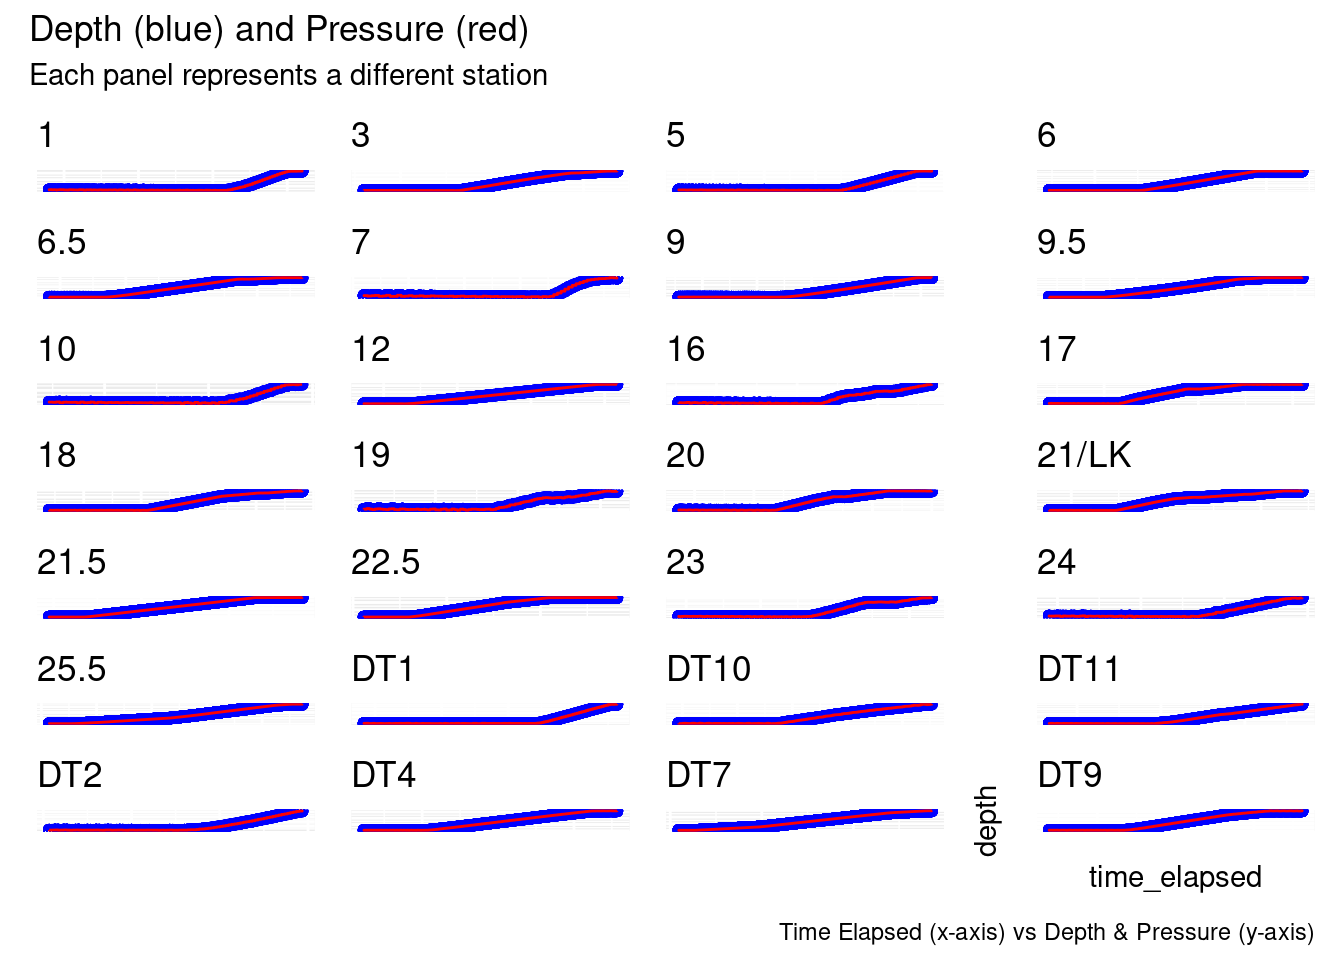
tryCatch({ plots <-list()for (station_name inunique(cruise_df$station)) { subset_df <-filter(cruise_df, station == station_name) plots[[station_name]] <-ggplot(subset_df, aes(x = time_elapsed)) +geom_point(aes(y = depth), color ="blue") +# Plot depth in bluegeom_line(aes(y = sea_water_pressure), color ="red") +# Plot sea water pressure in redggtitle(glue("{station_name}")) +theme(axis.title.x =element_blank(),axis.title.y =element_blank(),axis.text.x =element_blank(),axis.text.y =element_blank(),axis.ticks.x =element_blank(),axis.ticks.y =element_blank() ) # Remove individual axis titles and text }# drop nulls plots <- purrr::compact(plots)# Combine all plots into a grid combined_plot <-wrap_plots(plots) +plot_layout(ncol =4) +# Adjust ncol to set number of columns in the gridplot_annotation(title ="Depth (blue) and Pressure (red)",subtitle ="Each panel represents a different station",caption ="Time Elapsed (x-axis) vs Depth & Pressure (y-axis)" ) +theme(plot.tag =element_text(size =12, face ="bold"),plot.tag.position ="topleft",axis.title.x =element_text(margin =margin(t =10)),axis.title.y =element_text(margin =margin(r =10)) )print(combined_plot)}, error =function(er){print(er)});
`geom_line()`: Each group consists of only one observation.
ℹ Do you need to adjust the group aesthetic?
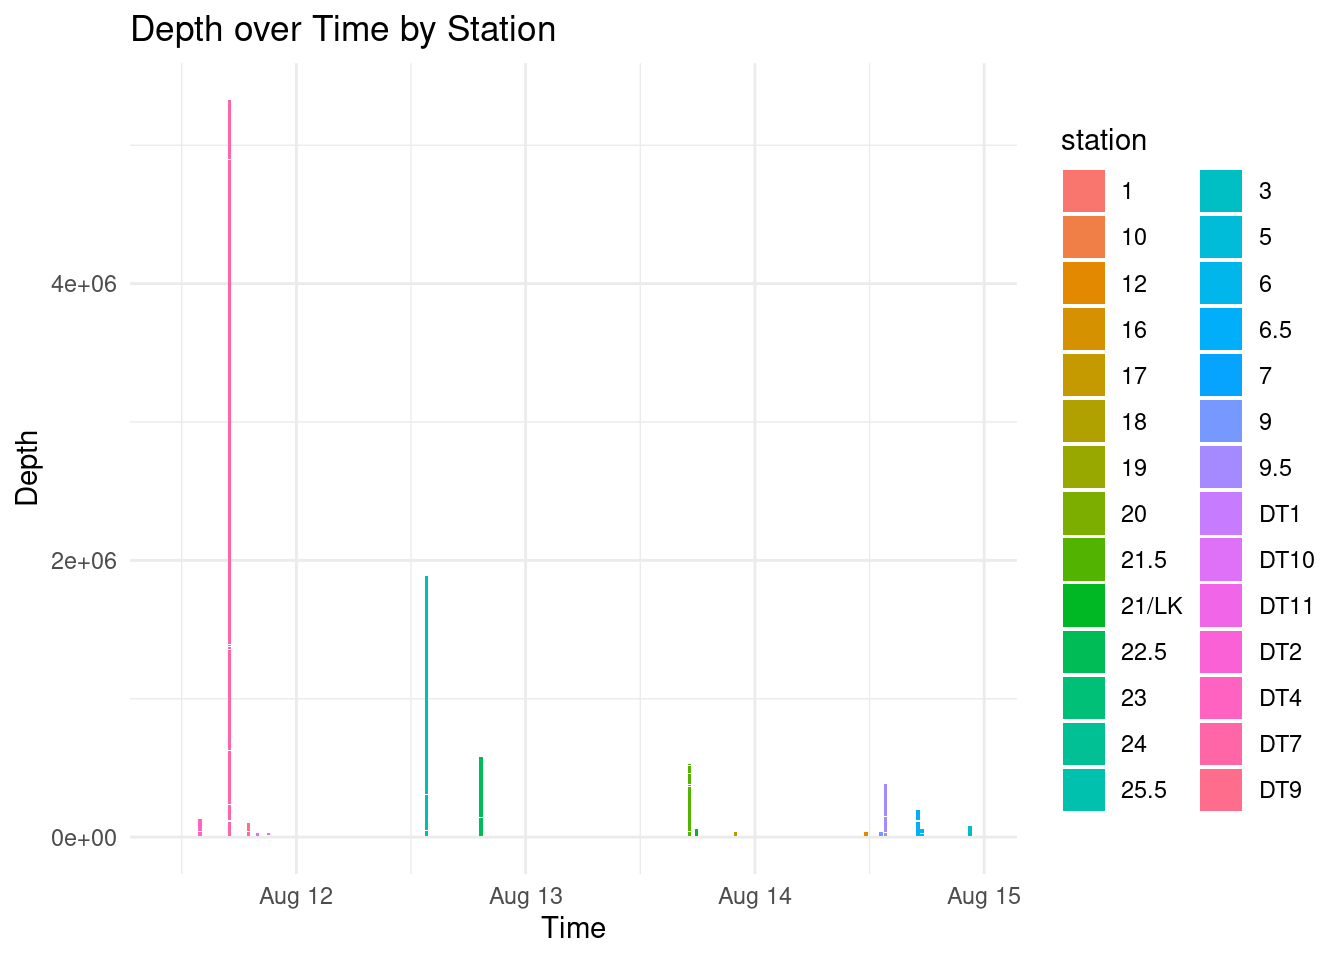
plot across all stations
p <-ggplot(cruise_df, aes(x = time, y = depth, fill = station)) +geom_col() +# This creates the bars# geom_text(aes(label = station), vjust = -0.3) + # This adds labels to each bar, adjust vjust for positionlabs(x ="Time", y ="Depth", title ="Depth over Time by Station") +# Set labels and titletheme_minimal() # Use a minimal themeprint(p)
create oce.ctd objects from dataframes
ctd_load <-function(data, other_params =NULL) {# create csv into ctd object test_ctd <-as.ctd(salinity = data$sea_water_salinity,temperature = data$sea_water_temperature,pressure = data$sea_water_pressure,station = data$station )# add additional columns to ctd objectif (!is.null(other_params)) {for (param_name in other_params) { test_ctd <-oceSetData(object = test_ctd,name = param_name,value = data[[param_name]] ) } }print(glue("{data$station[1]}:\t{length(test_ctd@data$scan)} scans"))return(test_ctd)}# Define other parameters to addother_params <-c("cruise_id", "station", "time", "time_elapsed", "latitude", "longitude", "sea_water_electrical_conductivity", "CDOM", "dissolved_oxygen","oxygen_saturation", "chlorophyll_concentration", "chlorophyll_fluorescence", "photosynthetically_available_radiation", "beam_attenuation","beam_transmission", "depth", "sea_water_sigma_t","descent_rate", "sound_velocity","altimeter")# Split data by station and create data listctd_FK <- cruise_df %>%split(.$station) %>%map(~ctd_load(.x, other_params = other_params)) # ~ is a lambda(x)
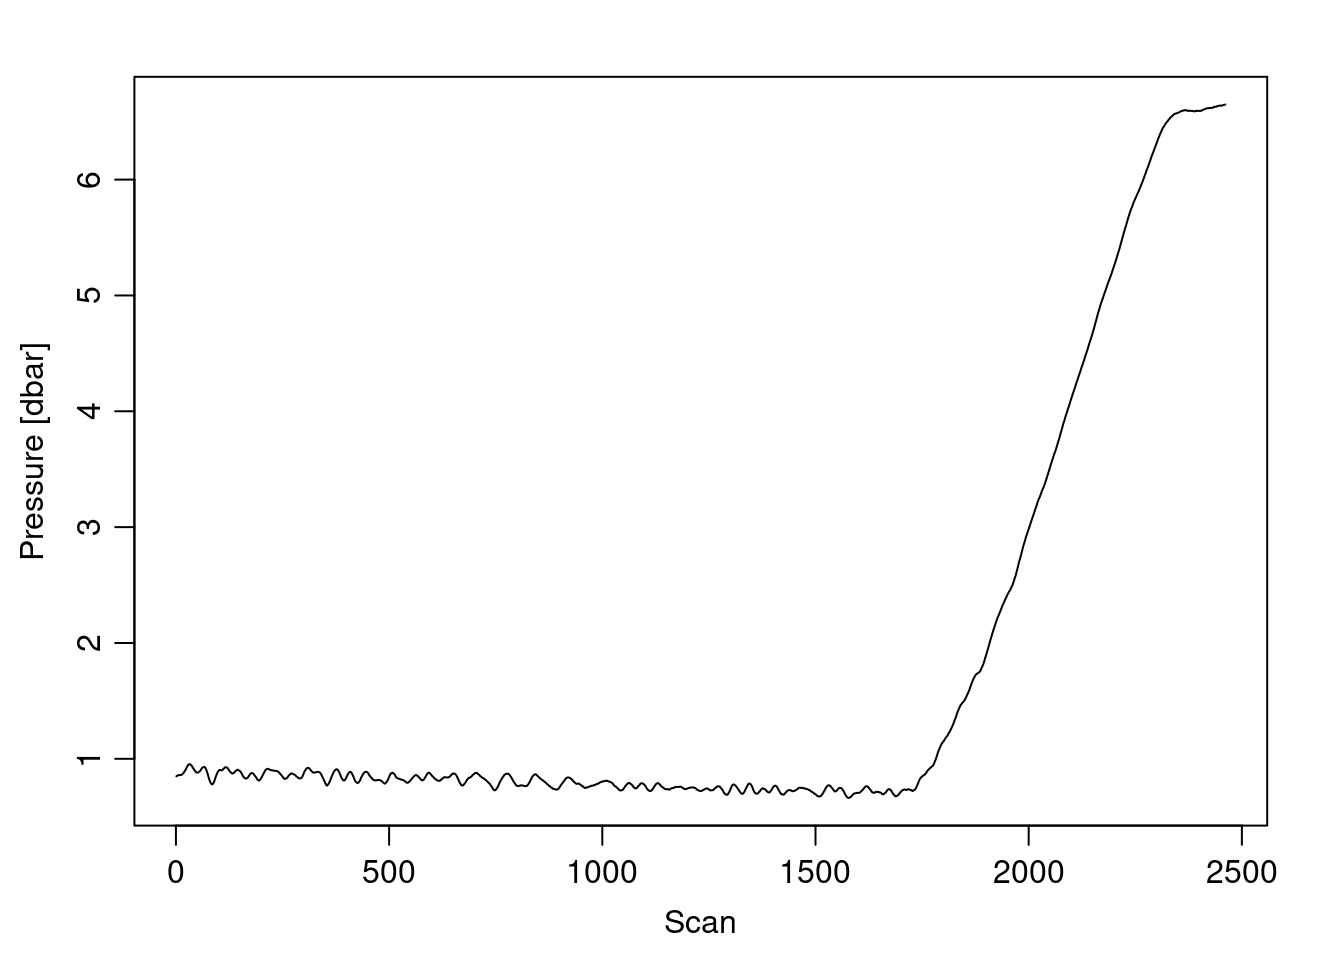
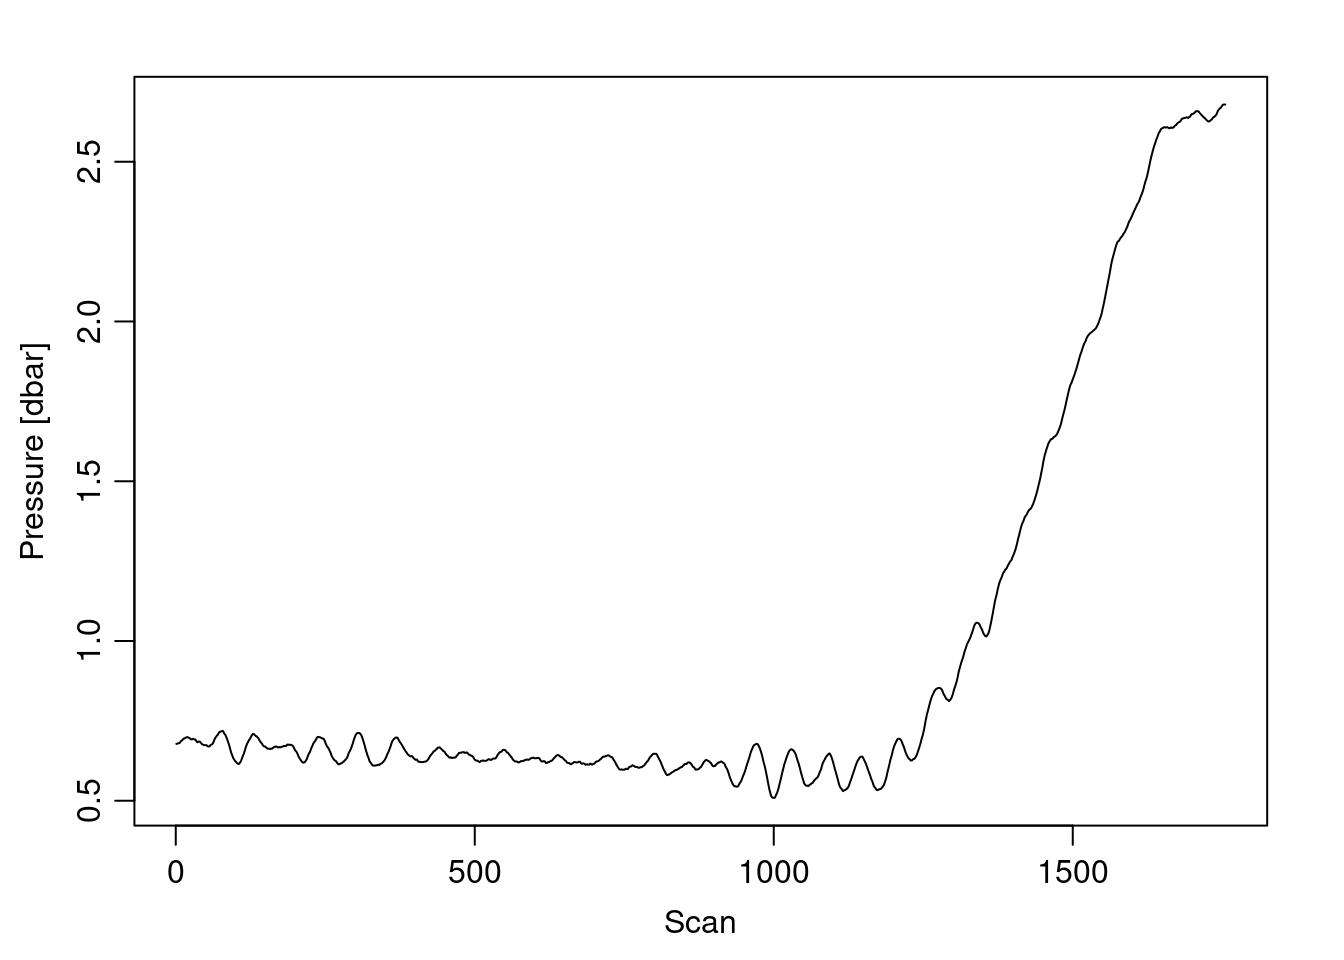
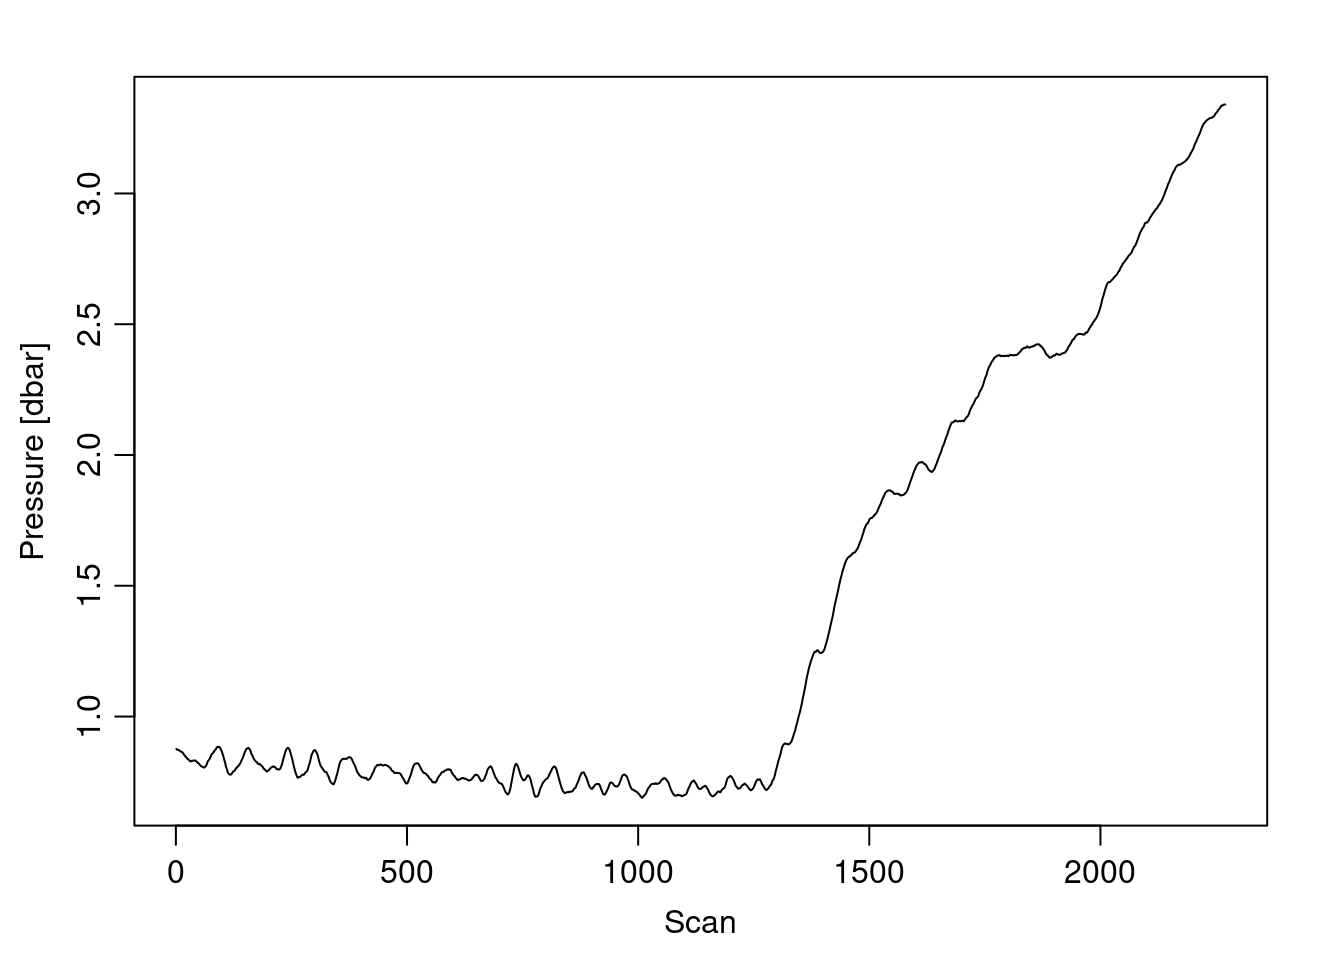
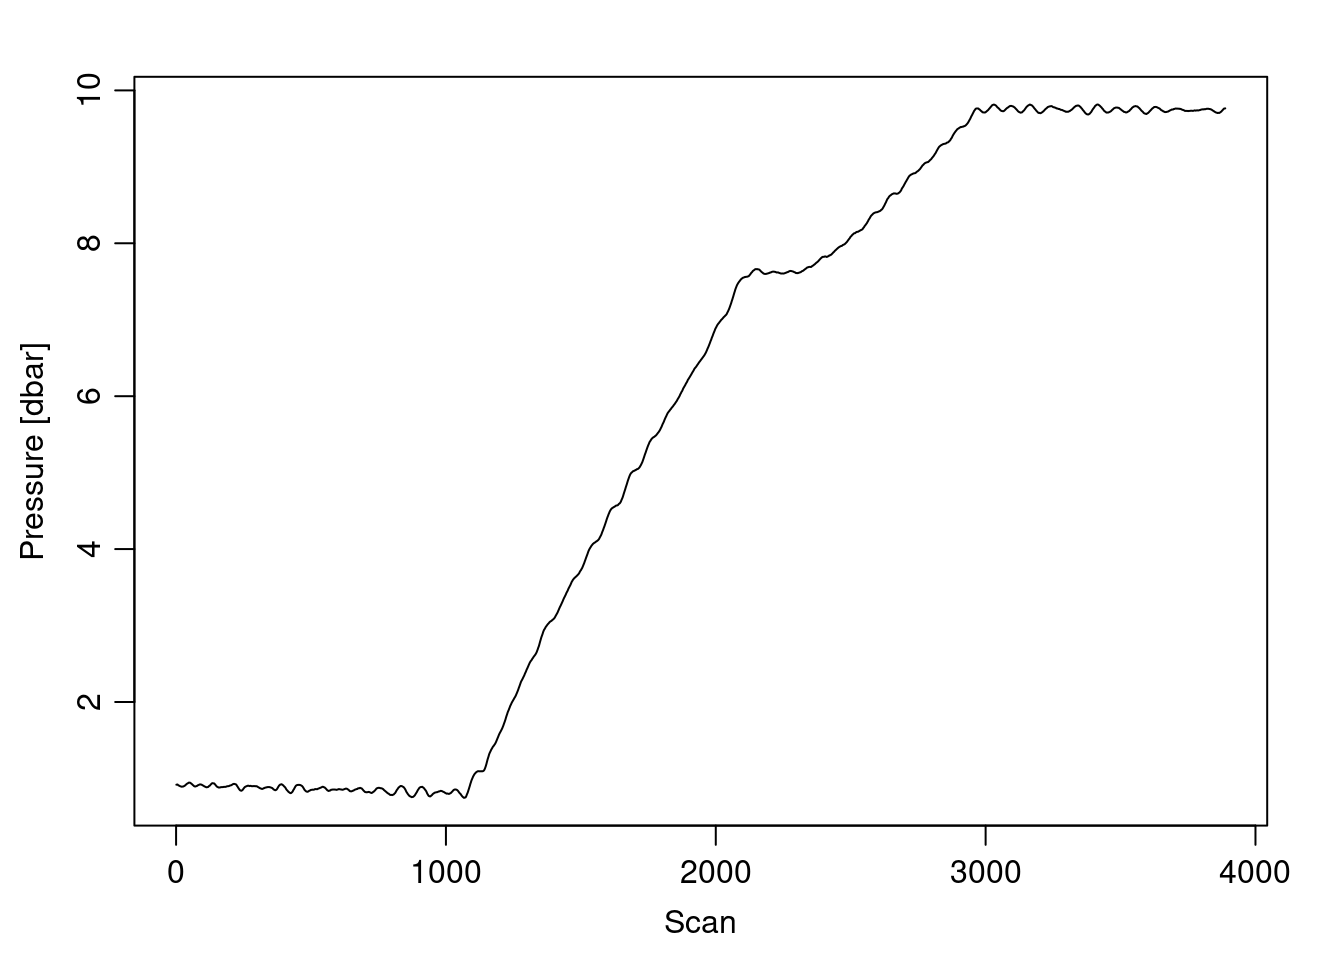
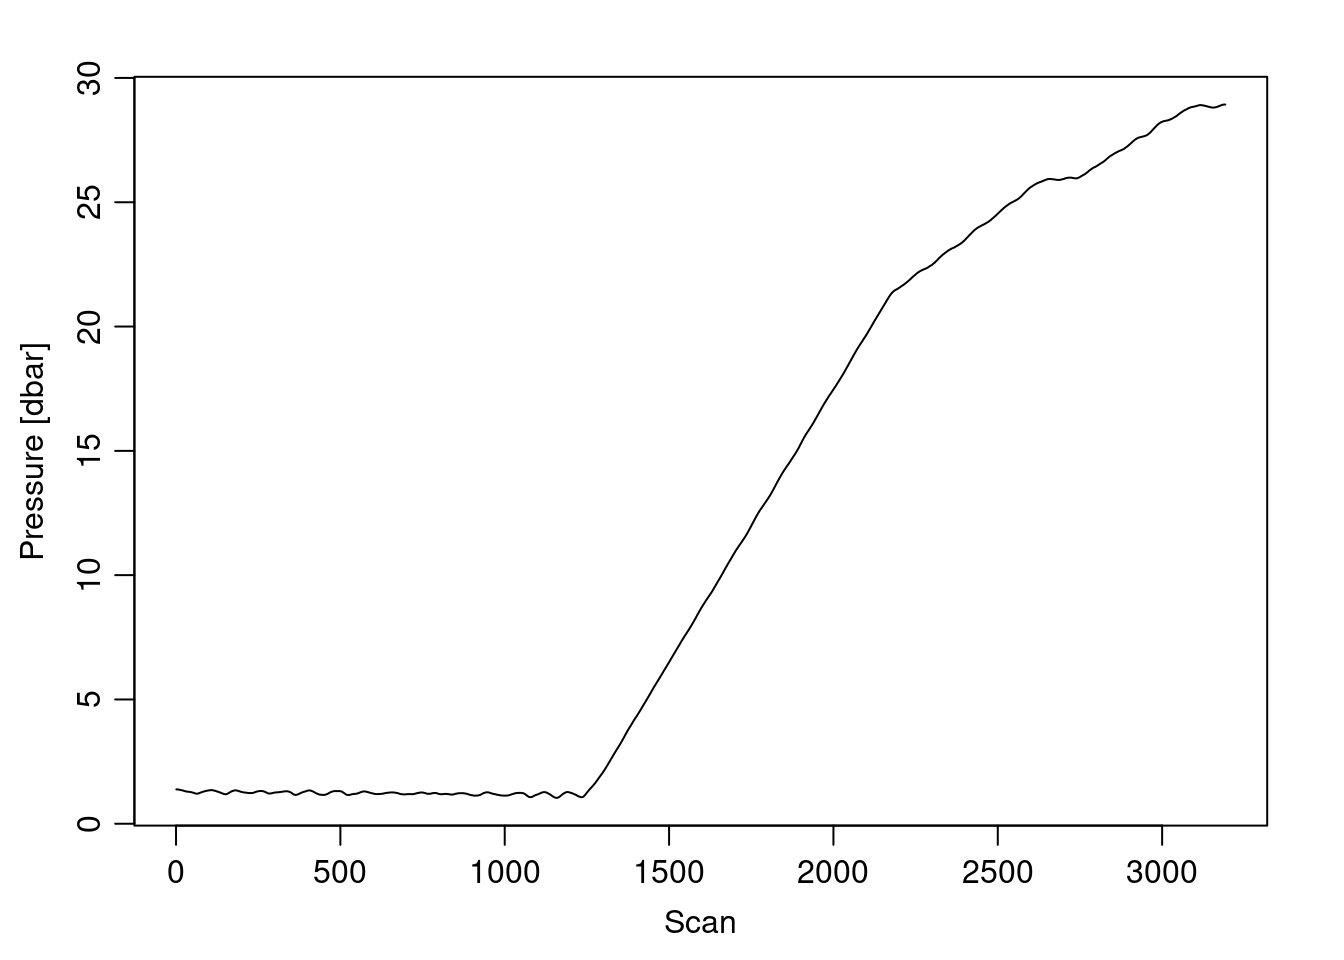
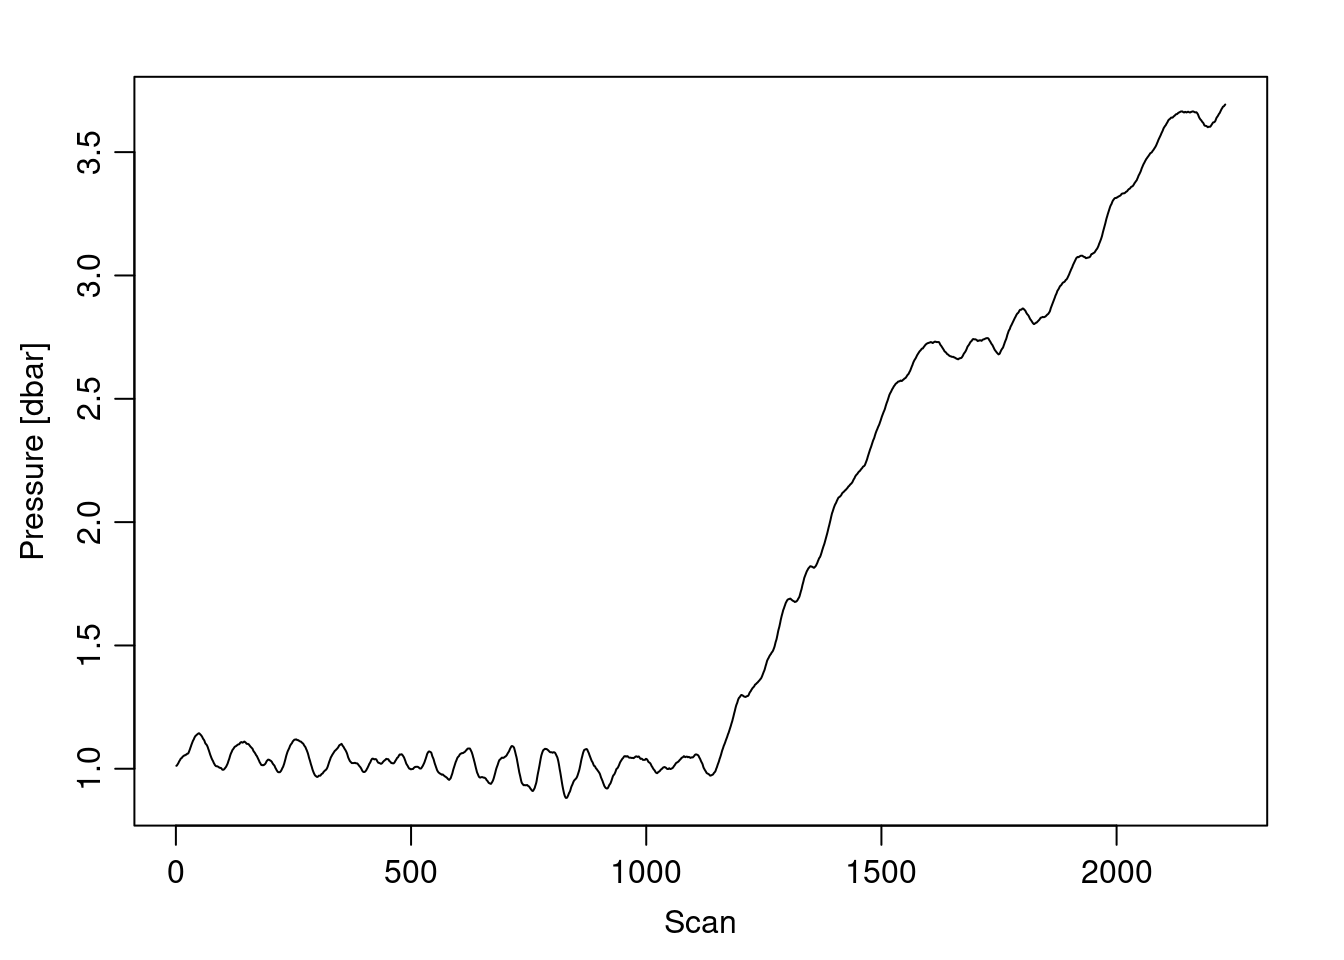
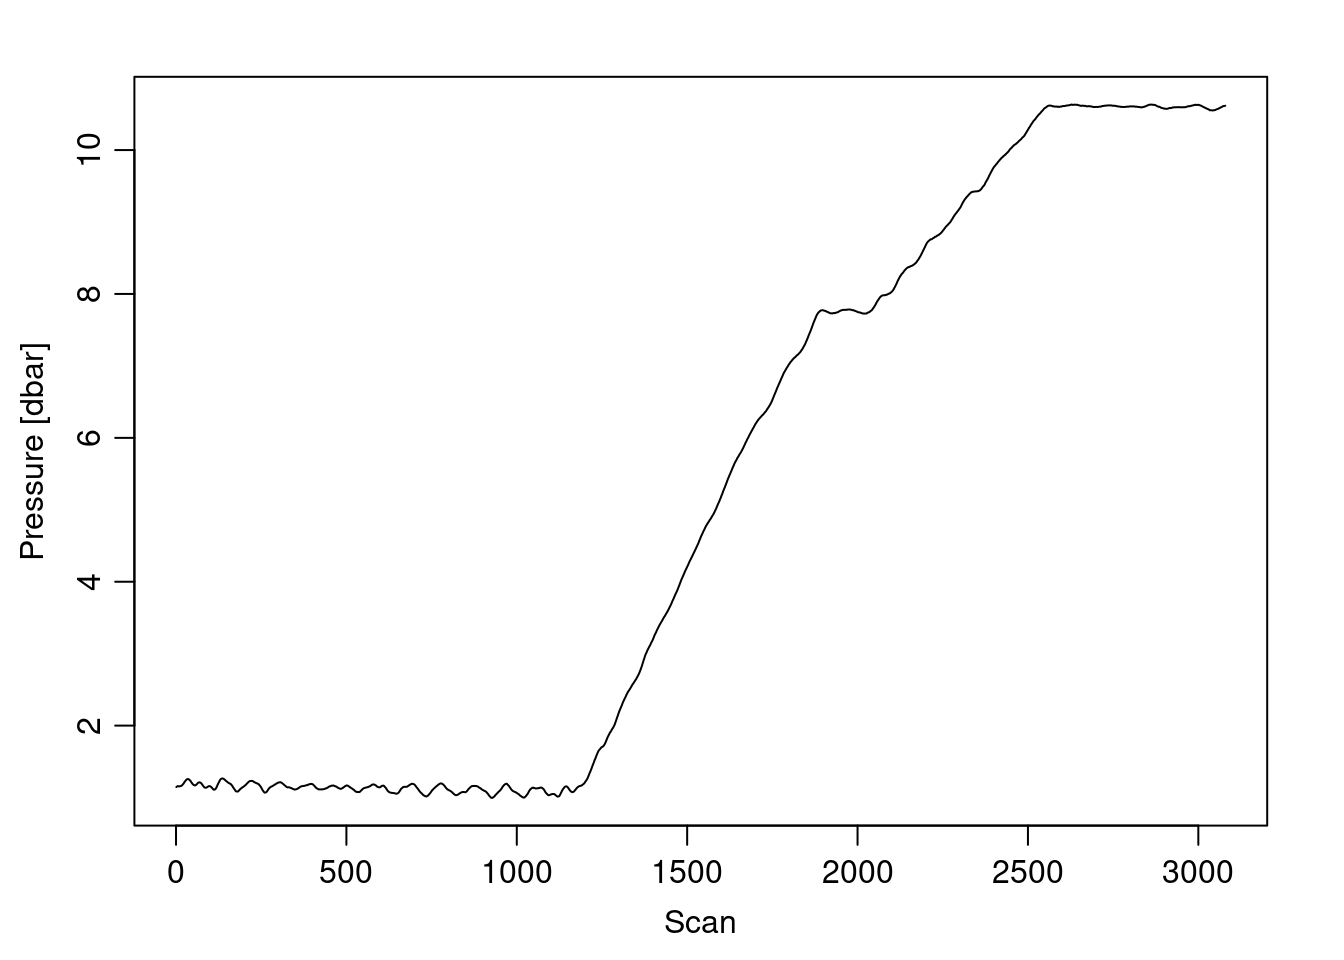
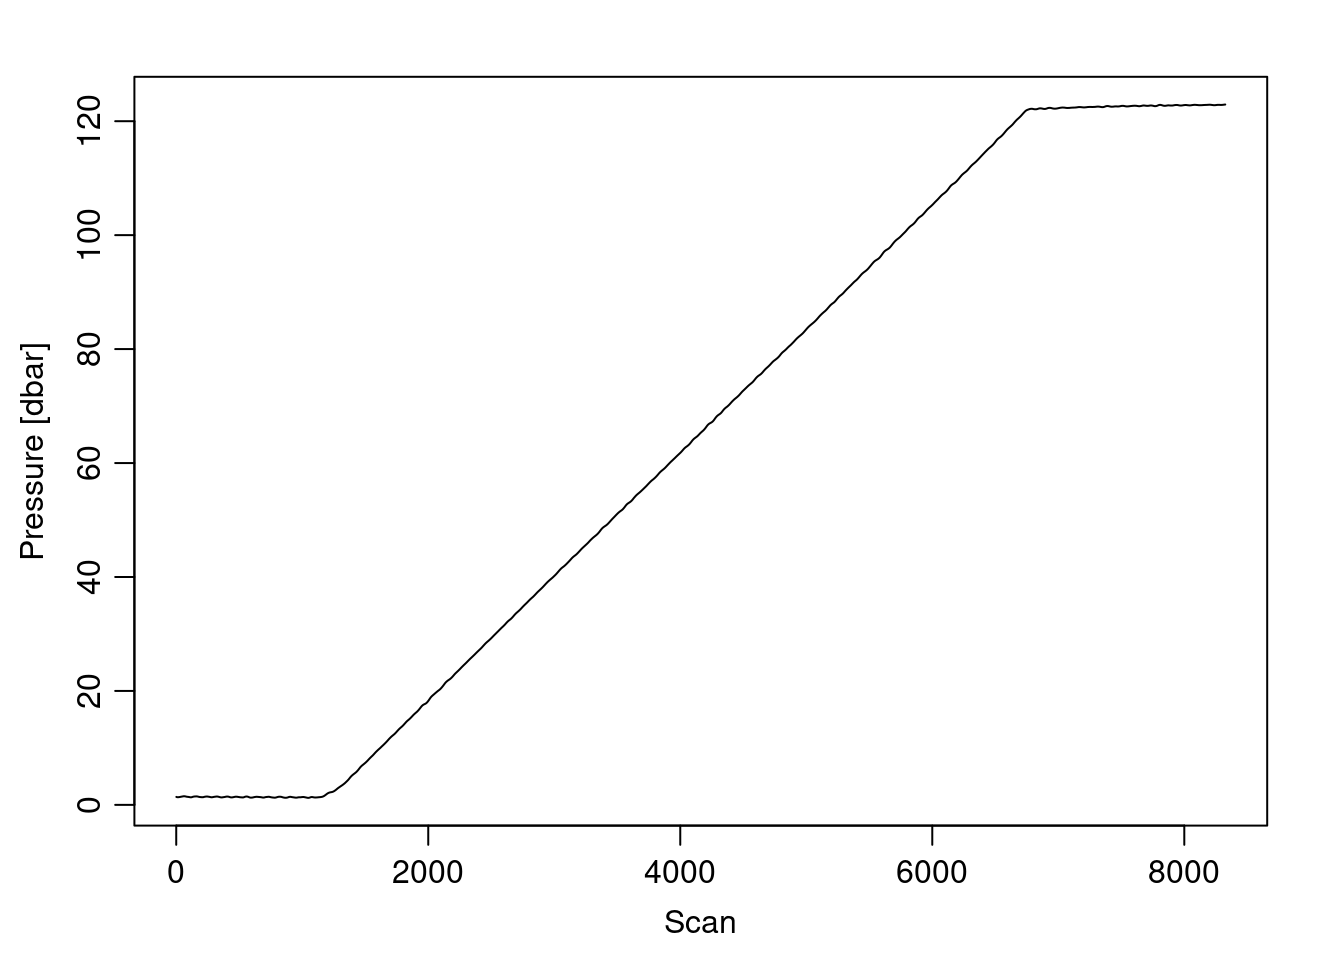
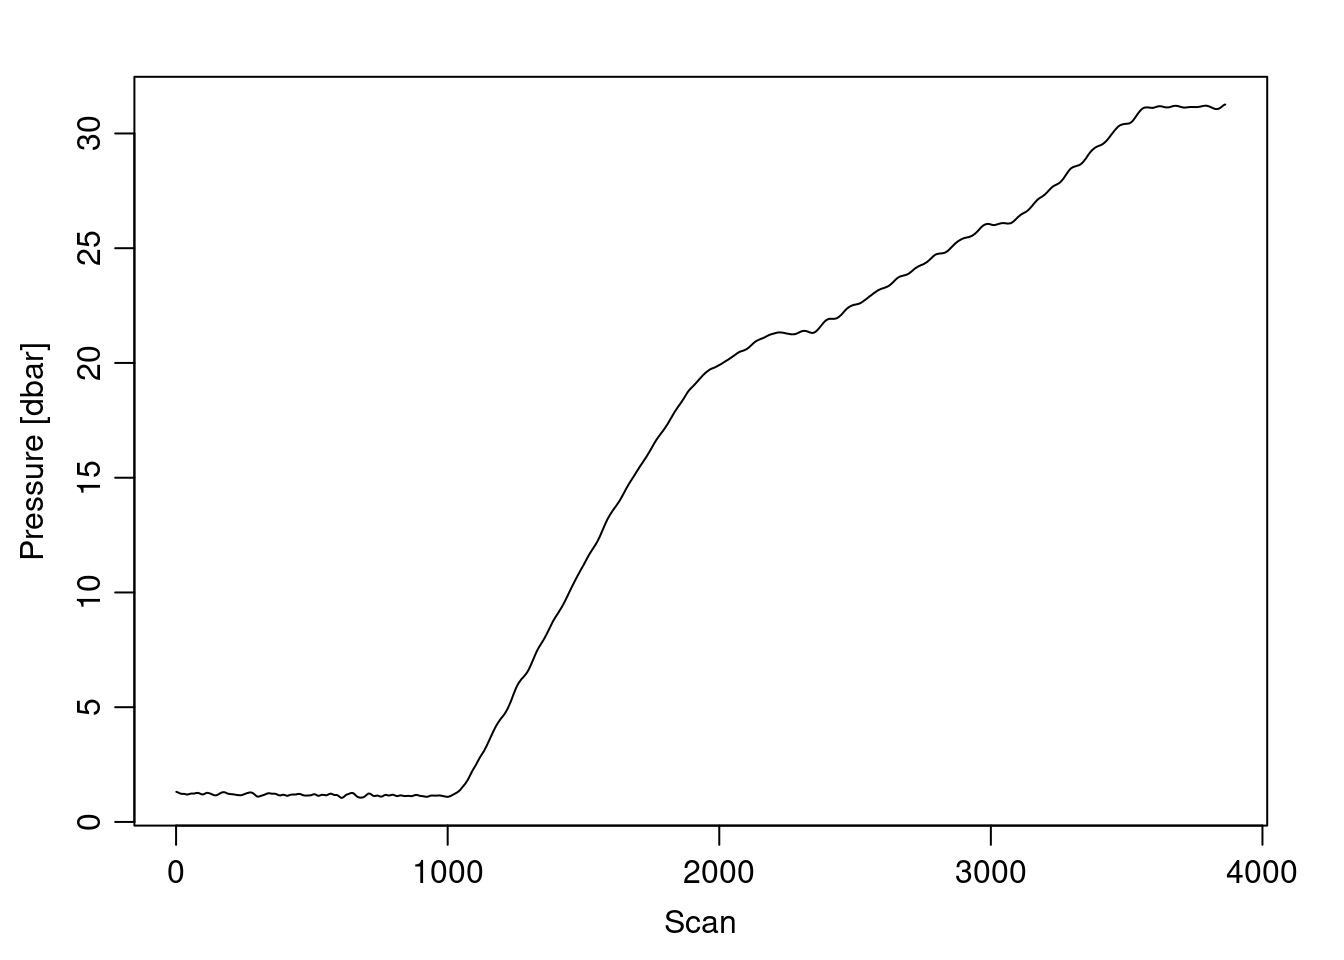
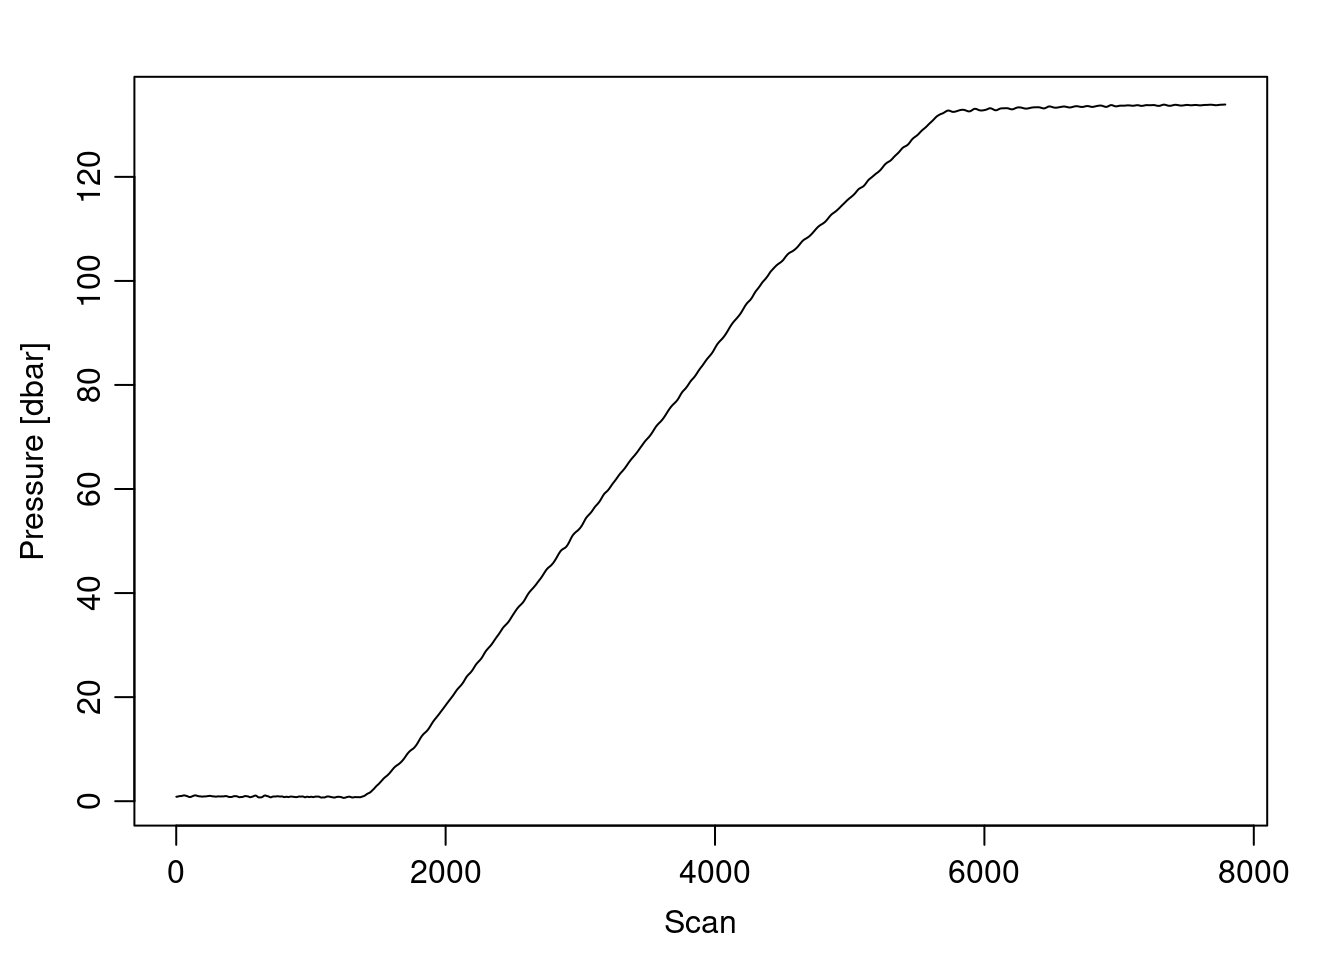
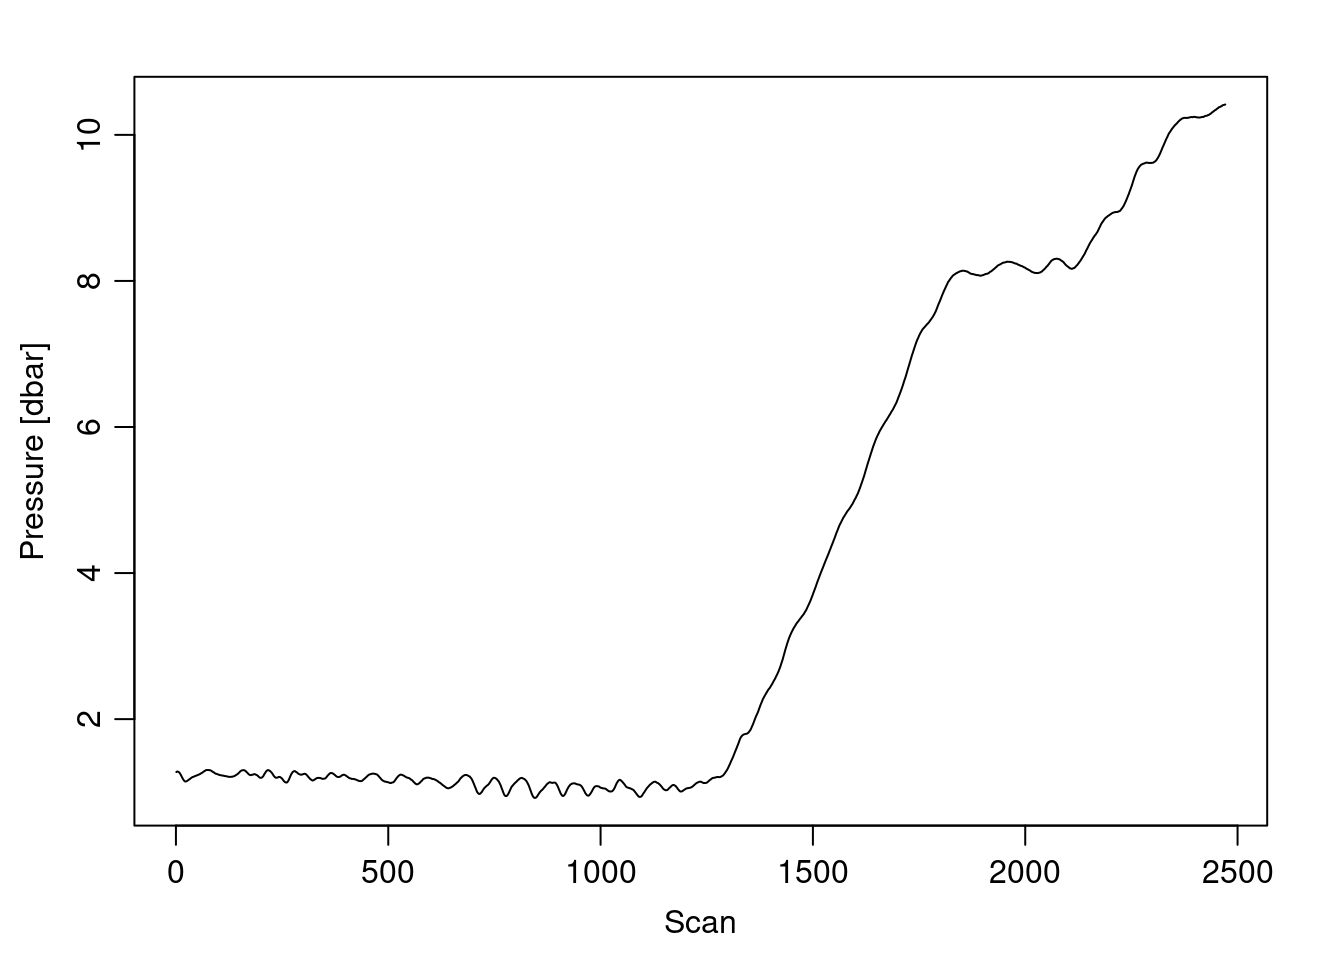
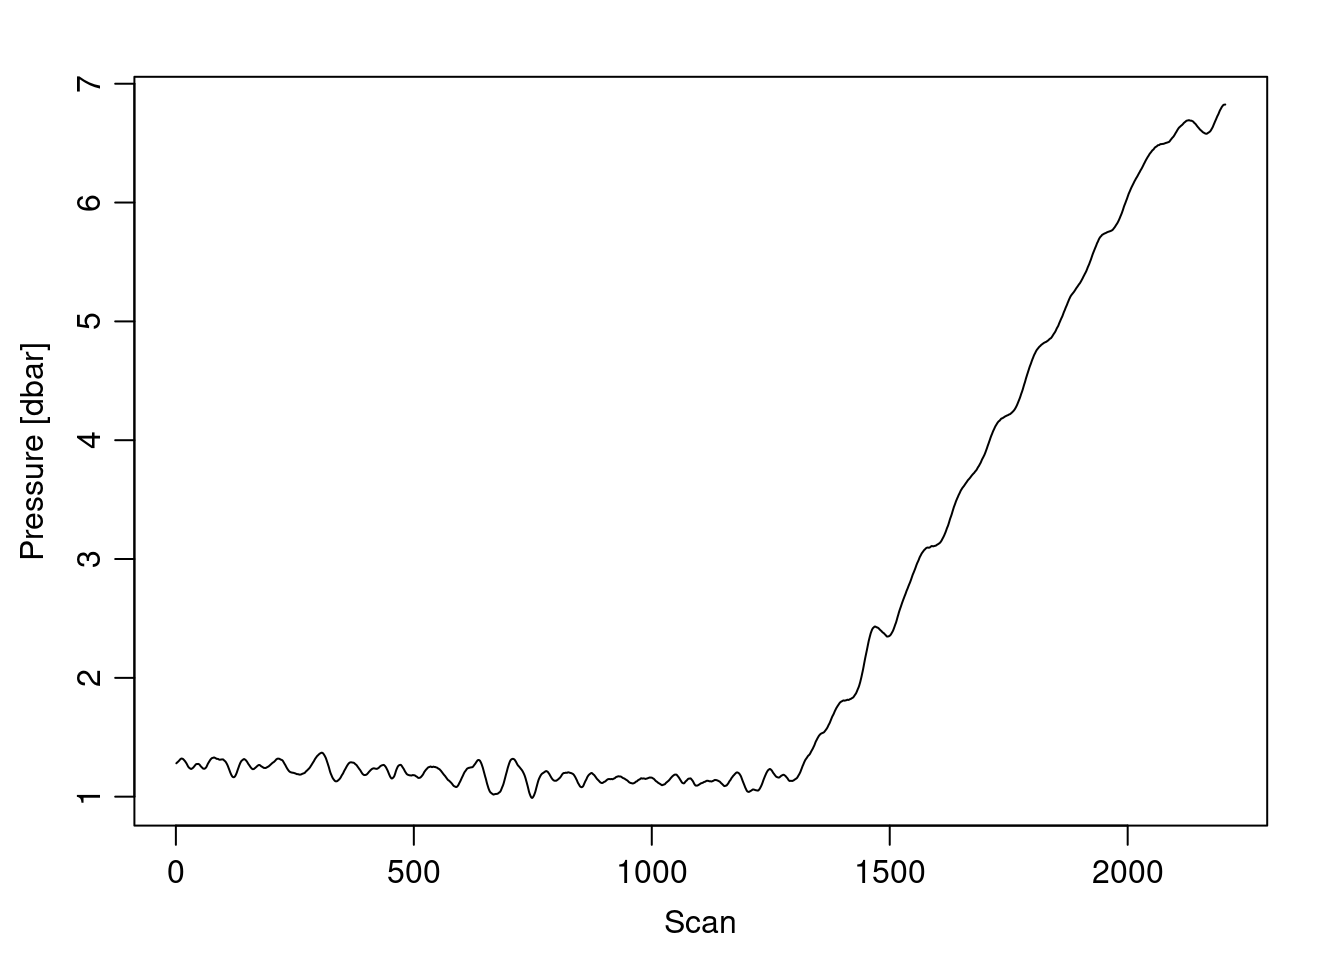
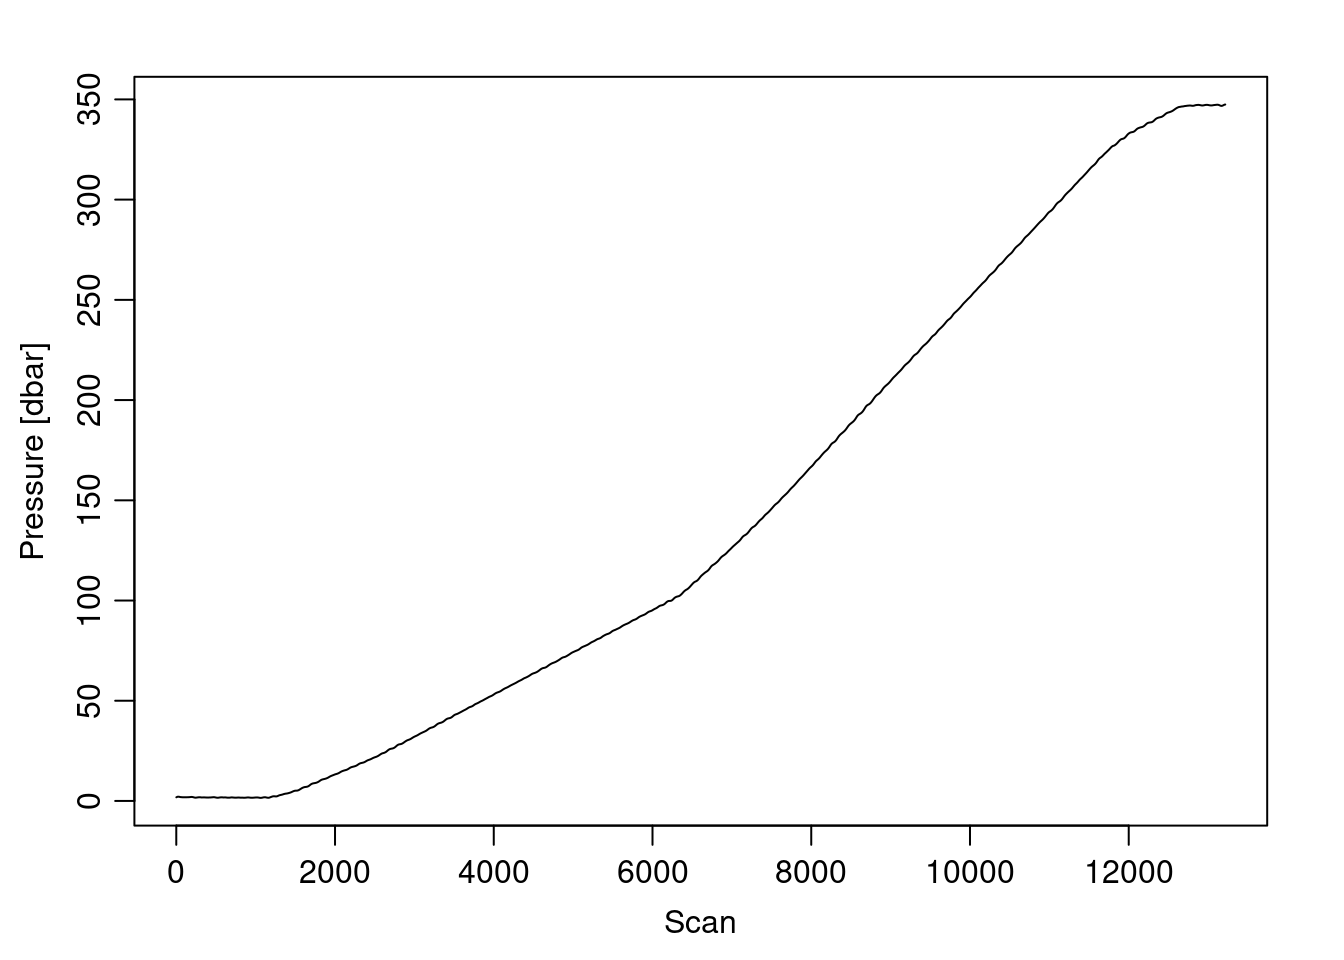
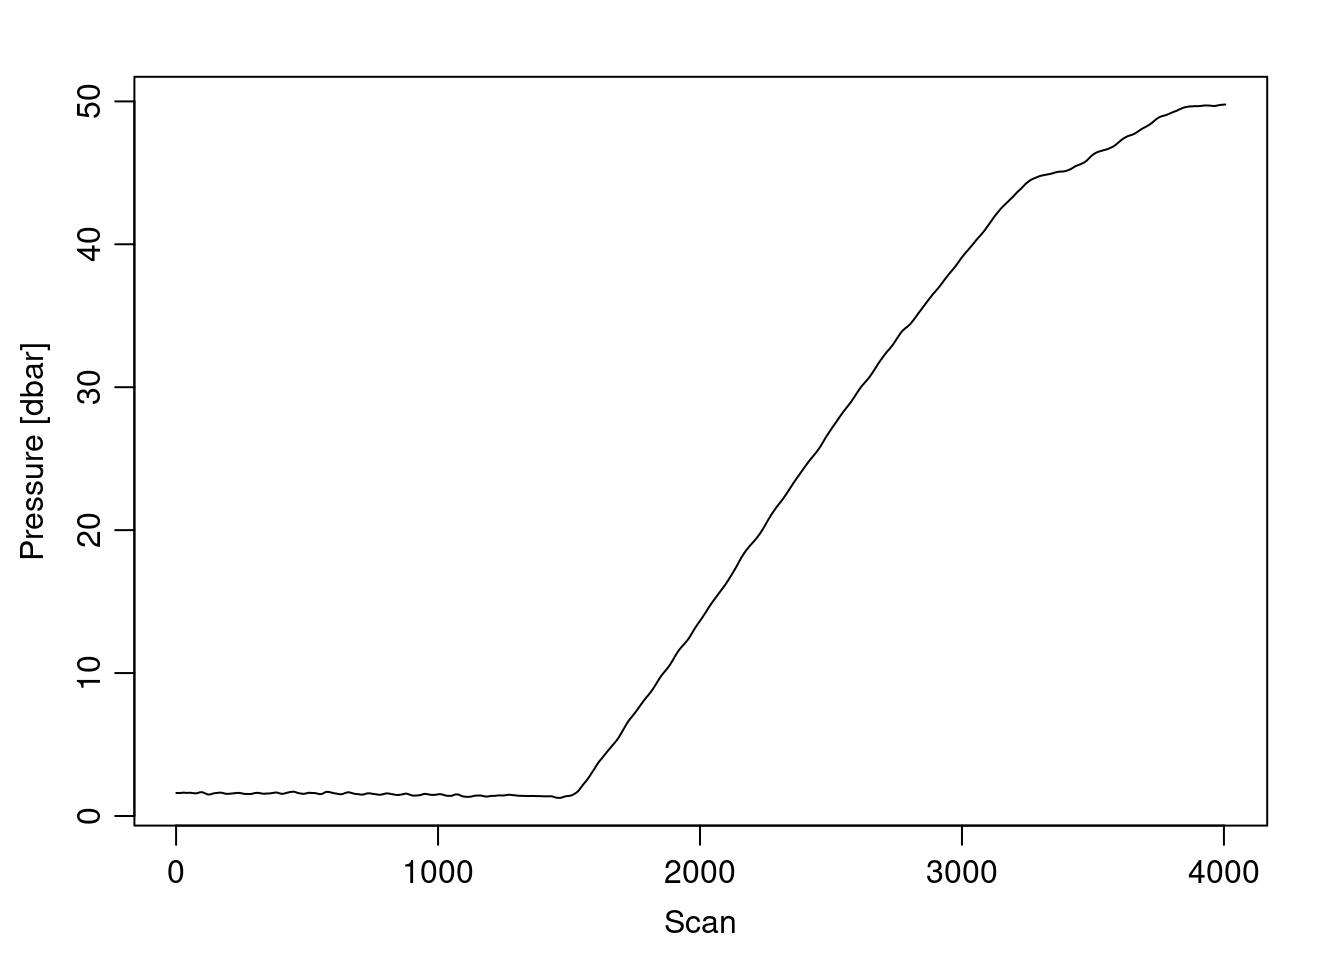
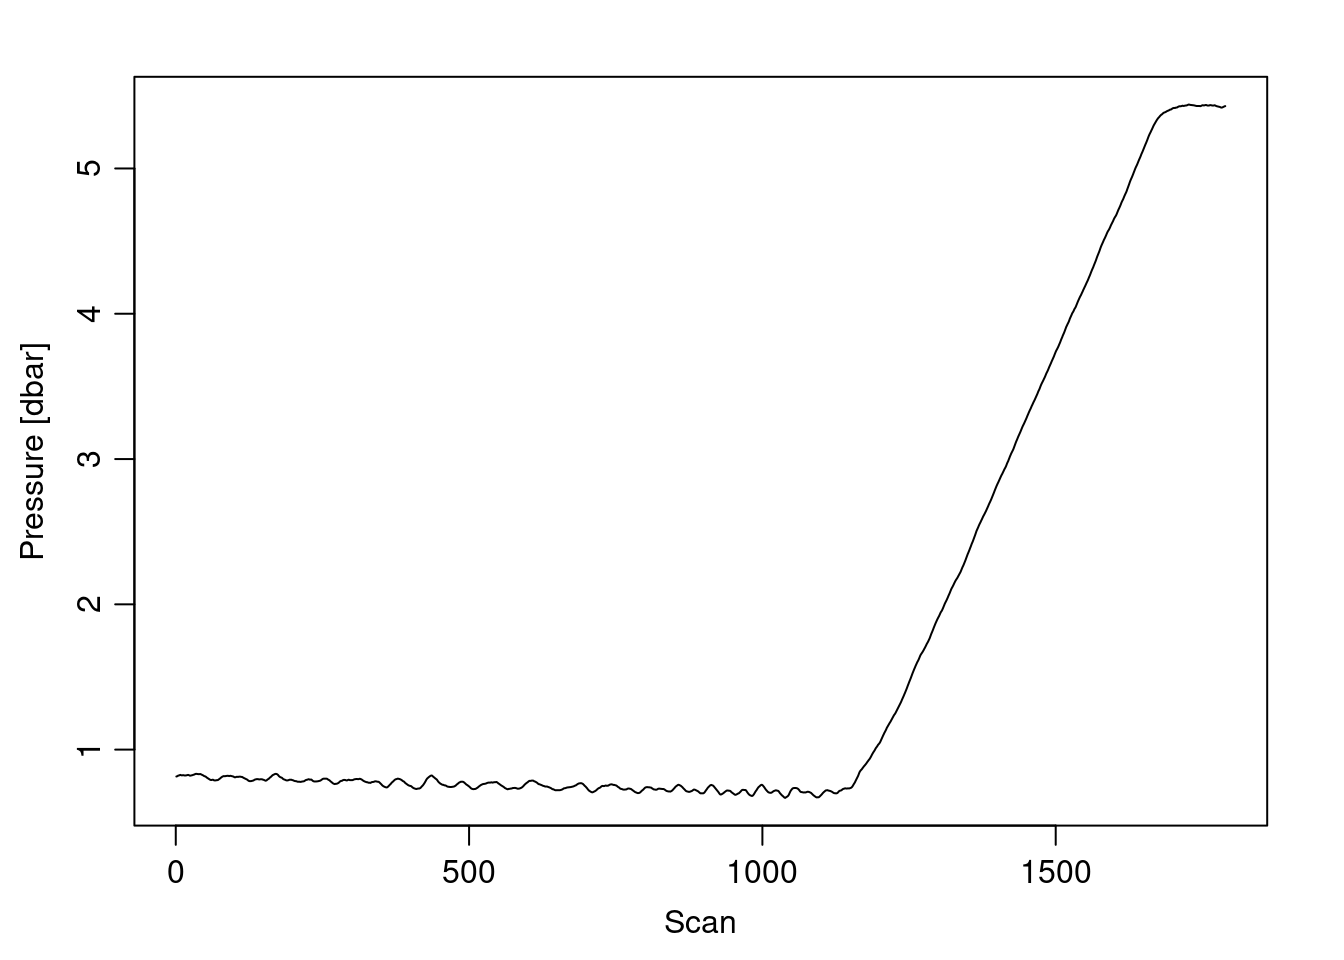
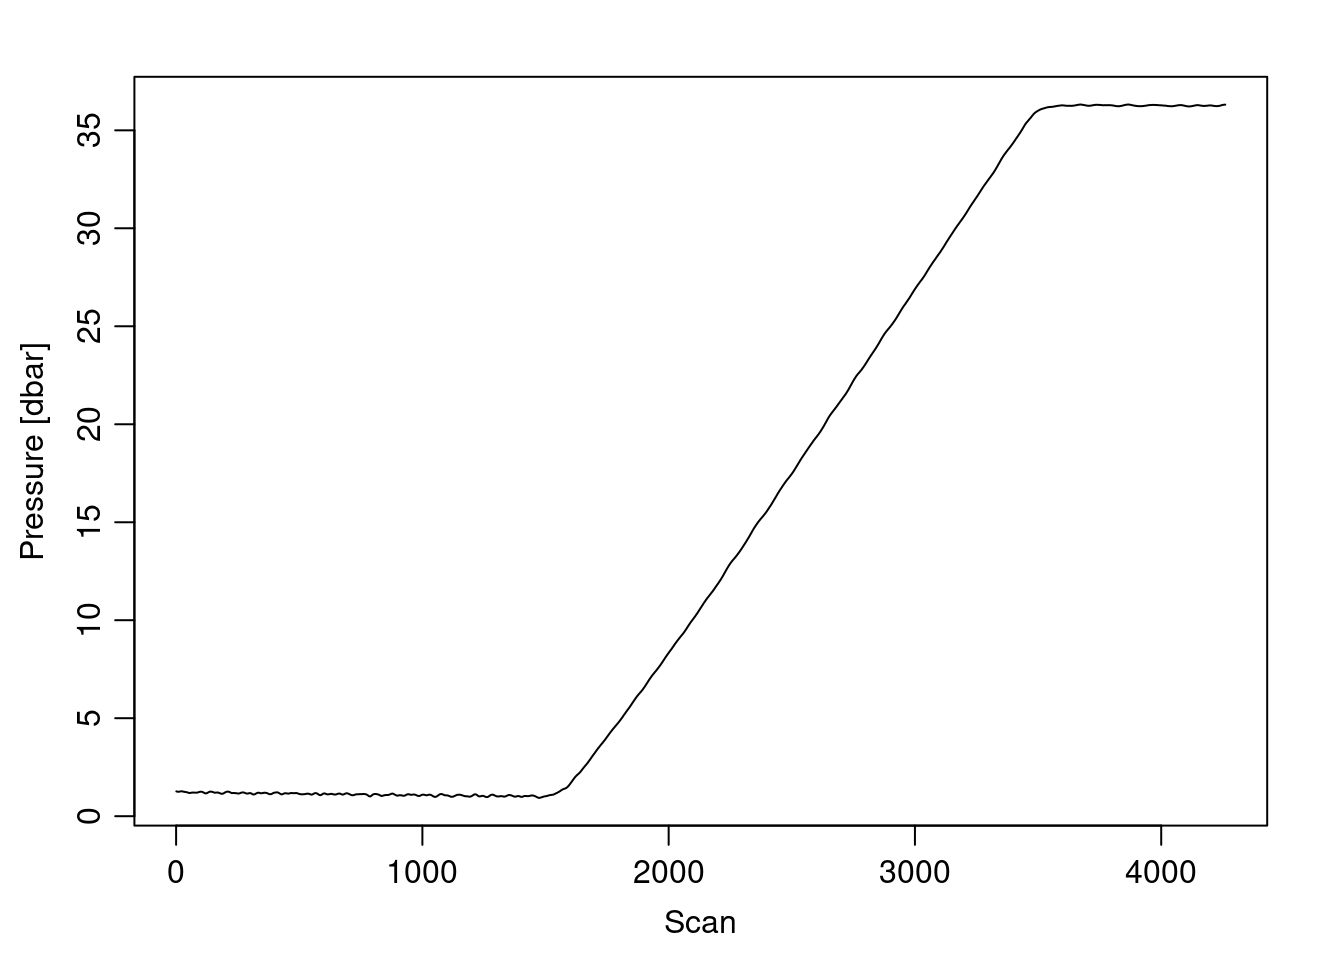
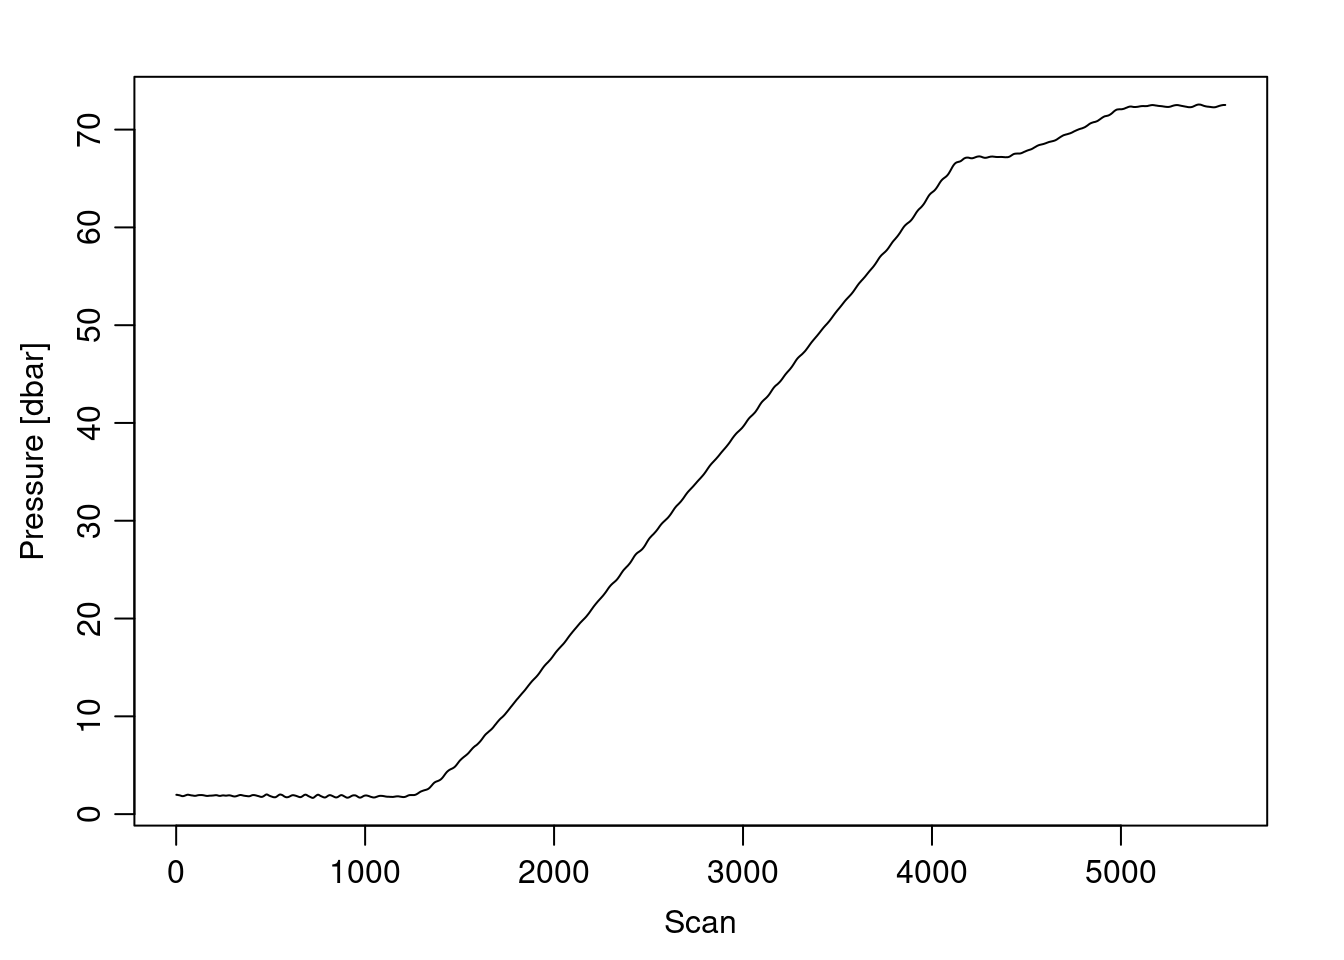
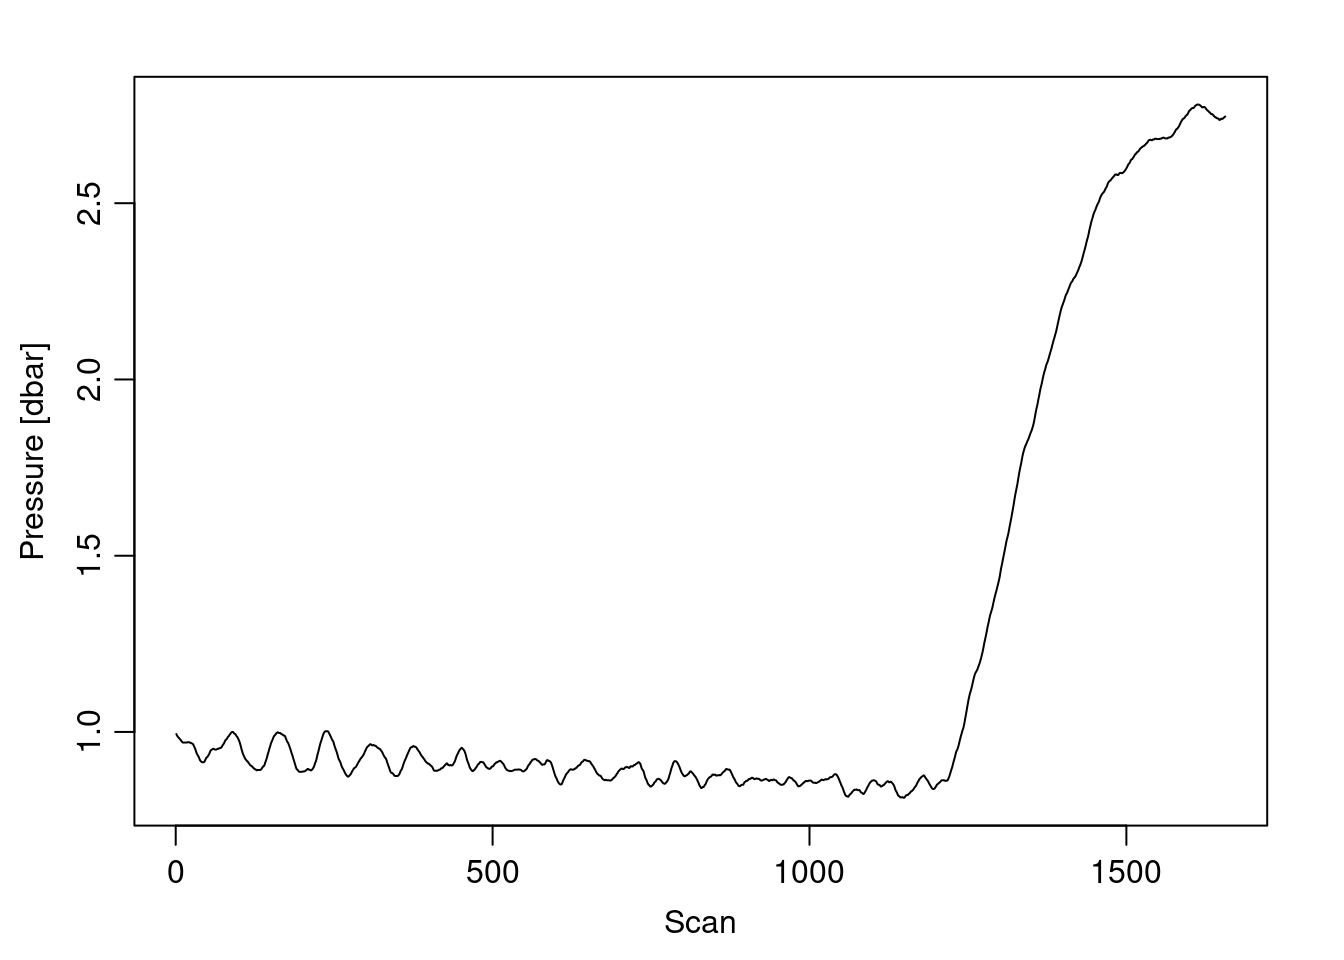
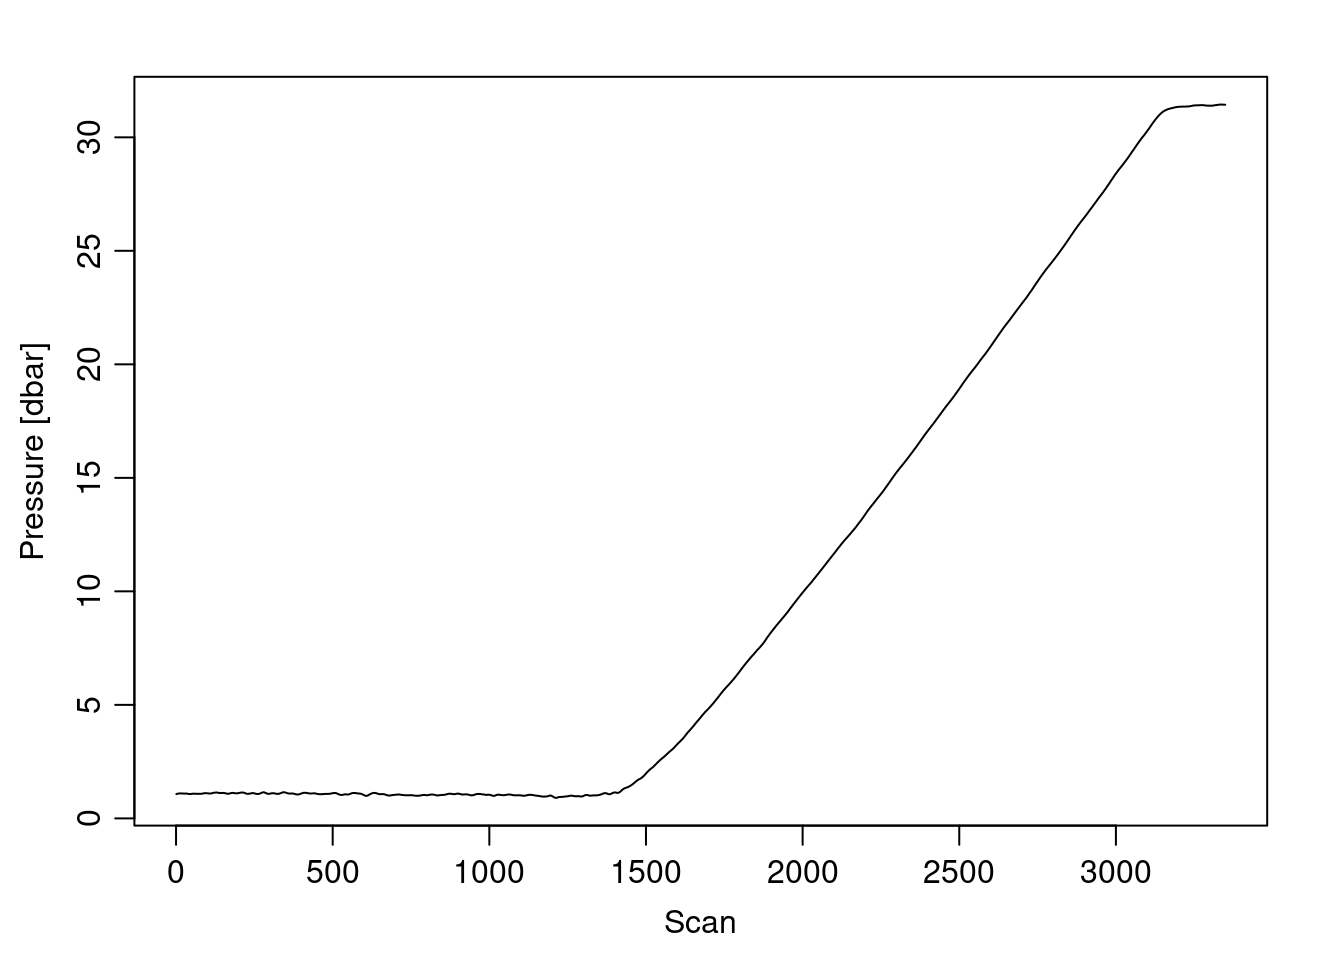
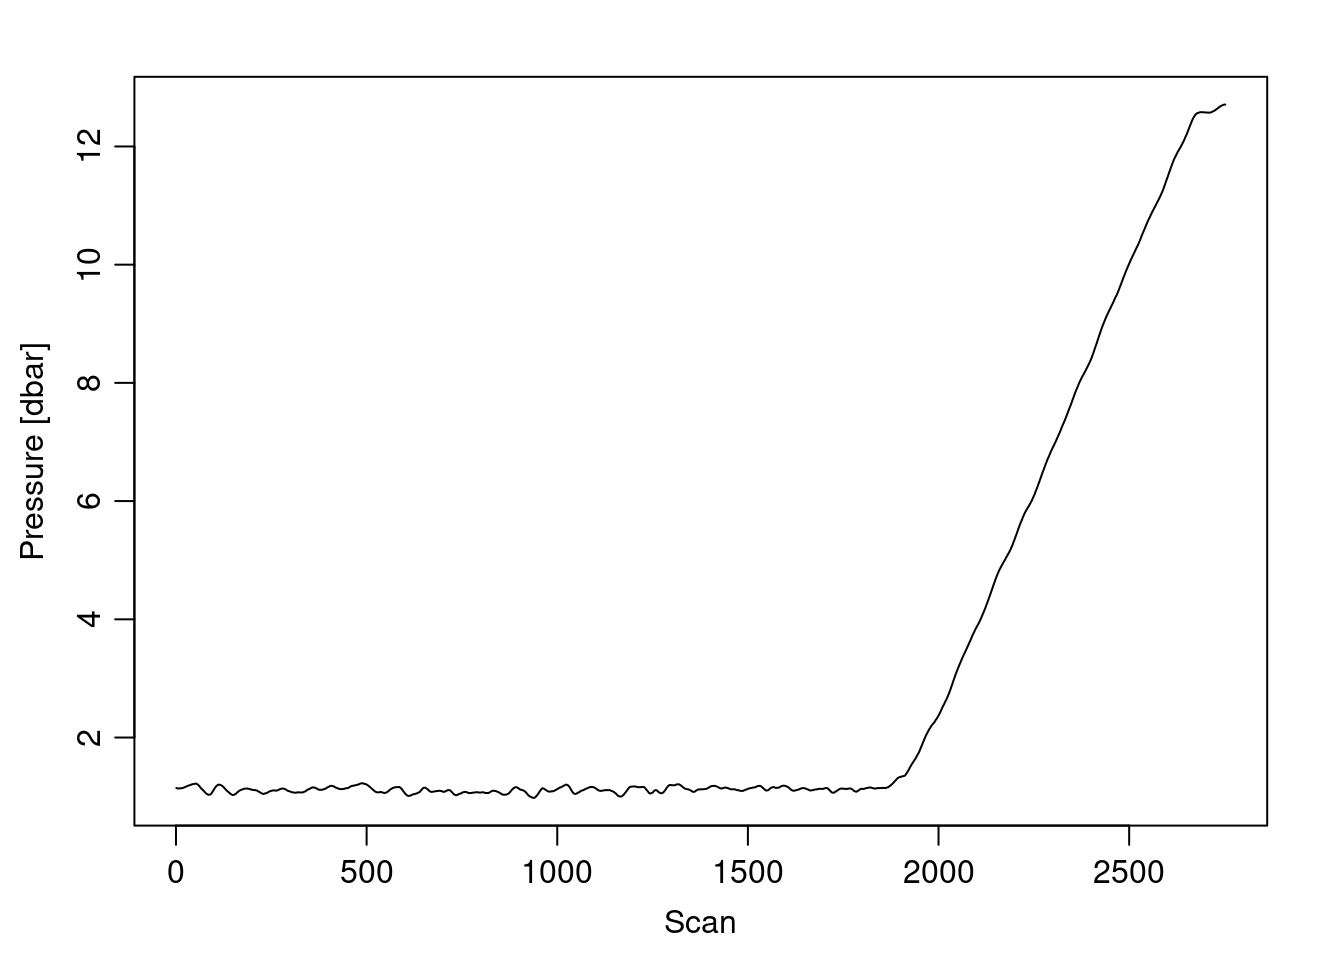
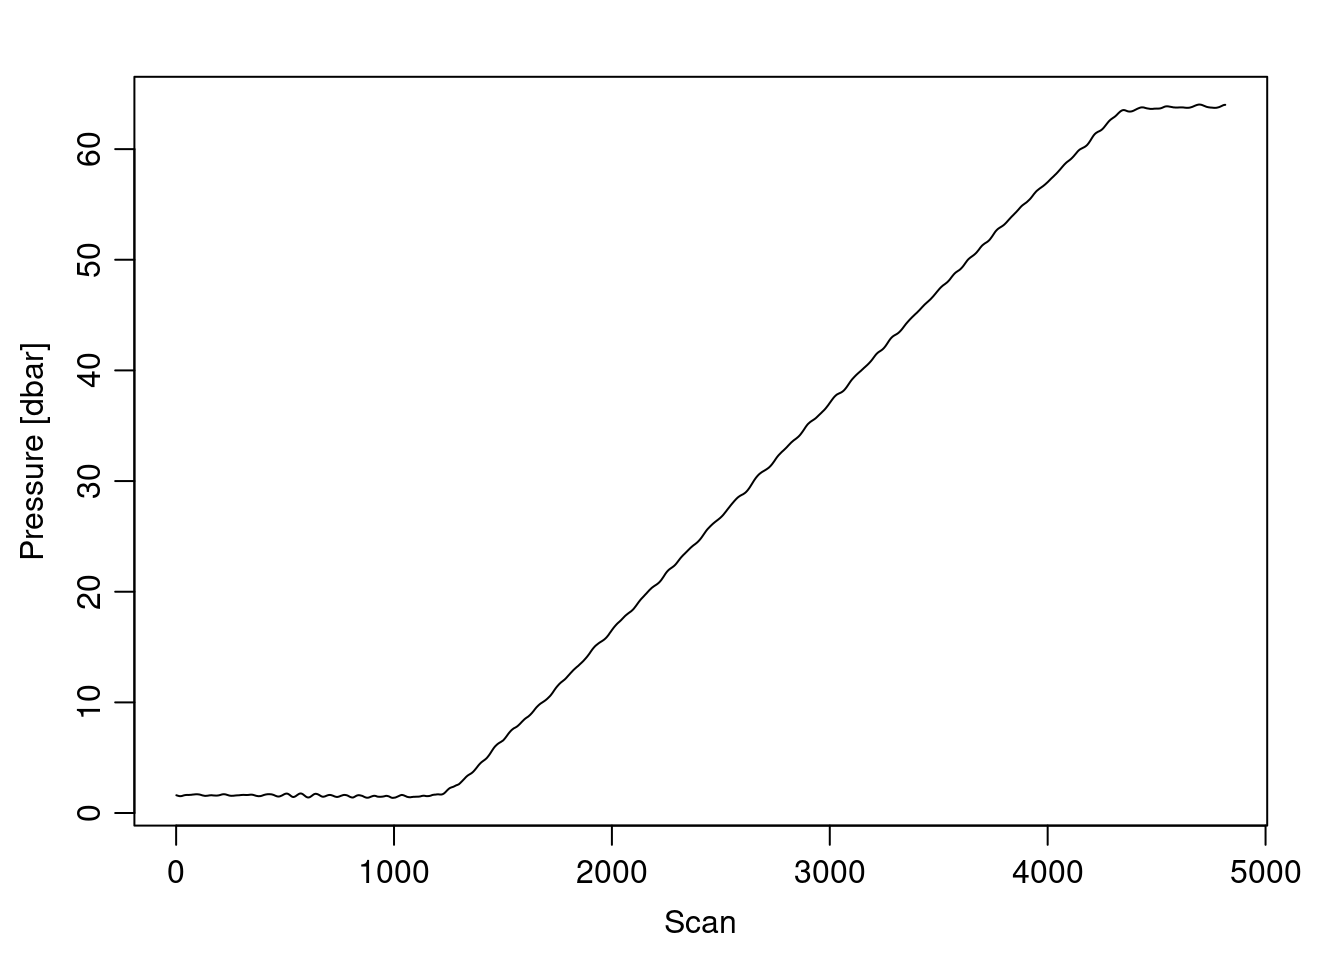
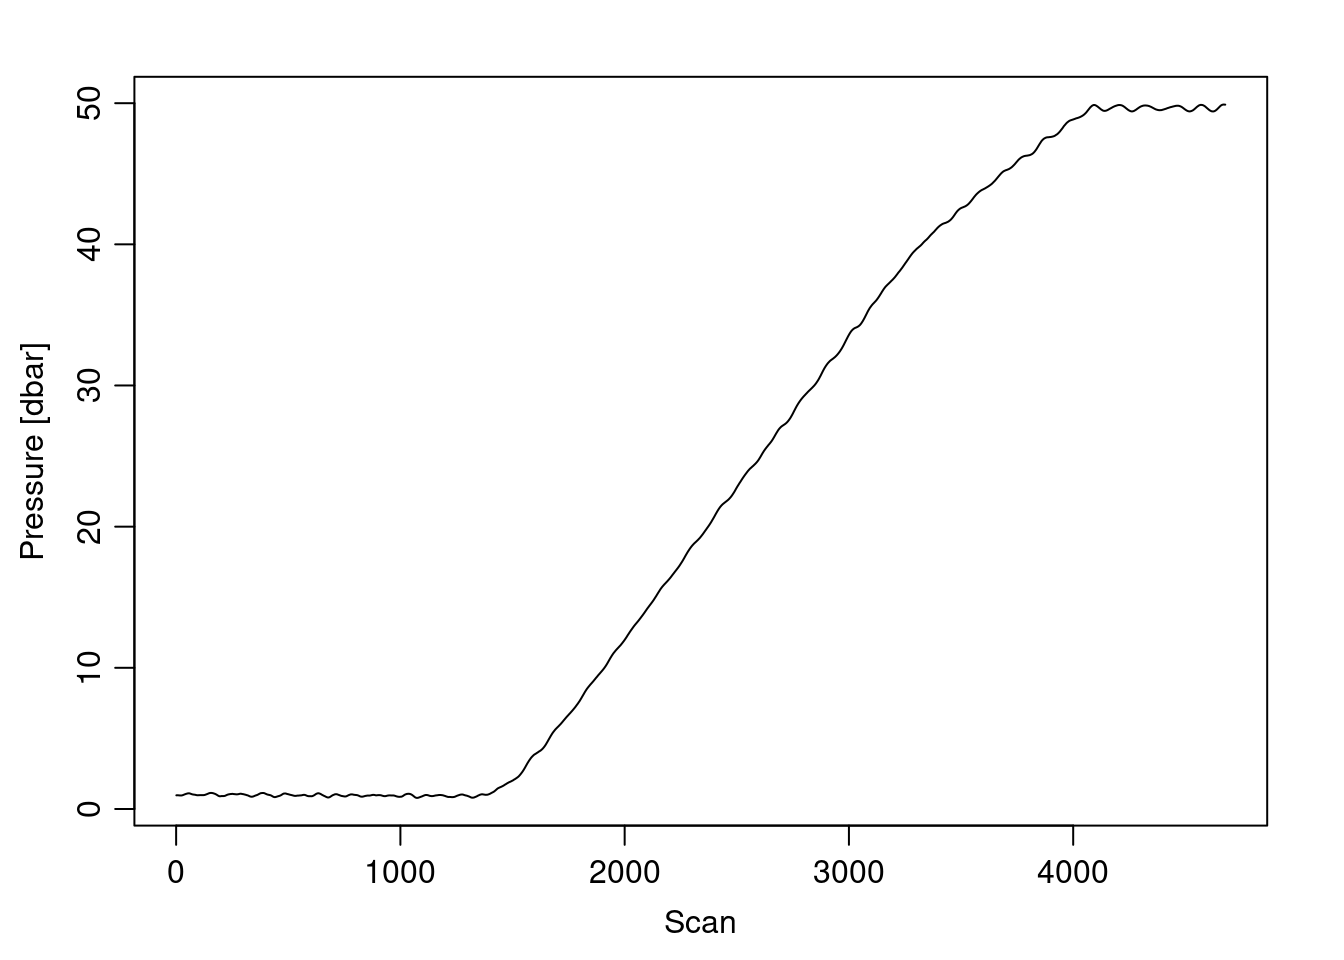
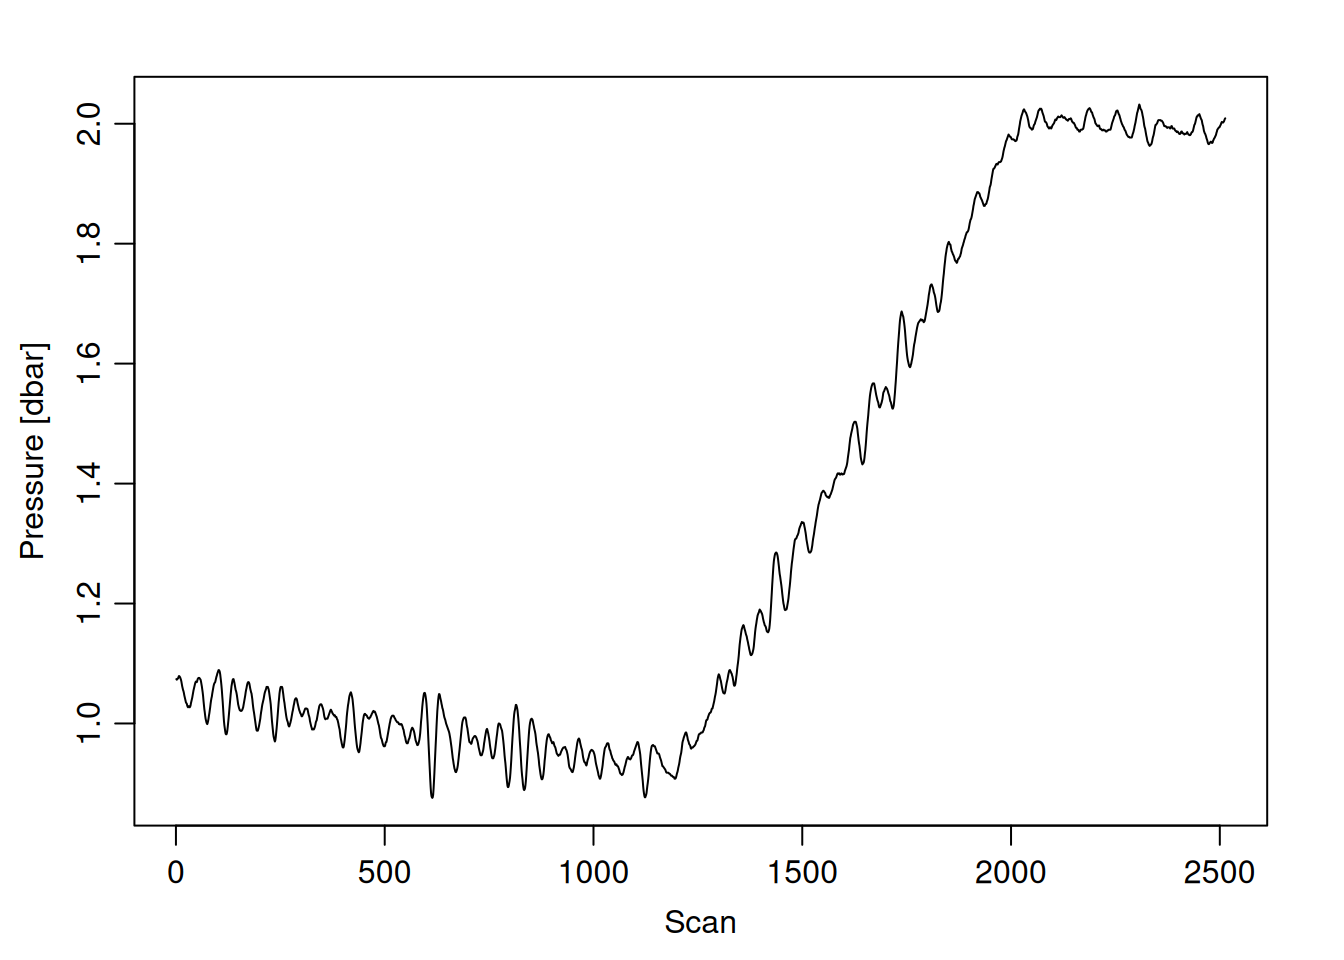
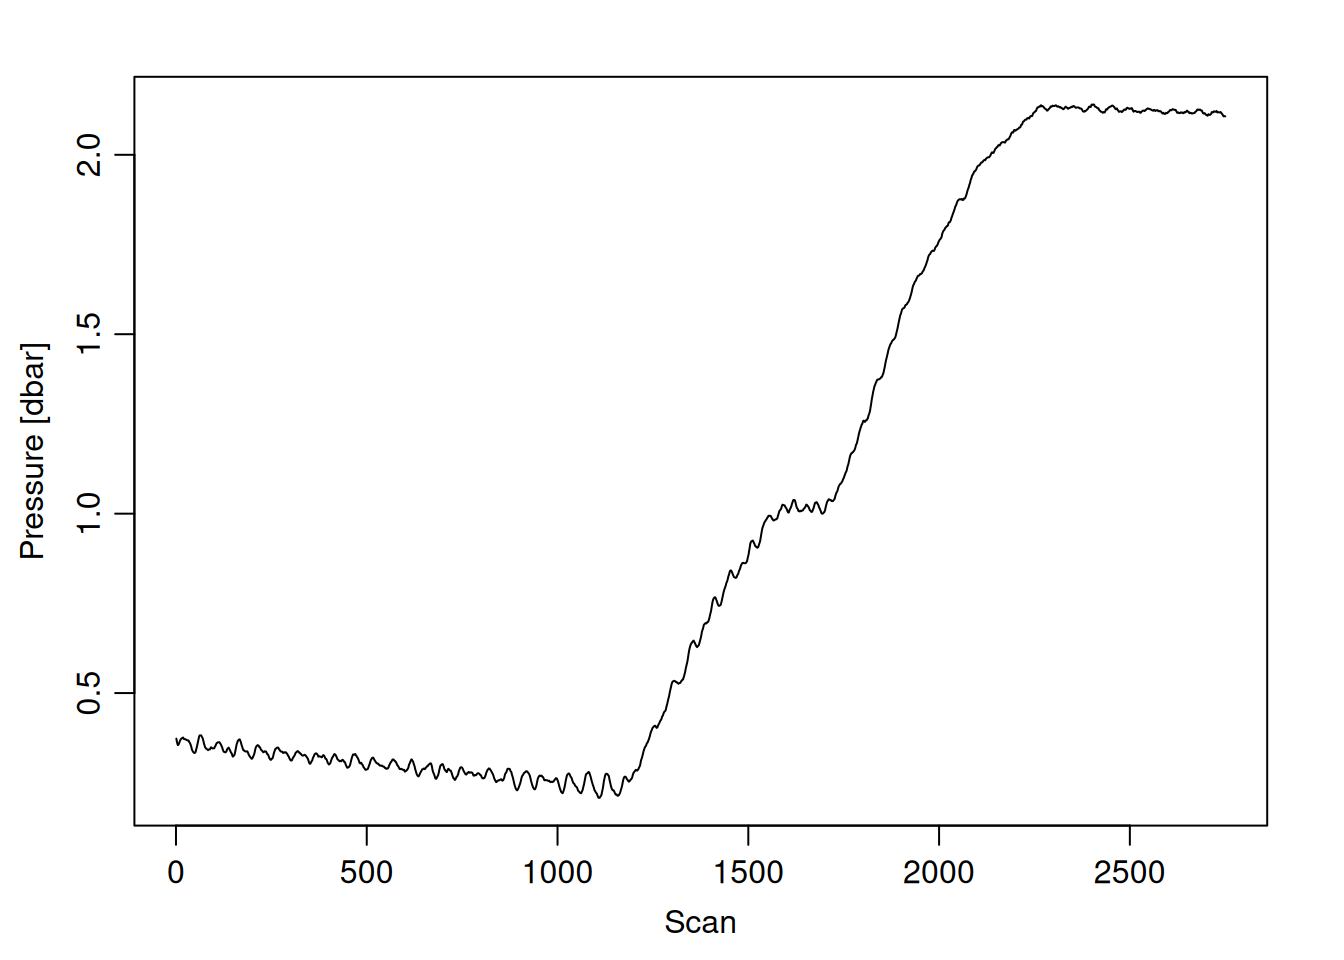
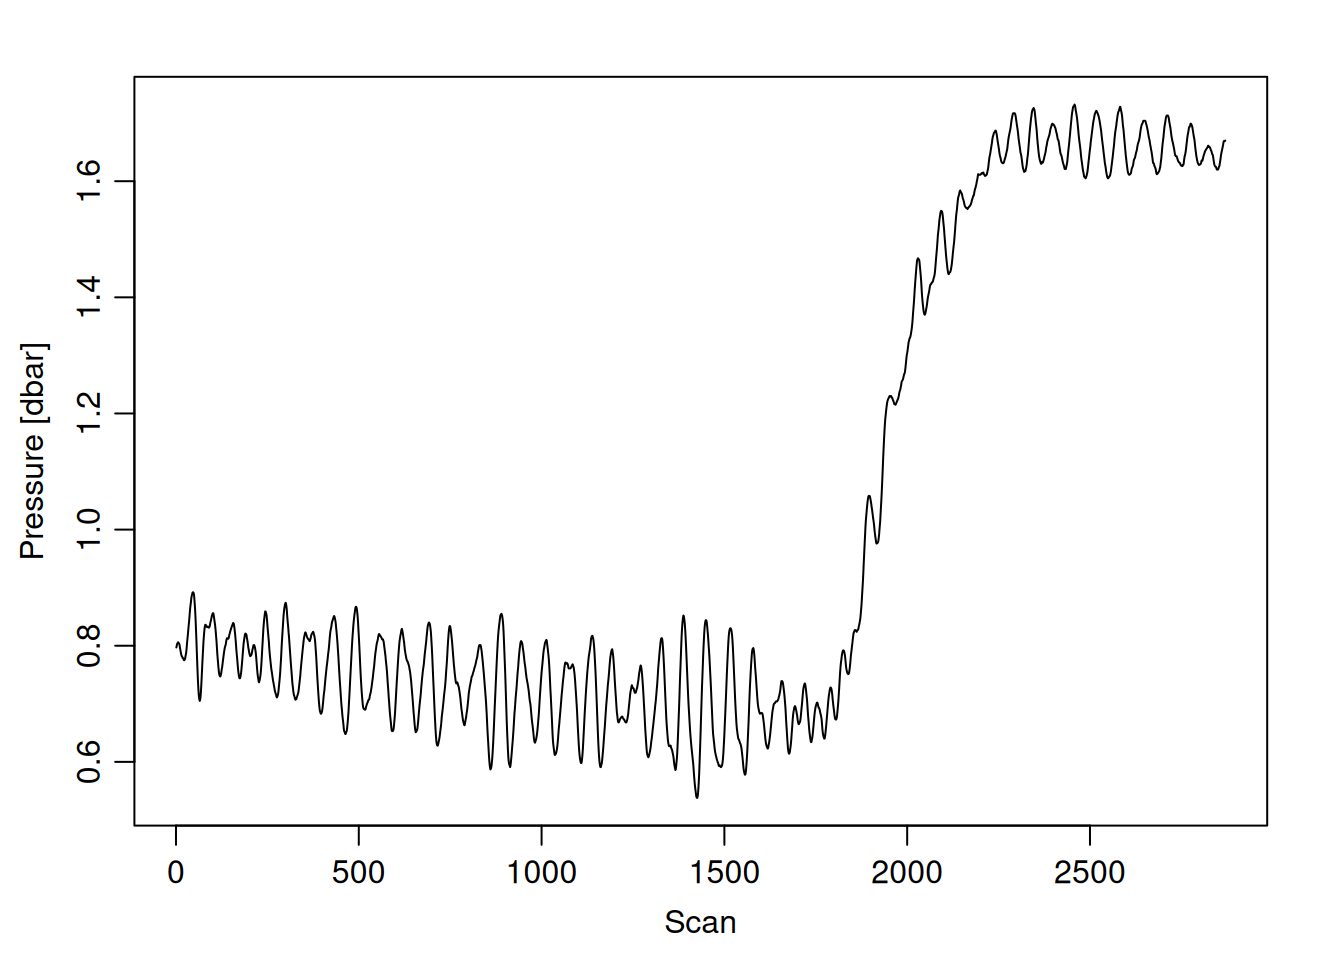
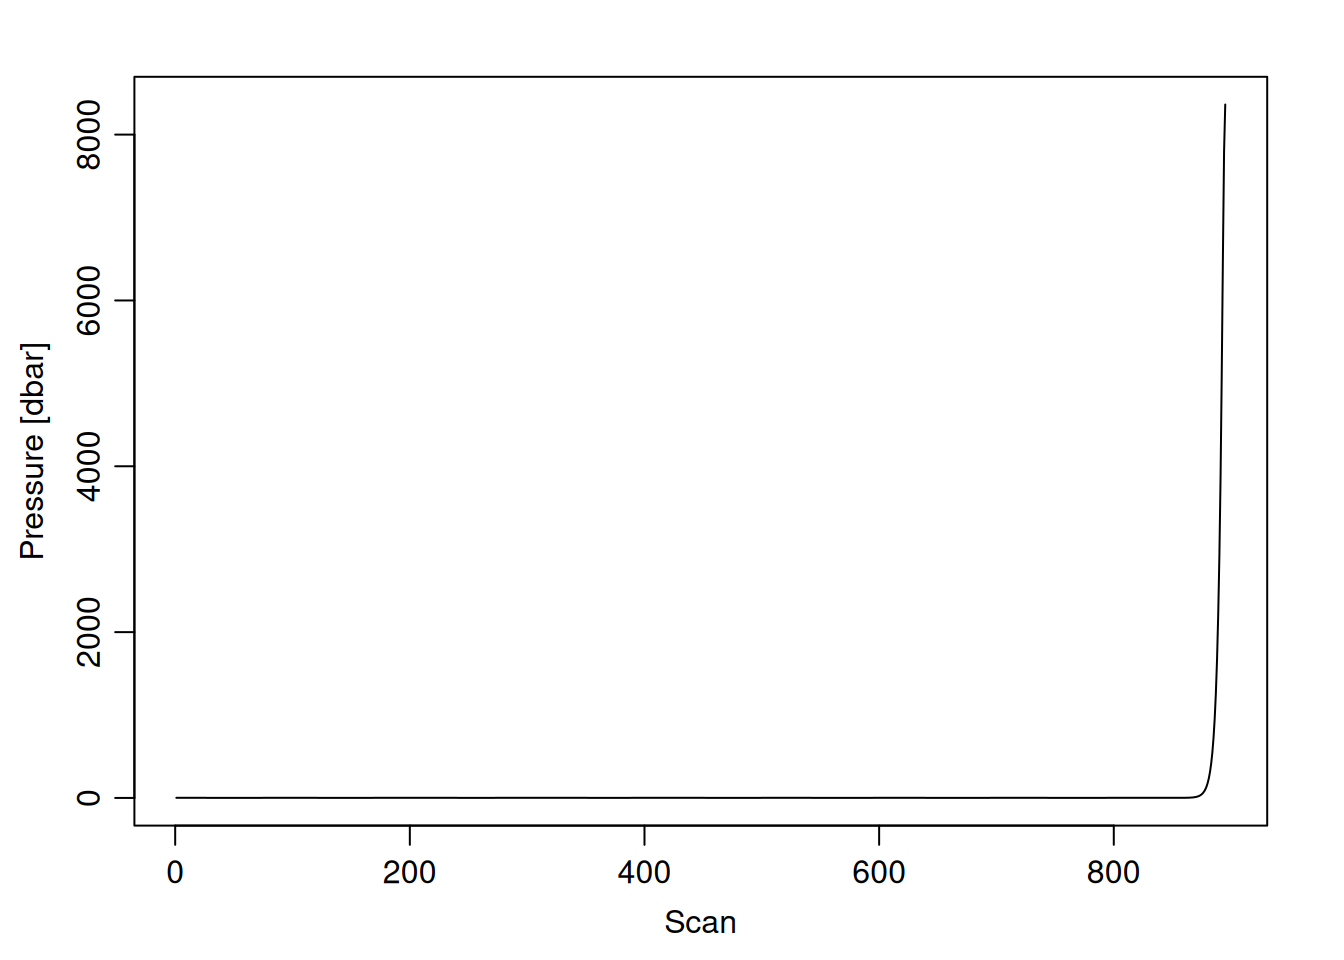
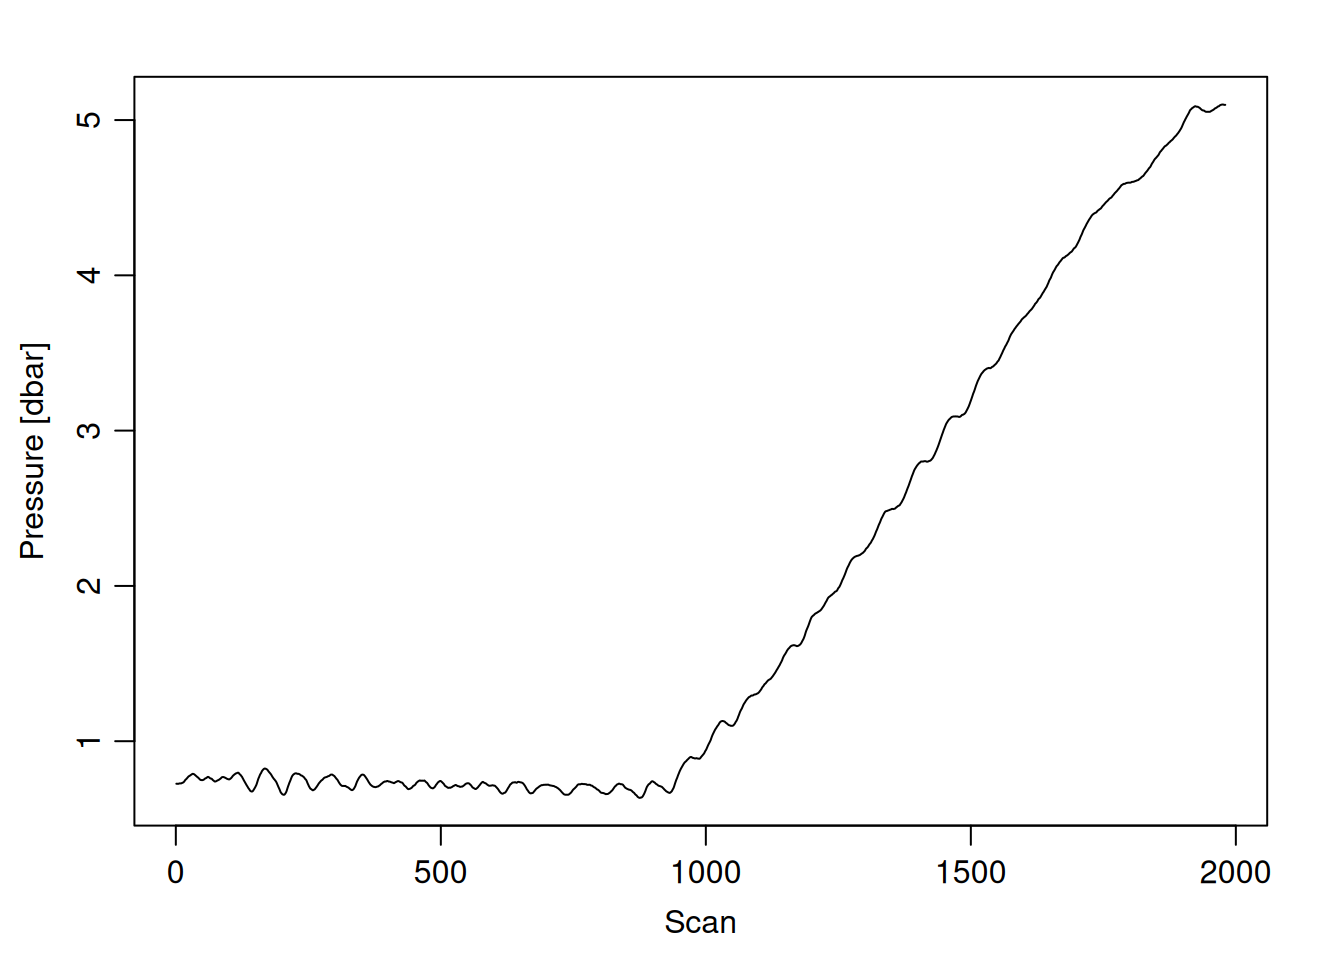
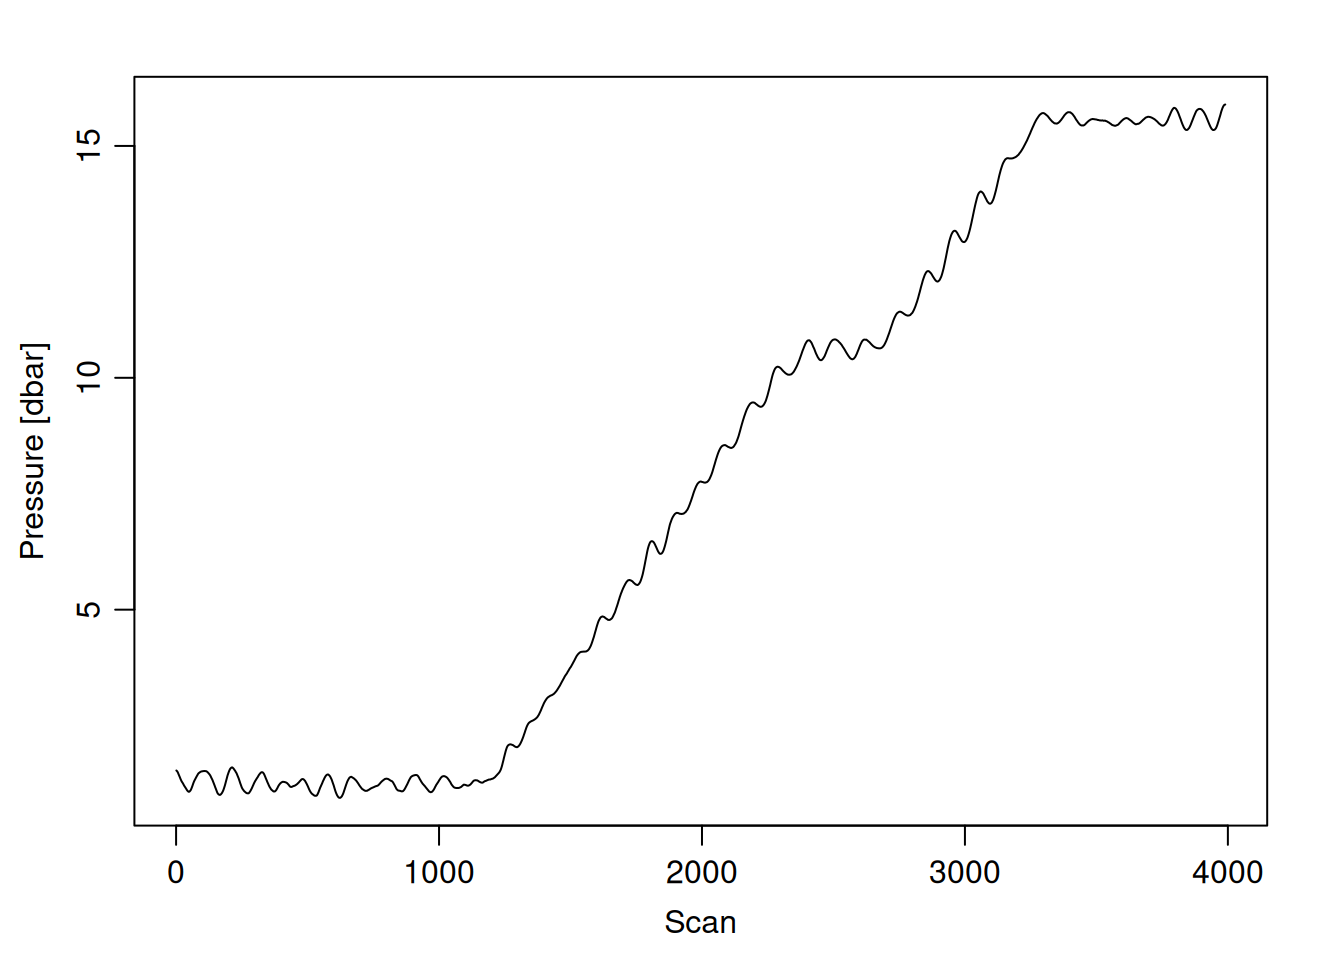
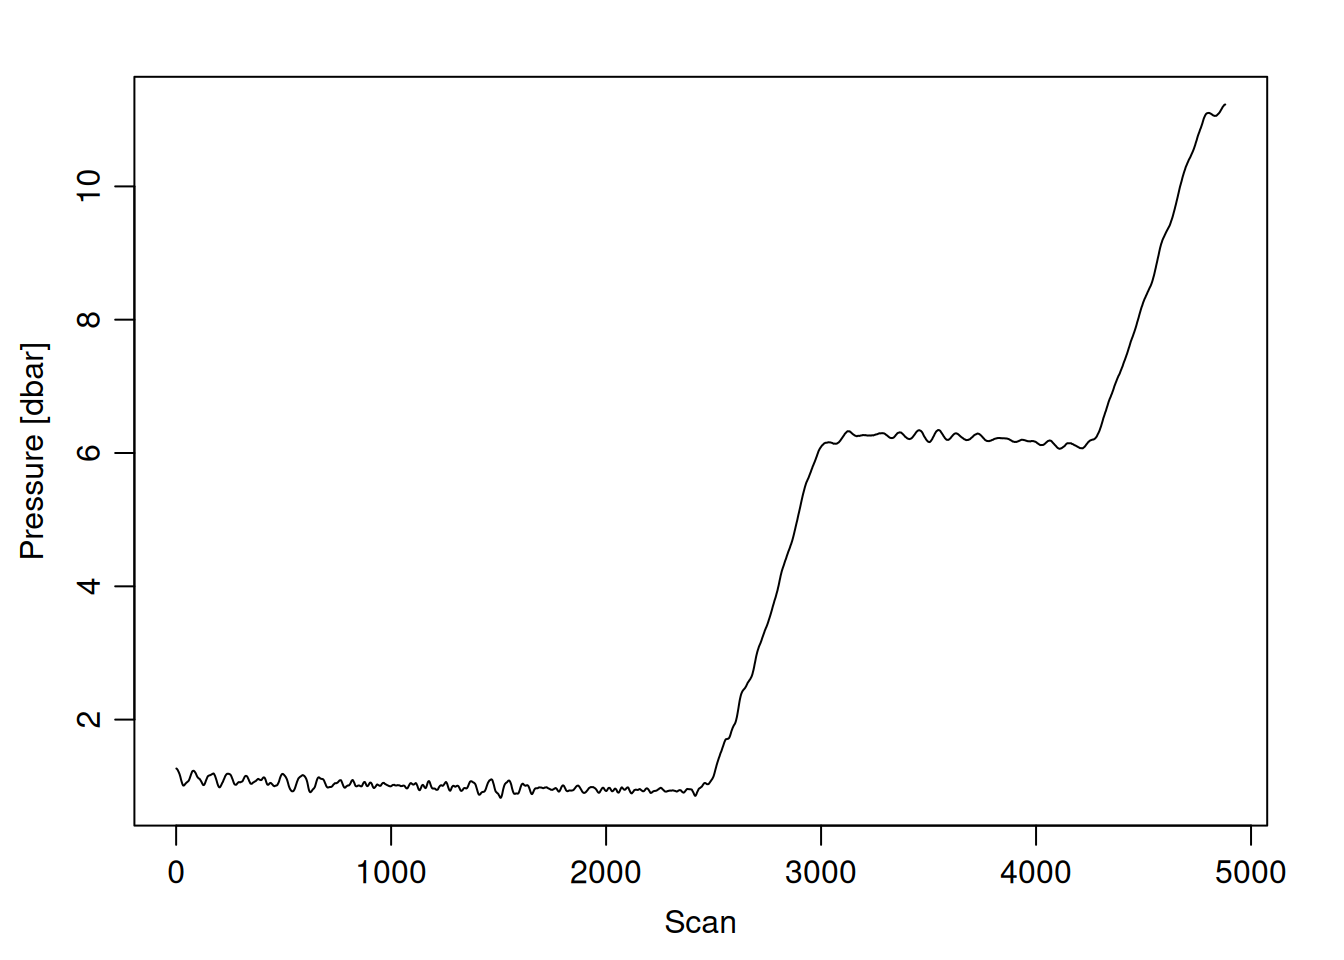
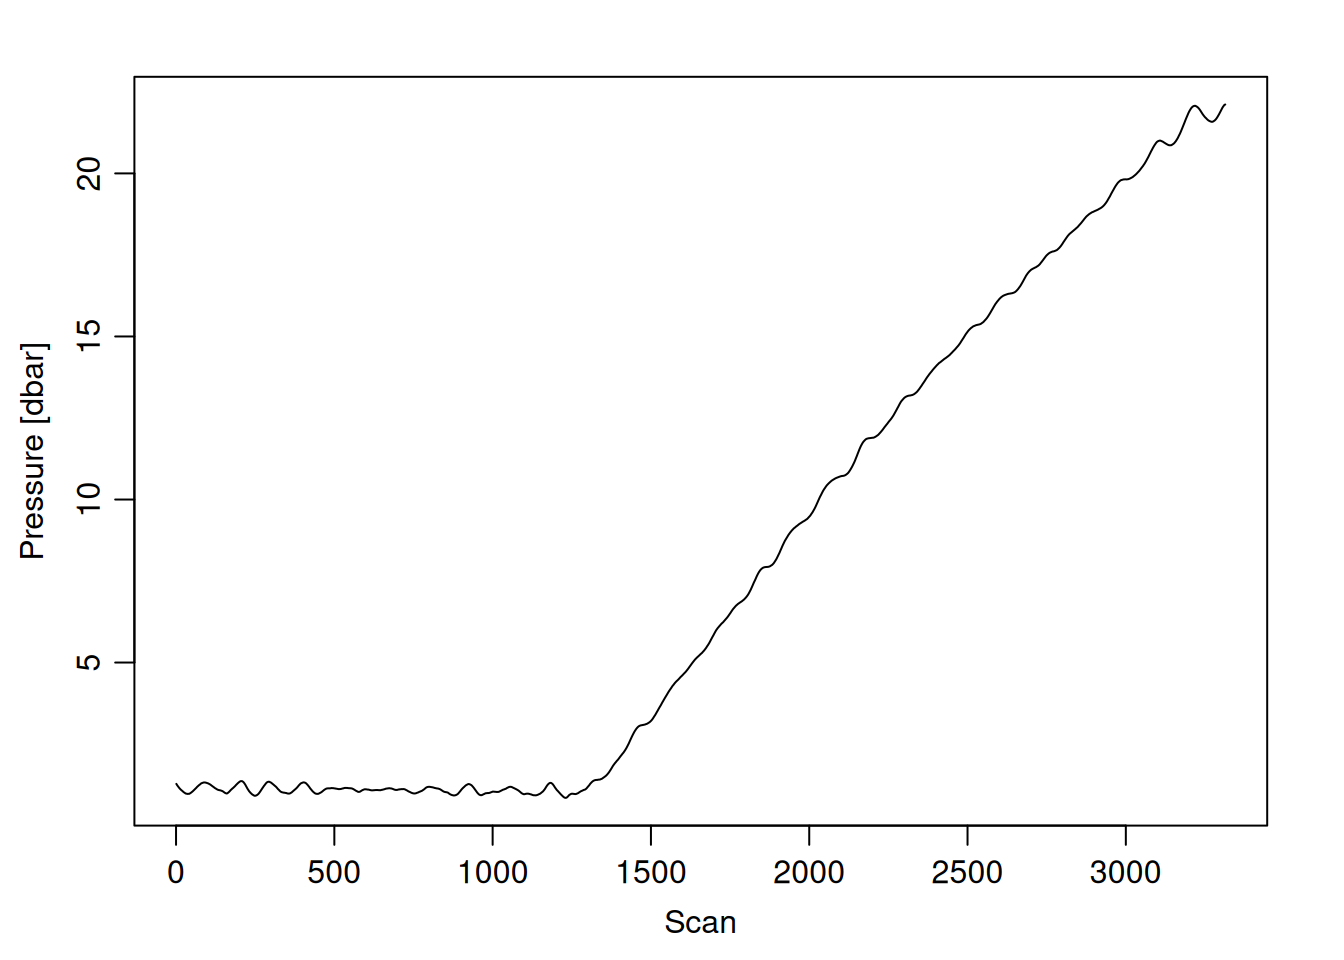
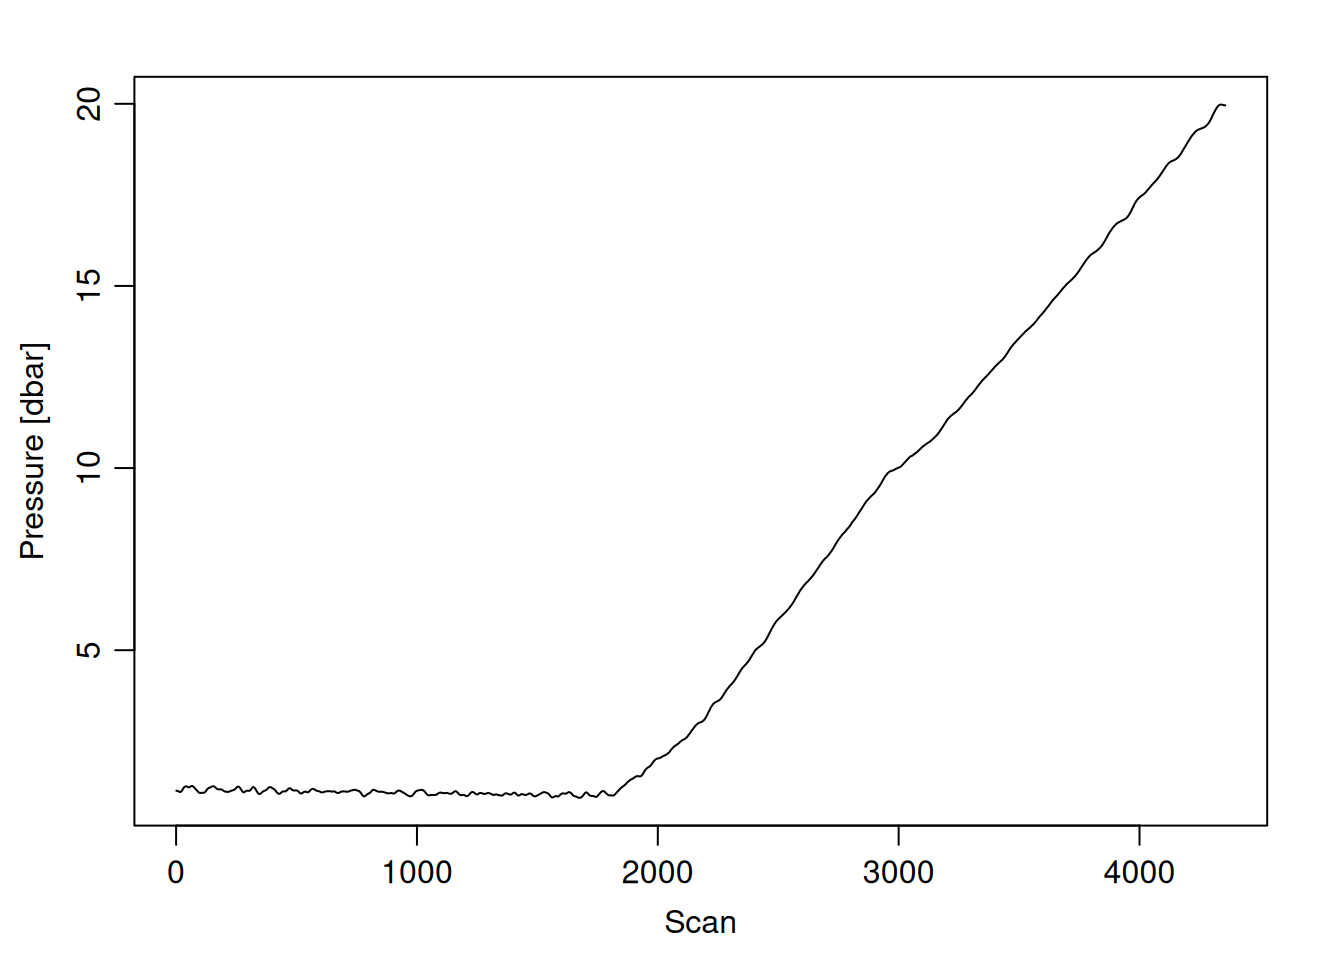
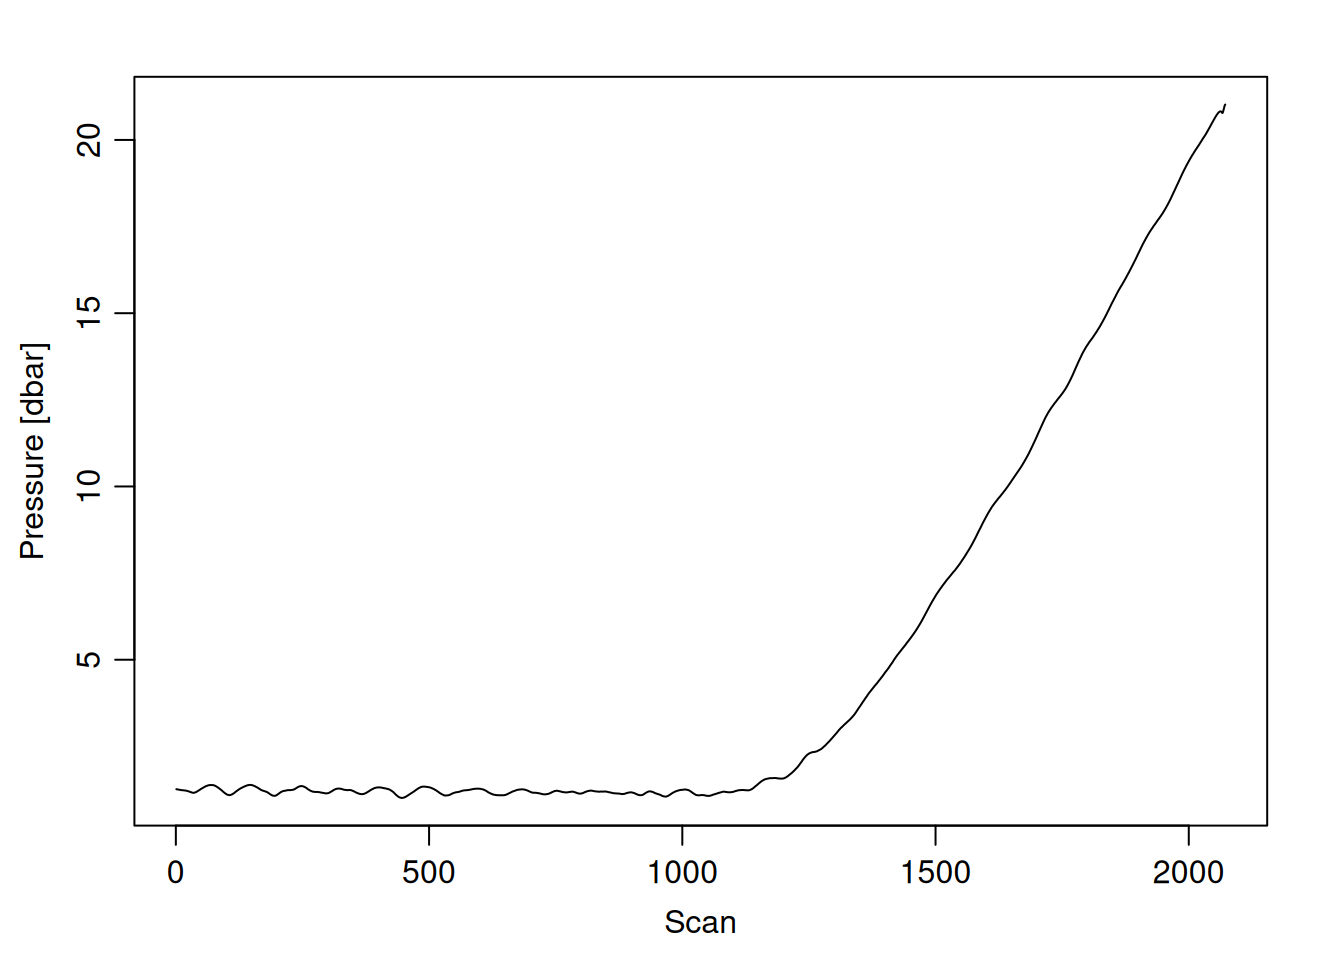
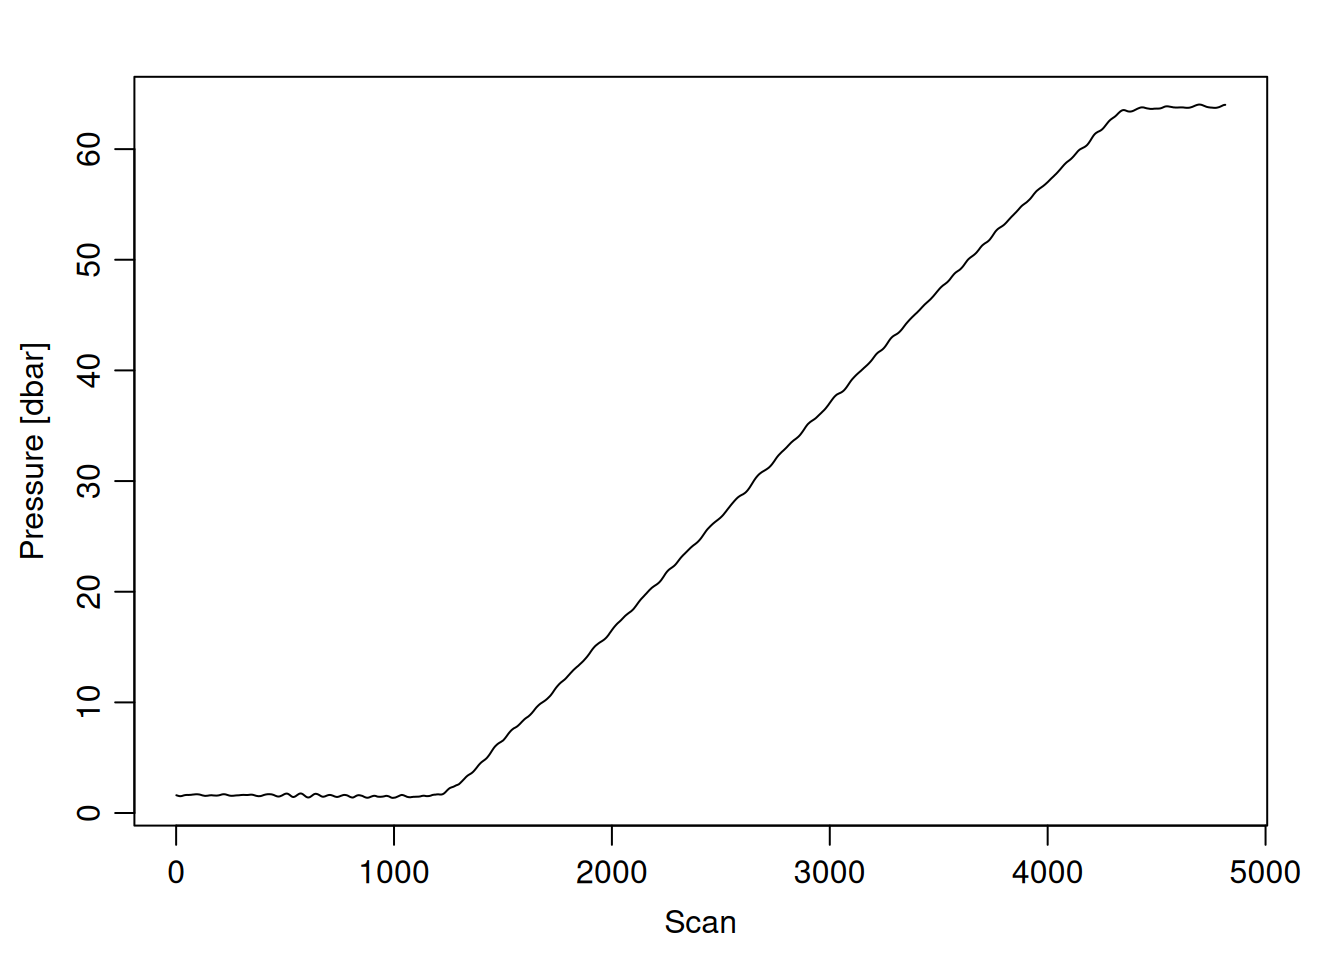
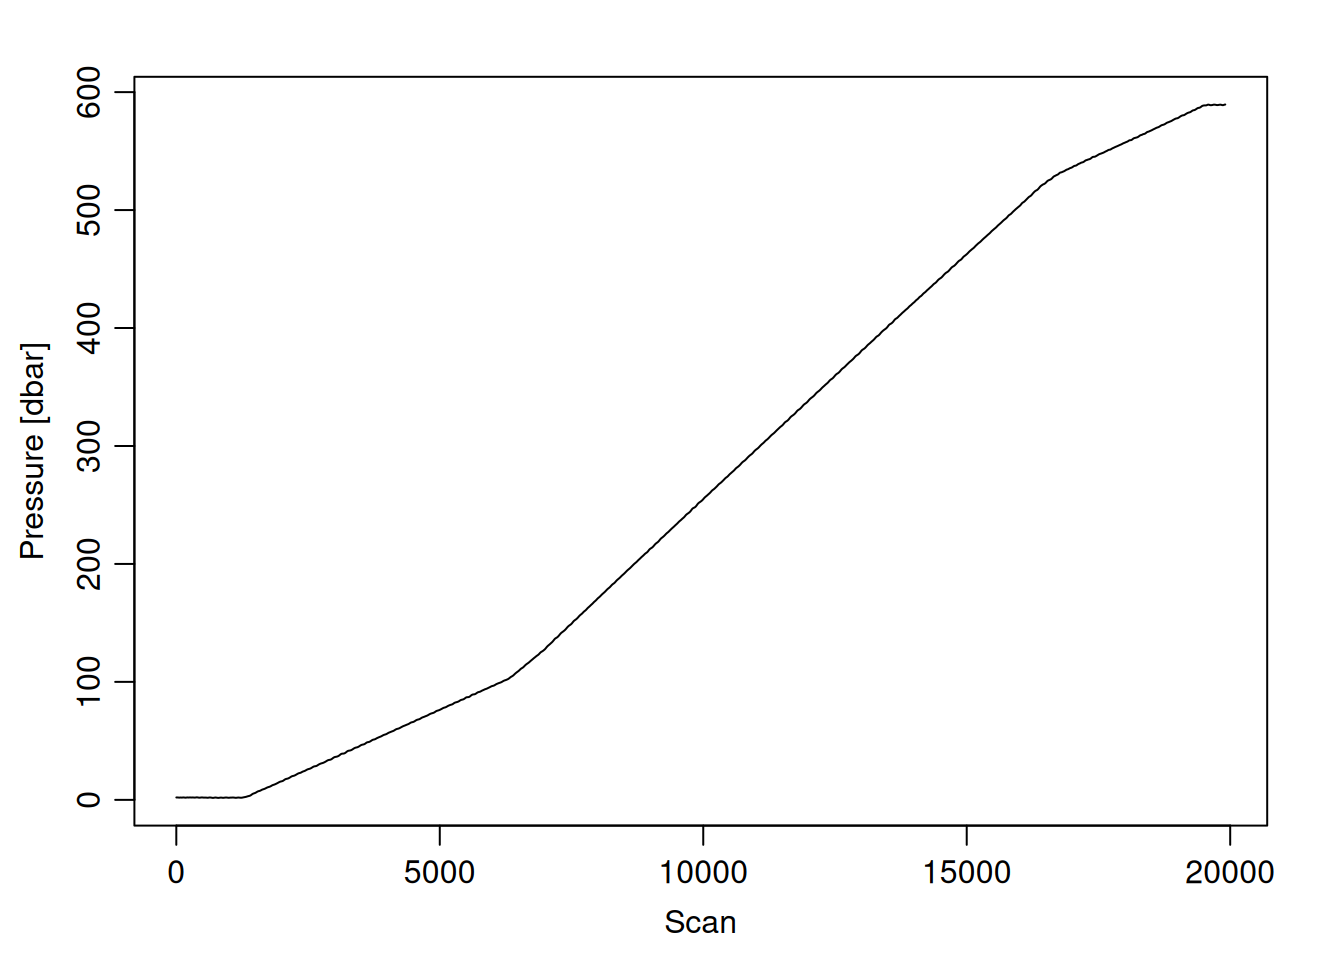
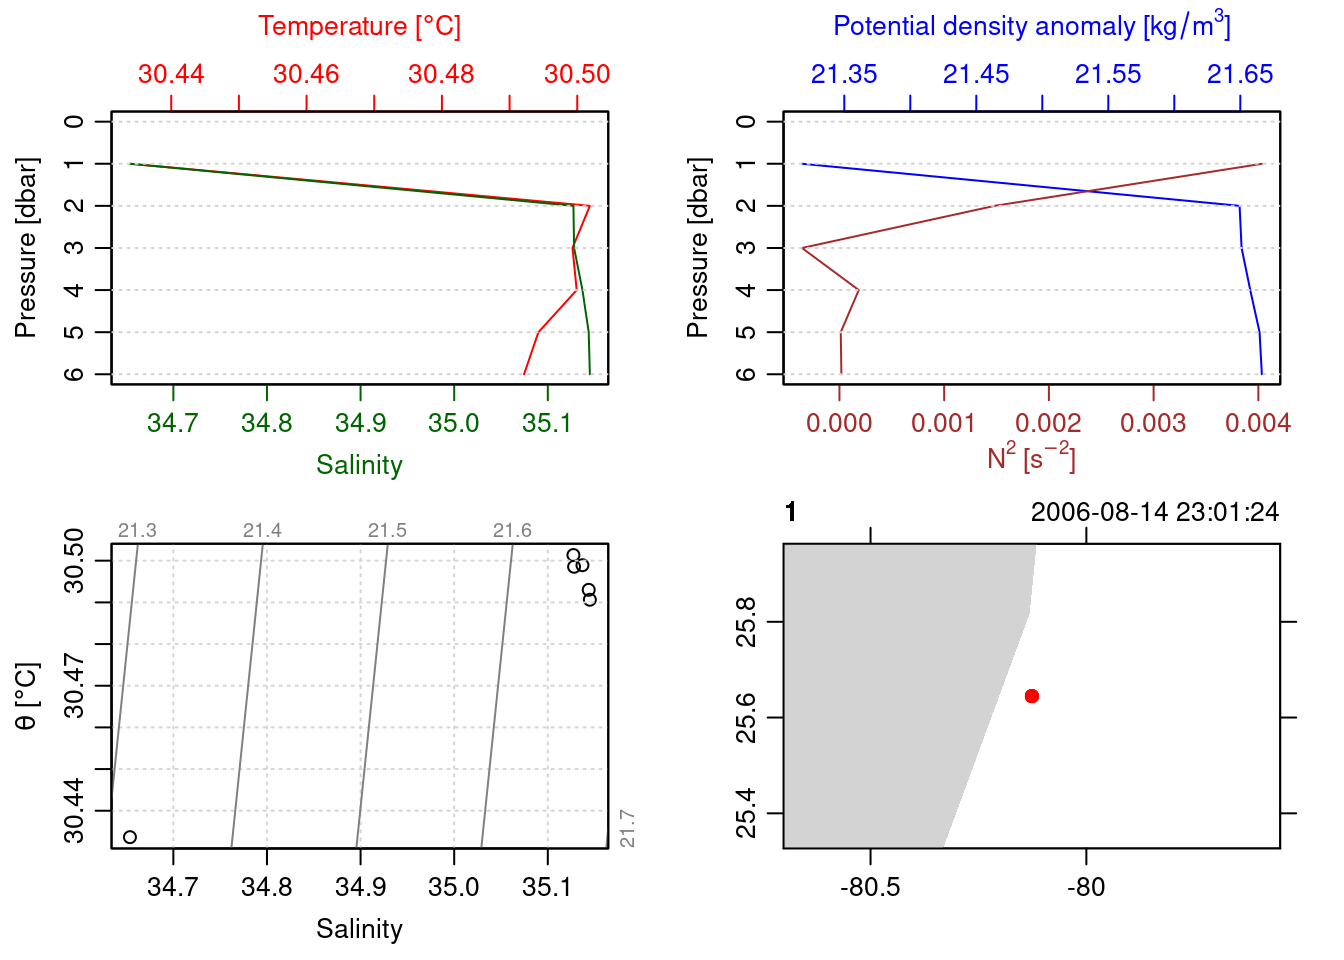
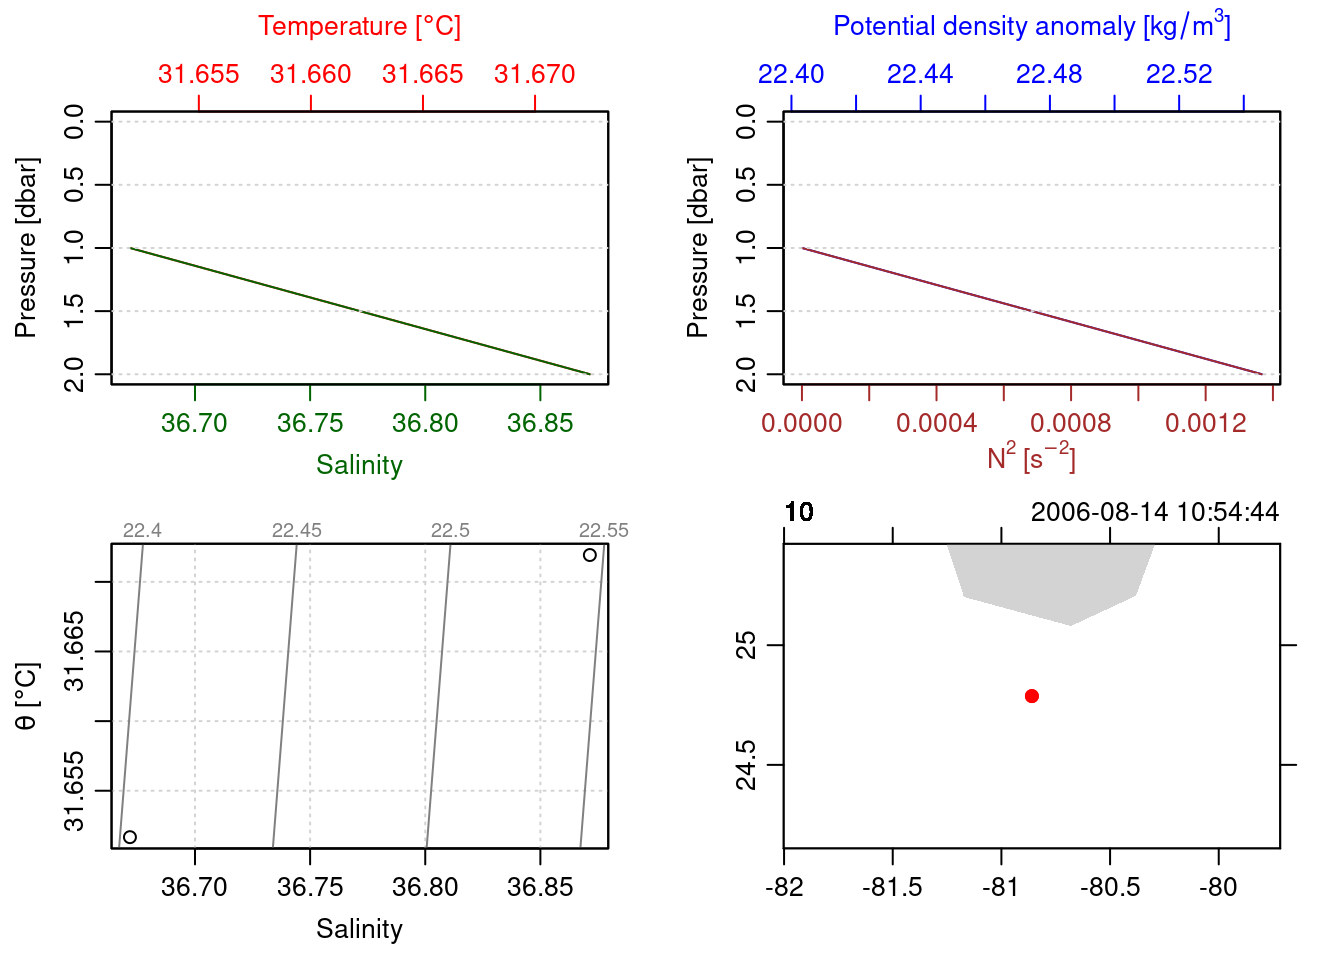
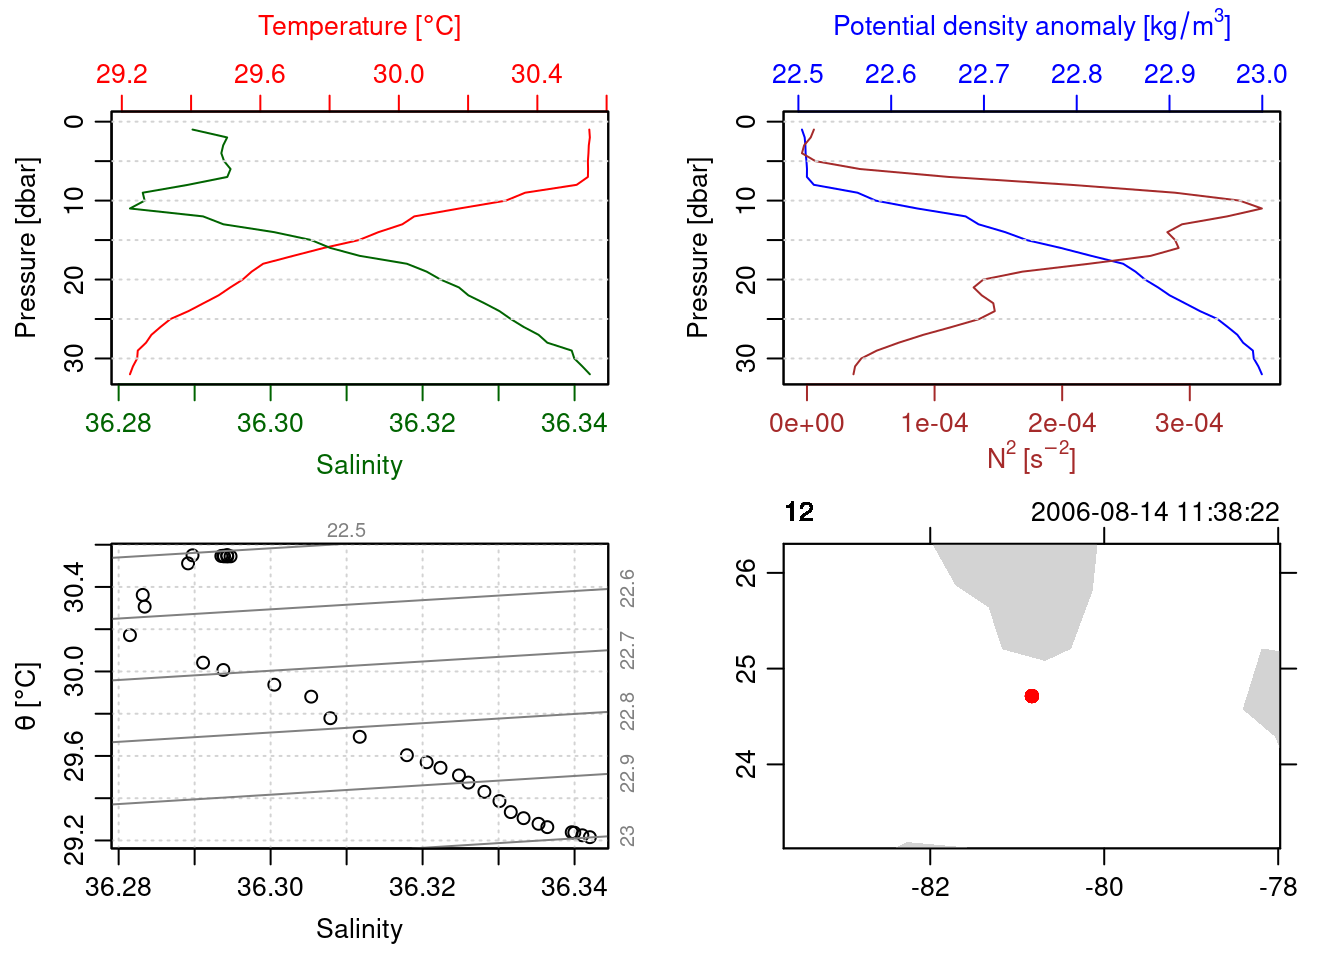
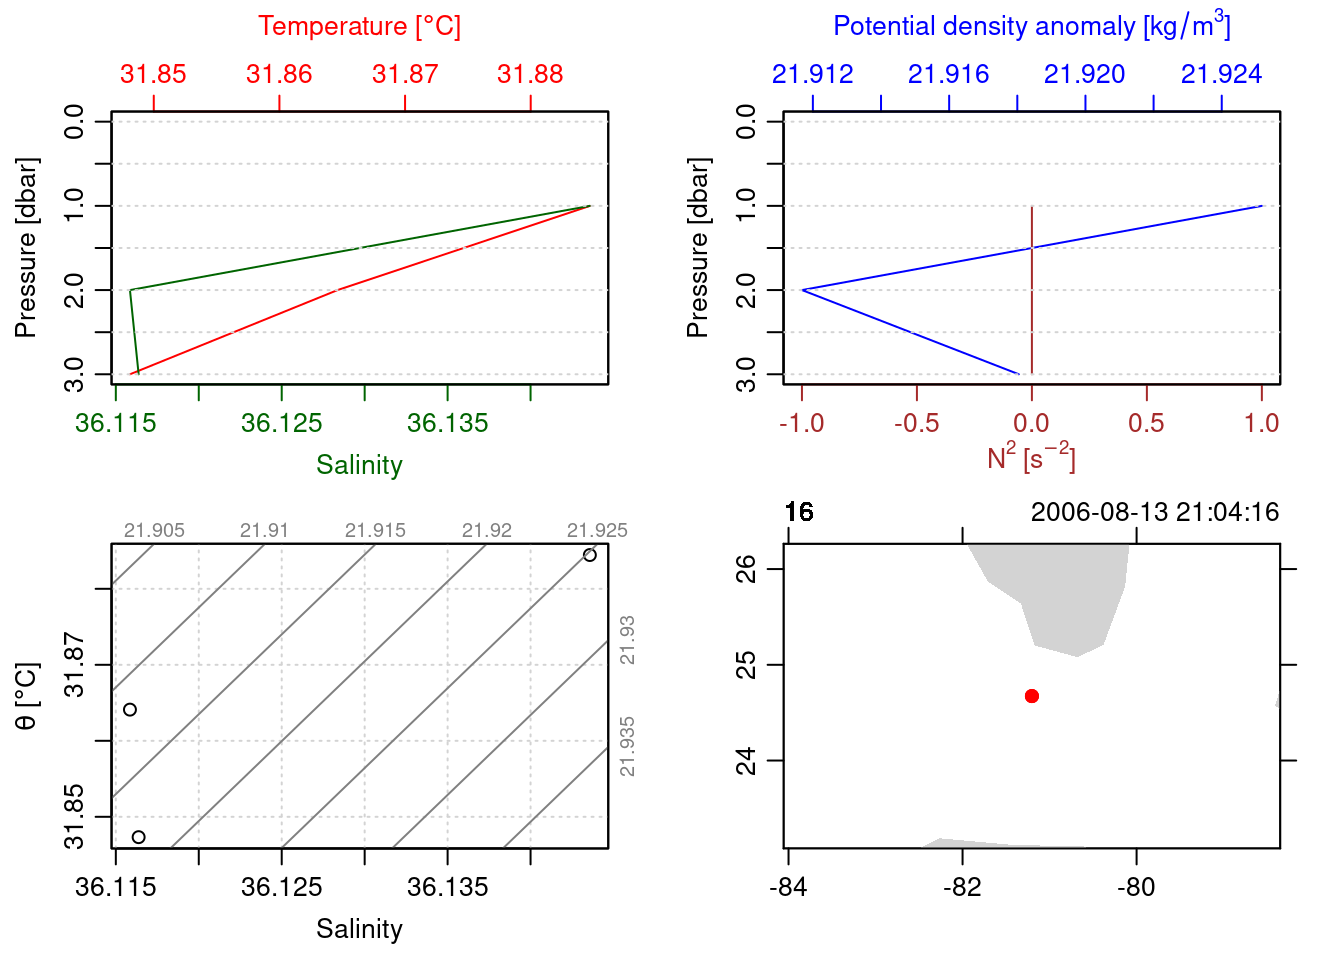
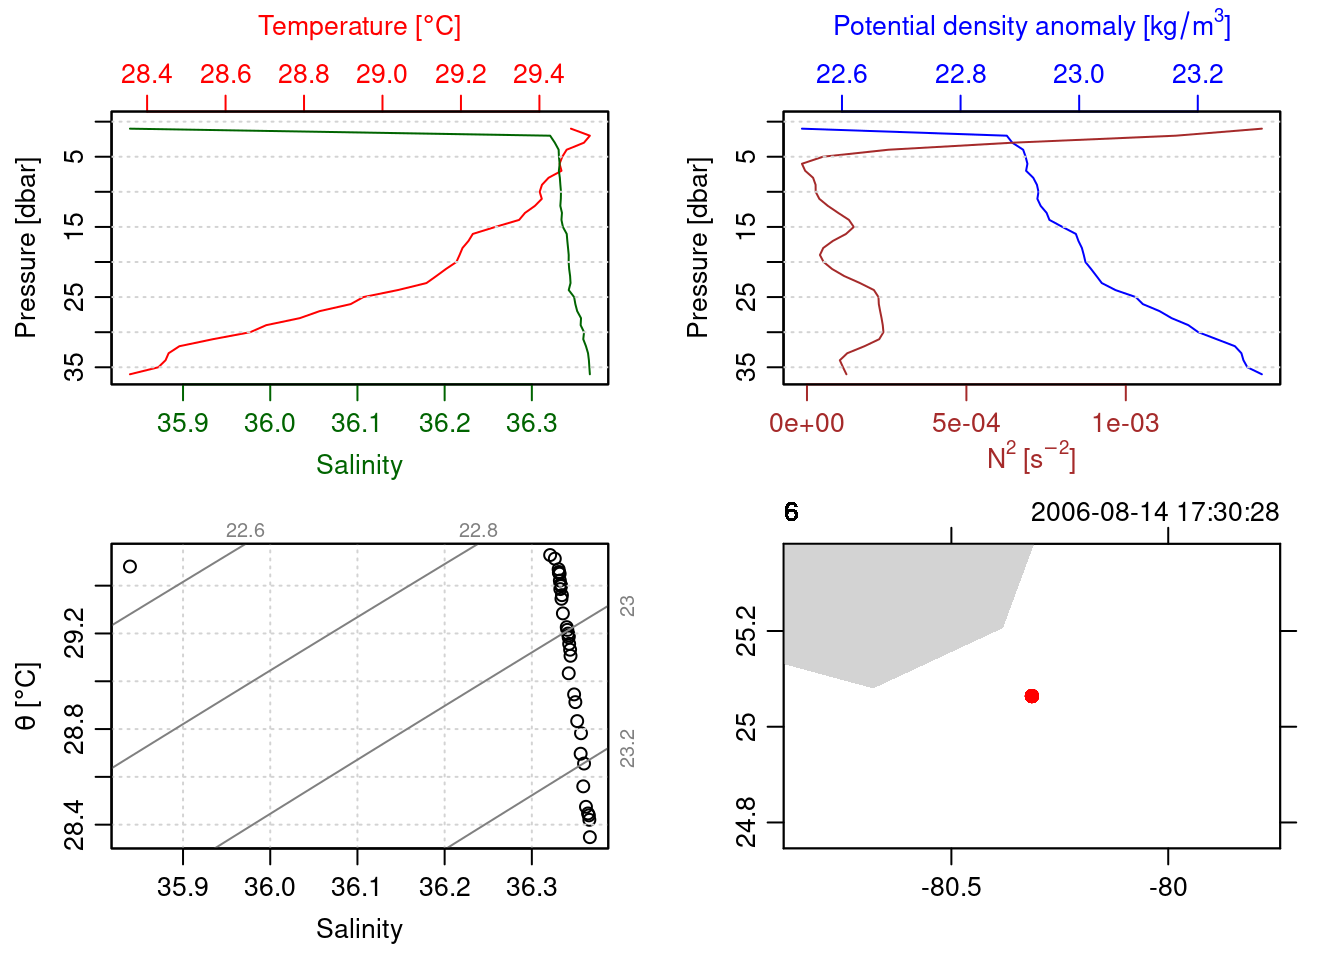
for (i inseq(ctd_FK)){ cast <- ctd_FK[[i]] # 1 is selecting only the first sublist# print(i)print(glue("=== station: {cast@metadata$station[1]}"))print(glue("# scans: {length(cast@data$scan)}"))plotScan(cast)}
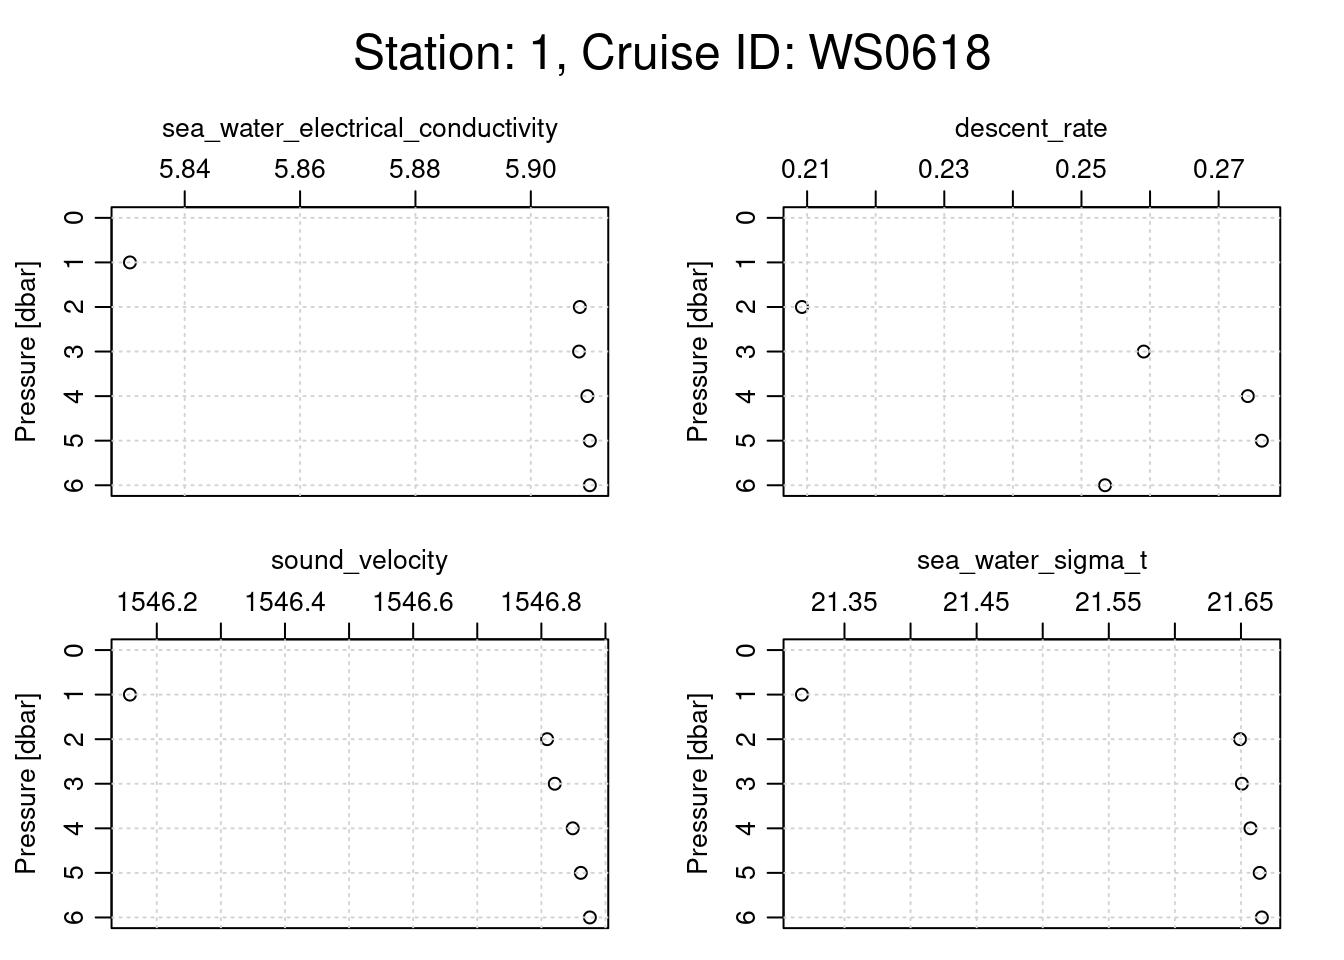
=== station: 1
# scans: 2461
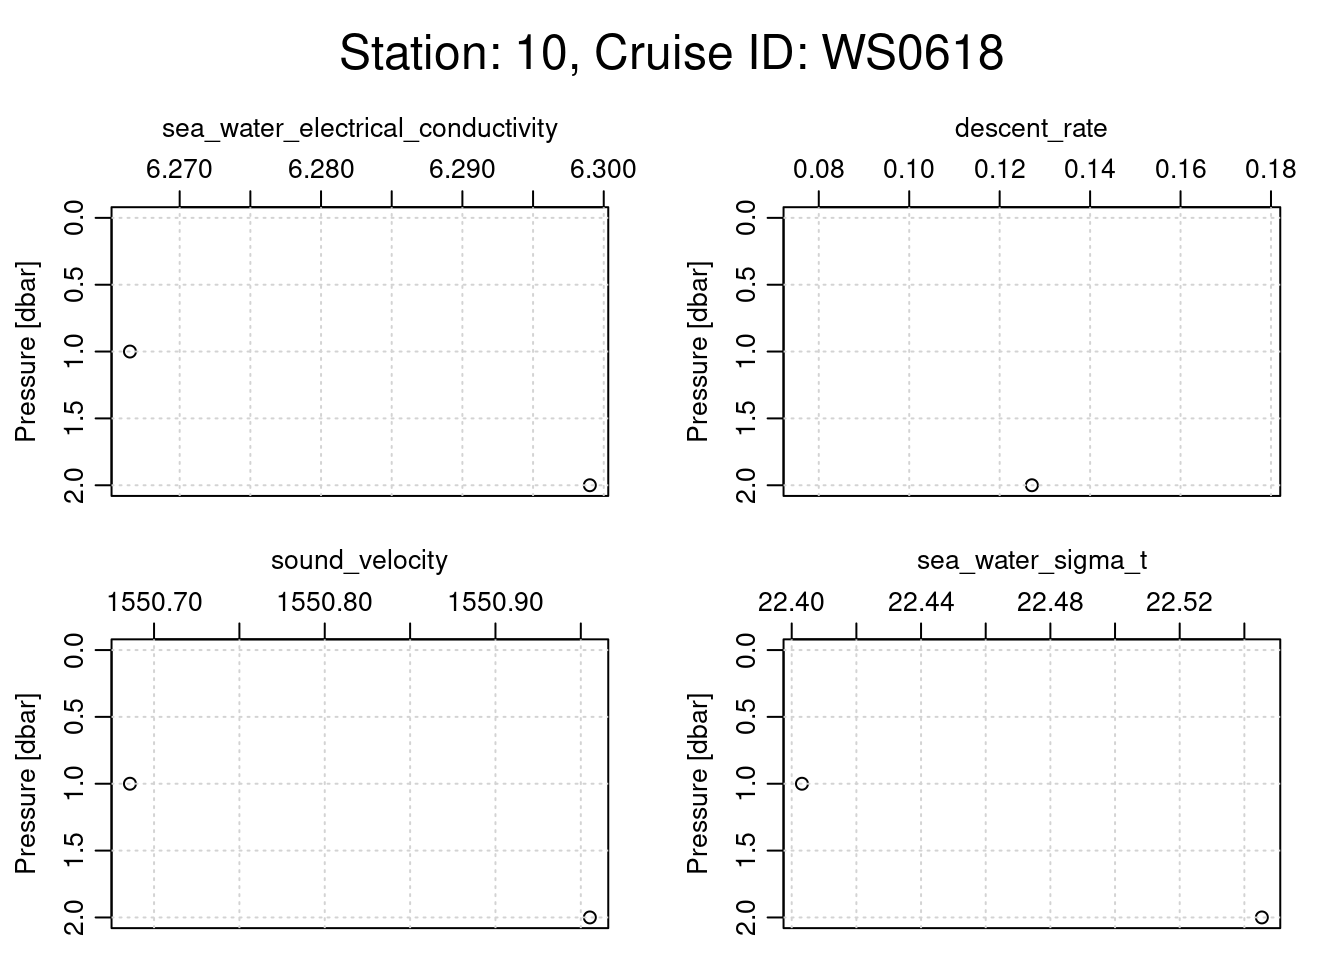
=== station: 10
# scans: 1755
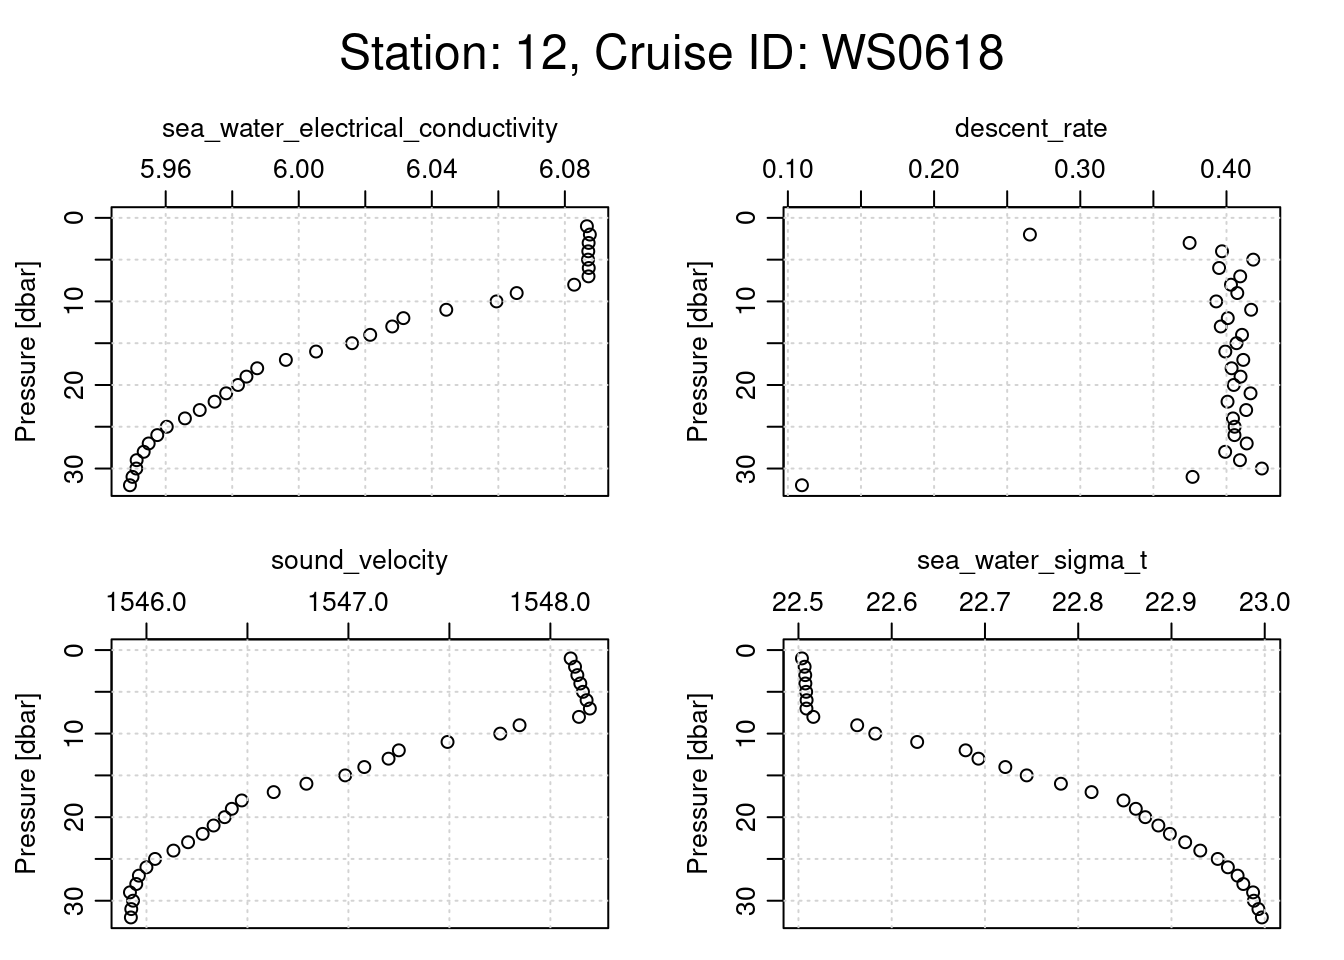
=== station: 12
# scans: 2483
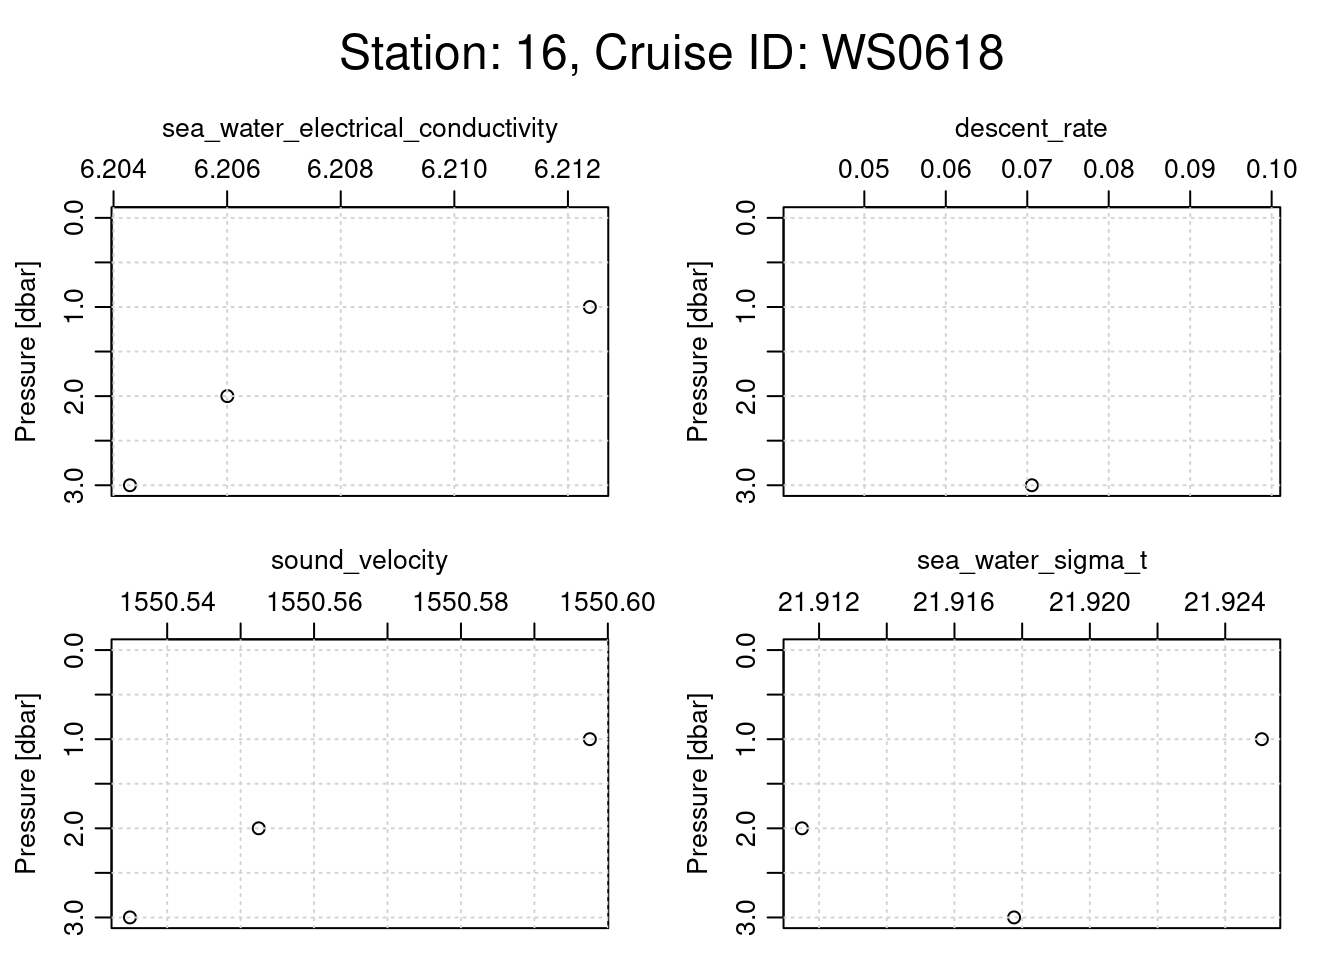
=== station: 16
# scans: 2270
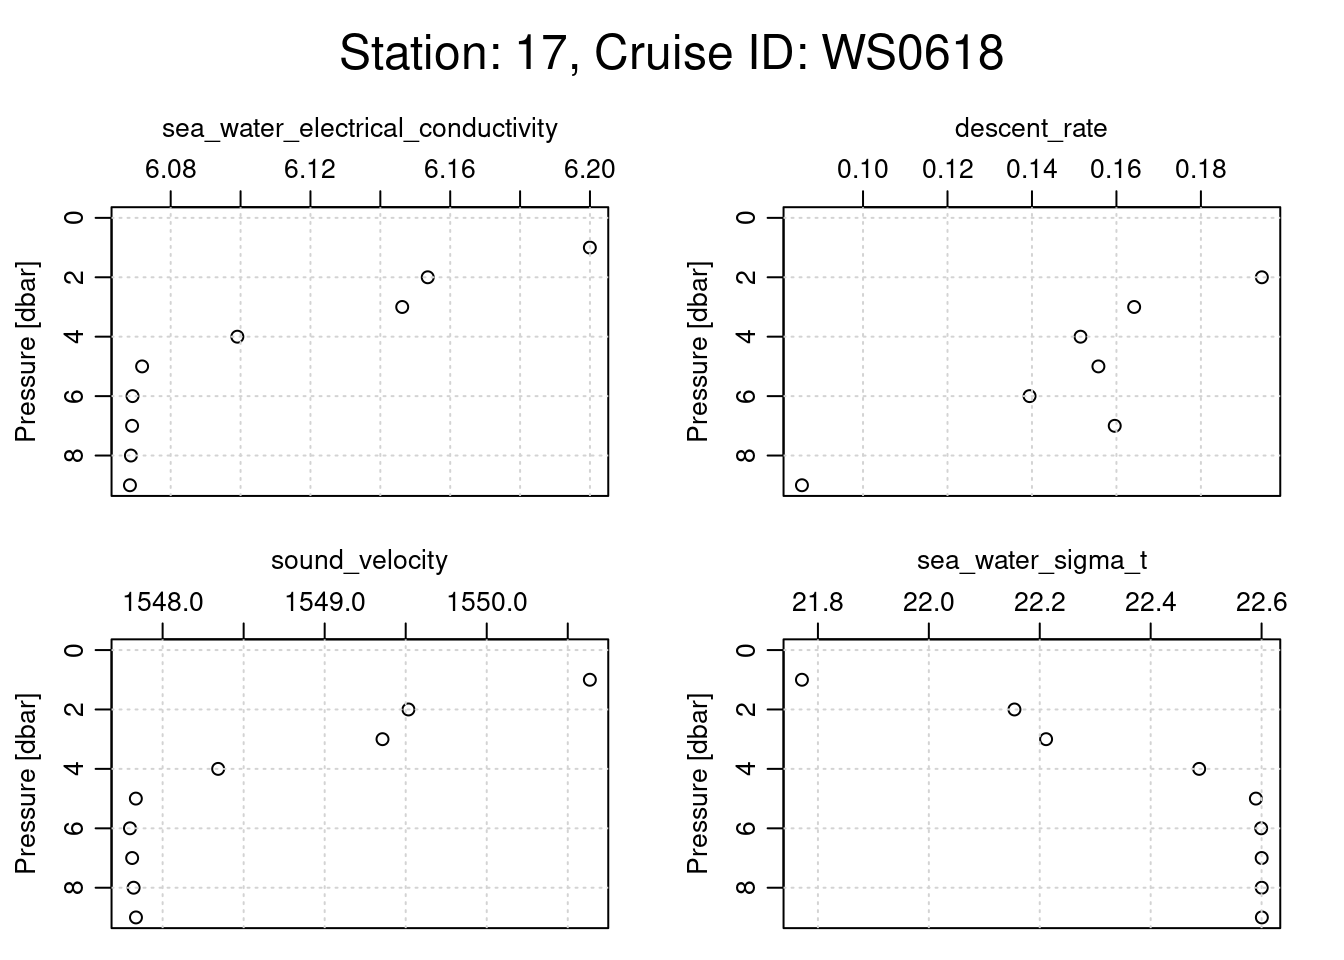
=== station: 17
# scans: 3888
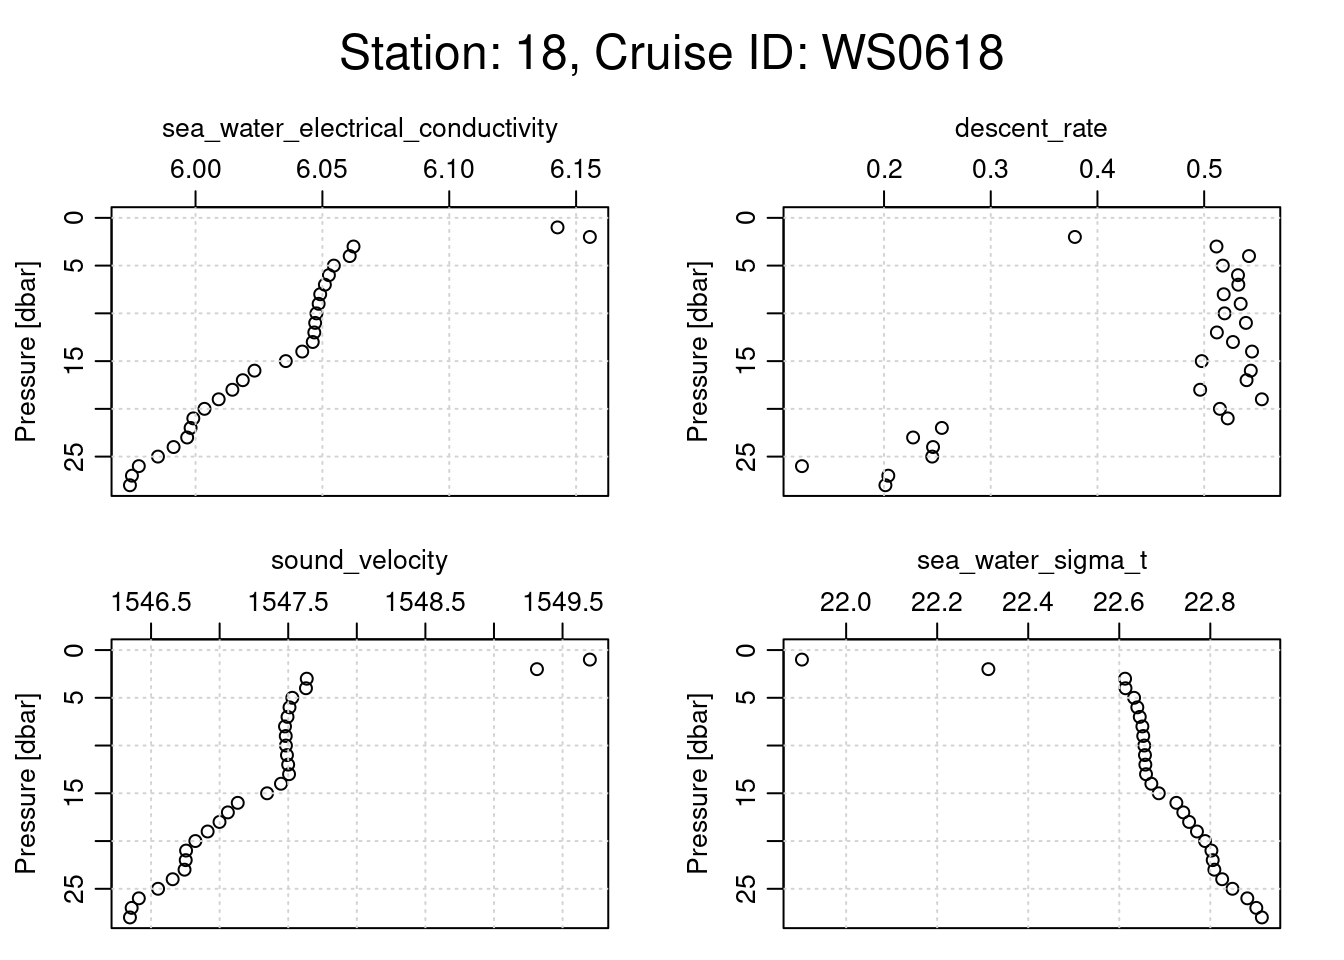
=== station: 18
# scans: 3192
=== station: 19
# scans: 2231
=== station: 20
# scans: 3079
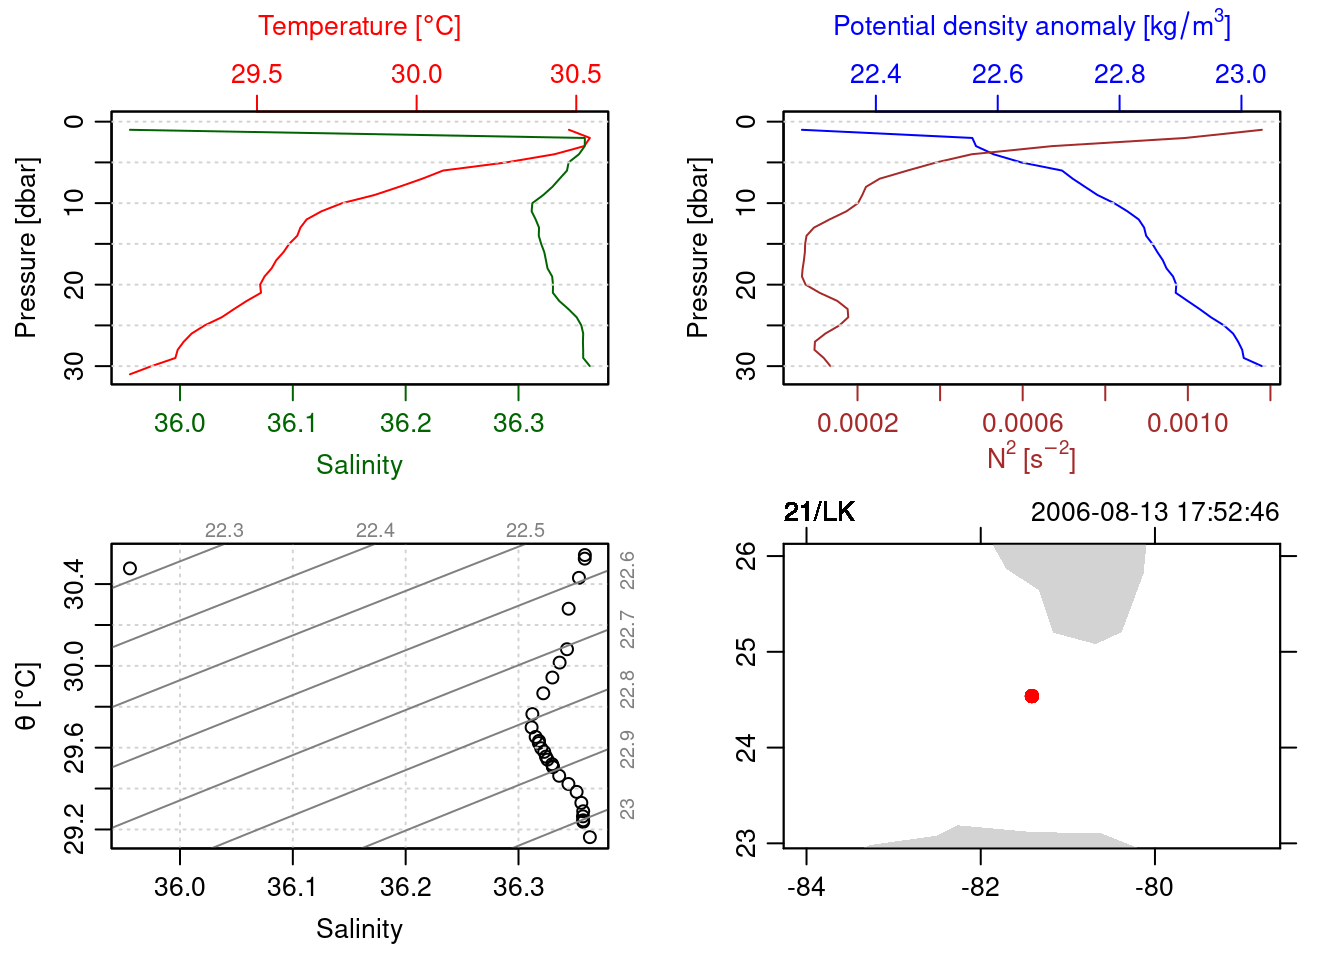
=== station: 21
# scans: 3863
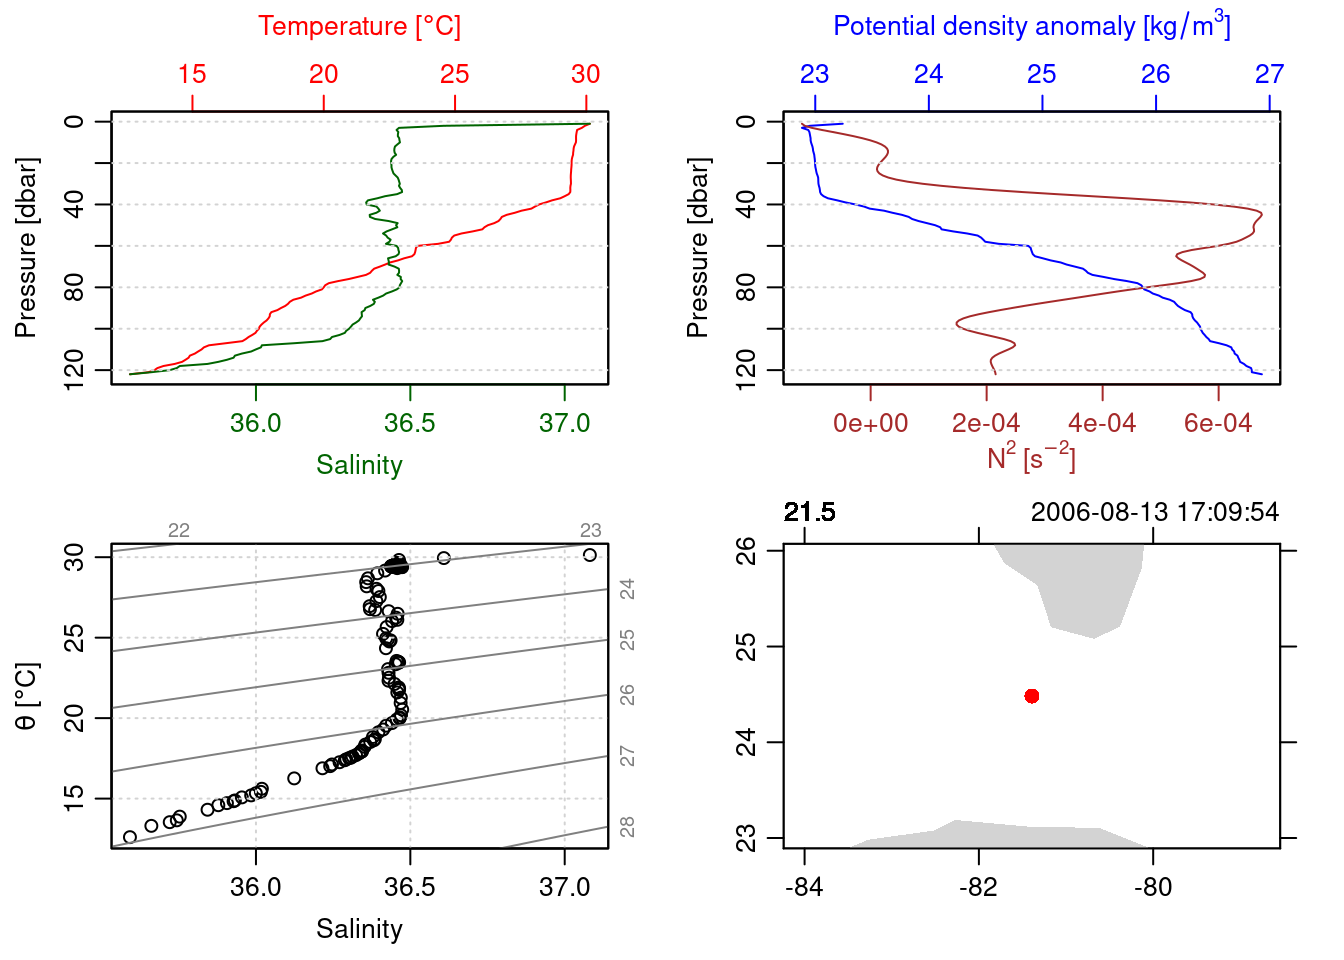
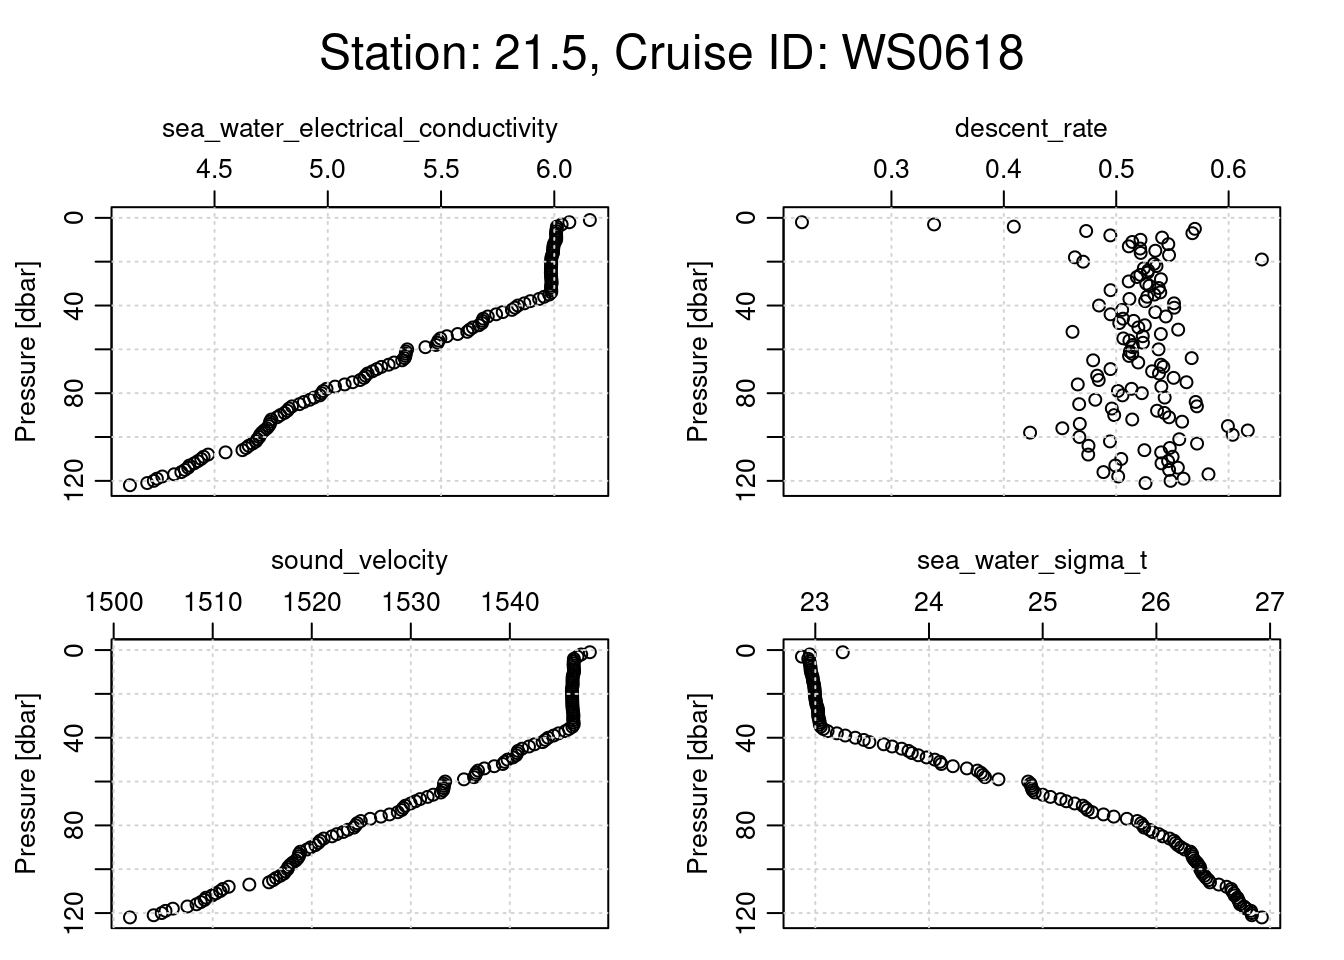
=== station: 21.5
# scans: 8325
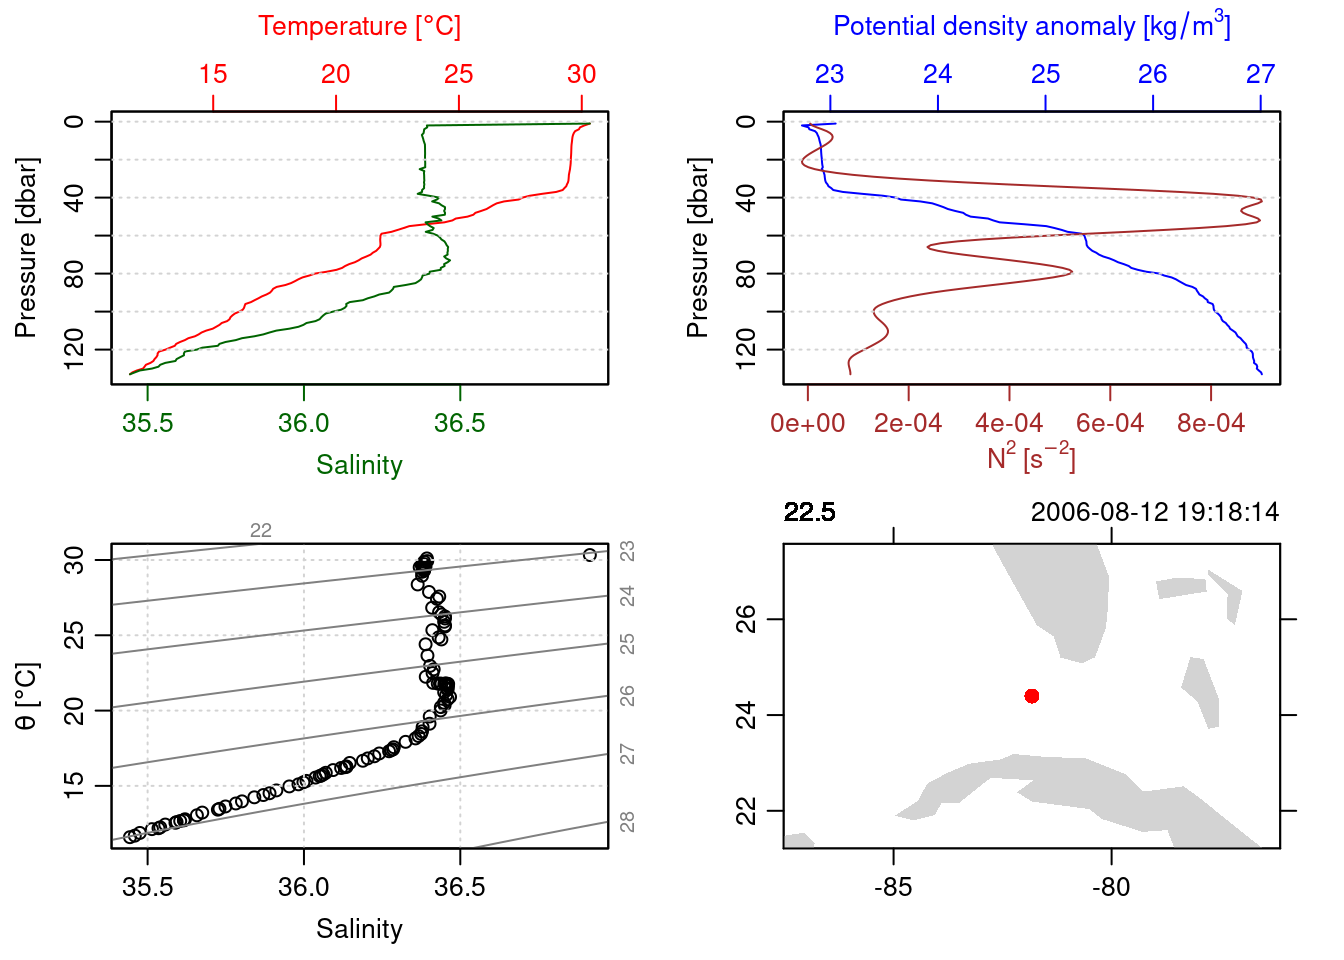
=== station: 22.5
# scans: 7788
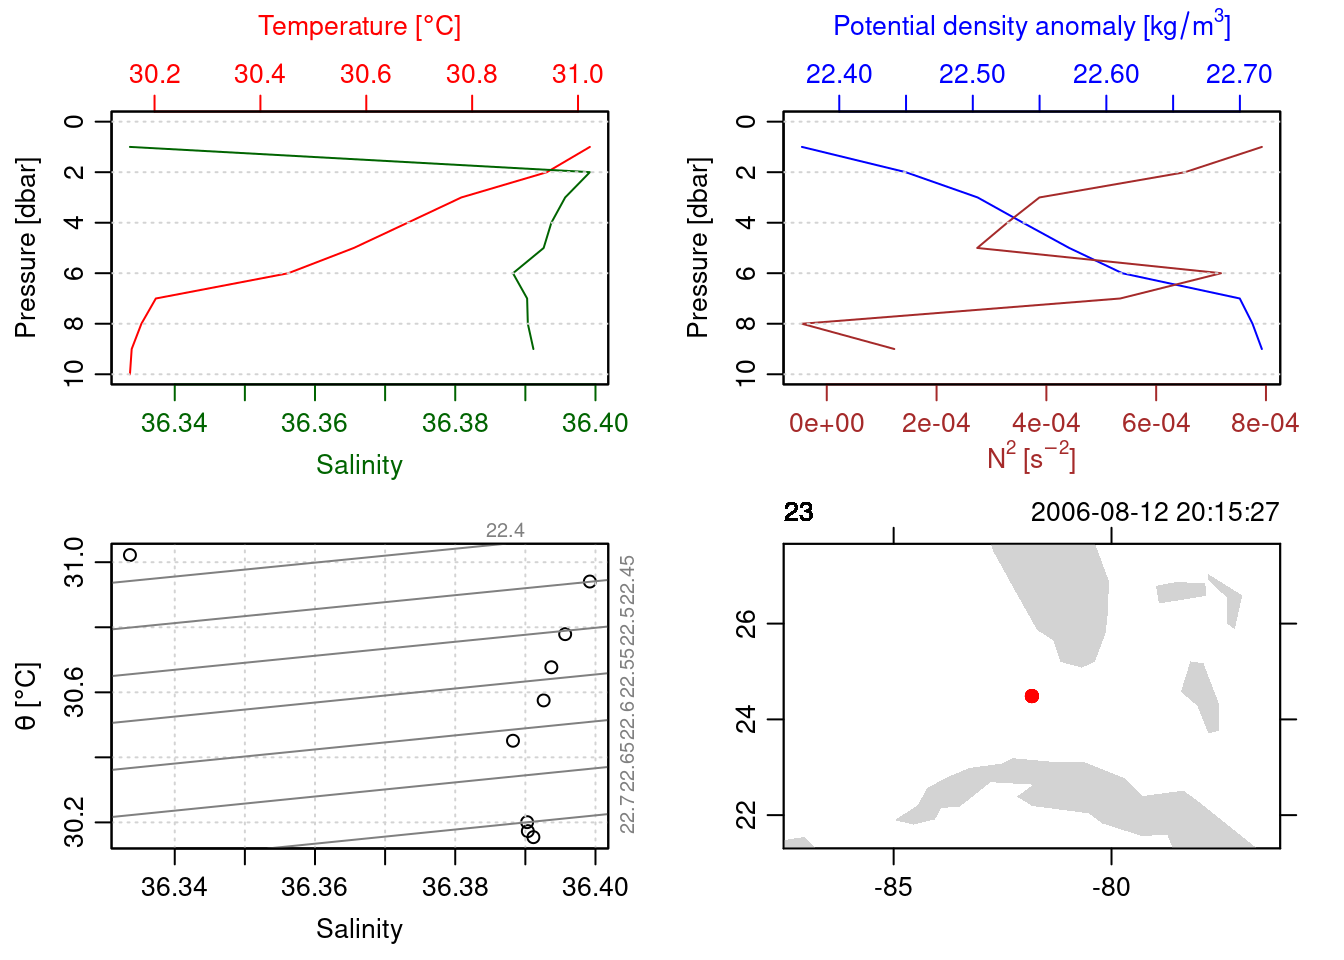
=== station: 23
# scans: 2471
=== station: 24
# scans: 2205
=== station: 25.5
# scans: 13216
=== station: 27
# scans: 4111
=== station: 28
# scans: 2983
=== station: 29
# scans: 3485
=== station: 3
# scans: 4005
=== station: 30
# scans: 3251
=== station: 31
# scans: 2549
=== station: 32
# scans: 1550
=== station: 33
# scans: 1835
=== station: 34
# scans: 2999
=== station: 39
# scans: 3588
=== station: 44
# scans: 3265
=== station: 49
# scans: 3052
=== station: 5
# scans: 1789
=== station: 50
# scans: 5310
=== station: 53
# scans: 2513
=== station: 54
# scans: 2750
=== station: 56
# scans: 2870
=== station: 58
# scans: 895
=== station: 6
# scans: 4260
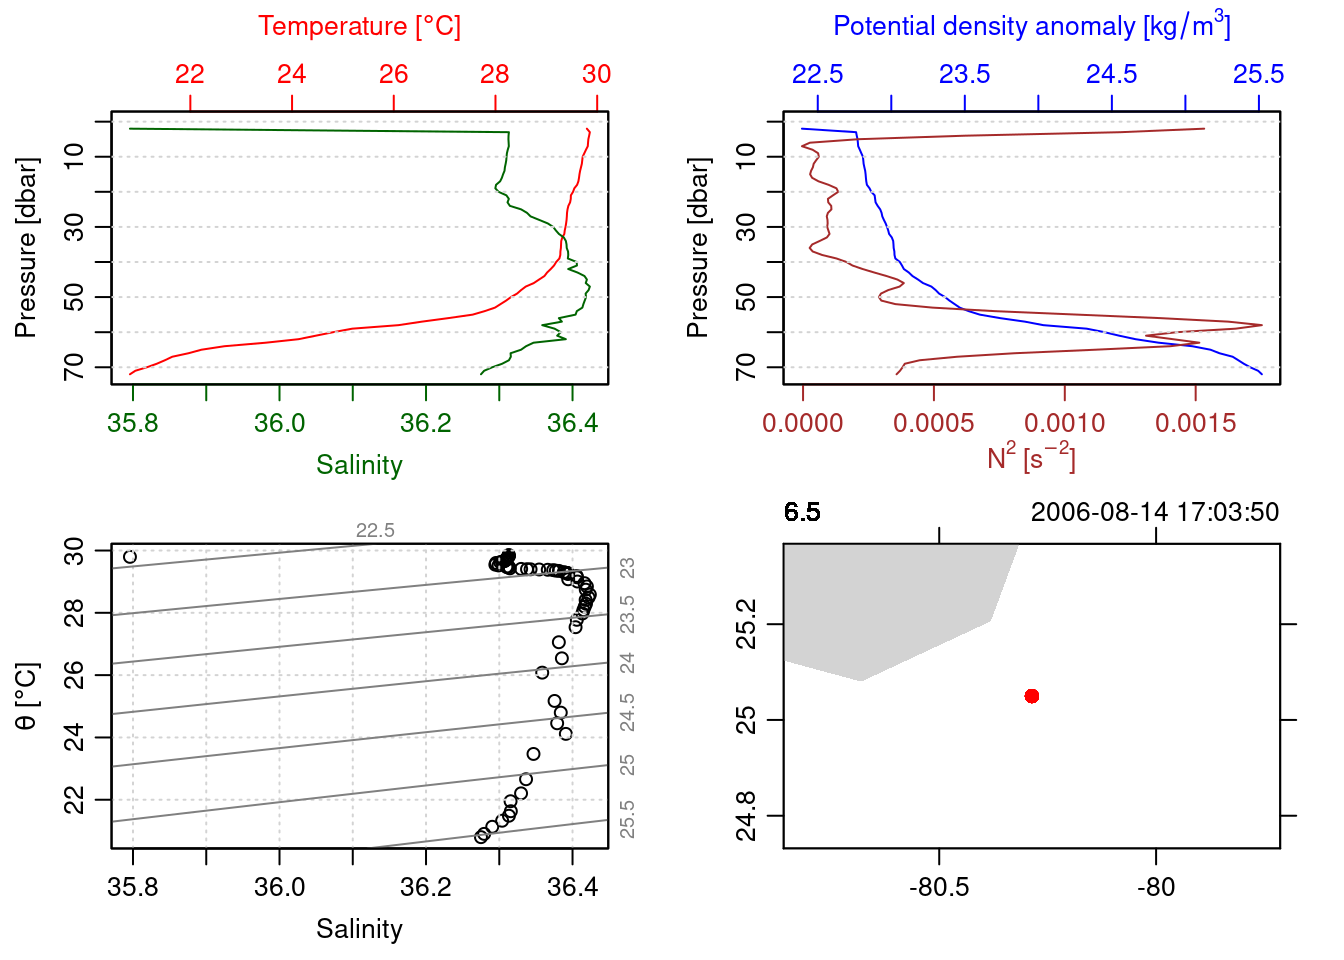
=== station: 6.5
# scans: 5552
=== station: 60
# scans: 1980
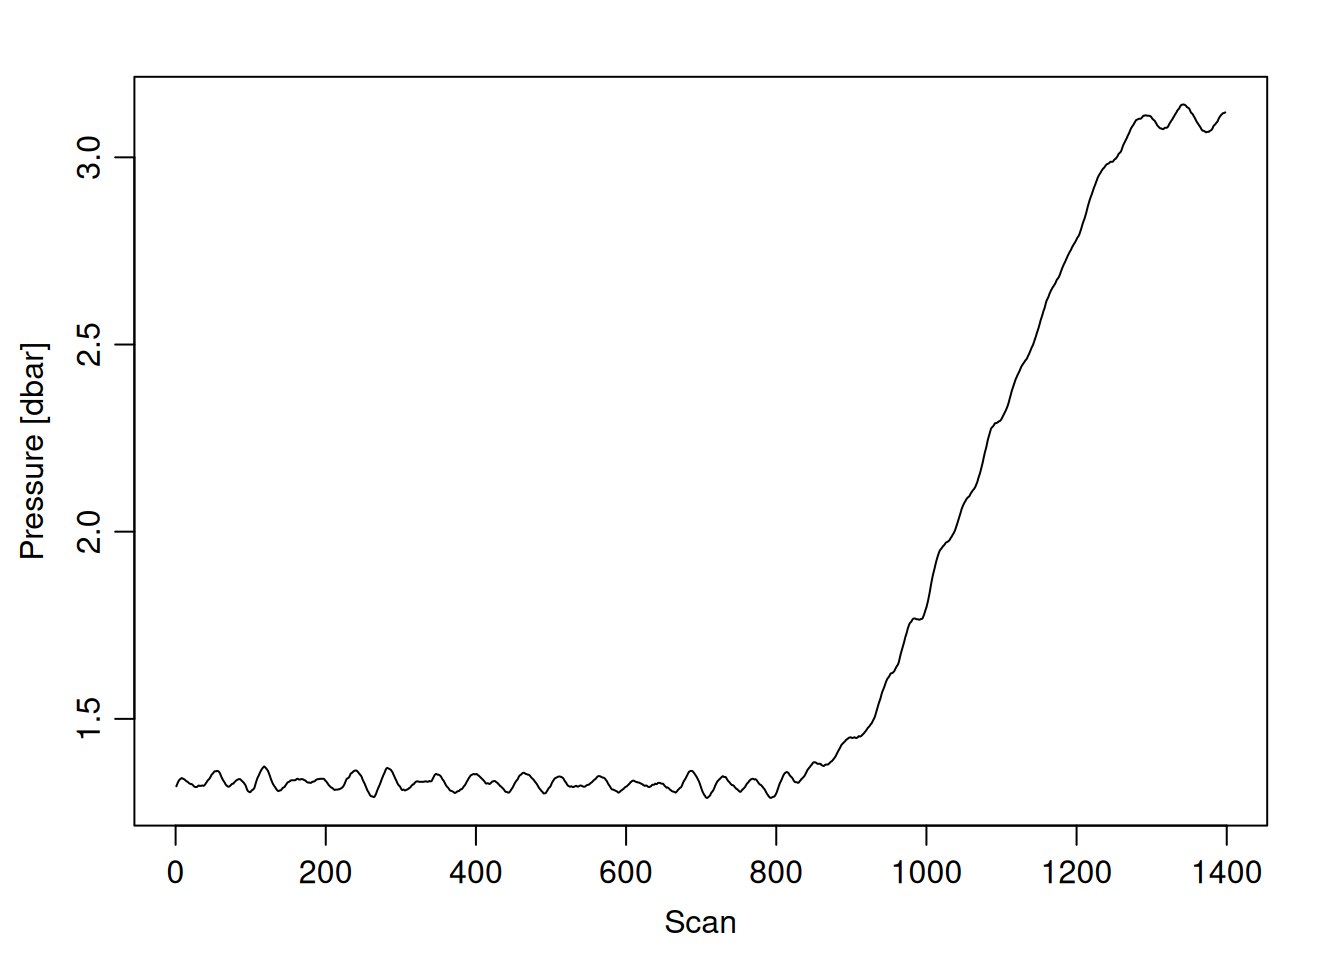
=== station: 68
# scans: 1398
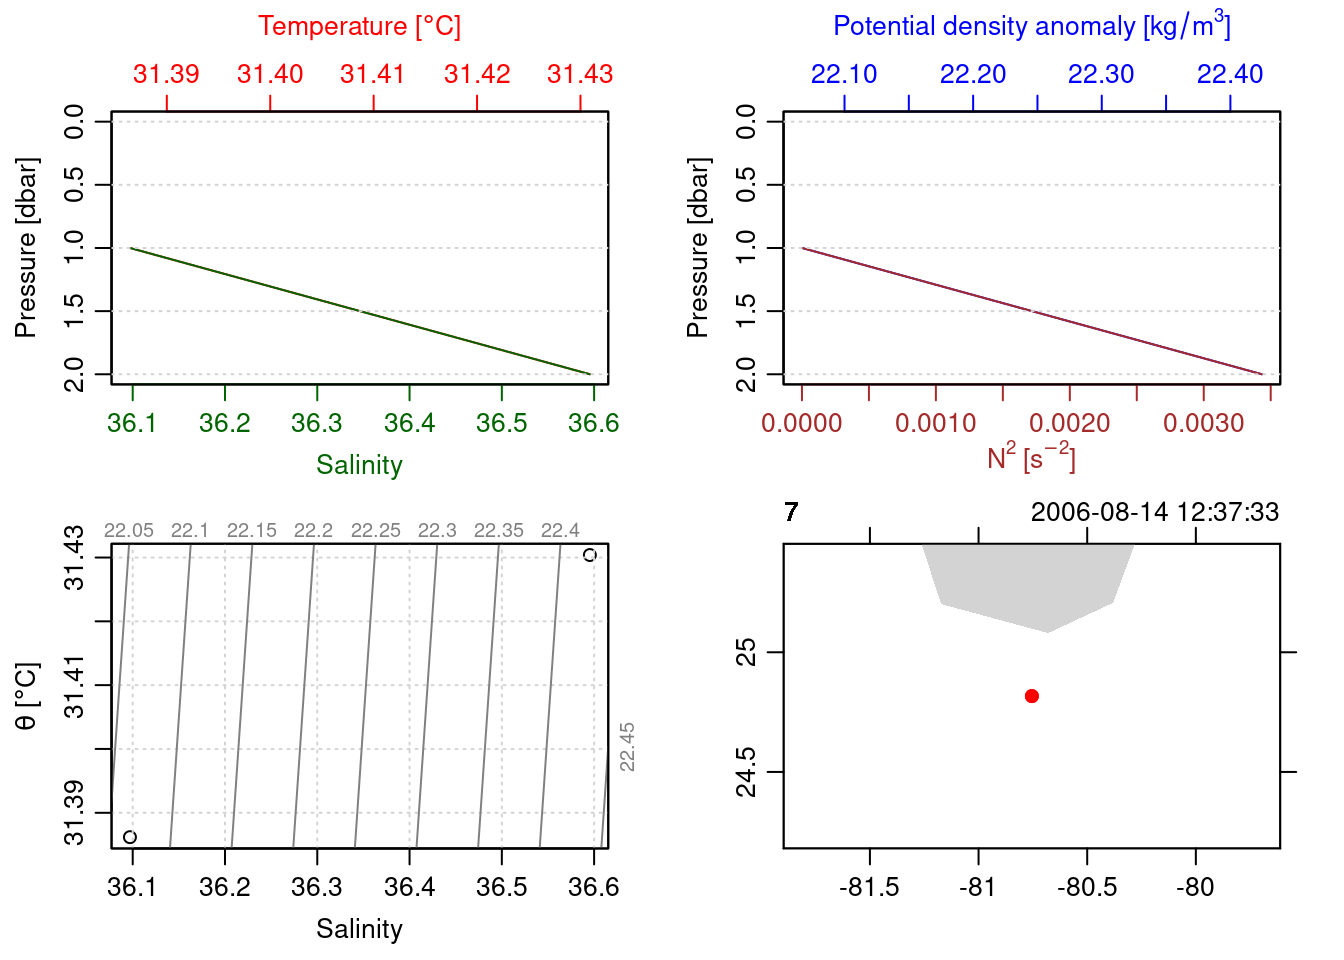
=== station: 7
# scans: 1656
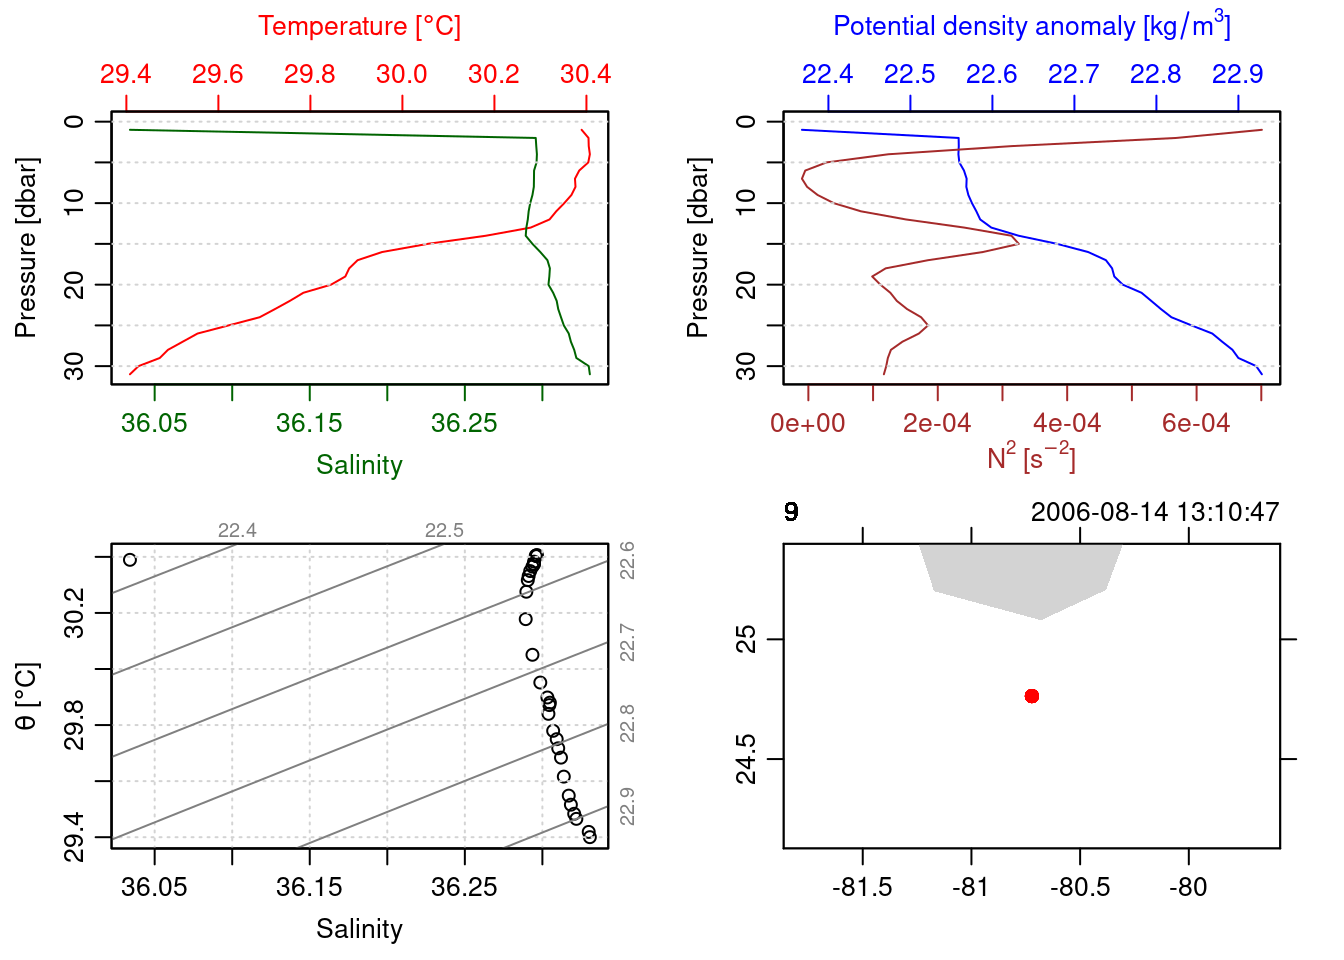
=== station: 9
# scans: 3349
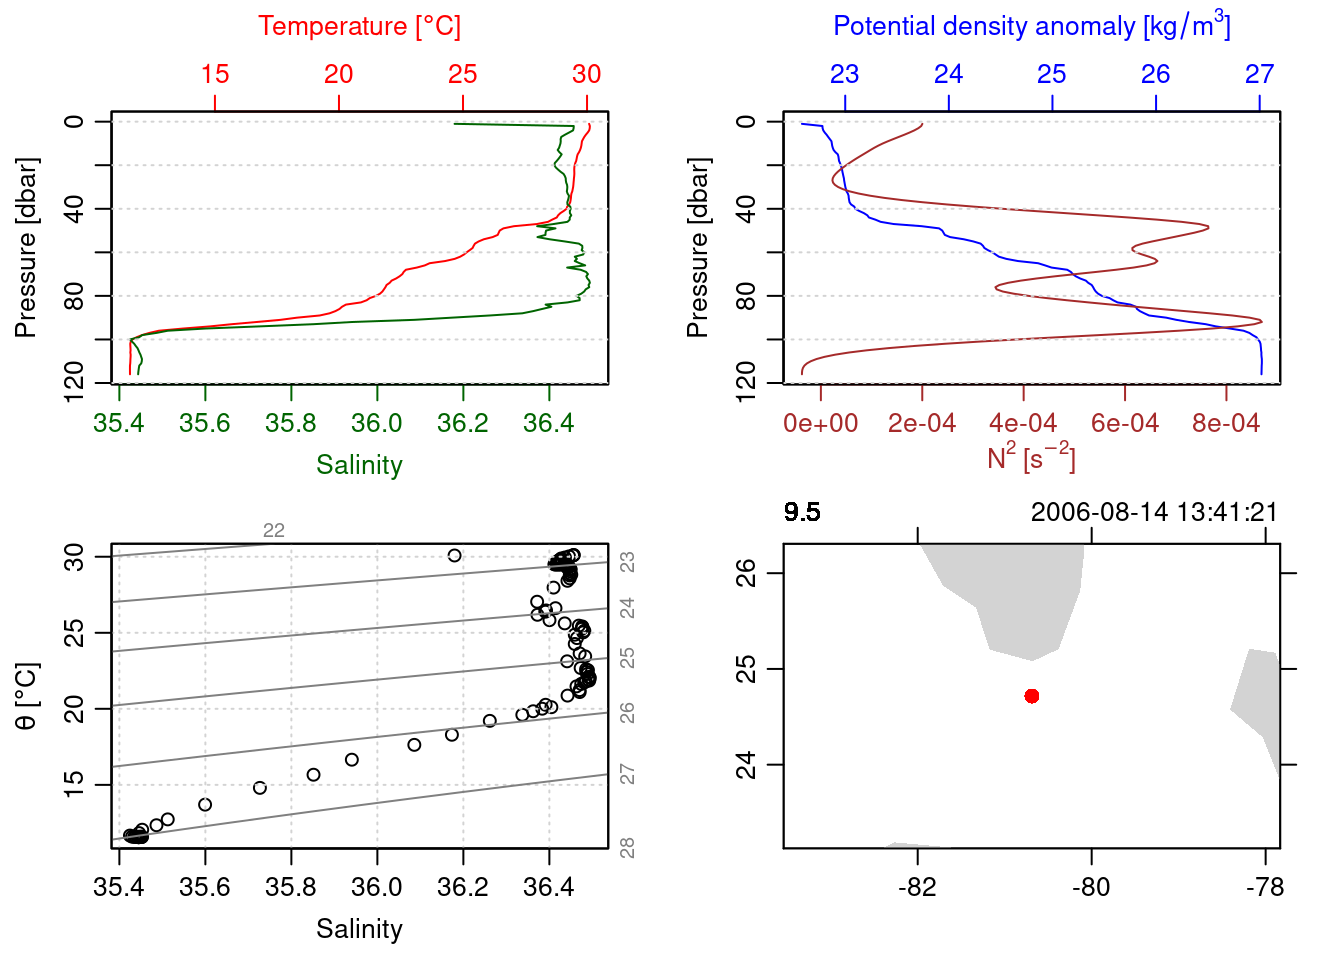
=== station: 9.5
# scans: 6905
=== station: CAL1
# scans: 3339
=== station: CAL5
# scans: 3990
=== station: CH2
# scans: 4880
=== station: CH5
# scans: 5026
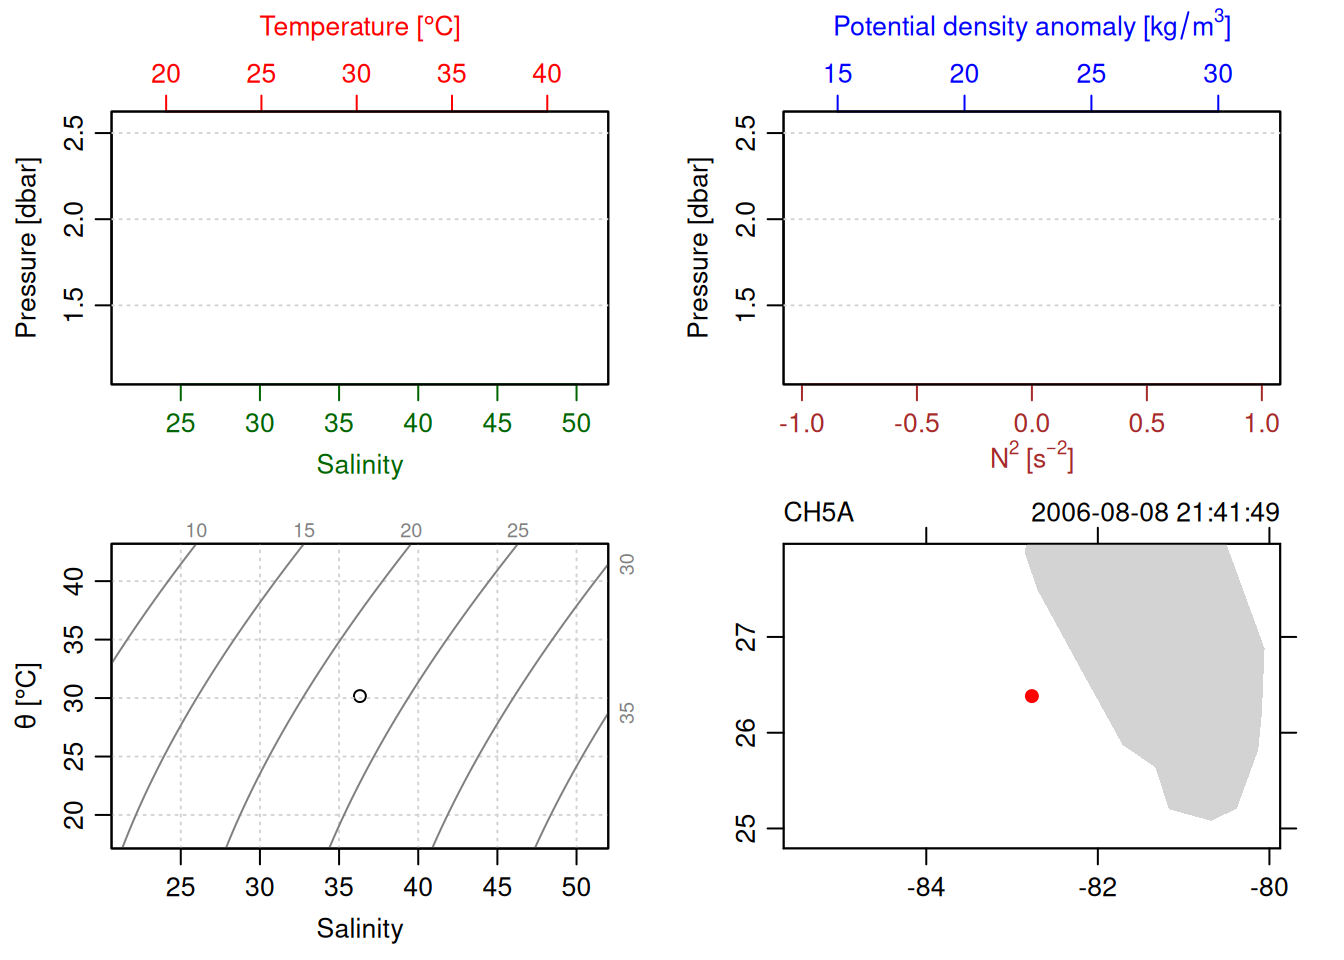
=== station: CH5A
# scans: 1
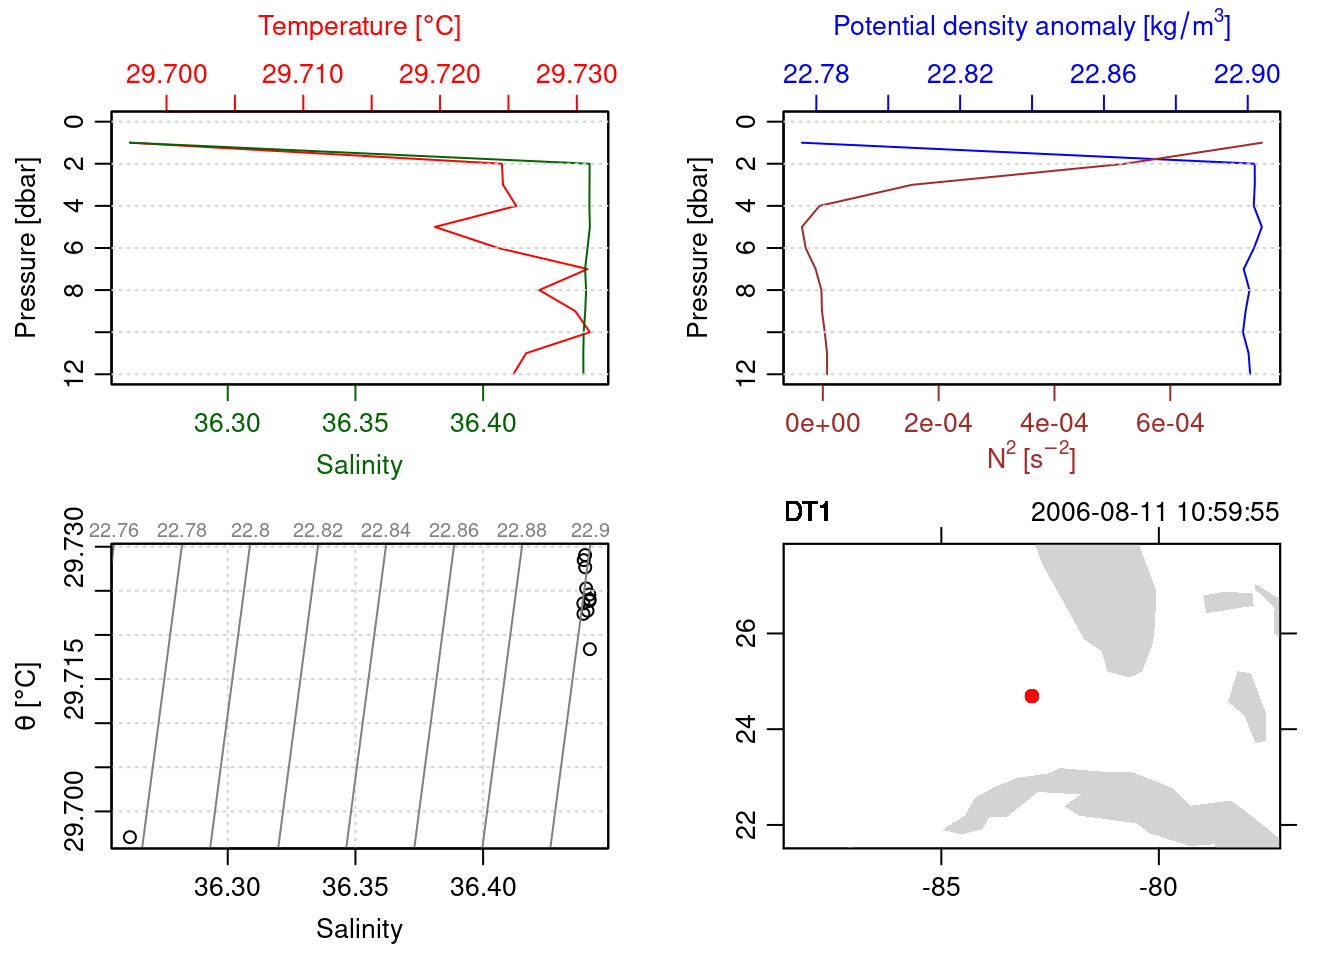
=== station: DT1
# scans: 2752
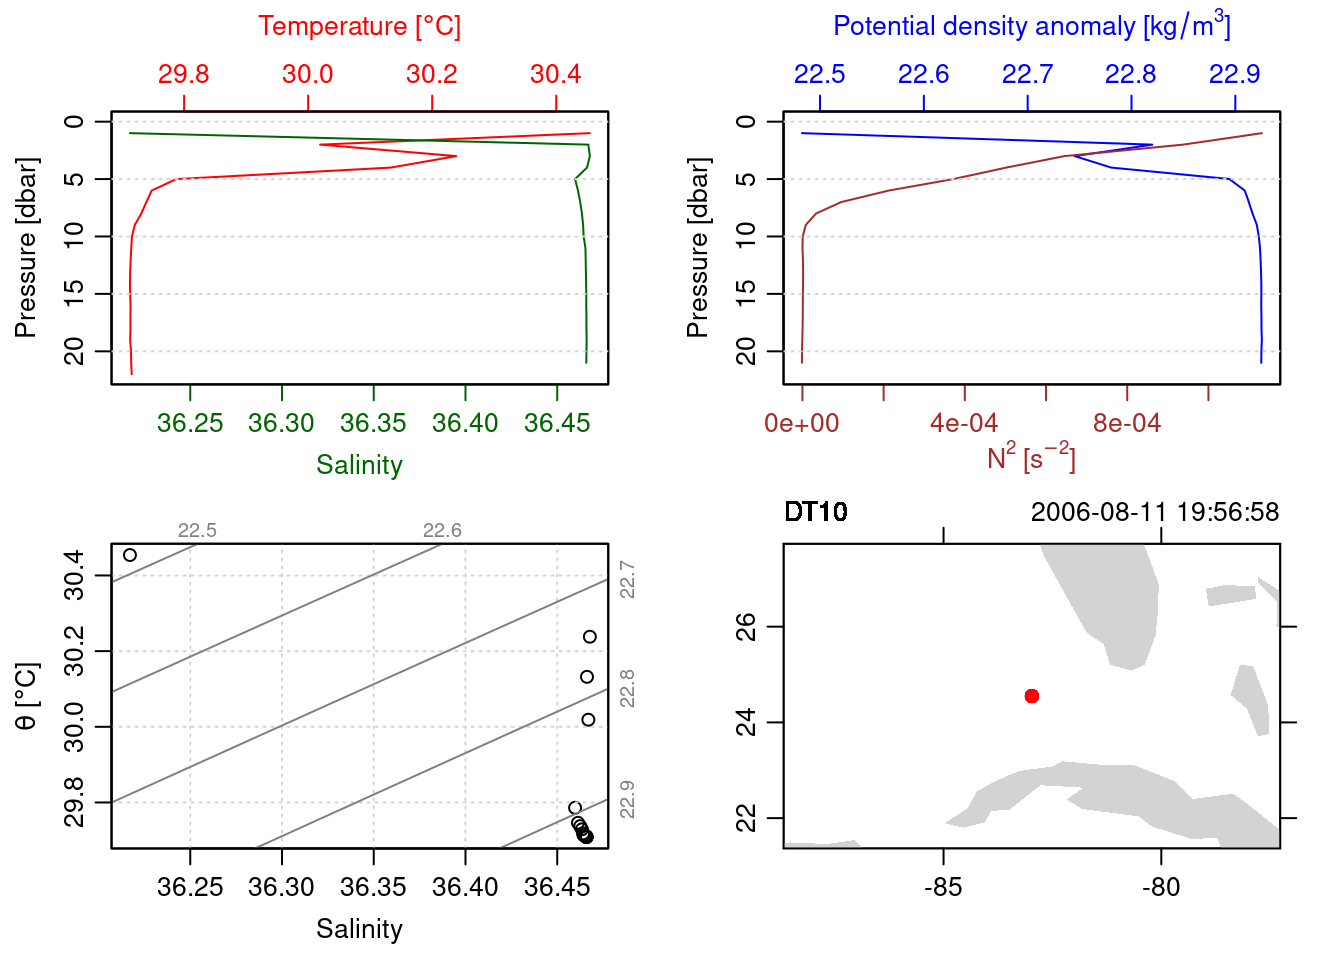
=== station: DT10
# scans: 3314
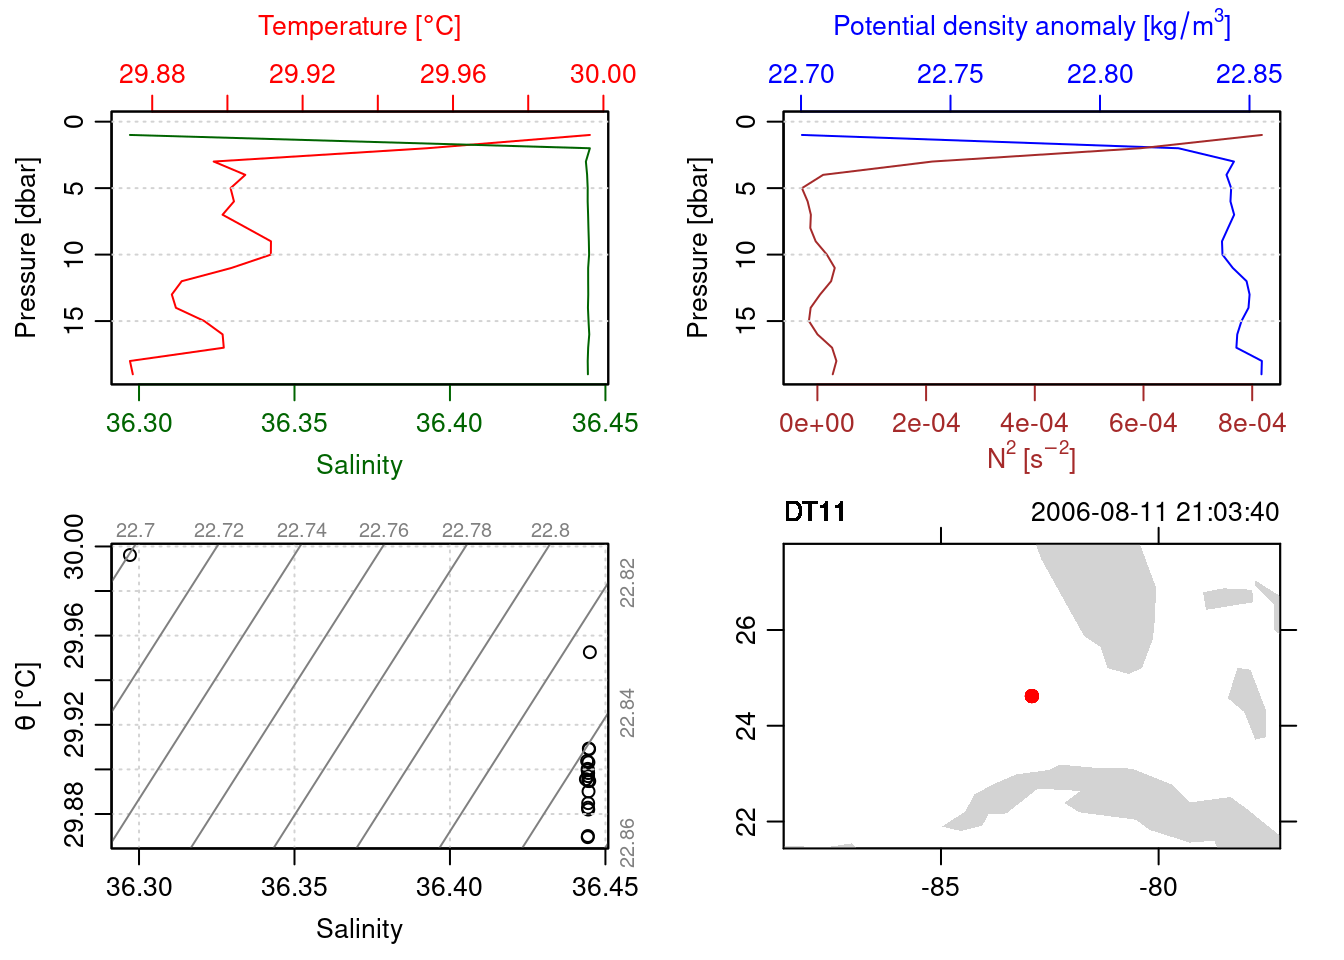
=== station: DT11
# scans: 4356
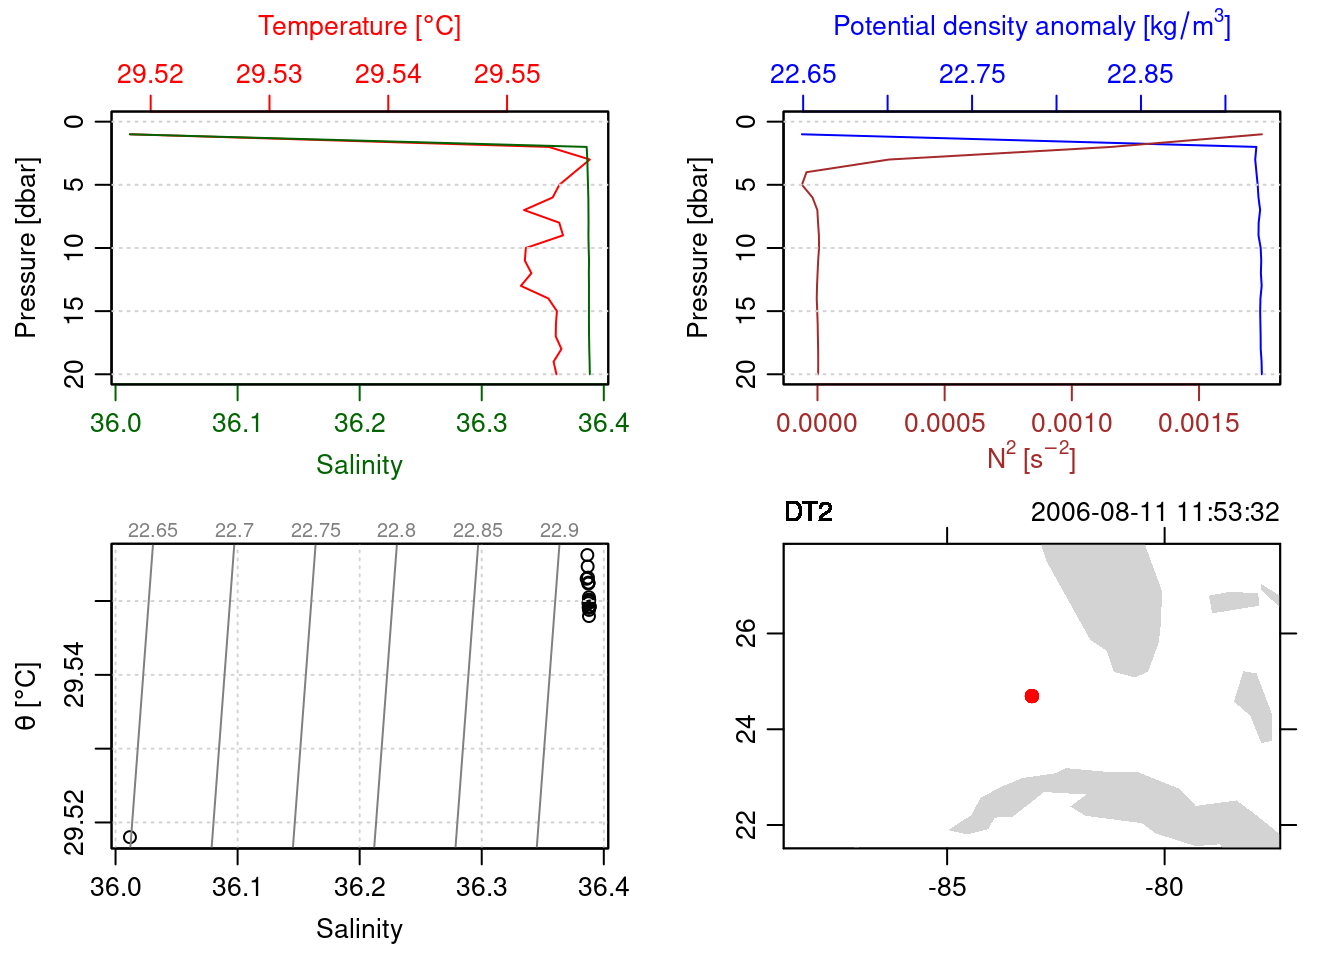
=== station: DT2
# scans: 2072
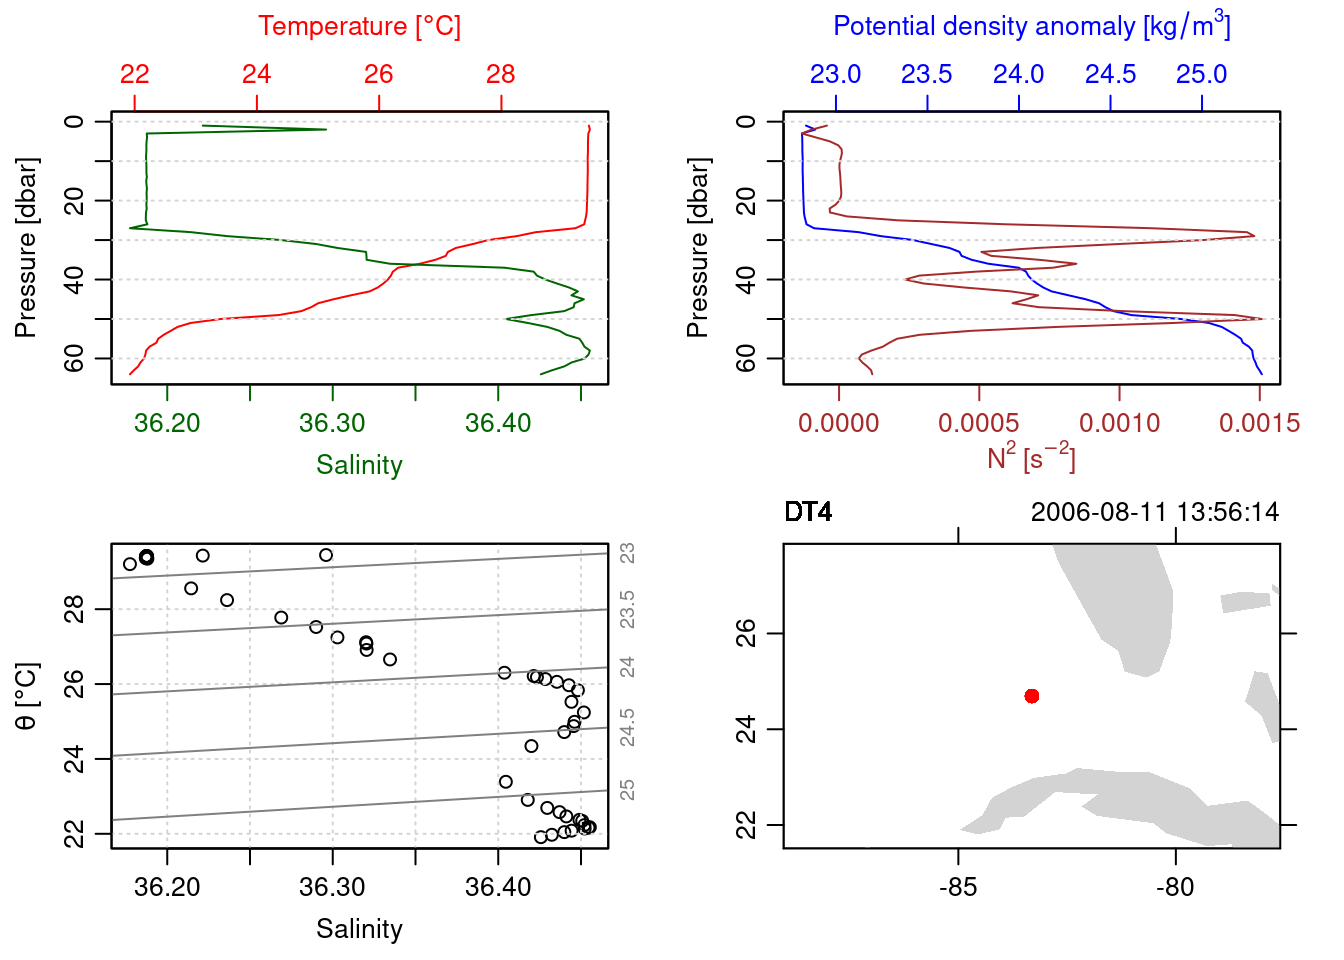
=== station: DT4
# scans: 4815
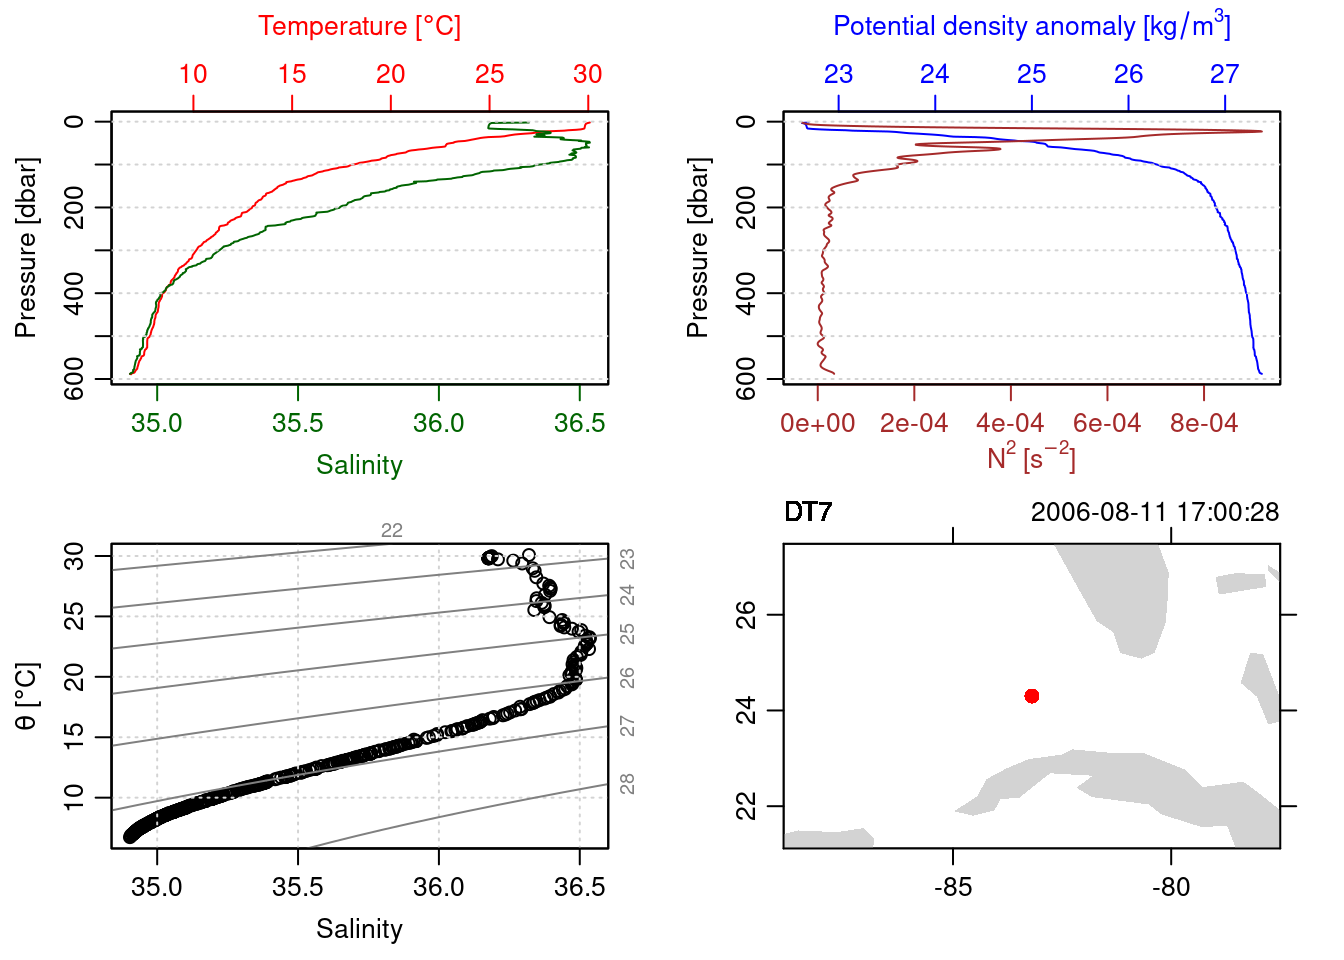
=== station: DT7
# scans: 19906
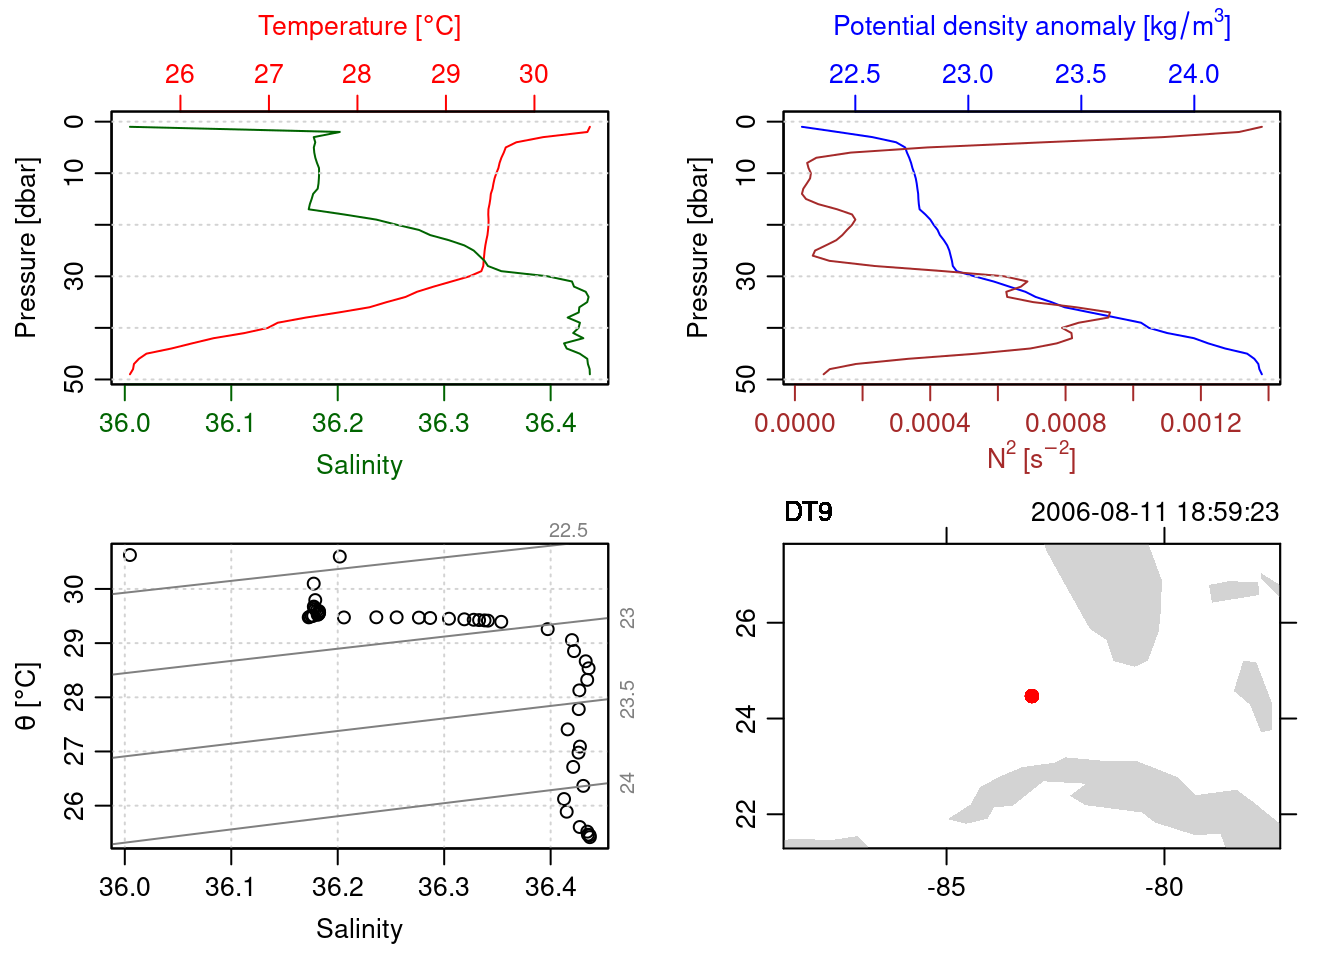
=== station: DT9
# scans: 4678
plotting each cast in the first list
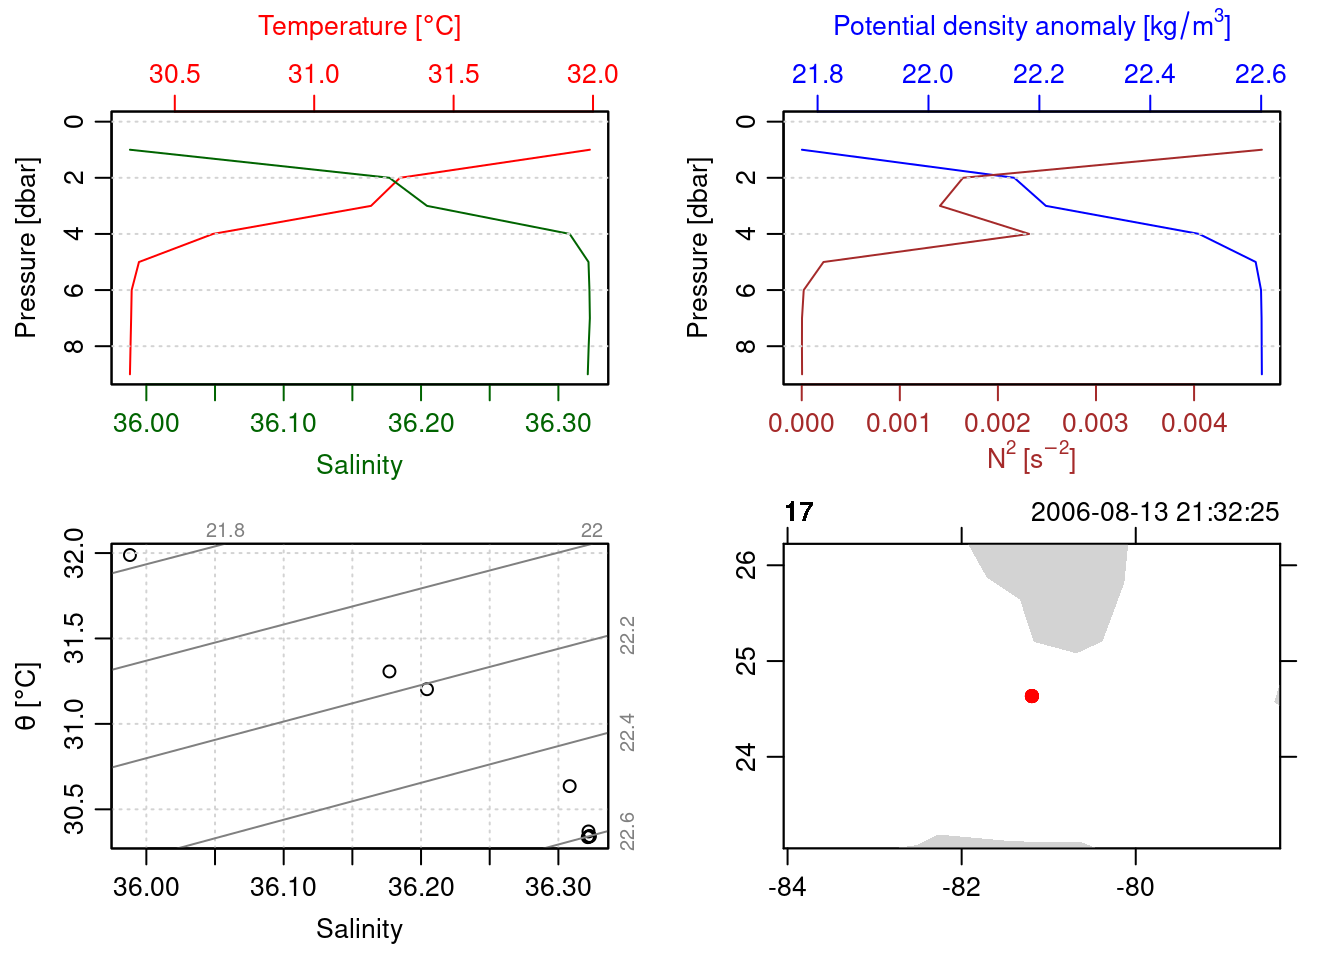
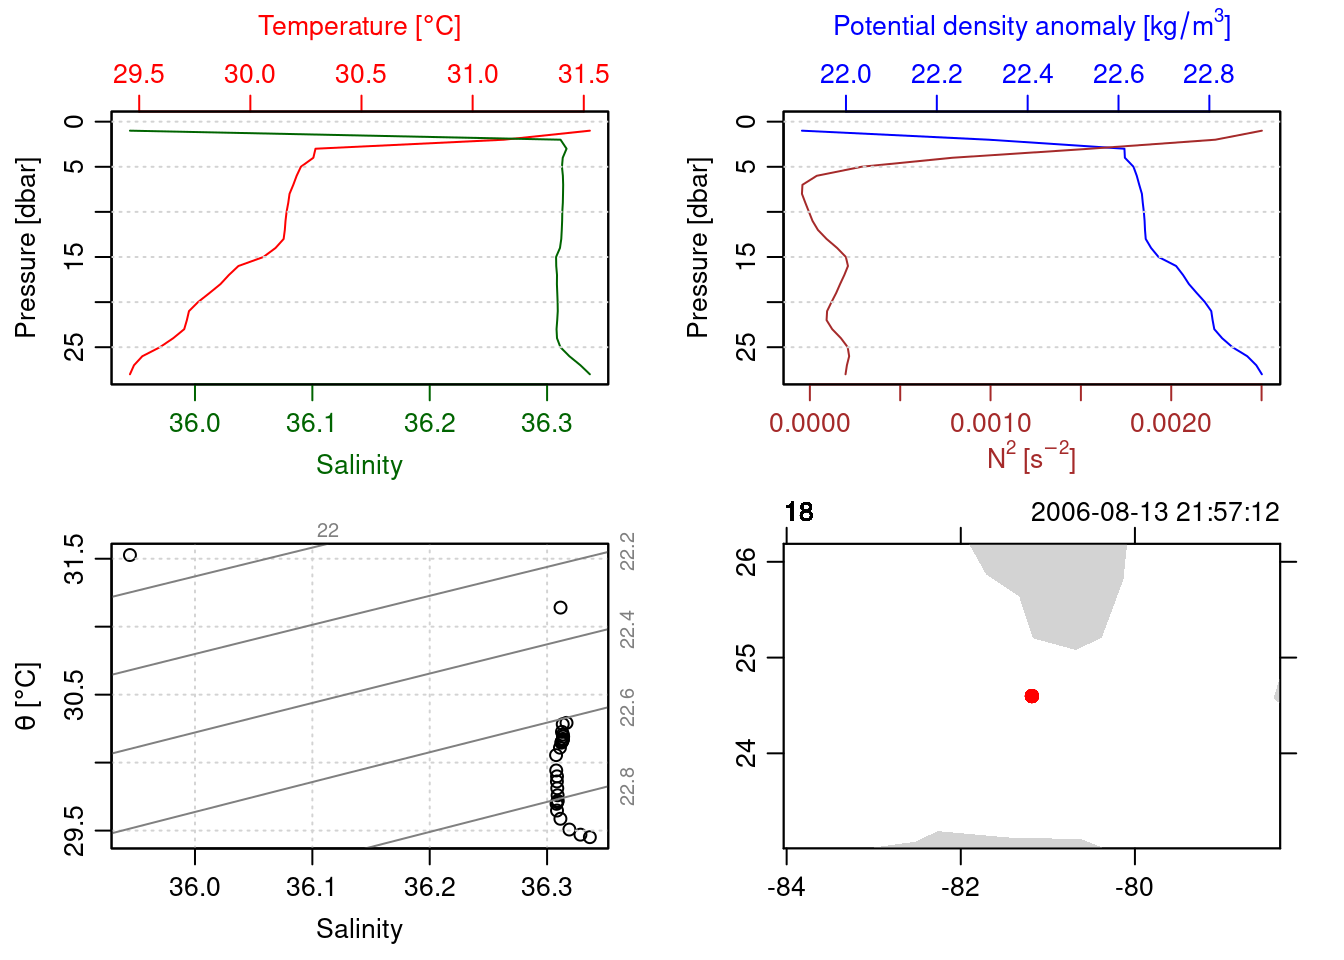
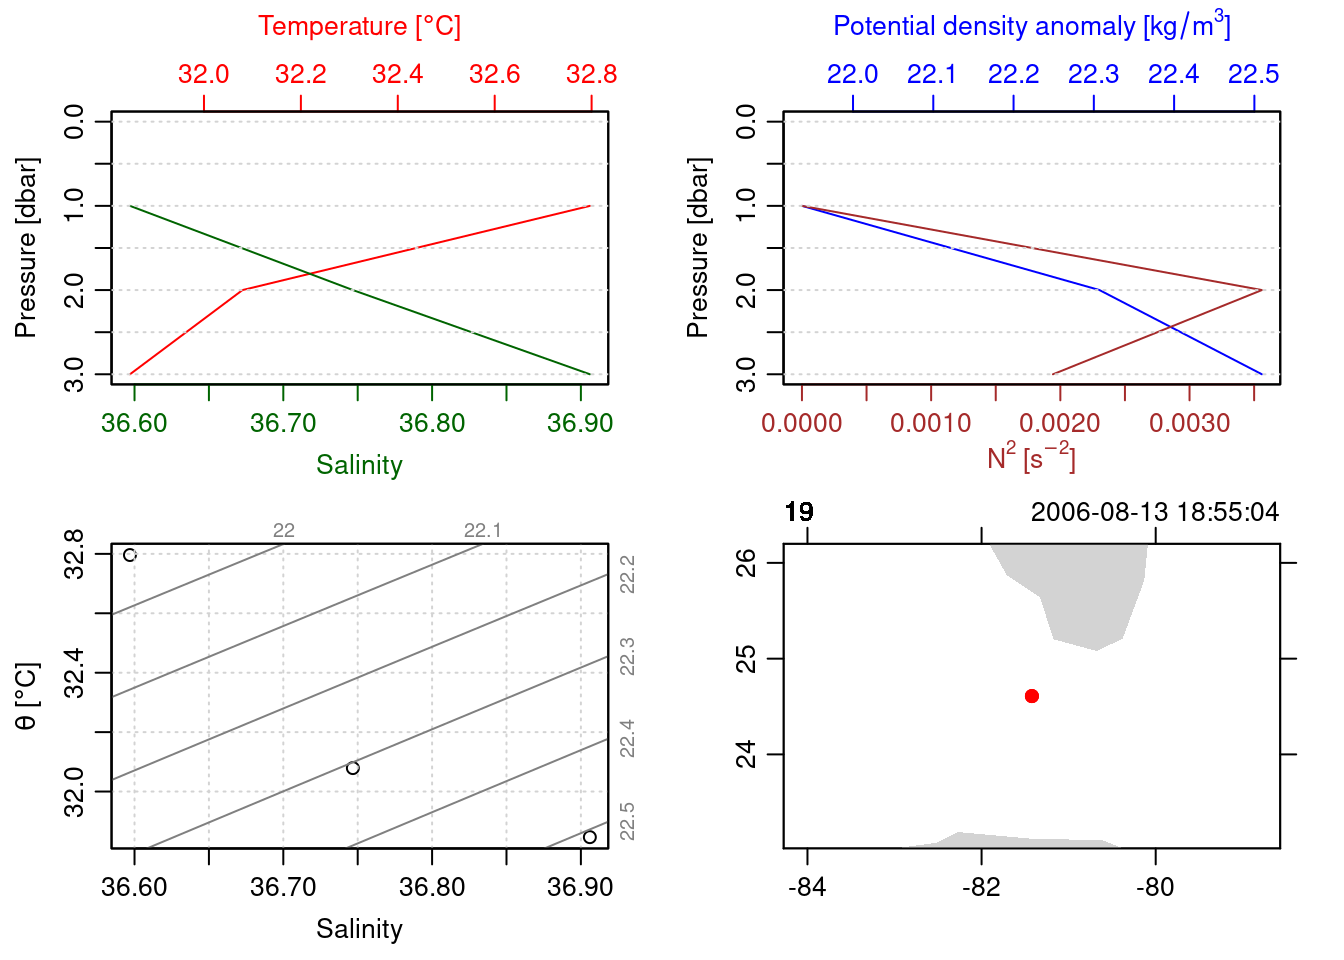
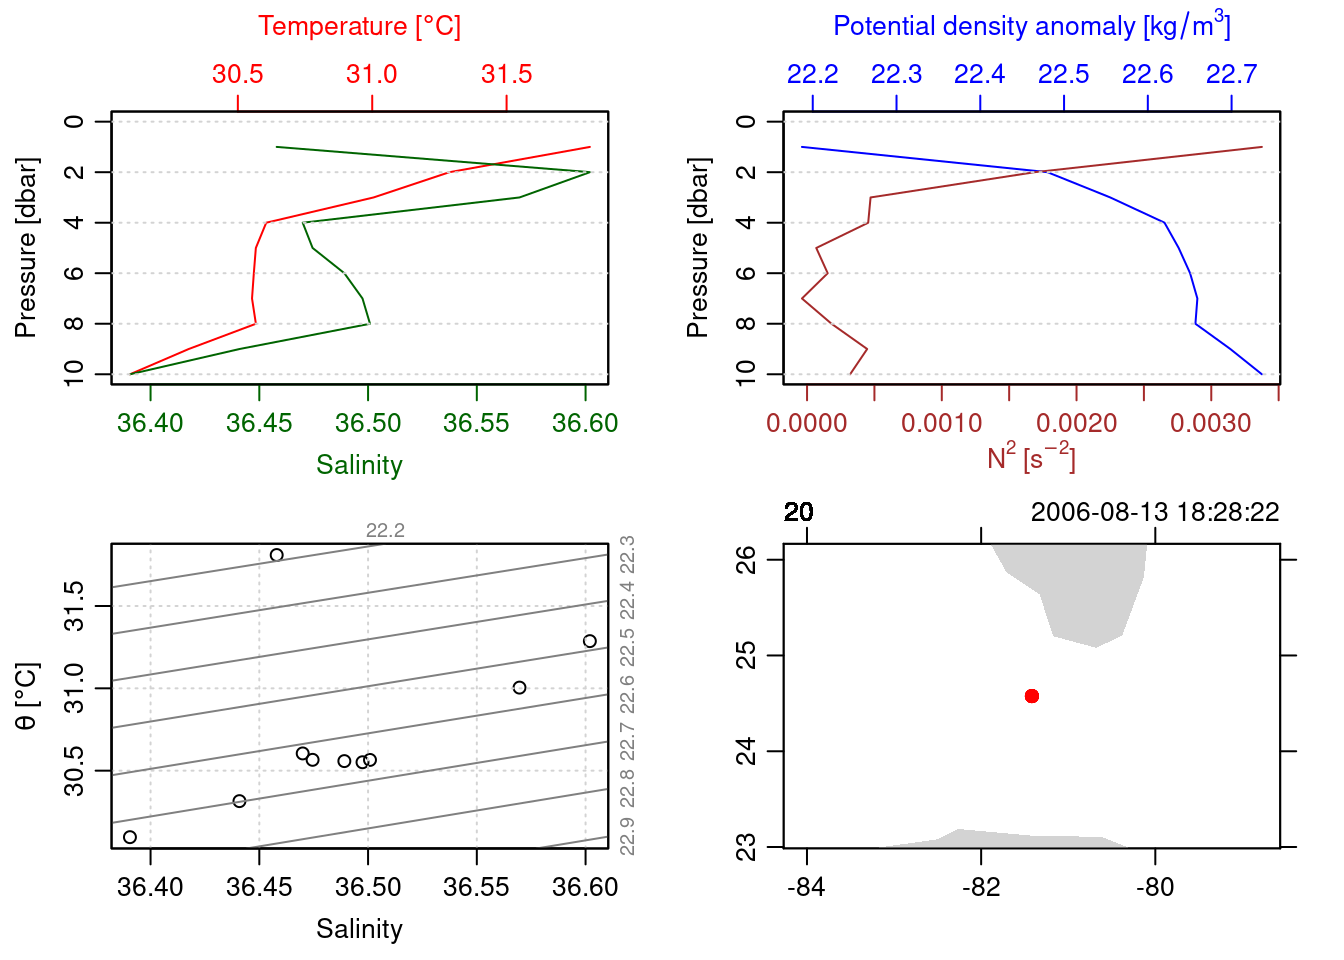
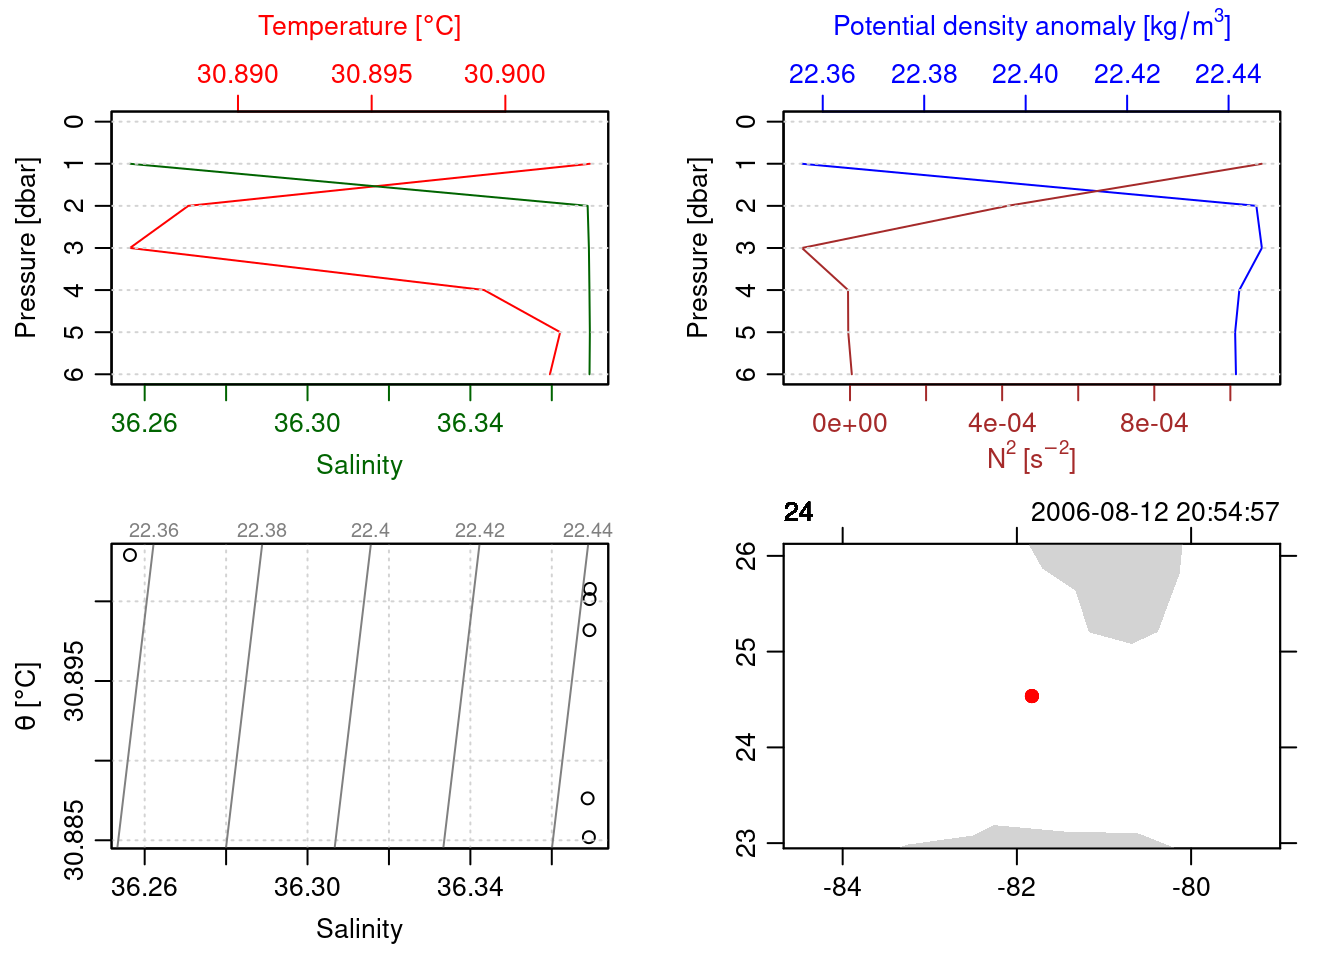
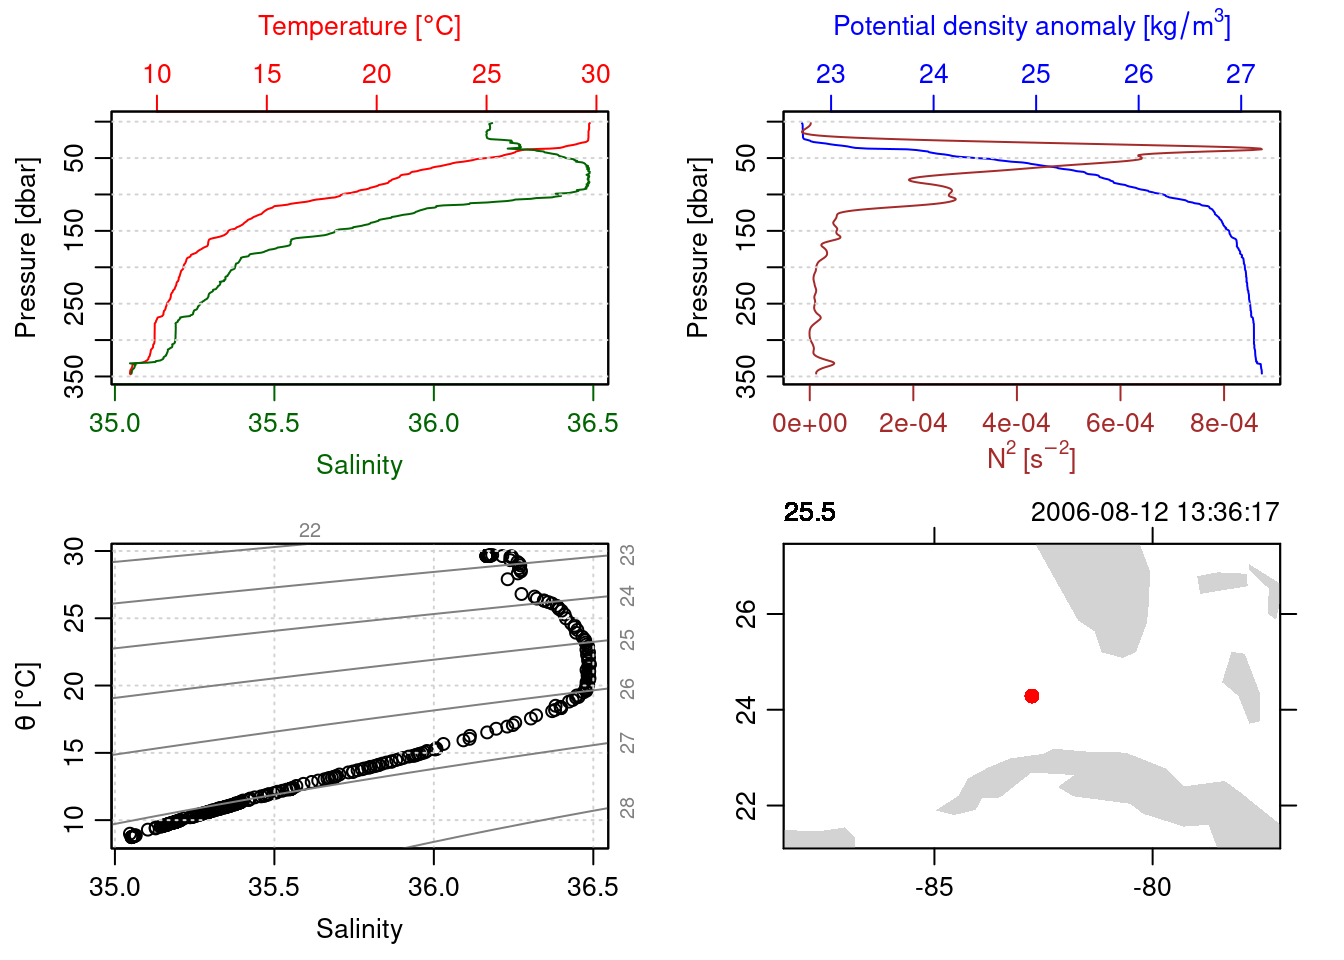
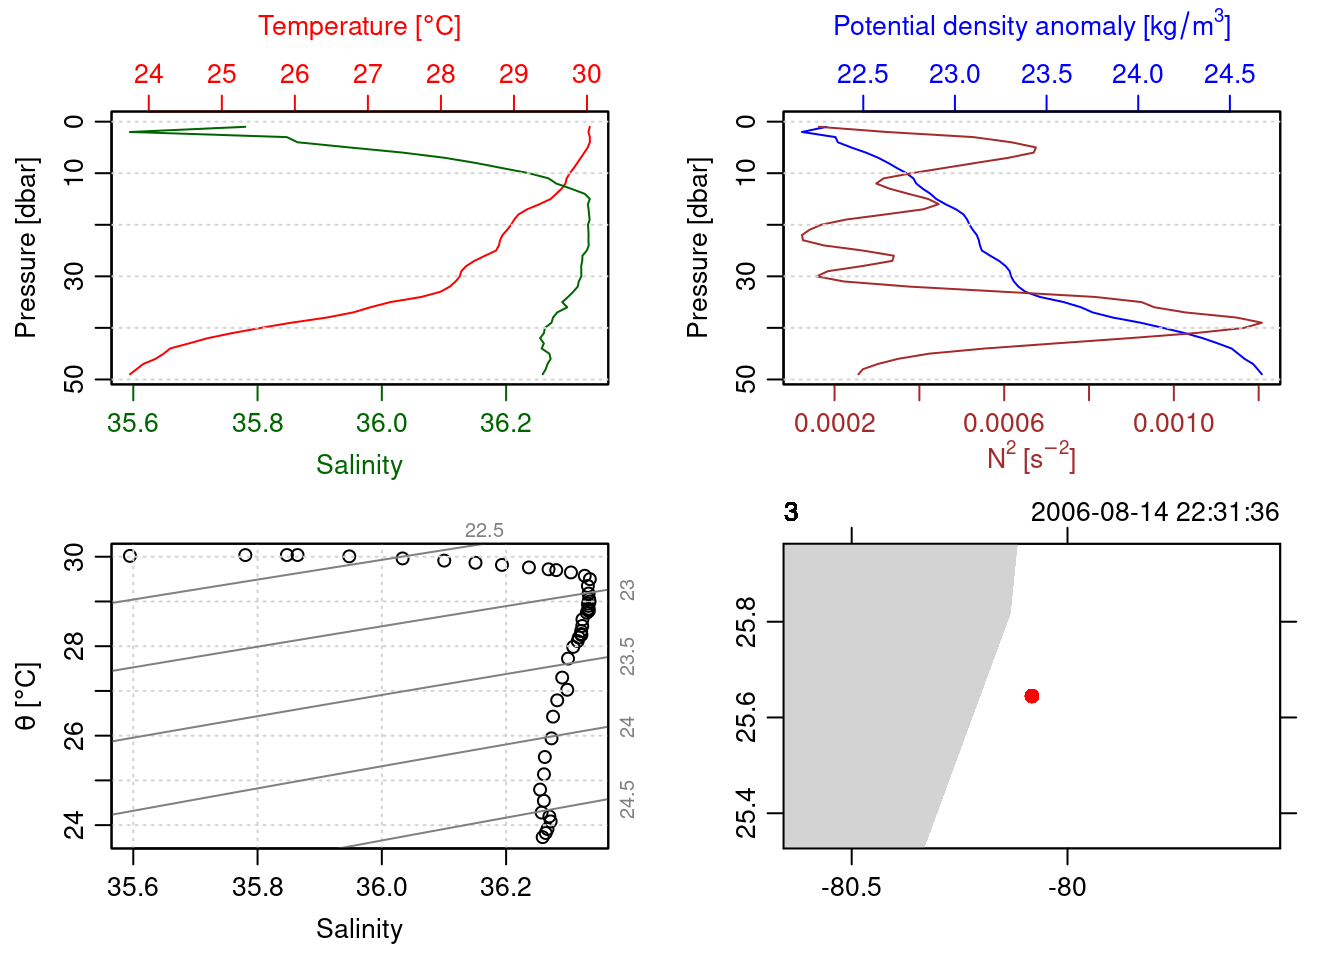
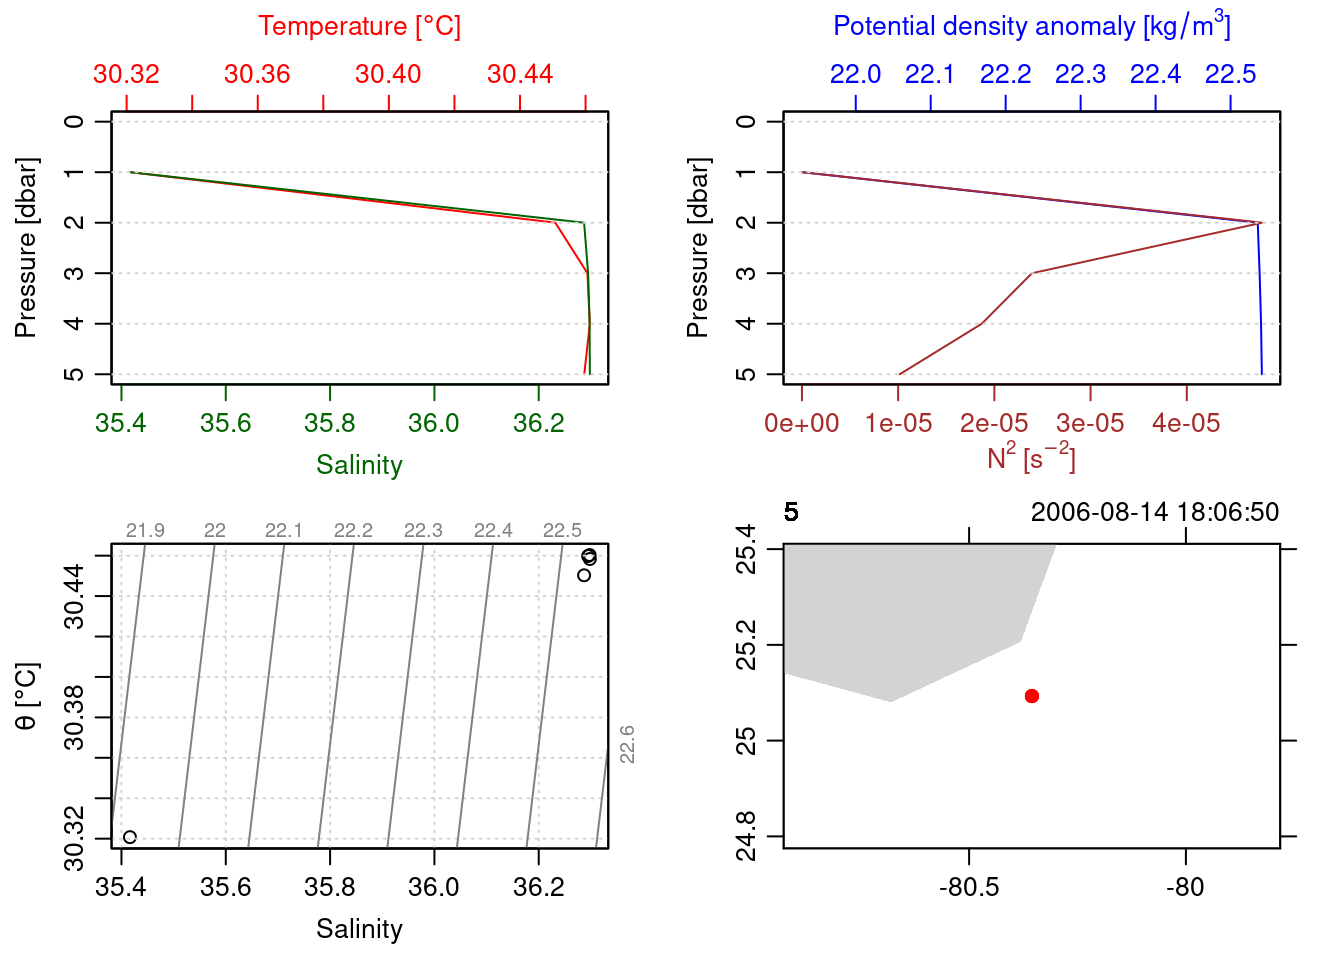
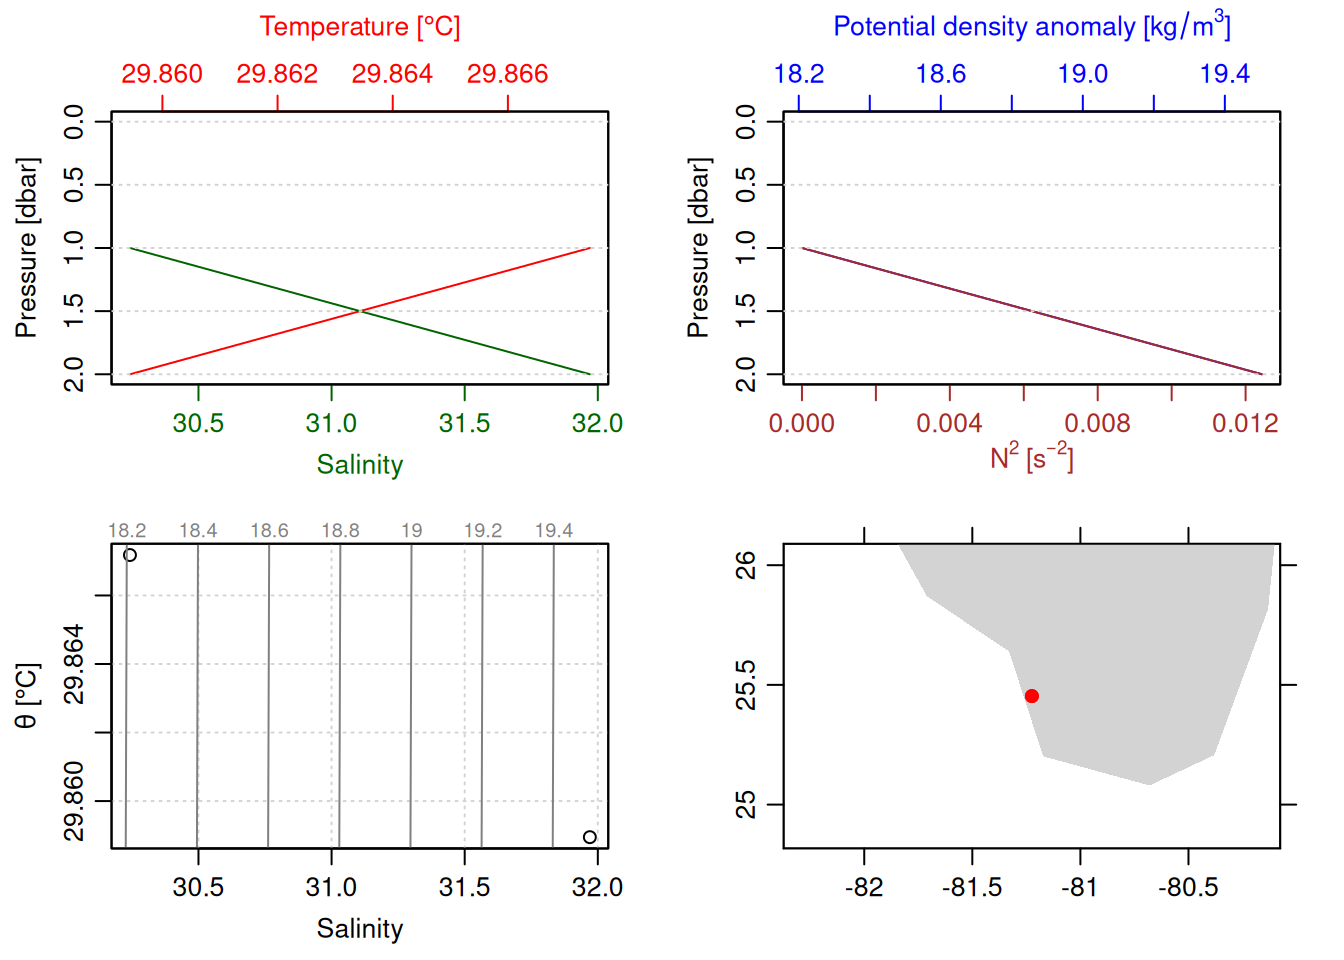
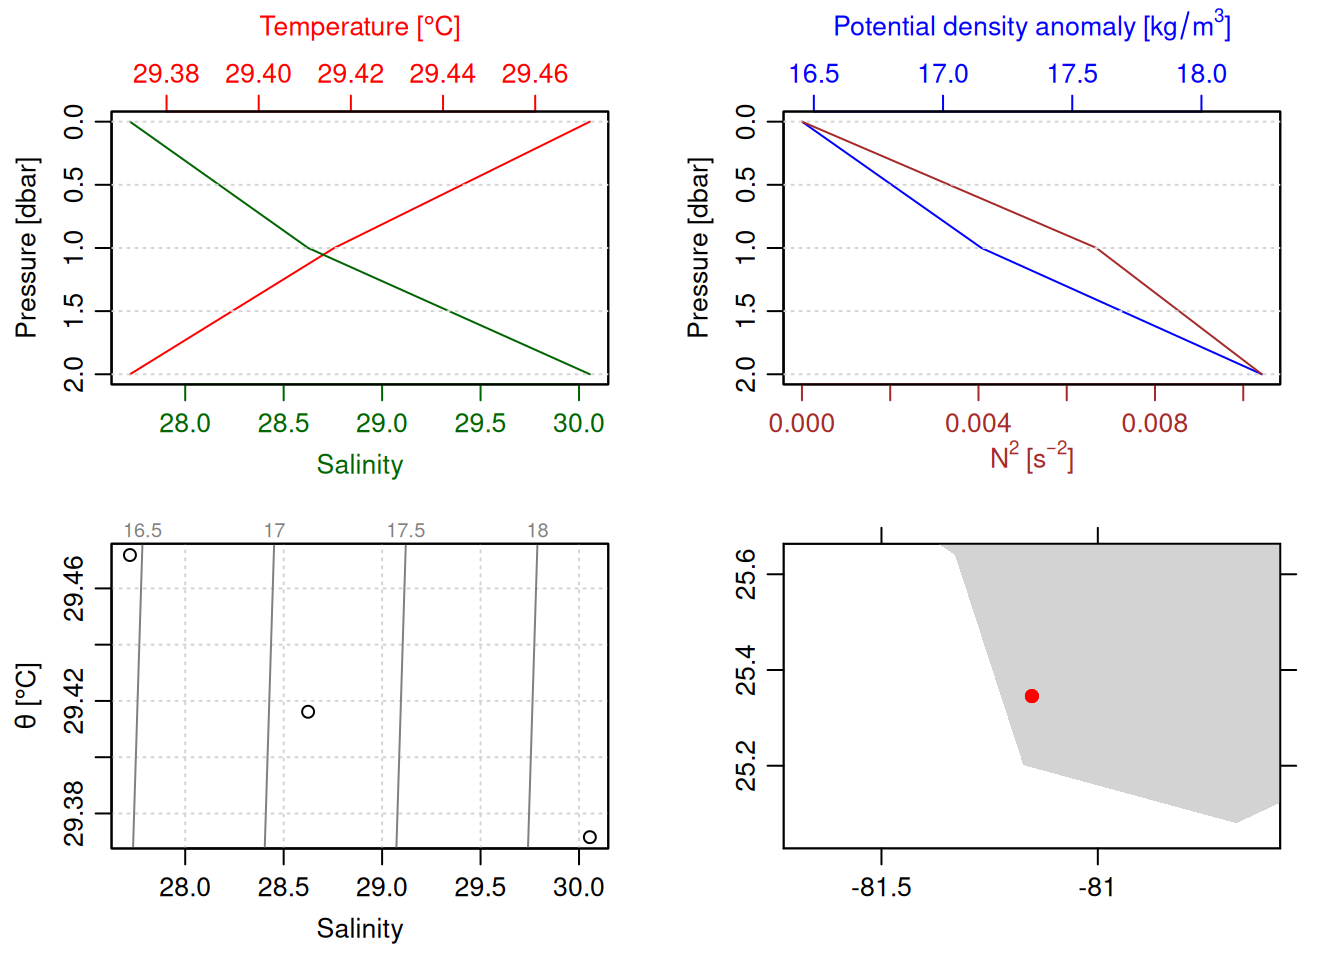
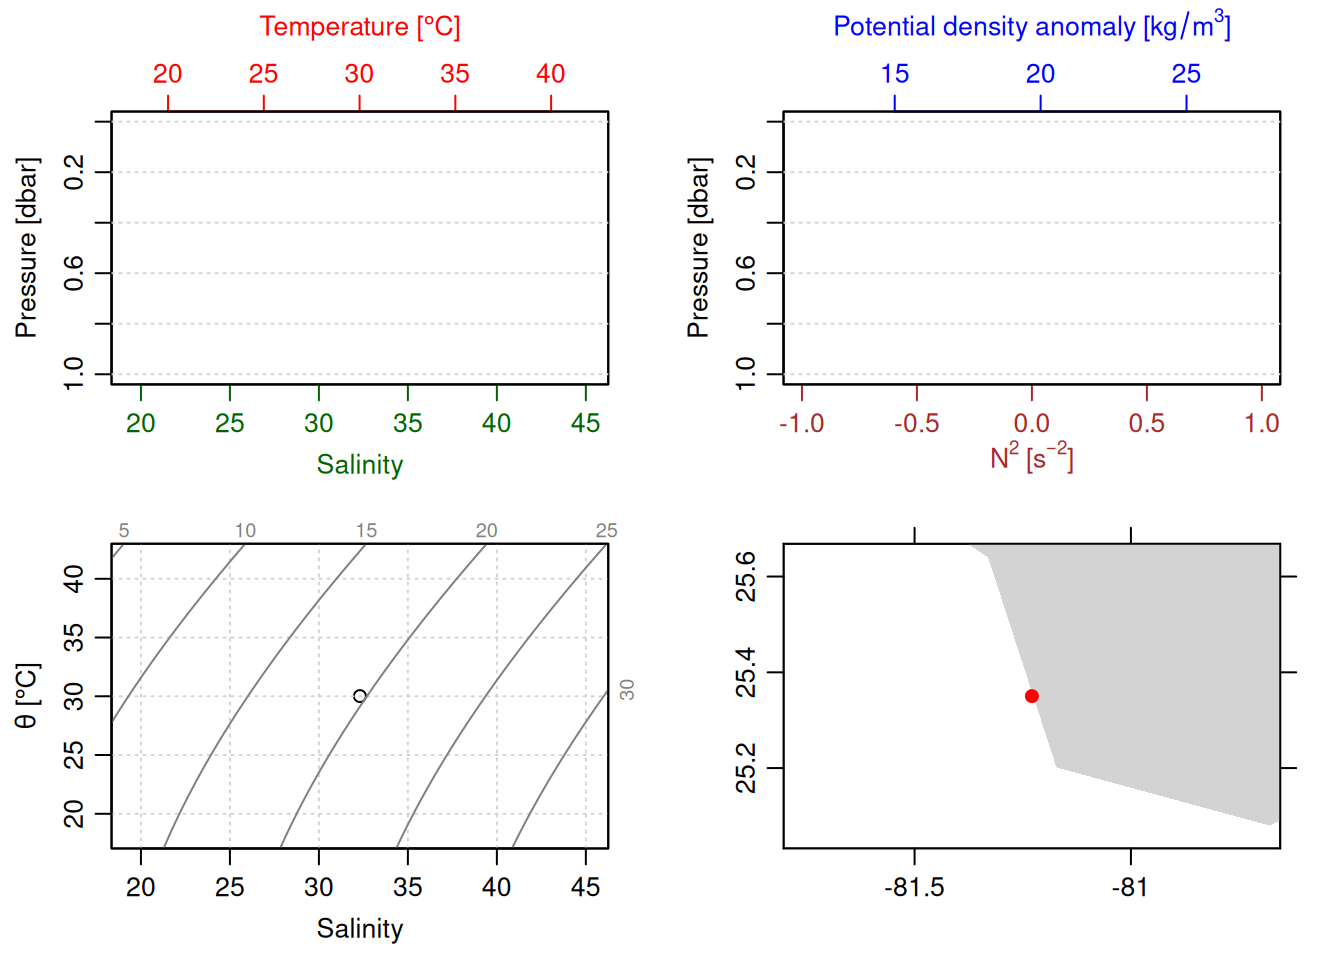
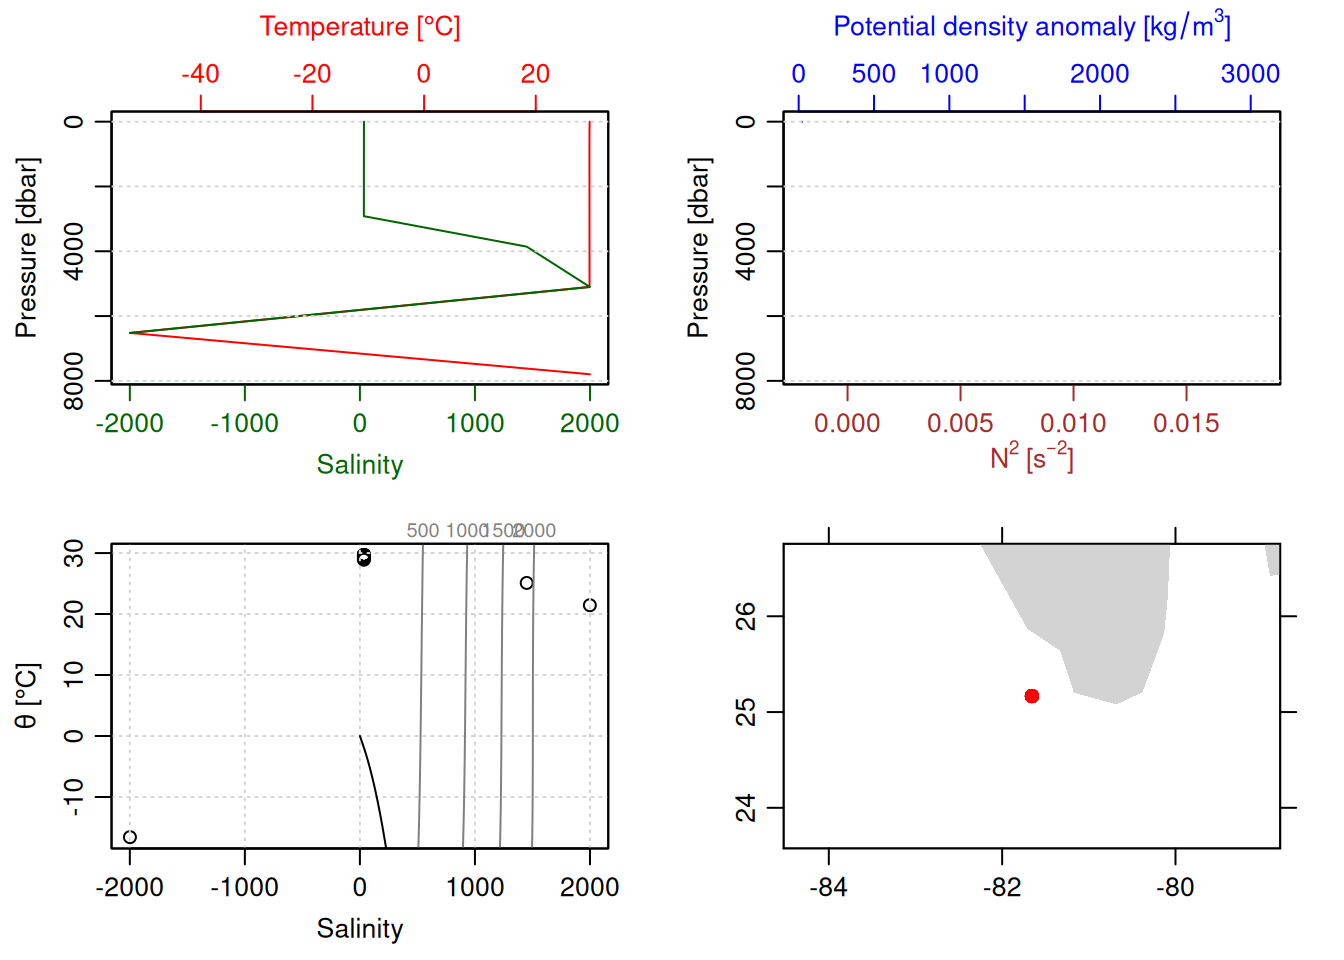
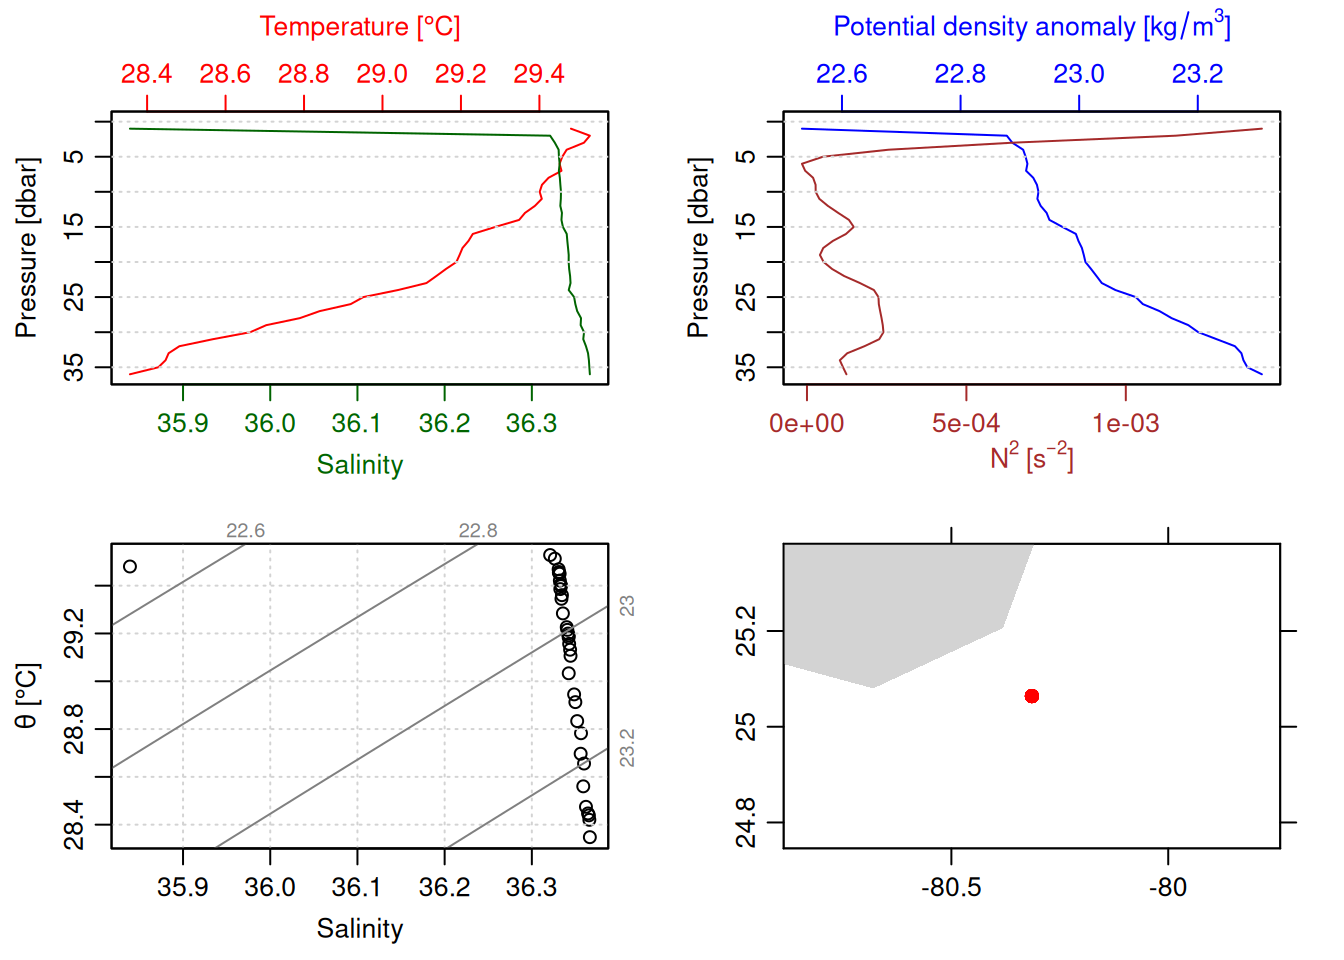
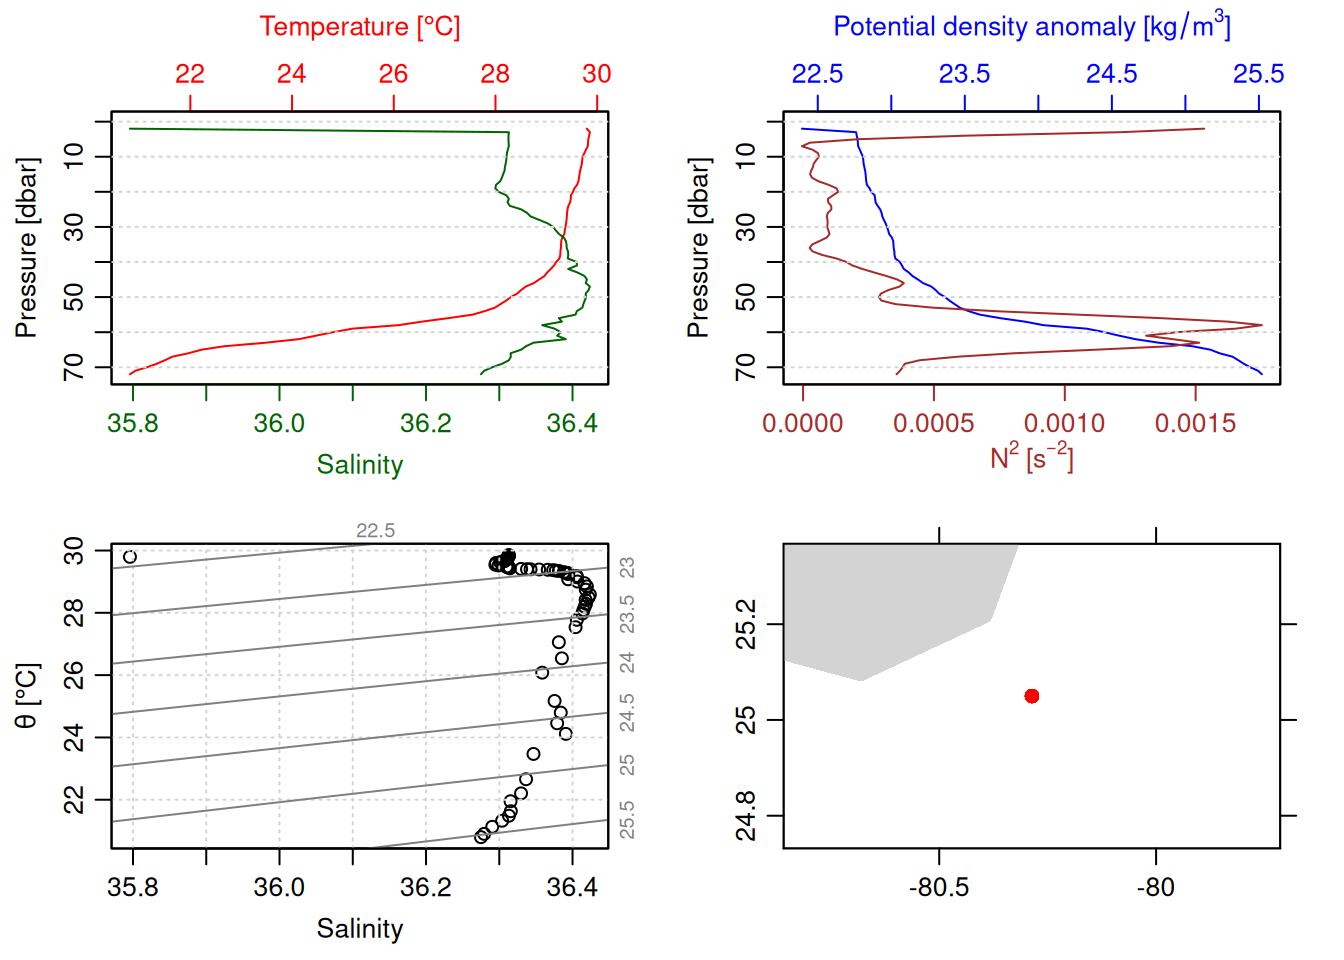
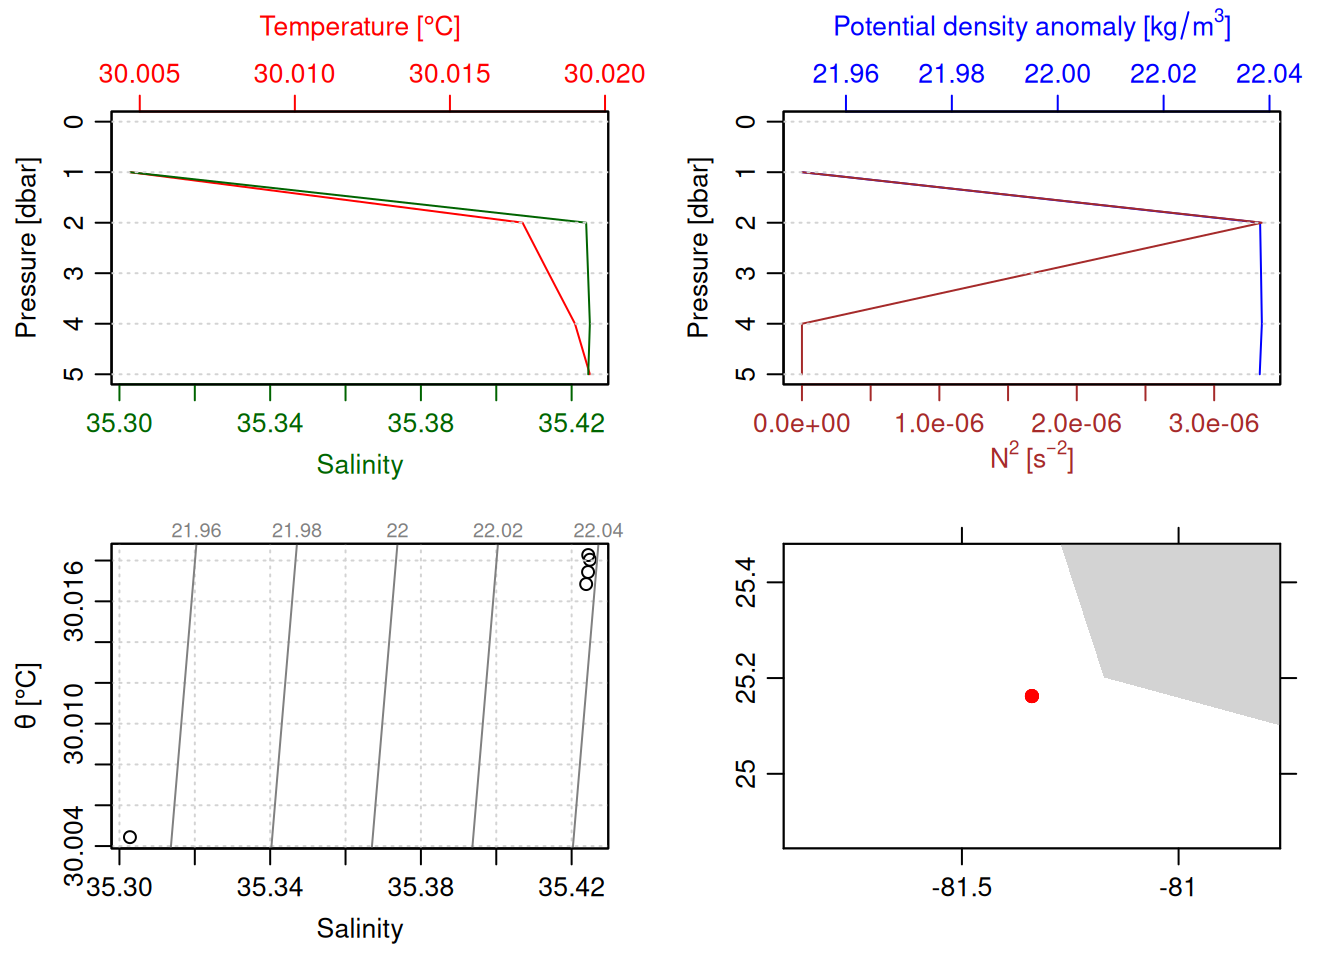
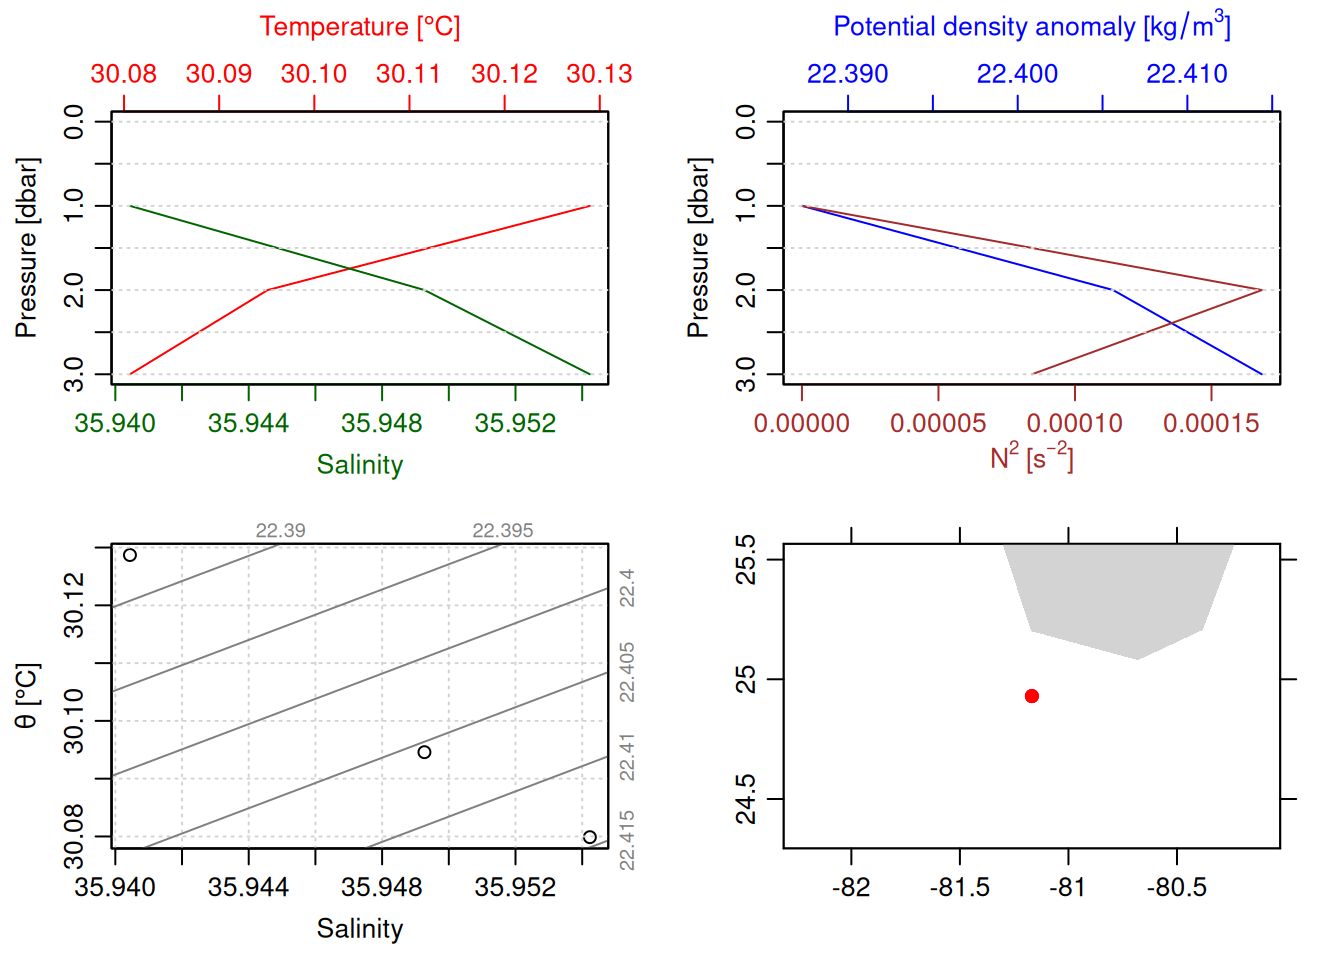
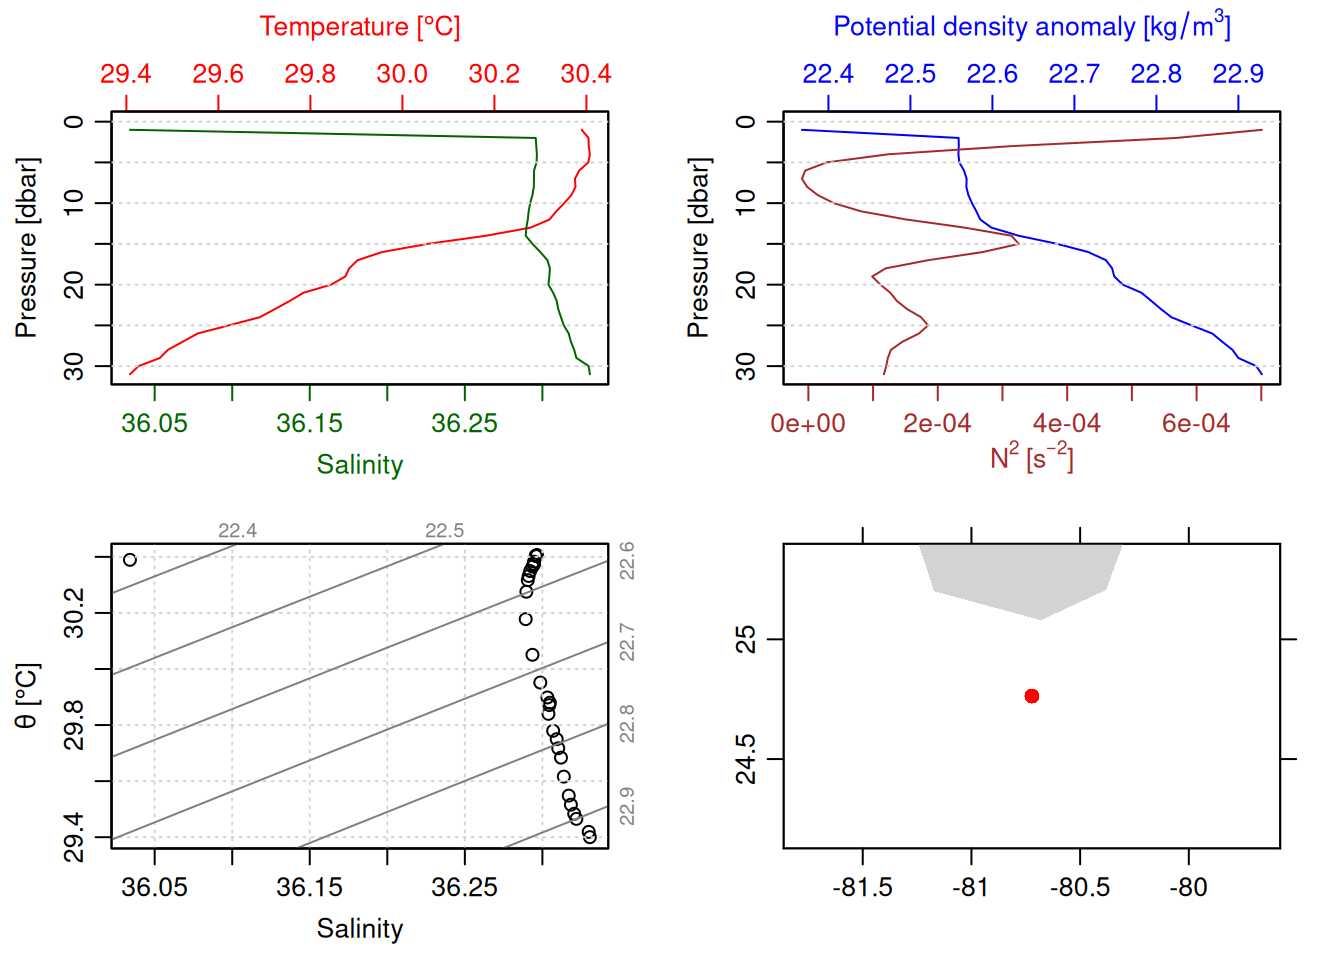
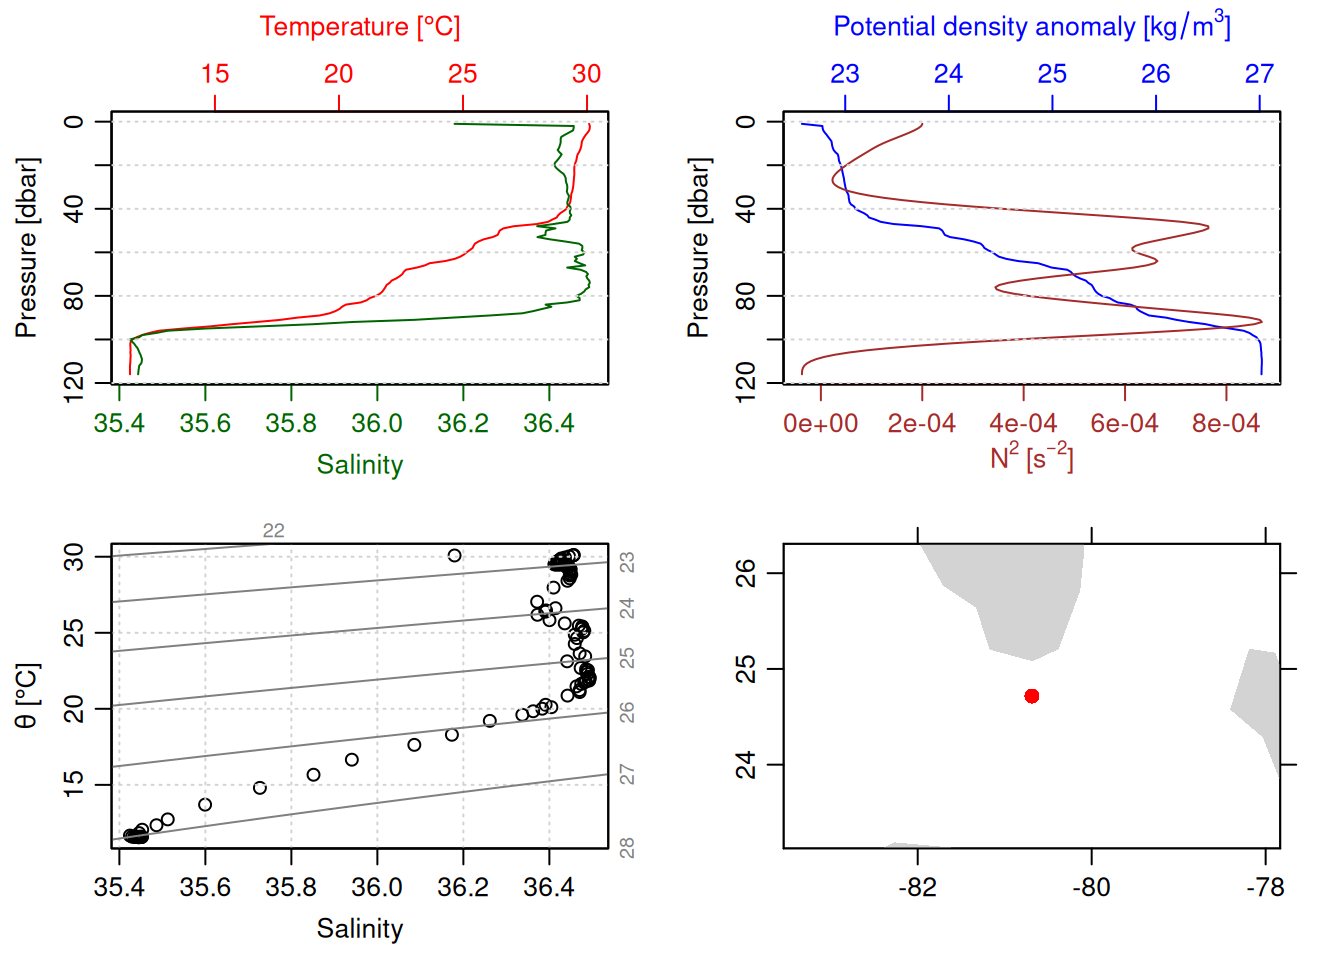
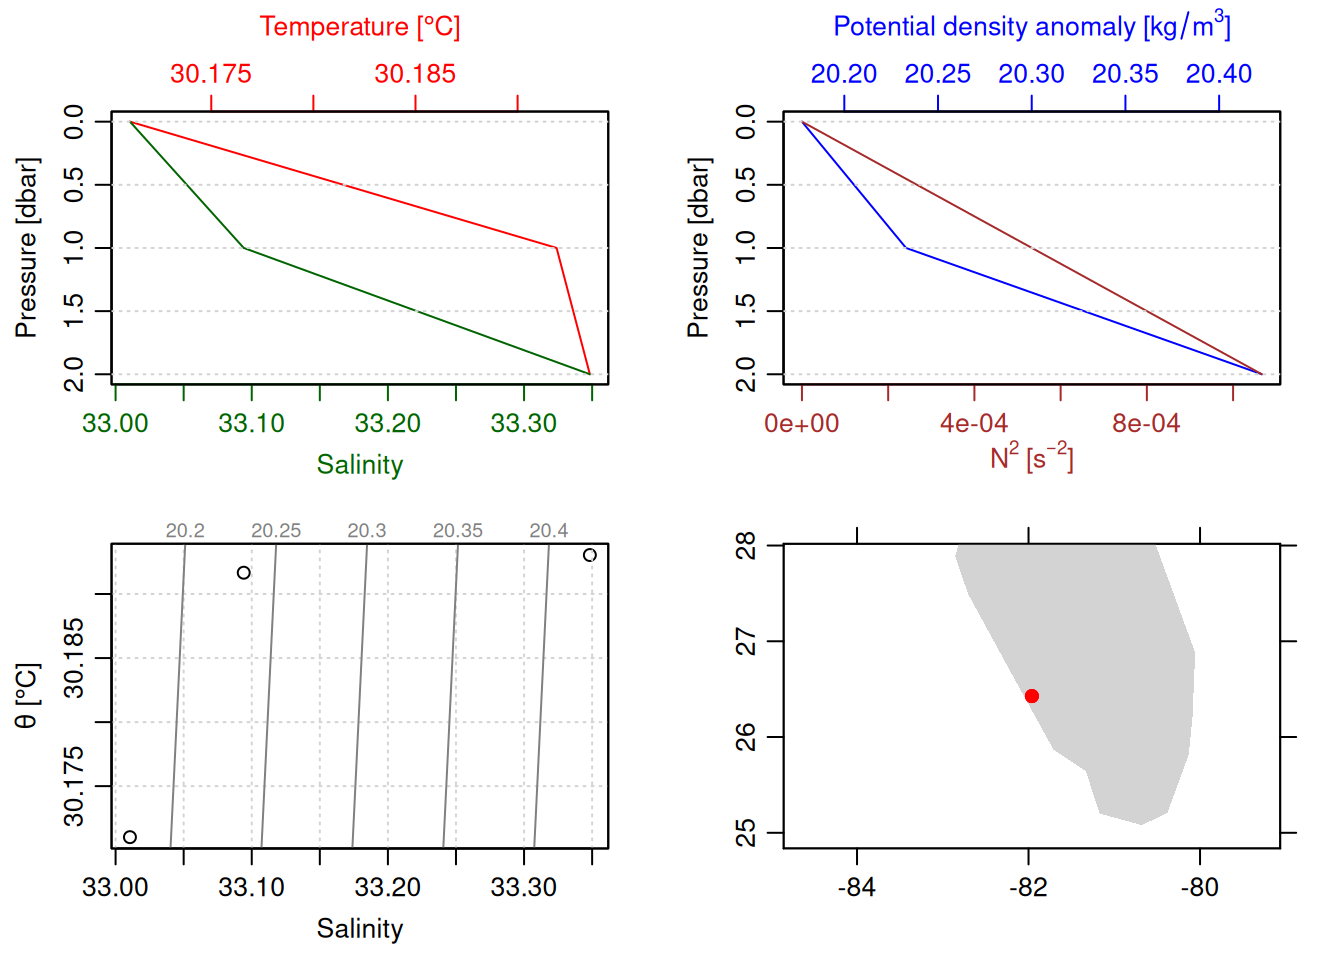
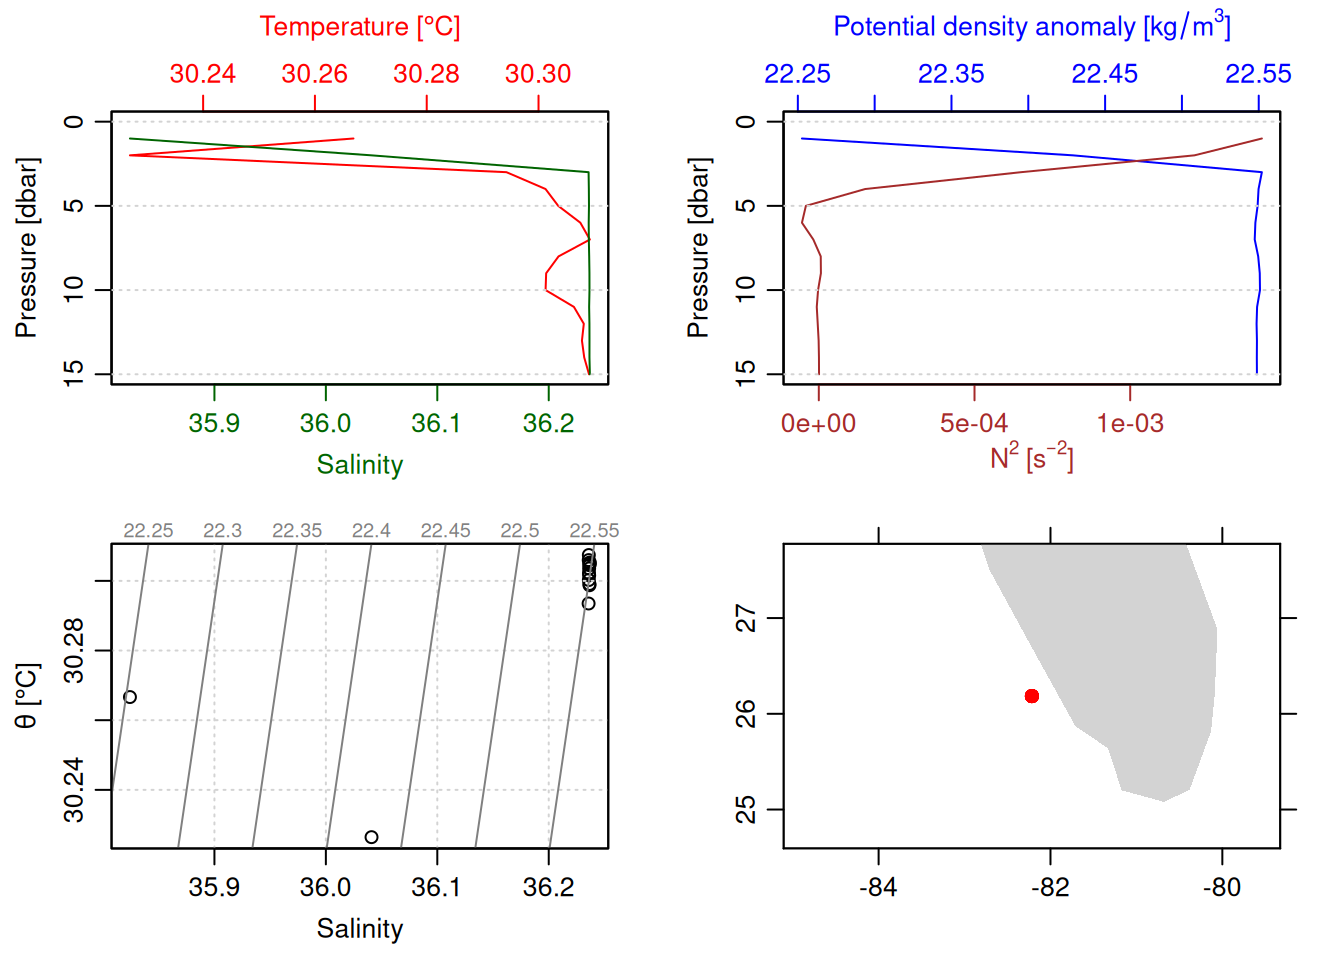
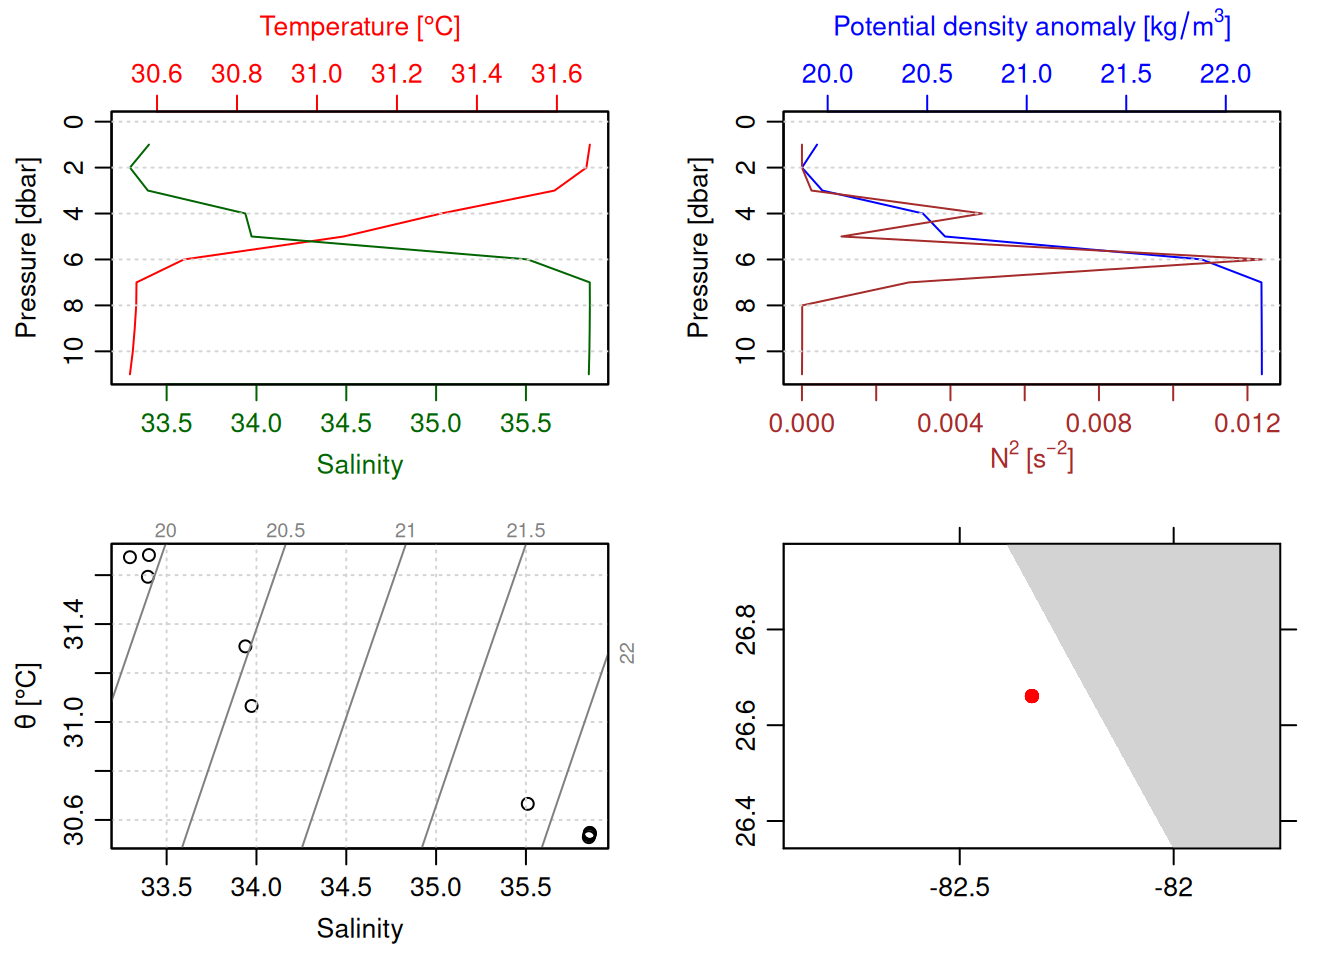
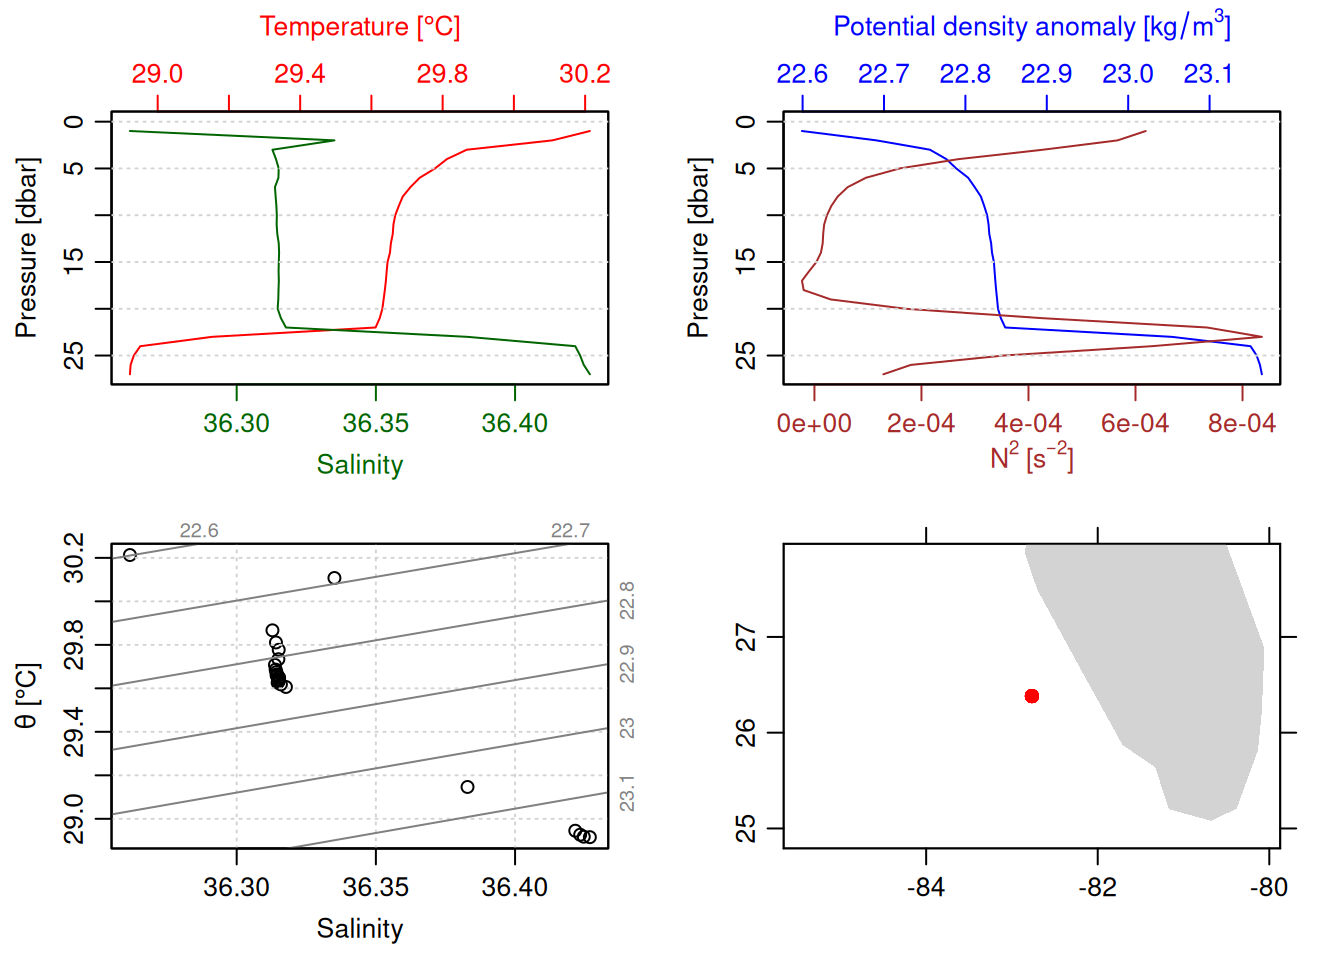
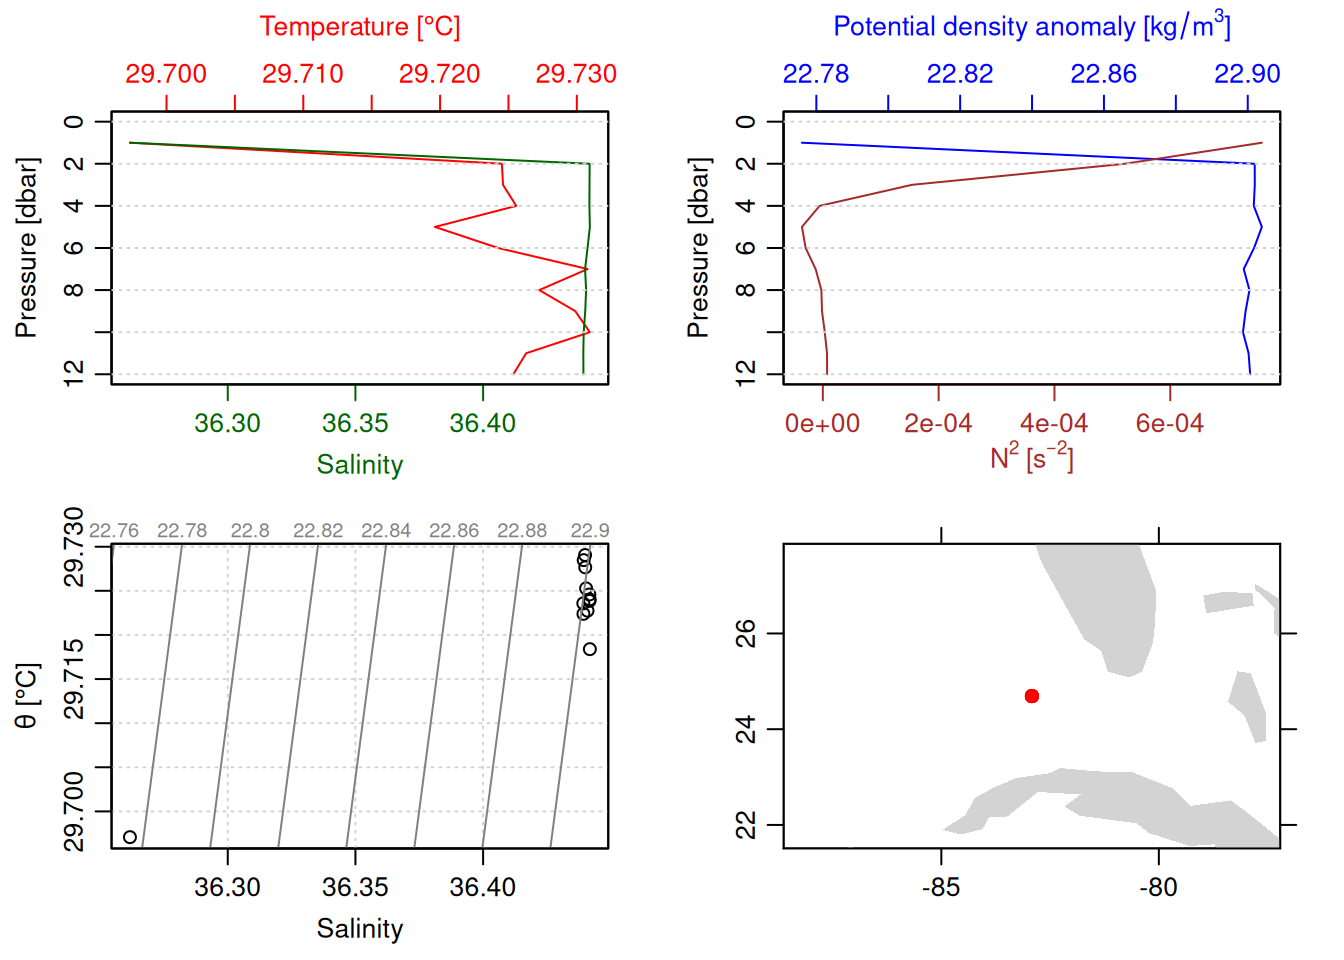
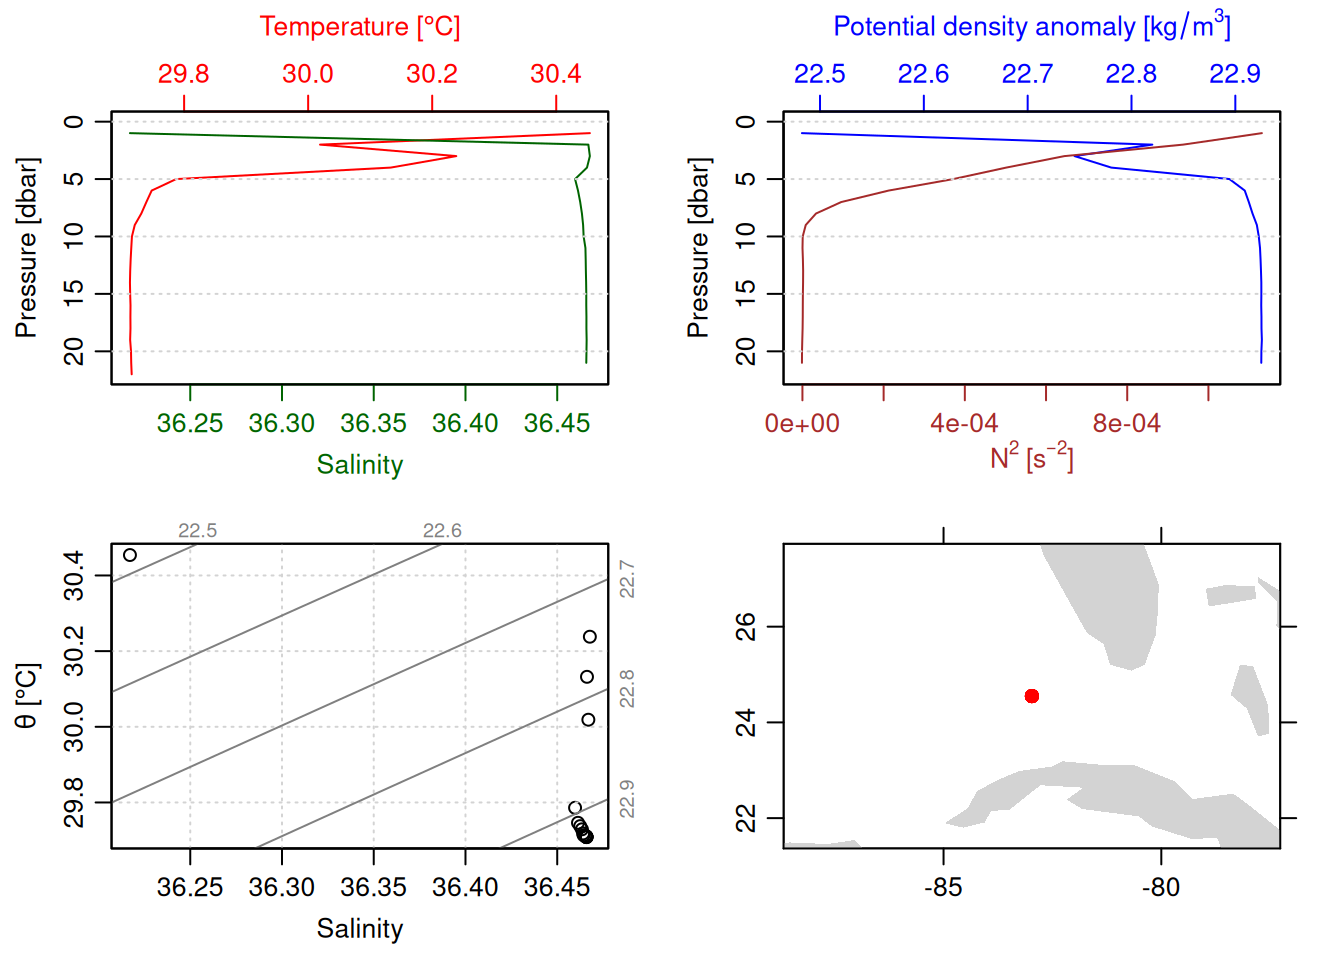
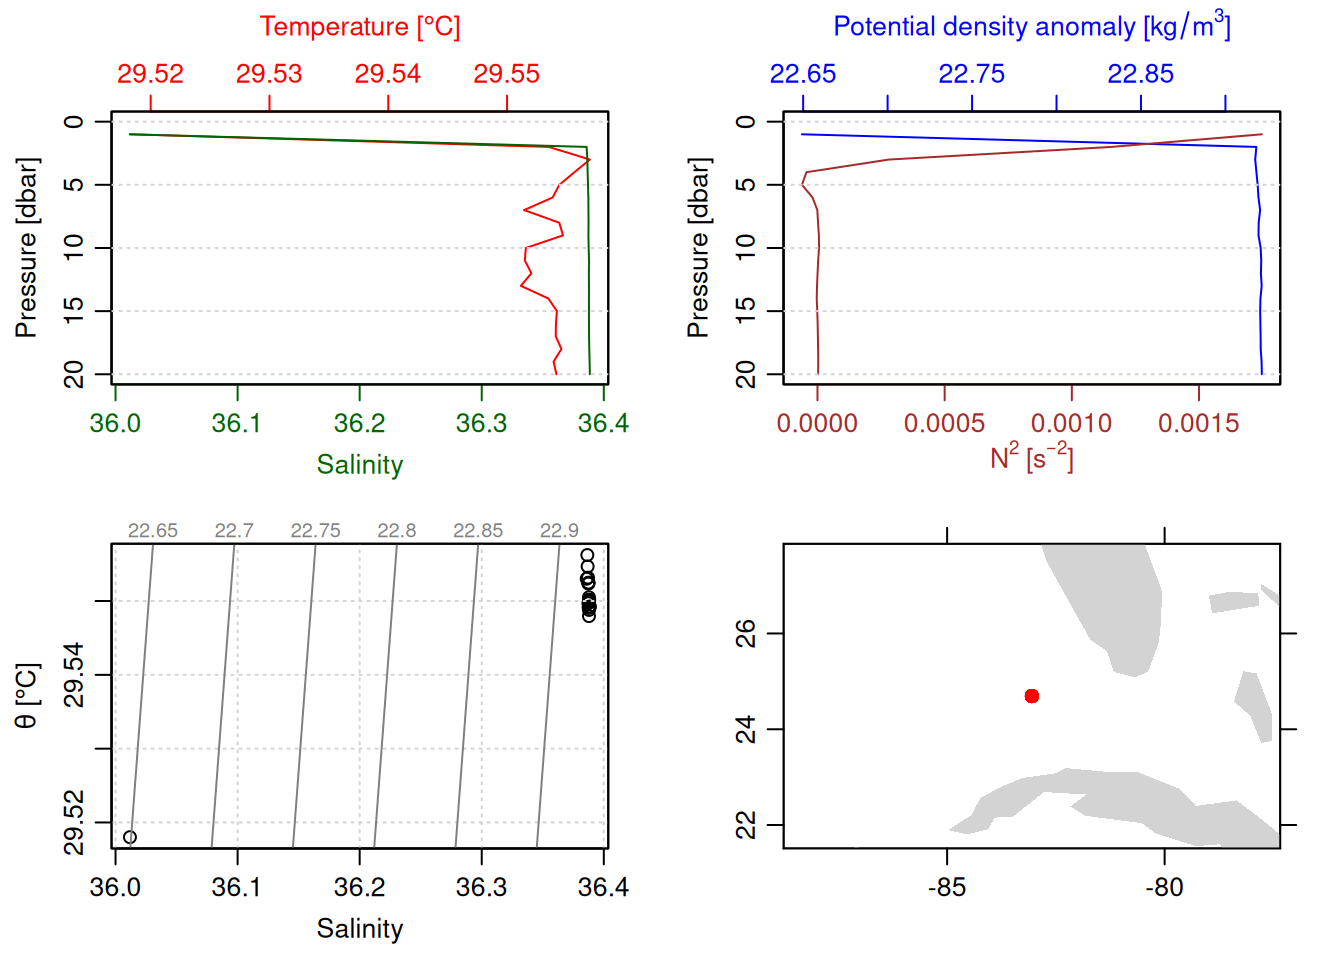
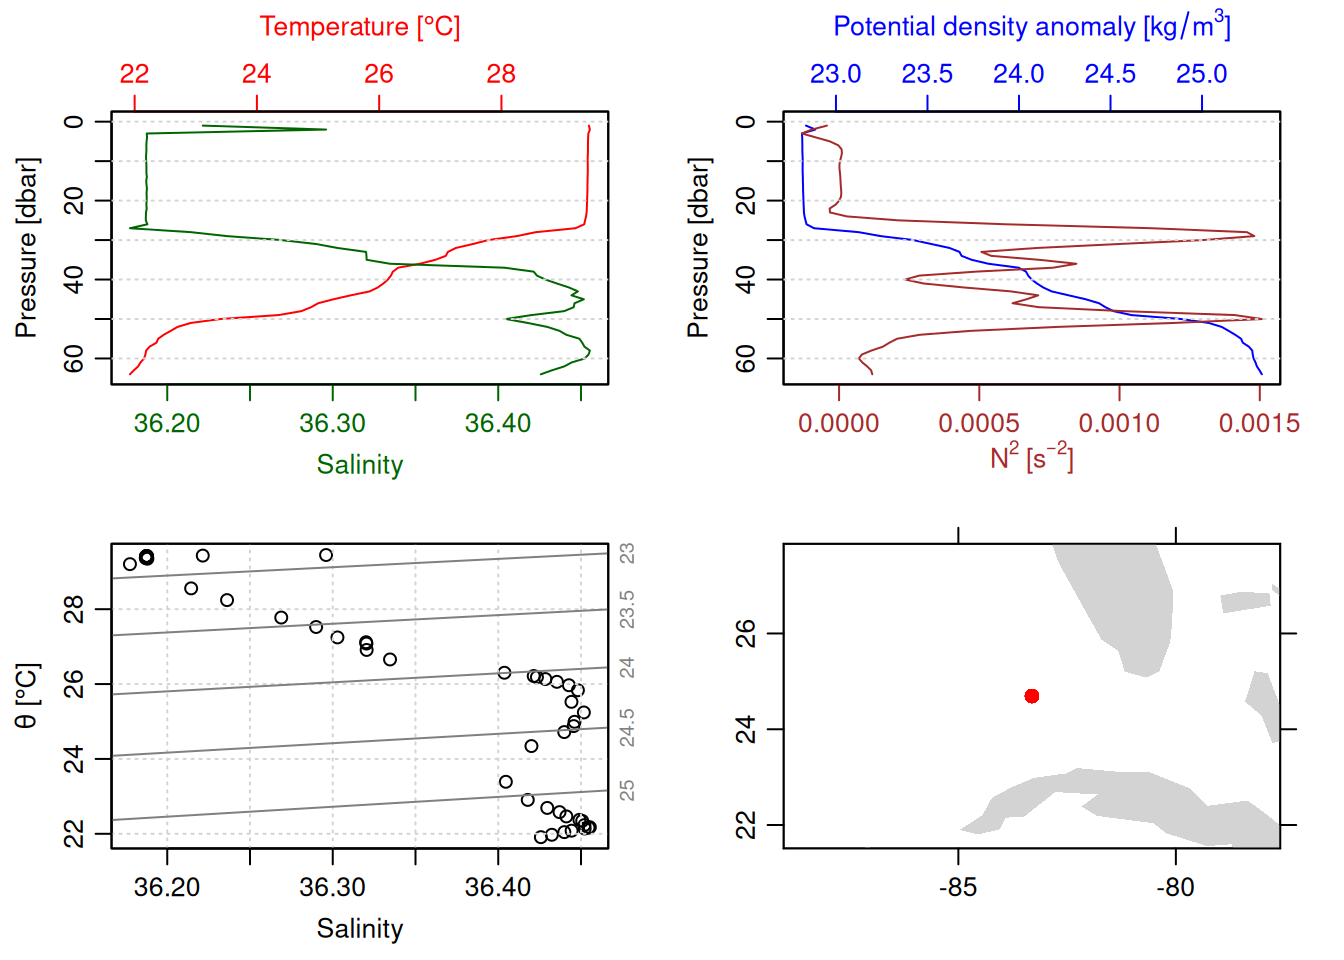
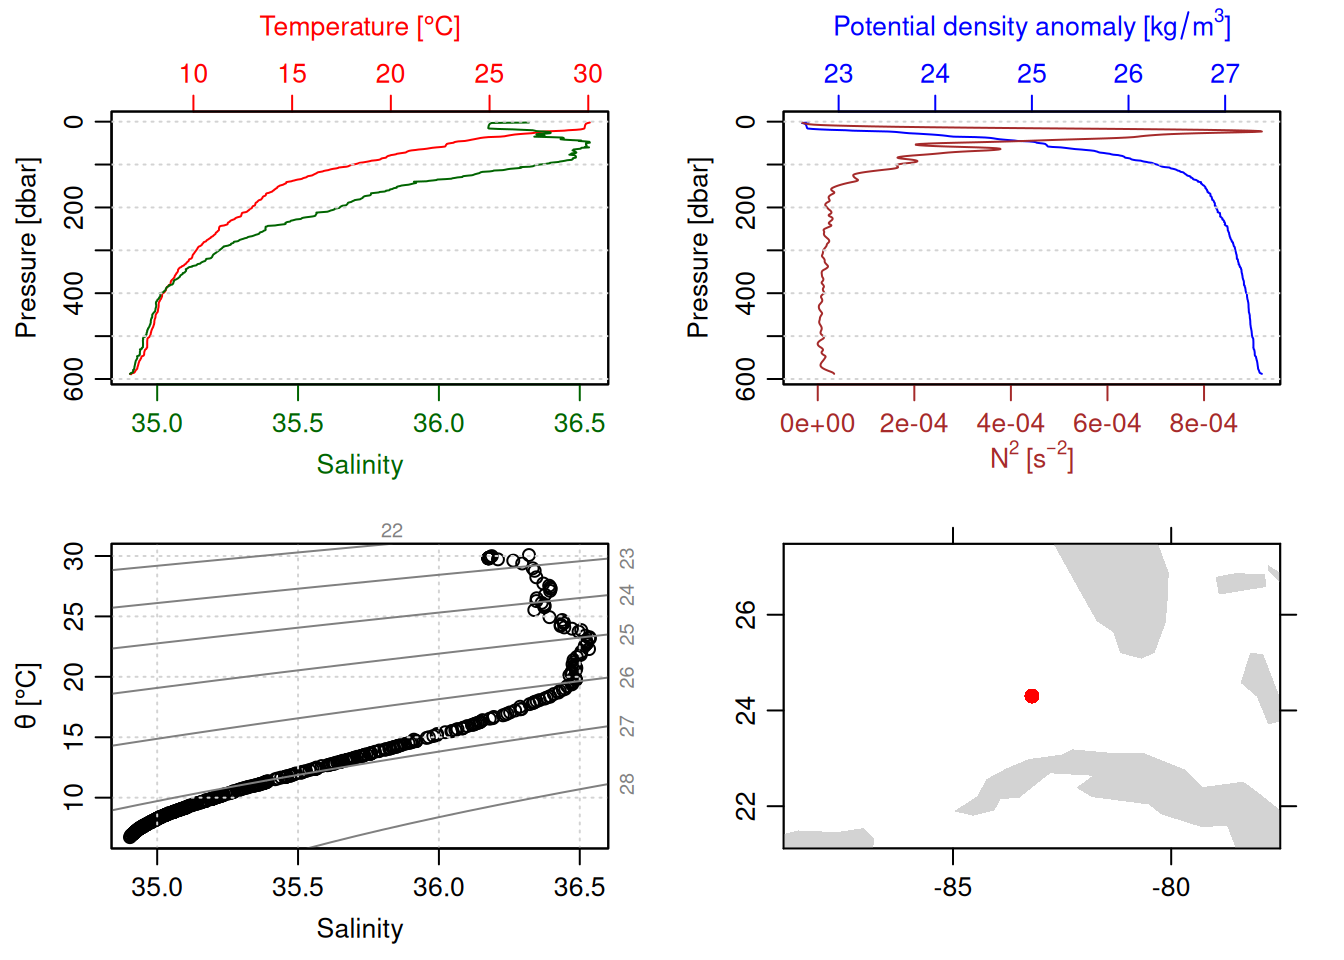
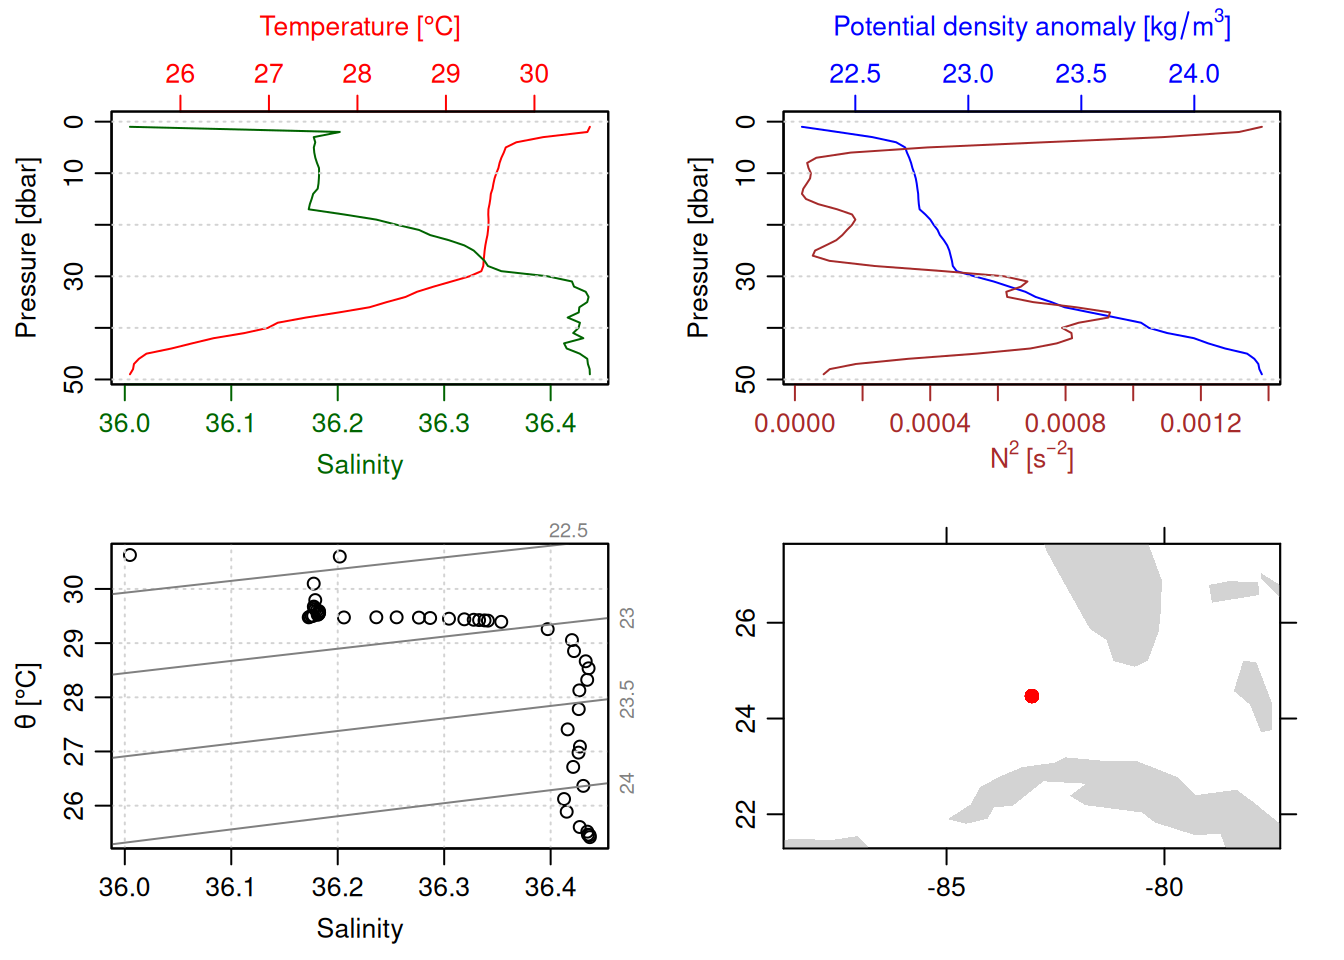
for (i inseq(ctd_FK)){ cast <- ctd_FK[[i]] # 1 is selecting only the first sublisttryCatch({plot(ctdDecimate(ctdTrim(cast))) }, error =function(e){print(e) })}
<simpleError in !is.null(x@metadata$station) && !is.na(x@metadata$station): 'length = 2461' in coercion to 'logical(1)'>
<simpleError in !is.null(x@metadata$station) && !is.na(x@metadata$station): 'length = 1755' in coercion to 'logical(1)'>
<simpleError in !is.null(x@metadata$station) && !is.na(x@metadata$station): 'length = 2483' in coercion to 'logical(1)'>
<simpleError in !is.null(x@metadata$station) && !is.na(x@metadata$station): 'length = 2270' in coercion to 'logical(1)'>
<simpleError in !is.null(x@metadata$station) && !is.na(x@metadata$station): 'length = 3888' in coercion to 'logical(1)'>
<simpleError in !is.null(x@metadata$station) && !is.na(x@metadata$station): 'length = 3192' in coercion to 'logical(1)'>
<simpleError in !is.null(x@metadata$station) && !is.na(x@metadata$station): 'length = 2231' in coercion to 'logical(1)'>
<simpleError in !is.null(x@metadata$station) && !is.na(x@metadata$station): 'length = 3079' in coercion to 'logical(1)'>
<simpleError in !is.null(x@metadata$station) && !is.na(x@metadata$station): 'length = 3863' in coercion to 'logical(1)'>
<simpleError in !is.null(x@metadata$station) && !is.na(x@metadata$station): 'length = 8325' in coercion to 'logical(1)'>
<simpleError in !is.null(x@metadata$station) && !is.na(x@metadata$station): 'length = 7788' in coercion to 'logical(1)'>
<simpleError in !is.null(x@metadata$station) && !is.na(x@metadata$station): 'length = 2471' in coercion to 'logical(1)'>
<simpleError in !is.null(x@metadata$station) && !is.na(x@metadata$station): 'length = 2205' in coercion to 'logical(1)'>
<simpleError in !is.null(x@metadata$station) && !is.na(x@metadata$station): 'length = 13216' in coercion to 'logical(1)'>
<simpleError in !is.null(x@metadata$station) && !is.na(x@metadata$station): 'length = 4111' in coercion to 'logical(1)'>
<simpleError in !is.null(x@metadata$station) && !is.na(x@metadata$station): 'length = 2983' in coercion to 'logical(1)'>
<simpleError in !is.null(x@metadata$station) && !is.na(x@metadata$station): 'length = 3485' in coercion to 'logical(1)'>
<simpleError in !is.null(x@metadata$station) && !is.na(x@metadata$station): 'length = 4005' in coercion to 'logical(1)'>
<simpleError in !is.null(x@metadata$station) && !is.na(x@metadata$station): 'length = 3251' in coercion to 'logical(1)'>
<simpleError in !is.null(x@metadata$station) && !is.na(x@metadata$station): 'length = 2549' in coercion to 'logical(1)'>
<simpleError in !is.null(x@metadata$station) && !is.na(x@metadata$station): 'length = 1550' in coercion to 'logical(1)'>
<simpleError in !is.null(x@metadata$station) && !is.na(x@metadata$station): 'length = 1835' in coercion to 'logical(1)'>
<simpleError in !is.null(x@metadata$station) && !is.na(x@metadata$station): 'length = 2999' in coercion to 'logical(1)'>
<simpleError in !is.null(x@metadata$station) && !is.na(x@metadata$station): 'length = 3588' in coercion to 'logical(1)'>
<simpleError in !is.null(x@metadata$station) && !is.na(x@metadata$station): 'length = 3265' in coercion to 'logical(1)'>
<simpleError in !is.null(x@metadata$station) && !is.na(x@metadata$station): 'length = 3052' in coercion to 'logical(1)'>
<simpleError in !is.null(x@metadata$station) && !is.na(x@metadata$station): 'length = 1789' in coercion to 'logical(1)'>
<simpleError in !is.null(x@metadata$station) && !is.na(x@metadata$station): 'length = 5310' in coercion to 'logical(1)'>
<simpleError in !is.null(x@metadata$station) && !is.na(x@metadata$station): 'length = 2513' in coercion to 'logical(1)'>
<simpleError in !is.null(x@metadata$station) && !is.na(x@metadata$station): 'length = 2750' in coercion to 'logical(1)'>
<simpleError in !is.null(x@metadata$station) && !is.na(x@metadata$station): 'length = 2870' in coercion to 'logical(1)'>
<simpleError in !is.null(x@metadata$station) && !is.na(x@metadata$station): 'length = 895' in coercion to 'logical(1)'>
<simpleError in !is.null(x@metadata$station) && !is.na(x@metadata$station): 'length = 4260' in coercion to 'logical(1)'>
<simpleError in !is.null(x@metadata$station) && !is.na(x@metadata$station): 'length = 5552' in coercion to 'logical(1)'>
<simpleError in !is.null(x@metadata$station) && !is.na(x@metadata$station): 'length = 1980' in coercion to 'logical(1)'>
<simpleError in !is.null(x@metadata$station) && !is.na(x@metadata$station): 'length = 1398' in coercion to 'logical(1)'>
<simpleError in !is.null(x@metadata$station) && !is.na(x@metadata$station): 'length = 1656' in coercion to 'logical(1)'>
<simpleError in !is.null(x@metadata$station) && !is.na(x@metadata$station): 'length = 3349' in coercion to 'logical(1)'>
<simpleError in !is.null(x@metadata$station) && !is.na(x@metadata$station): 'length = 6905' in coercion to 'logical(1)'>
<simpleError in !is.null(x@metadata$station) && !is.na(x@metadata$station): 'length = 3339' in coercion to 'logical(1)'>
<simpleError in !is.null(x@metadata$station) && !is.na(x@metadata$station): 'length = 3990' in coercion to 'logical(1)'>
<simpleError in !is.null(x@metadata$station) && !is.na(x@metadata$station): 'length = 4880' in coercion to 'logical(1)'>
<simpleError in !is.null(x@metadata$station) && !is.na(x@metadata$station): 'length = 5026' in coercion to 'logical(1)'>
<simpleError in !is.null(x@metadata$station) && !is.na(x@metadata$station): 'length = 2752' in coercion to 'logical(1)'>
<simpleError in !is.null(x@metadata$station) && !is.na(x@metadata$station): 'length = 3314' in coercion to 'logical(1)'>
<simpleError in !is.null(x@metadata$station) && !is.na(x@metadata$station): 'length = 4356' in coercion to 'logical(1)'>
<simpleError in !is.null(x@metadata$station) && !is.na(x@metadata$station): 'length = 2072' in coercion to 'logical(1)'>
<simpleError in !is.null(x@metadata$station) && !is.na(x@metadata$station): 'length = 4815' in coercion to 'logical(1)'>
<simpleError in !is.null(x@metadata$station) && !is.na(x@metadata$station): 'length = 19906' in coercion to 'logical(1)'>
<simpleError in !is.null(x@metadata$station) && !is.na(x@metadata$station): 'length = 4678' in coercion to 'logical(1)'>
plotting other physical parameters for each cast
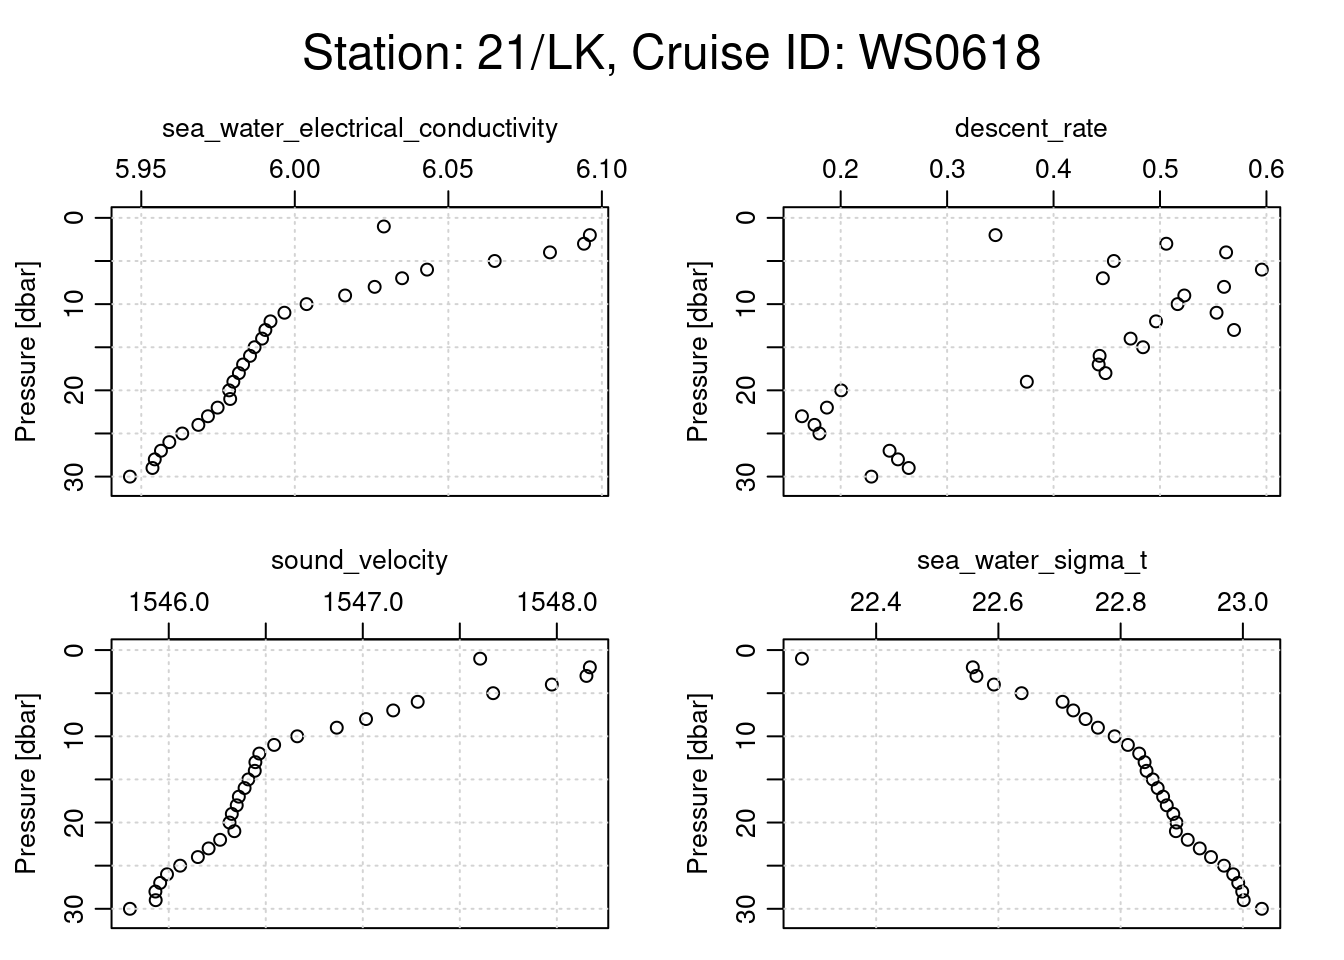
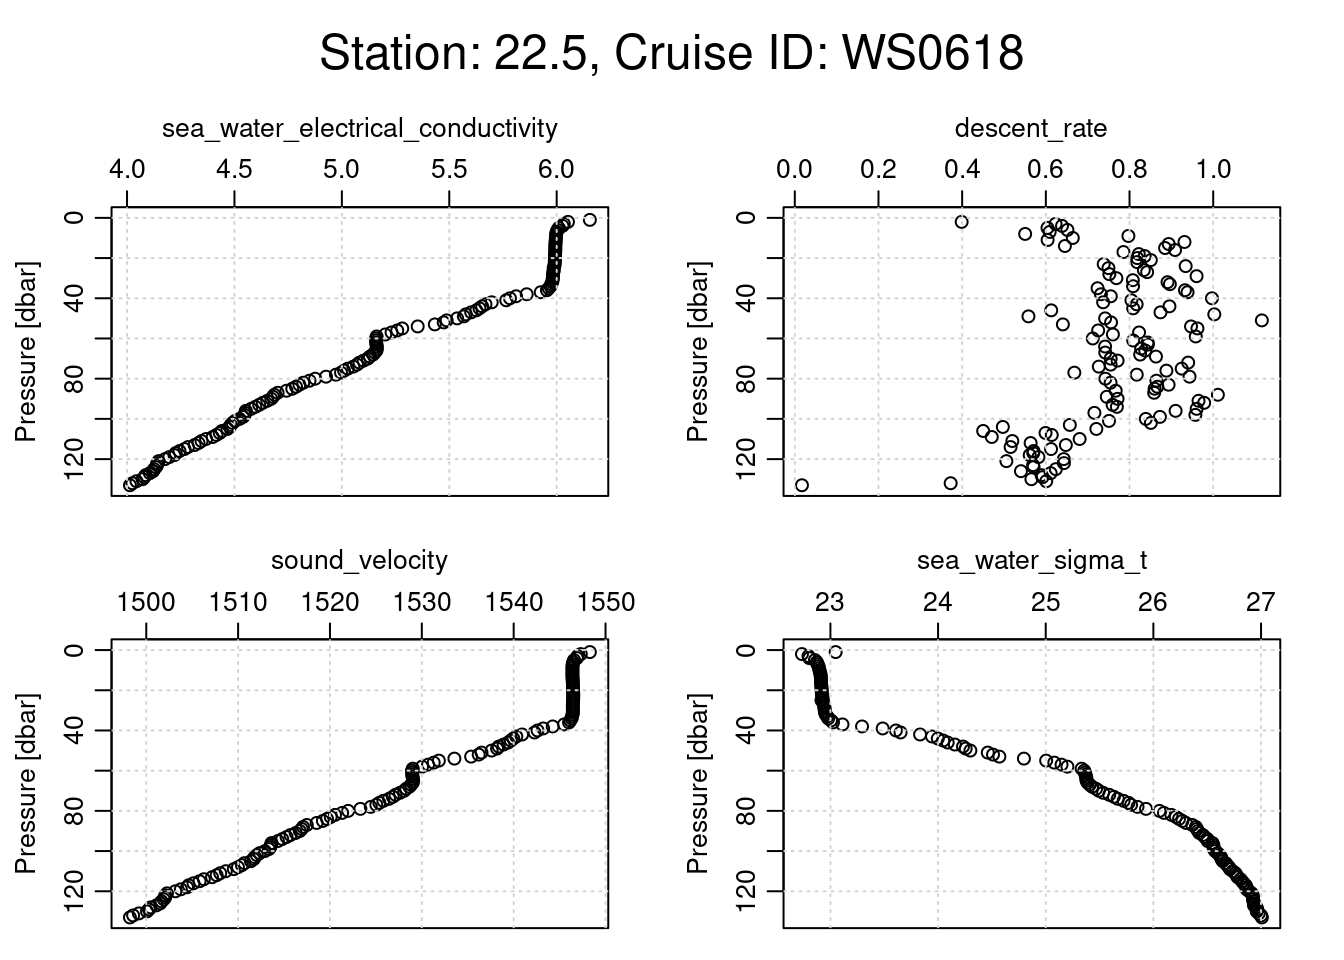
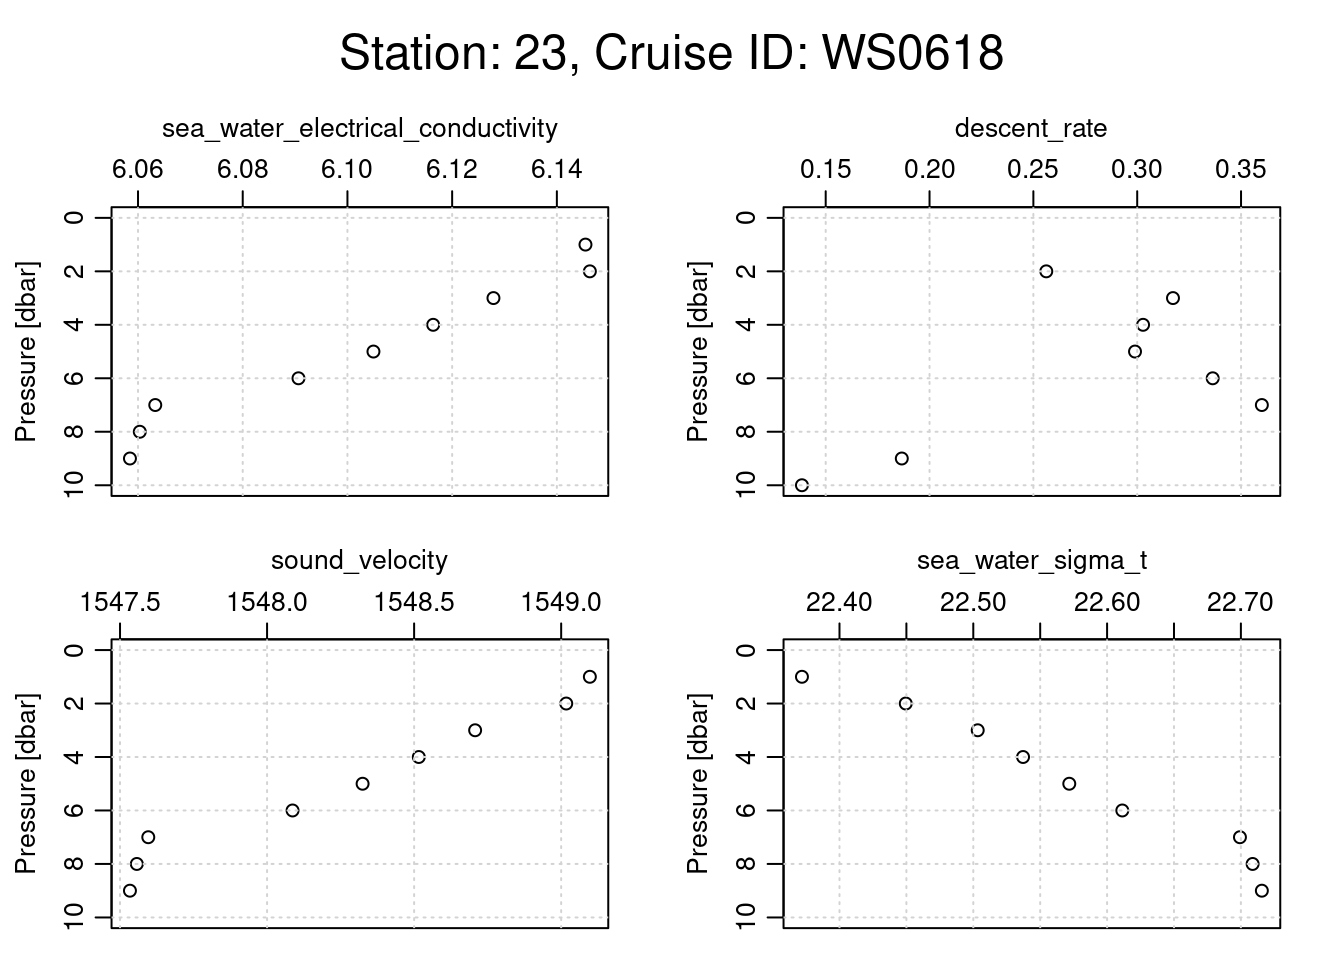
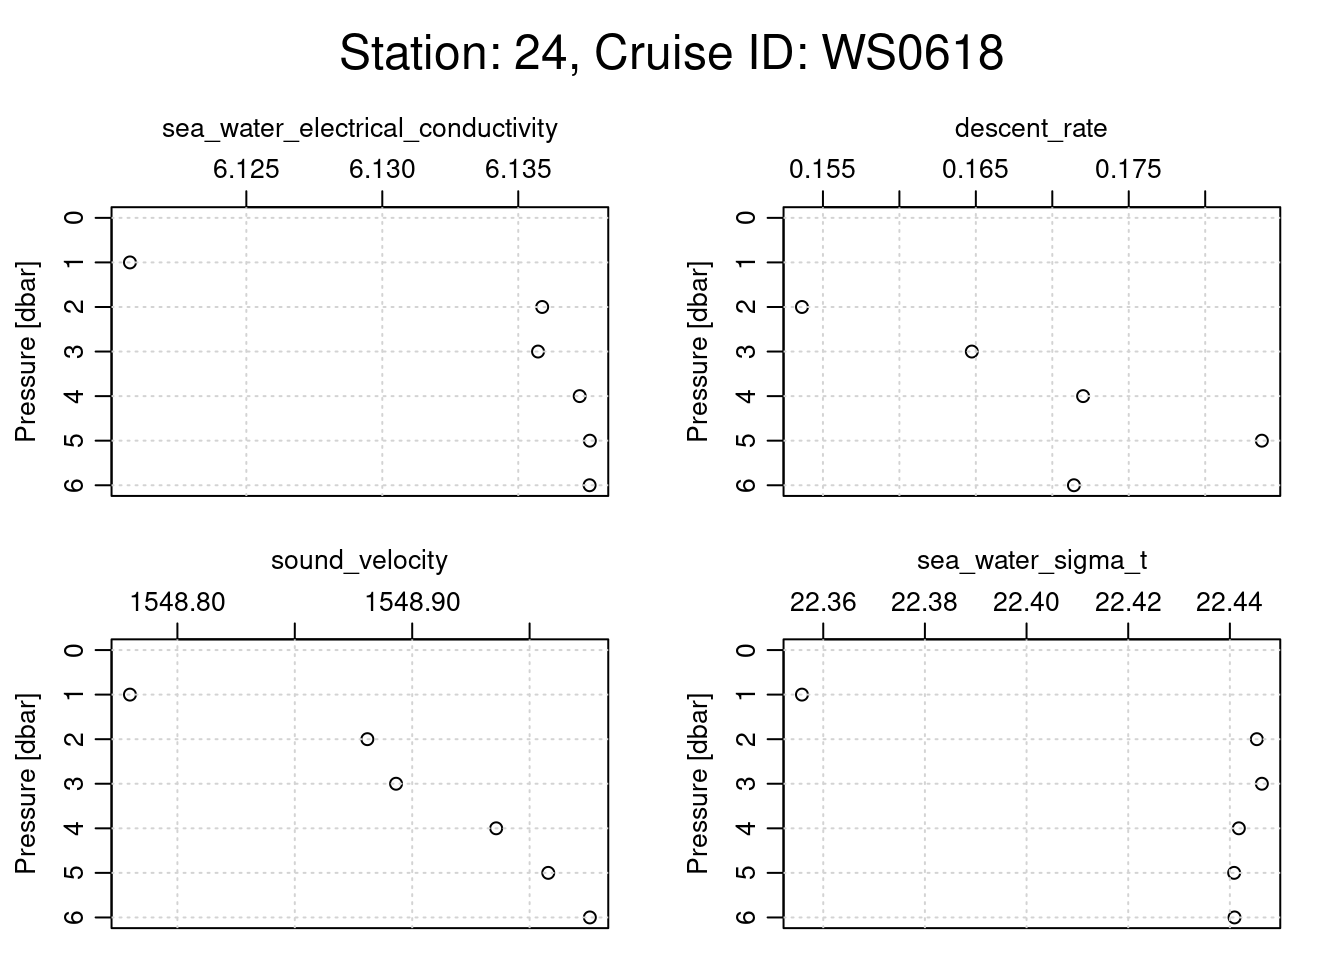
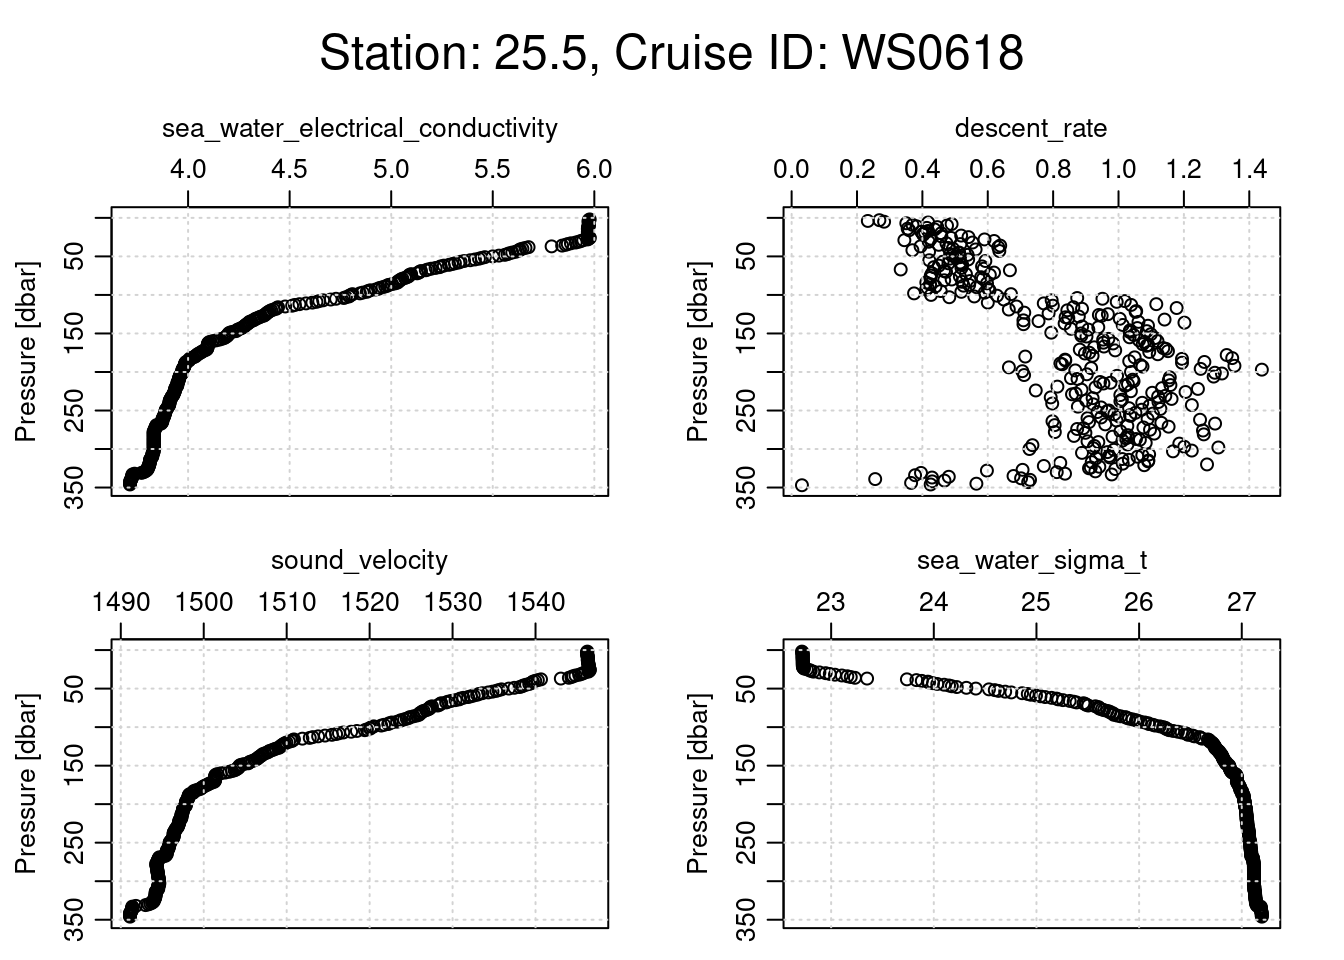
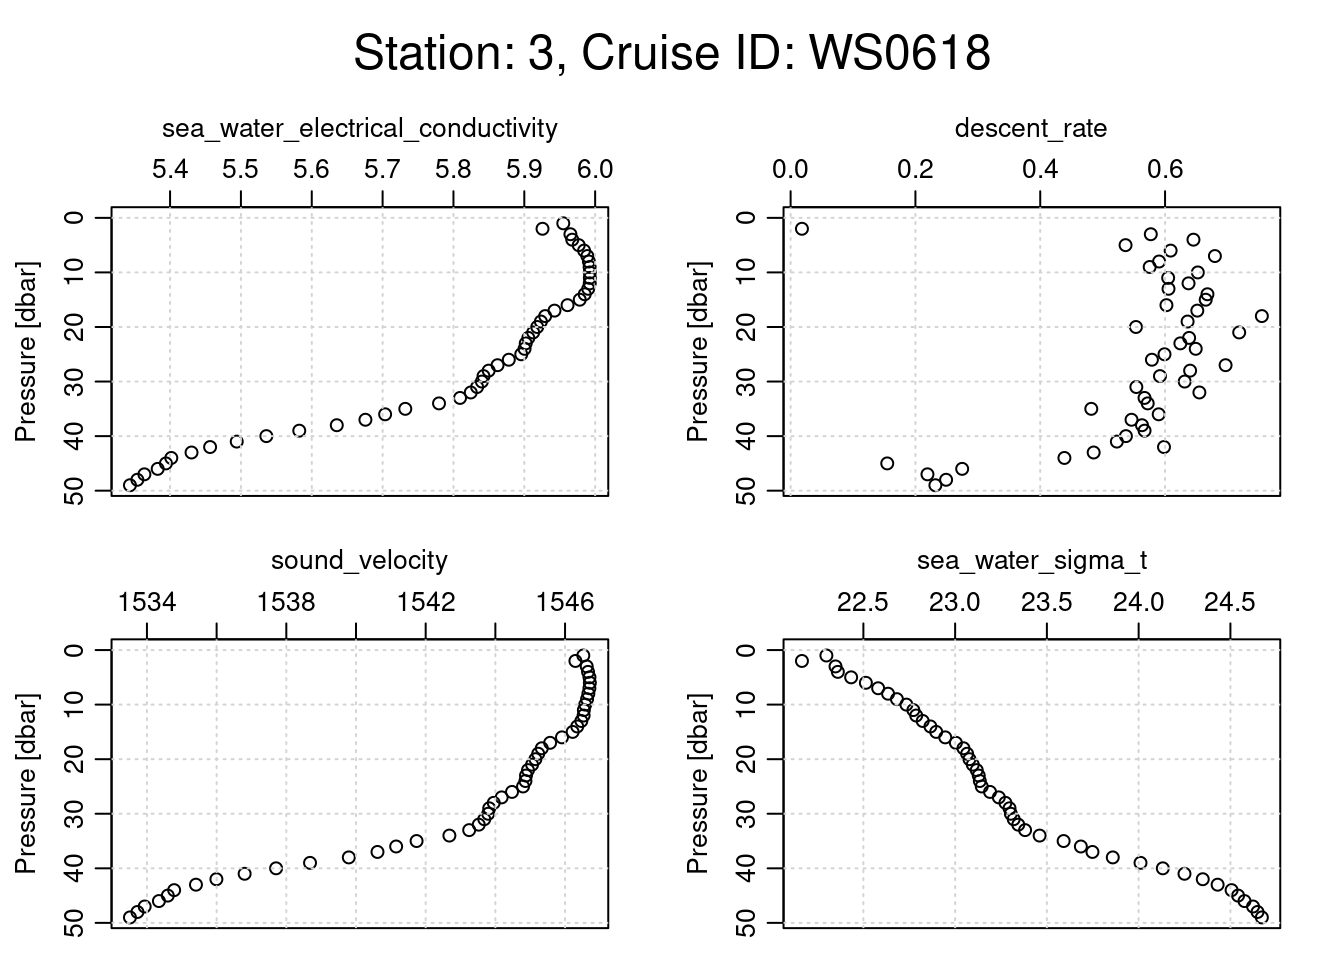
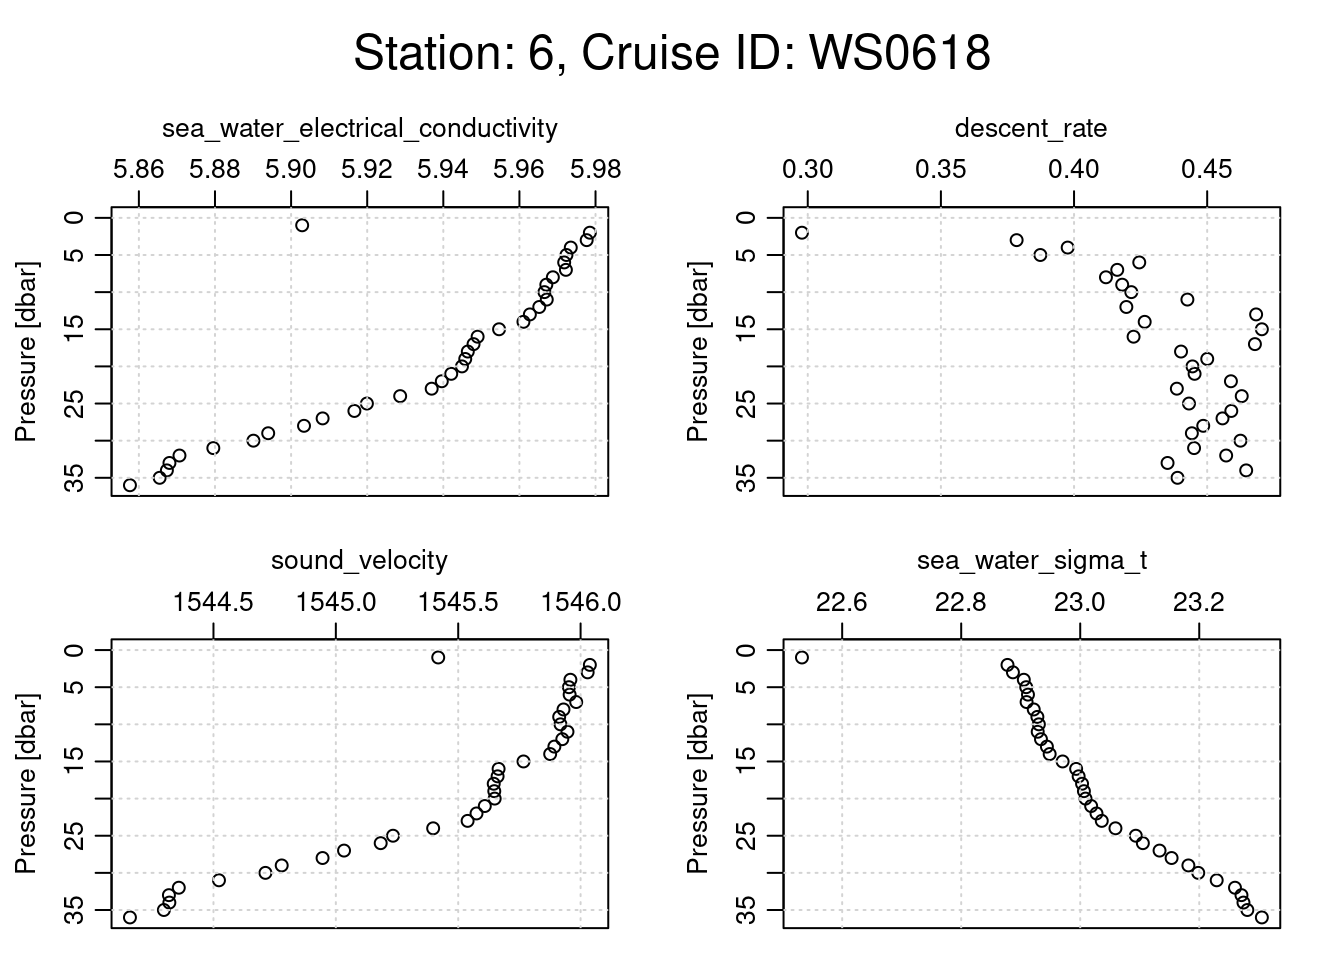
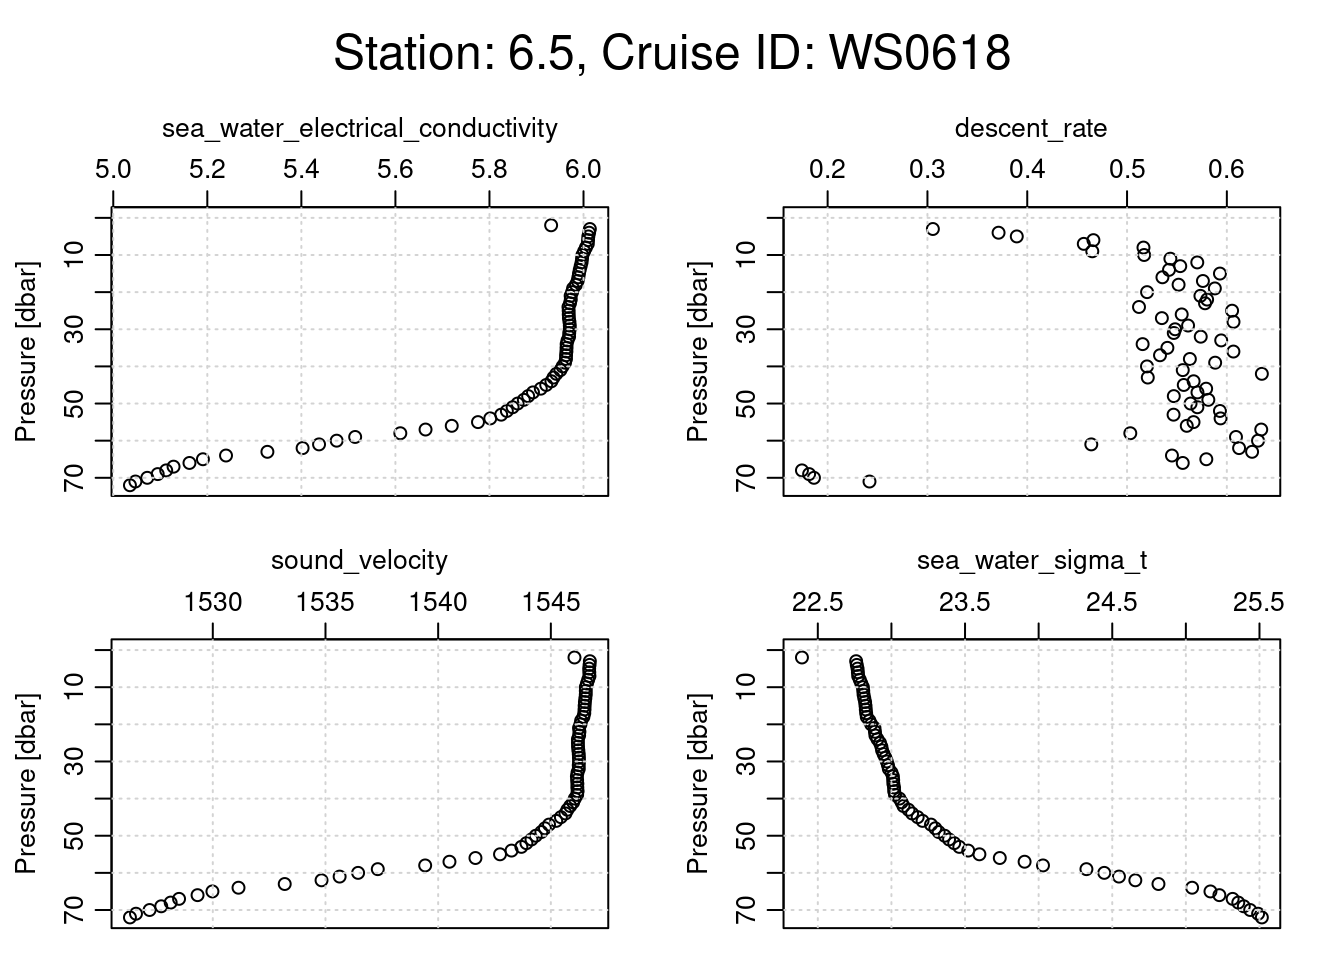
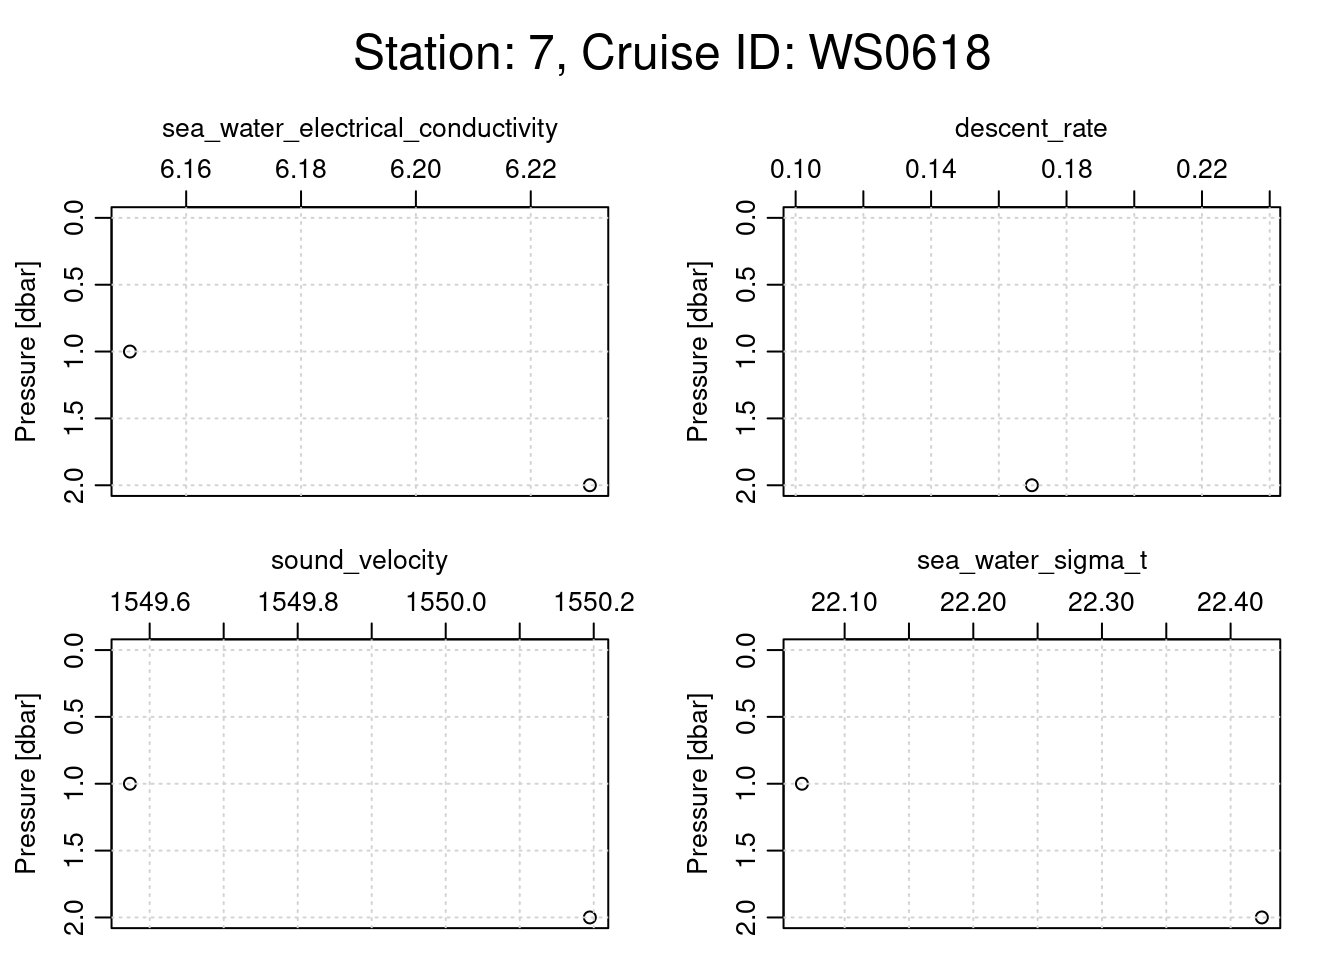
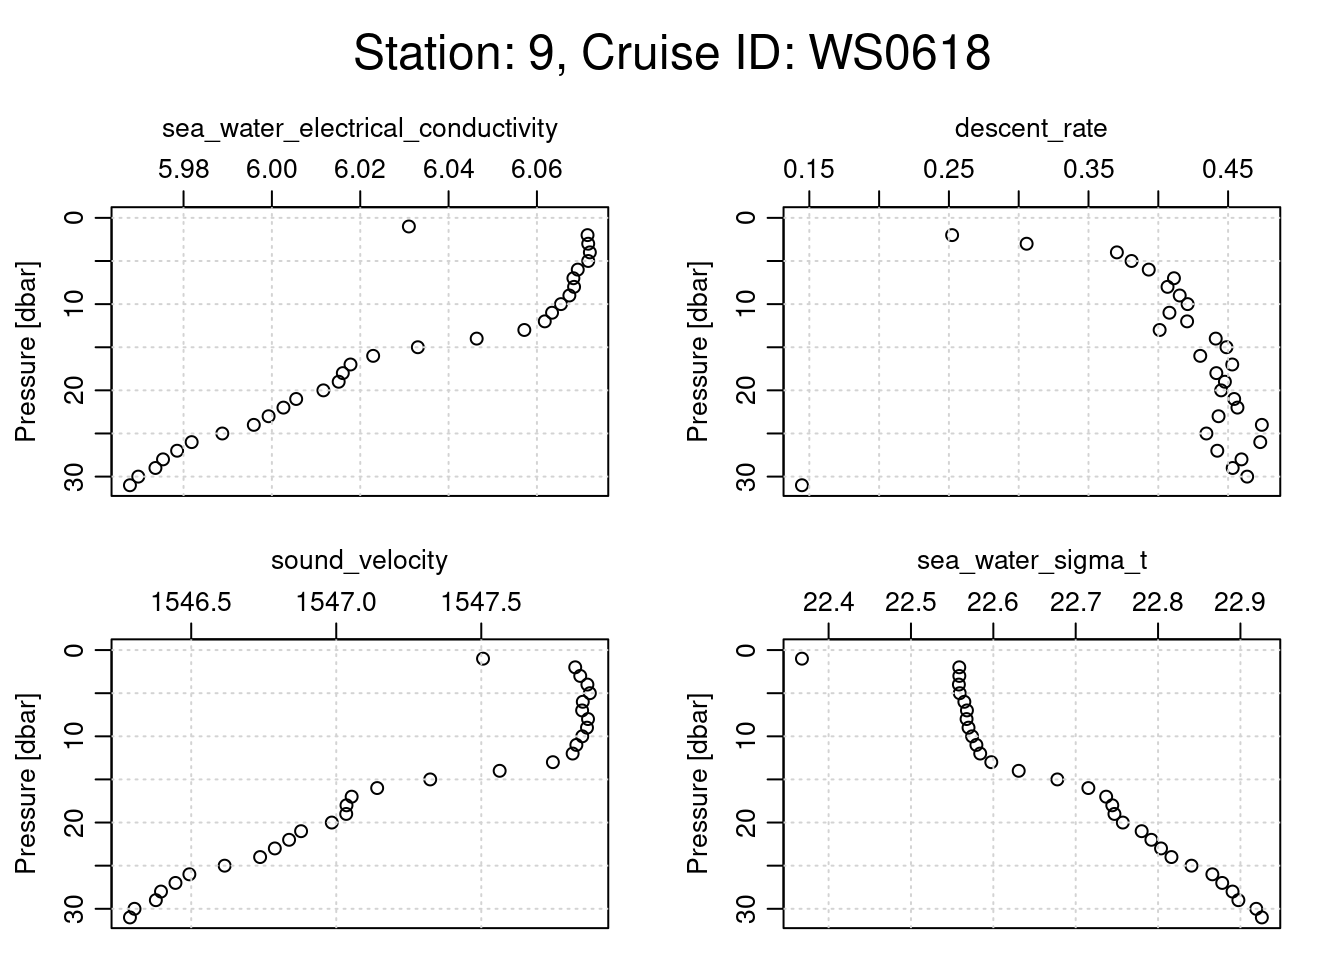
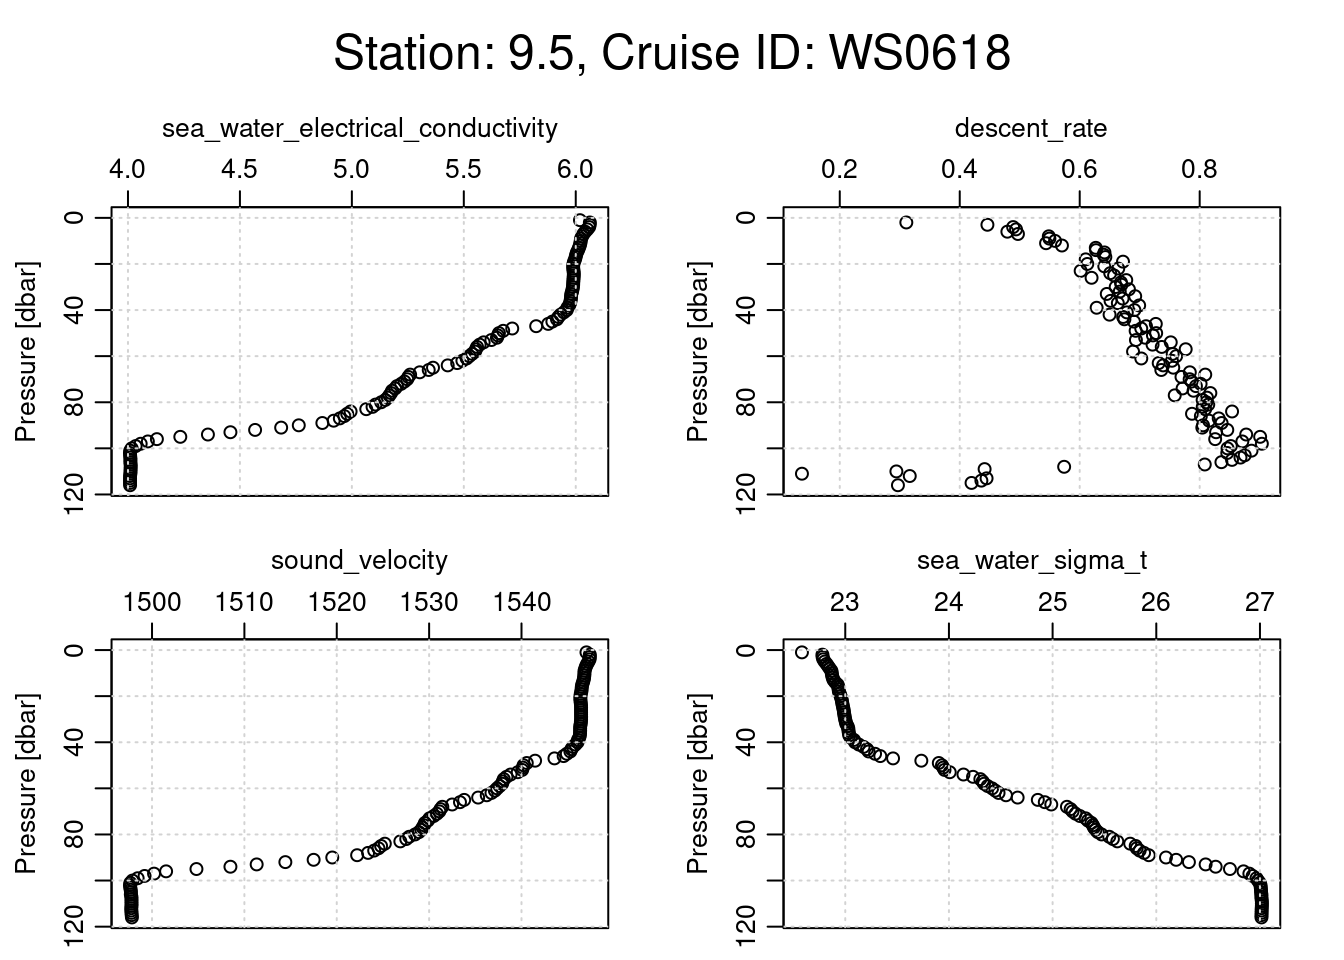
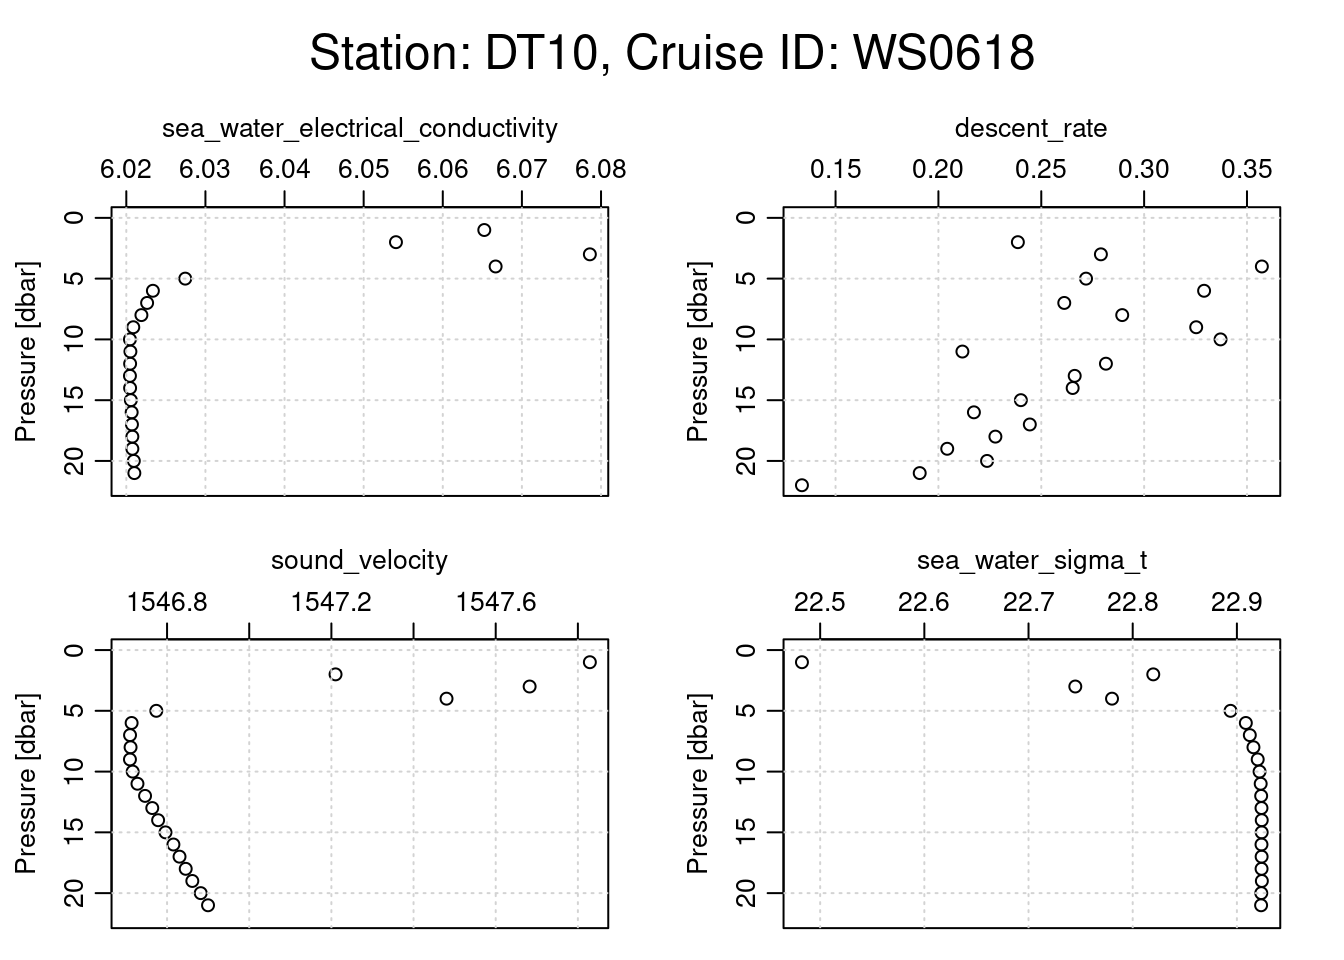
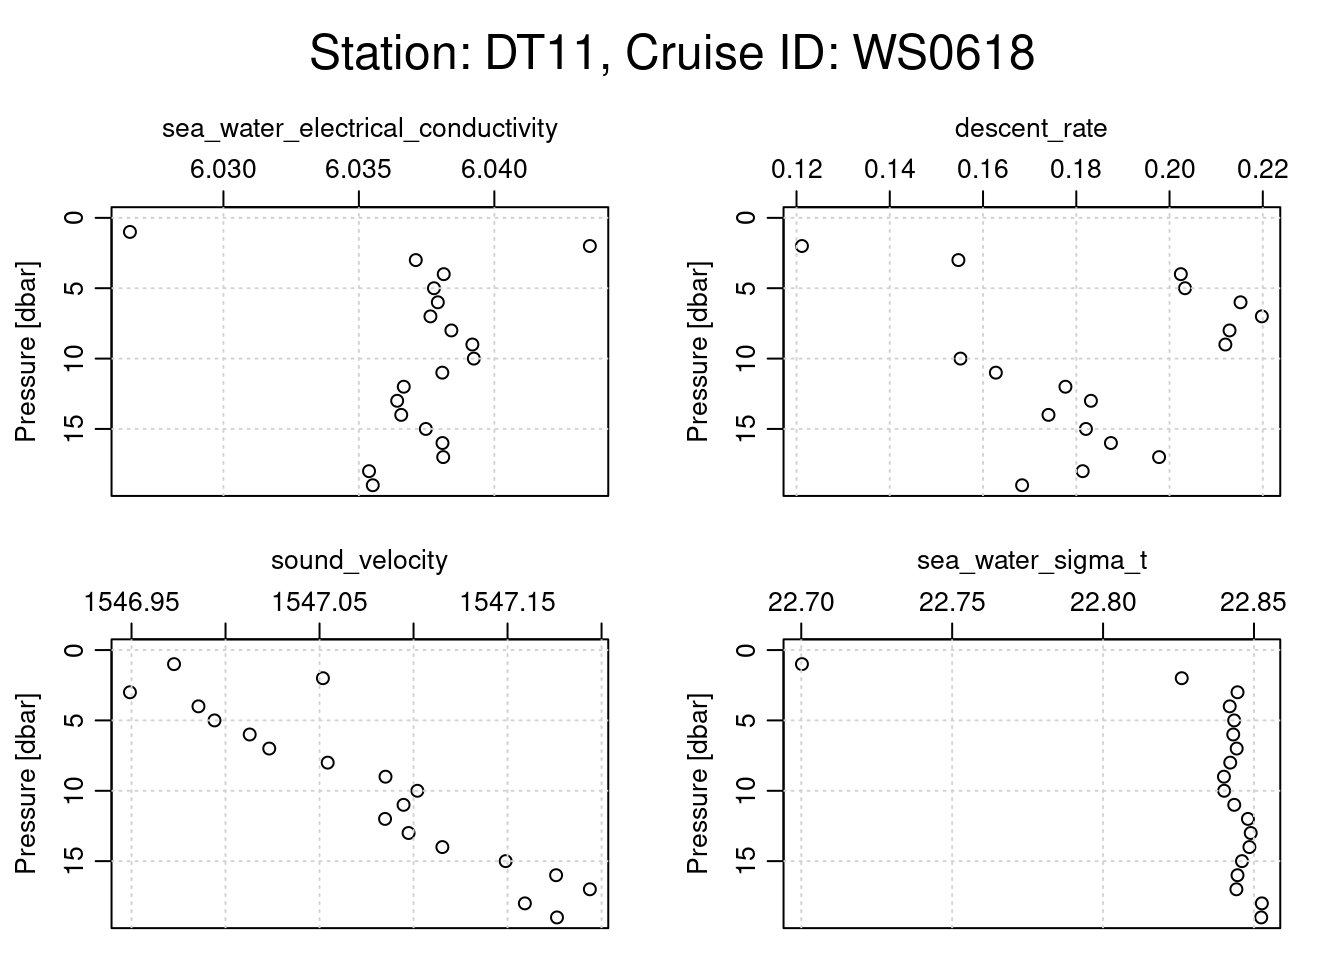
# Loop through each CTD castfor (i inseq(ctd_FK)){ cast <- ctd_FK[[i]] # Assuming each sublist contains only one relevant CTD objecttryCatch({# Extract metadata for station name and cruise ID station_name <- cast@metadata$station[1] cruise_id <- cast@data$cruise_id[1]# Generate a title with station name and cruise ID overall_title <- glue::glue("Station: {station_name}, Cruise ID: {cruise_id}")# Set margins: increase the outer margin for the titlepar(oma =c(0, 0, 3, 0)) # Top outer margin increased for title# Plotting function with specific parameters oce::plot(x =ctdDecimate(ctdTrim(cast)),which =c("sea_water_electrical_conductivity","descent_rate", "sound_velocity","sea_water_sigma_t","altimeter" ),main =""# No main title for individual subplots )# Place a single overall title at the top of the plot framemtext(overall_title, side =3, line =1, outer =TRUE, cex =1.5)# Reset outer margins to defaultpar(oma =c(0, 0, 0, 0)) }, error =function(e) {print(e$message) # Print any errors that occur during plotting })}
[1] "need finite 'xlim' values"
[1] "need finite 'xlim' values"
[1] "need finite 'xlim' values"
[1] "need finite 'xlim' values"
[1] "need finite 'xlim' values"
[1] "need finite 'xlim' values"
[1] "unknown xtype value (\"6.04817\")"
plotting other nutrient parameters for each cast
# Loop through each CTD castfor (i inseq(ctd_FK)){ cast <- ctd_FK[[i]] # Assuming each sublist contains only one relevant CTD objecttryCatch({# Extract metadata for station name and cruise ID station_name <- cast@metadata$station[1] cruise_id <- cast@data$cruise_id[1]# Generate a title with station name and cruise ID overall_title <- glue::glue("Station: {station_name}, Cruise ID: {cruise_id}")# Set margins: increase the outer margin for the titlepar(oma =c(0, 0, 3, 0)) # Top outer margin increased for title# Plotting function with specific parameters oce::plot(x =ctdDecimate(ctdTrim(cast)),which =c("CDOM", "dissolved_oxygen","oxygen_saturation","chlorophyll_concentration", "chlorophyll_fluorescence" ),main =""# No main title for individual subplots )# Place a single overall title at the top of the plot framemtext(overall_title, side =3, line =1, outer =TRUE, cex =1.5)# Reset outer margins to defaultpar(oma =c(0, 0, 0, 0)) }, error =function(e) {print(e$message) # Print any errors that occur during plotting })}
[1] "In plot,ctd-method() : which=\"CDOMdissolved_oxygenoxygen_saturationchlorophyll_concentrationchlorophyll_fluorescence\" cannot be handled"
[1] "In plot,ctd-method() : which=\"CDOMdissolved_oxygenoxygen_saturationchlorophyll_concentrationchlorophyll_fluorescence\" cannot be handled"
[1] "In plot,ctd-method() : which=\"CDOMdissolved_oxygenoxygen_saturationchlorophyll_concentrationchlorophyll_fluorescence\" cannot be handled"
[1] "In plot,ctd-method() : which=\"CDOMdissolved_oxygenoxygen_saturationchlorophyll_concentrationchlorophyll_fluorescence\" cannot be handled"
[1] "In plot,ctd-method() : which=\"CDOMdissolved_oxygenoxygen_saturationchlorophyll_concentrationchlorophyll_fluorescence\" cannot be handled"
[1] "In plot,ctd-method() : which=\"CDOMdissolved_oxygenoxygen_saturationchlorophyll_concentrationchlorophyll_fluorescence\" cannot be handled"
[1] "In plot,ctd-method() : which=\"CDOMdissolved_oxygenoxygen_saturationchlorophyll_concentrationchlorophyll_fluorescence\" cannot be handled"
[1] "In plot,ctd-method() : which=\"CDOMdissolved_oxygenoxygen_saturationchlorophyll_concentrationchlorophyll_fluorescence\" cannot be handled"
[1] "In plot,ctd-method() : which=\"CDOMdissolved_oxygenoxygen_saturationchlorophyll_concentrationchlorophyll_fluorescence\" cannot be handled"
[1] "In plot,ctd-method() : which=\"CDOMdissolved_oxygenoxygen_saturationchlorophyll_concentrationchlorophyll_fluorescence\" cannot be handled"
[1] "In plot,ctd-method() : which=\"CDOMdissolved_oxygenoxygen_saturationchlorophyll_concentrationchlorophyll_fluorescence\" cannot be handled"
[1] "In plot,ctd-method() : which=\"CDOMdissolved_oxygenoxygen_saturationchlorophyll_concentrationchlorophyll_fluorescence\" cannot be handled"
[1] "In plot,ctd-method() : which=\"CDOMdissolved_oxygenoxygen_saturationchlorophyll_concentrationchlorophyll_fluorescence\" cannot be handled"
[1] "In plot,ctd-method() : which=\"CDOMdissolved_oxygenoxygen_saturationchlorophyll_concentrationchlorophyll_fluorescence\" cannot be handled"
[1] "In plot,ctd-method() : which=\"CDOMdissolved_oxygenoxygen_saturationchlorophyll_concentrationchlorophyll_fluorescence\" cannot be handled"
[1] "In plot,ctd-method() : which=\"CDOMdissolved_oxygenoxygen_saturationchlorophyll_concentrationchlorophyll_fluorescence\" cannot be handled"
[1] "In plot,ctd-method() : which=\"CDOMdissolved_oxygenoxygen_saturationchlorophyll_concentrationchlorophyll_fluorescence\" cannot be handled"
[1] "In plot,ctd-method() : which=\"CDOMdissolved_oxygenoxygen_saturationchlorophyll_concentrationchlorophyll_fluorescence\" cannot be handled"
[1] "In plot,ctd-method() : which=\"CDOMdissolved_oxygenoxygen_saturationchlorophyll_concentrationchlorophyll_fluorescence\" cannot be handled"
[1] "In plot,ctd-method() : which=\"CDOMdissolved_oxygenoxygen_saturationchlorophyll_concentrationchlorophyll_fluorescence\" cannot be handled"
[1] "In plot,ctd-method() : which=\"CDOMdissolved_oxygenoxygen_saturationchlorophyll_concentrationchlorophyll_fluorescence\" cannot be handled"
[1] "In plot,ctd-method() : which=\"CDOMdissolved_oxygenoxygen_saturationchlorophyll_concentrationchlorophyll_fluorescence\" cannot be handled"
[1] "In plot,ctd-method() : which=\"CDOMdissolved_oxygenoxygen_saturationchlorophyll_concentrationchlorophyll_fluorescence\" cannot be handled"
[1] "In plot,ctd-method() : which=\"CDOMdissolved_oxygenoxygen_saturationchlorophyll_concentrationchlorophyll_fluorescence\" cannot be handled"
[1] "In plot,ctd-method() : which=\"CDOMdissolved_oxygenoxygen_saturationchlorophyll_concentrationchlorophyll_fluorescence\" cannot be handled"
[1] "In plot,ctd-method() : which=\"CDOMdissolved_oxygenoxygen_saturationchlorophyll_concentrationchlorophyll_fluorescence\" cannot be handled"
[1] "In plot,ctd-method() : which=\"CDOMdissolved_oxygenoxygen_saturationchlorophyll_concentrationchlorophyll_fluorescence\" cannot be handled"
[1] "In plot,ctd-method() : which=\"CDOMdissolved_oxygenoxygen_saturationchlorophyll_concentrationchlorophyll_fluorescence\" cannot be handled"
[1] "In plot,ctd-method() : which=\"CDOMdissolved_oxygenoxygen_saturationchlorophyll_concentrationchlorophyll_fluorescence\" cannot be handled"
[1] "In plot,ctd-method() : which=\"CDOMdissolved_oxygenoxygen_saturationchlorophyll_concentrationchlorophyll_fluorescence\" cannot be handled"
[1] "In plot,ctd-method() : which=\"CDOMdissolved_oxygenoxygen_saturationchlorophyll_concentrationchlorophyll_fluorescence\" cannot be handled"
[1] "In plot,ctd-method() : which=\"CDOMdissolved_oxygenoxygen_saturationchlorophyll_concentrationchlorophyll_fluorescence\" cannot be handled"
[1] "In plot,ctd-method() : which=\"CDOMdissolved_oxygenoxygen_saturationchlorophyll_concentrationchlorophyll_fluorescence\" cannot be handled"
[1] "In plot,ctd-method() : which=\"CDOMdissolved_oxygenoxygen_saturationchlorophyll_concentrationchlorophyll_fluorescence\" cannot be handled"
[1] "In plot,ctd-method() : which=\"CDOMdissolved_oxygenoxygen_saturationchlorophyll_concentrationchlorophyll_fluorescence\" cannot be handled"
[1] "In plot,ctd-method() : which=\"CDOMdissolved_oxygenoxygen_saturationchlorophyll_concentrationchlorophyll_fluorescence\" cannot be handled"
[1] "In plot,ctd-method() : which=\"CDOMdissolved_oxygenoxygen_saturationchlorophyll_concentrationchlorophyll_fluorescence\" cannot be handled"
[1] "In plot,ctd-method() : which=\"CDOMdissolved_oxygenoxygen_saturationchlorophyll_concentrationchlorophyll_fluorescence\" cannot be handled"
[1] "In plot,ctd-method() : which=\"CDOMdissolved_oxygenoxygen_saturationchlorophyll_concentrationchlorophyll_fluorescence\" cannot be handled"
[1] "In plot,ctd-method() : which=\"CDOMdissolved_oxygenoxygen_saturationchlorophyll_concentrationchlorophyll_fluorescence\" cannot be handled"
[1] "In plot,ctd-method() : which=\"CDOMdissolved_oxygenoxygen_saturationchlorophyll_concentrationchlorophyll_fluorescence\" cannot be handled"
[1] "In plot,ctd-method() : which=\"CDOMdissolved_oxygenoxygen_saturationchlorophyll_concentrationchlorophyll_fluorescence\" cannot be handled"
[1] "In plot,ctd-method() : which=\"CDOMdissolved_oxygenoxygen_saturationchlorophyll_concentrationchlorophyll_fluorescence\" cannot be handled"
[1] "In plot,ctd-method() : which=\"CDOMdissolved_oxygenoxygen_saturationchlorophyll_concentrationchlorophyll_fluorescence\" cannot be handled"
[1] "In plot,ctd-method() : which=\"CDOMdissolved_oxygenoxygen_saturationchlorophyll_concentrationchlorophyll_fluorescence\" cannot be handled"
[1] "In plot,ctd-method() : which=\"CDOMdissolved_oxygenoxygen_saturationchlorophyll_concentrationchlorophyll_fluorescence\" cannot be handled"
[1] "In plot,ctd-method() : which=\"CDOMdissolved_oxygenoxygen_saturationchlorophyll_concentrationchlorophyll_fluorescence\" cannot be handled"
[1] "In plot,ctd-method() : which=\"CDOMdissolved_oxygenoxygen_saturationchlorophyll_concentrationchlorophyll_fluorescence\" cannot be handled"
[1] "In plot,ctd-method() : which=\"CDOMdissolved_oxygenoxygen_saturationchlorophyll_concentrationchlorophyll_fluorescence\" cannot be handled"
[1] "In plot,ctd-method() : which=\"CDOMdissolved_oxygenoxygen_saturationchlorophyll_concentrationchlorophyll_fluorescence\" cannot be handled"
[1] "In plot,ctd-method() : which=\"CDOMdissolved_oxygenoxygen_saturationchlorophyll_concentrationchlorophyll_fluorescence\" cannot be handled"
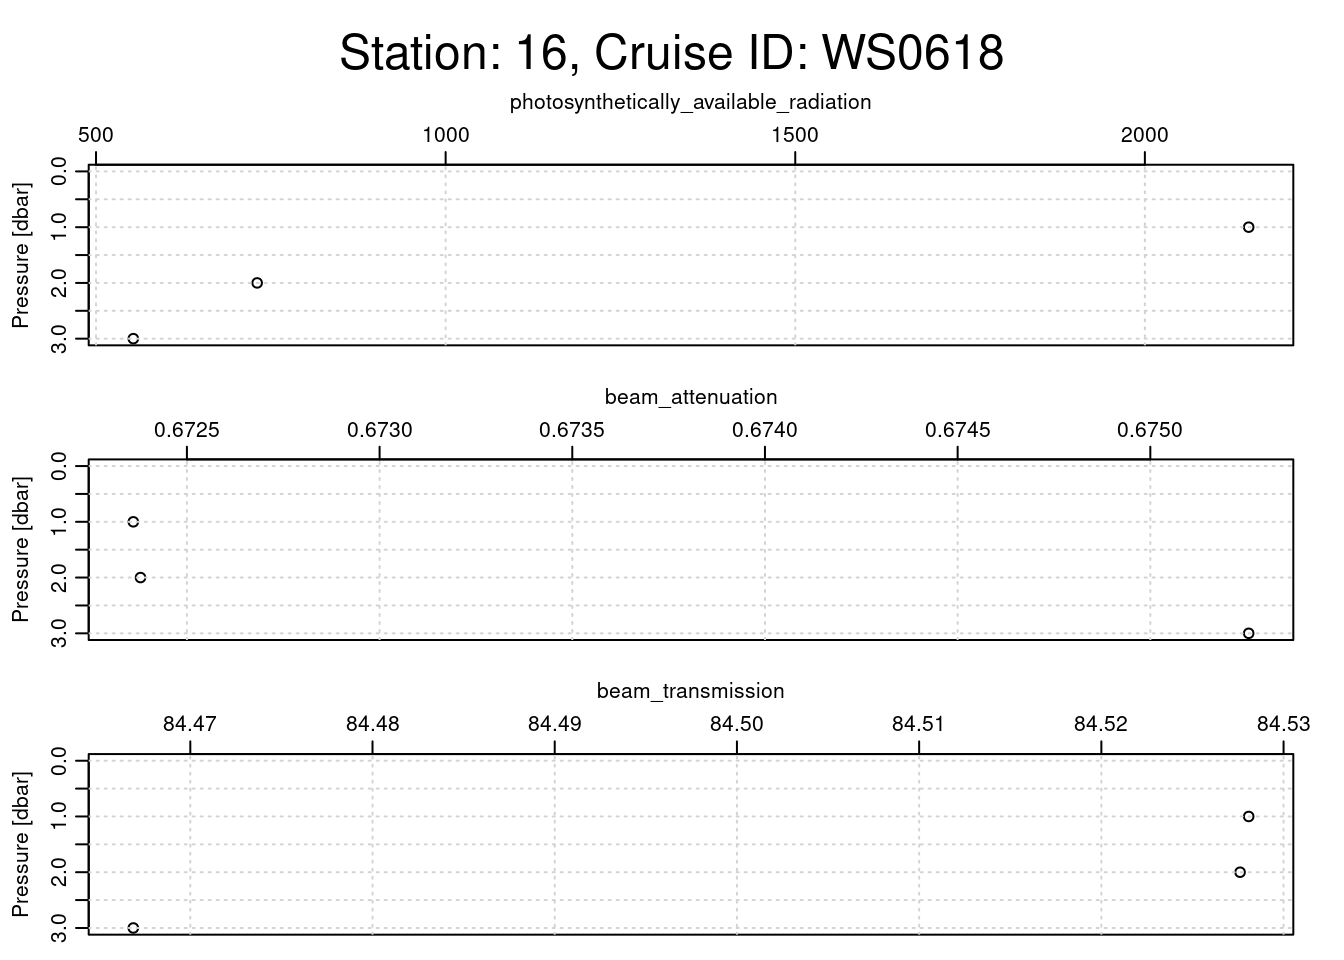
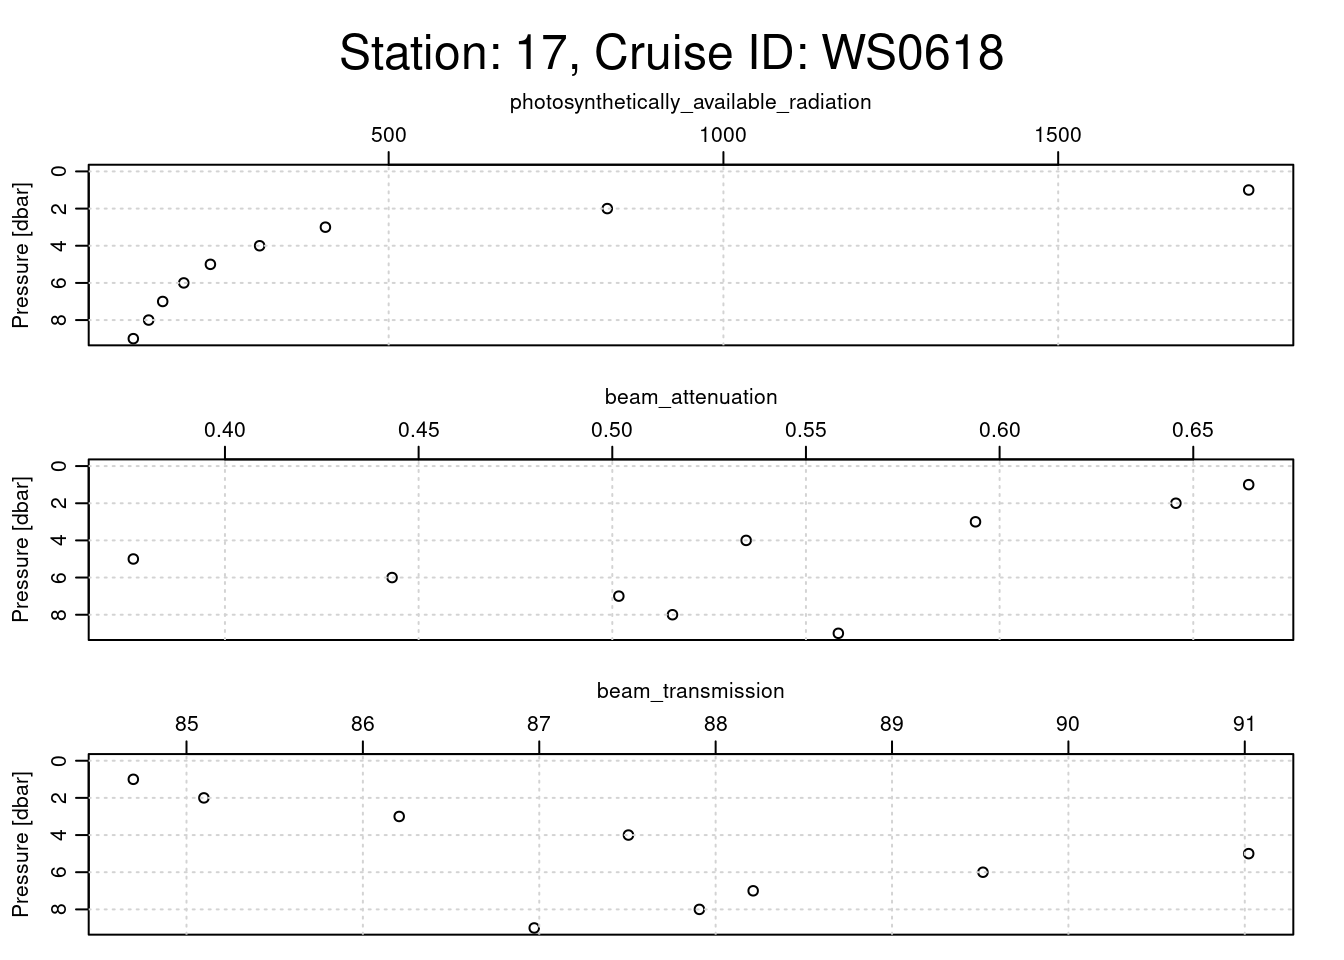
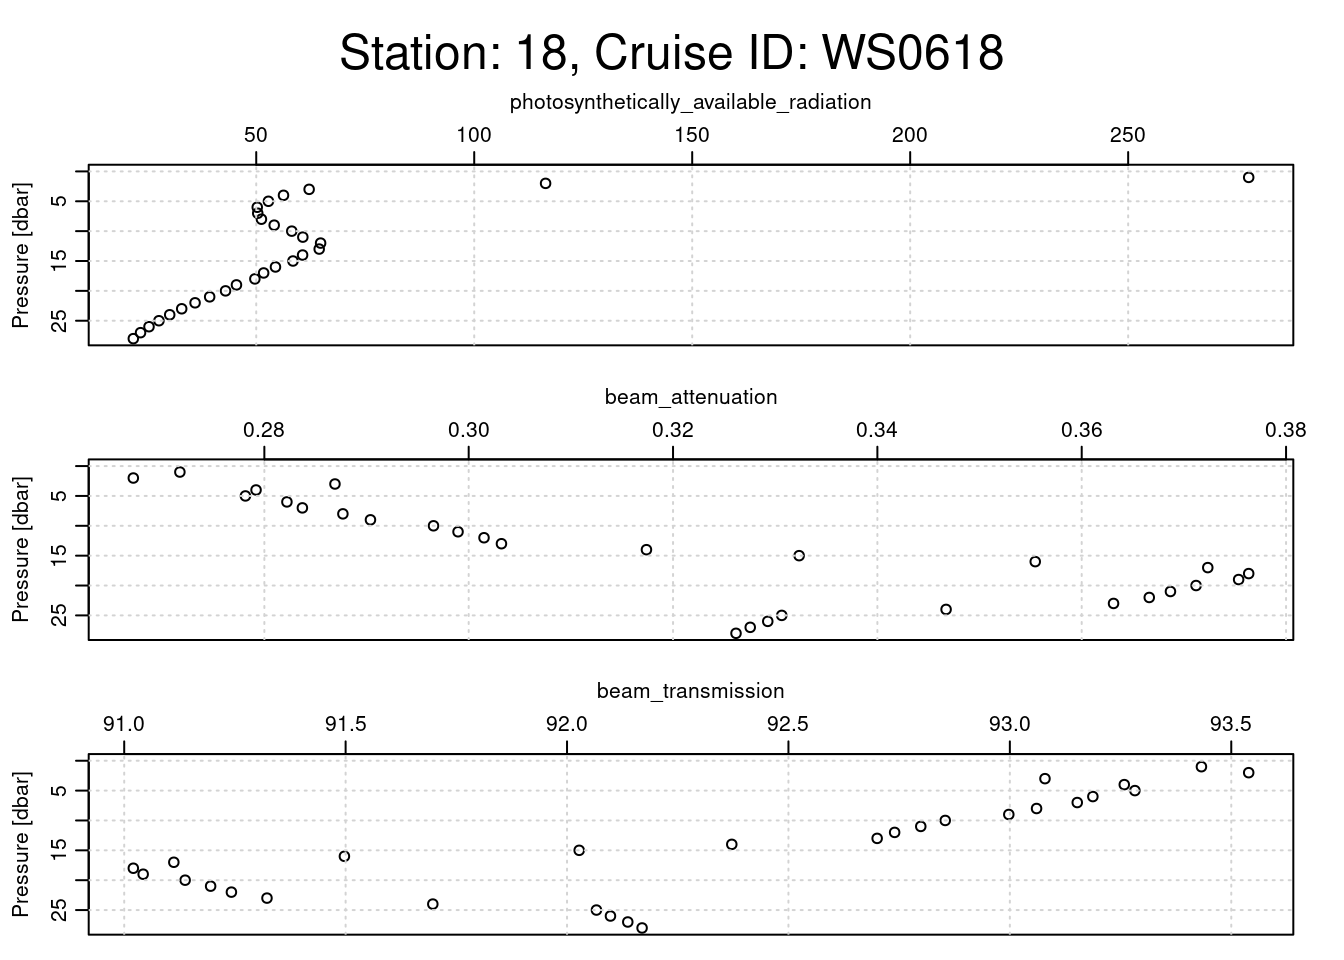
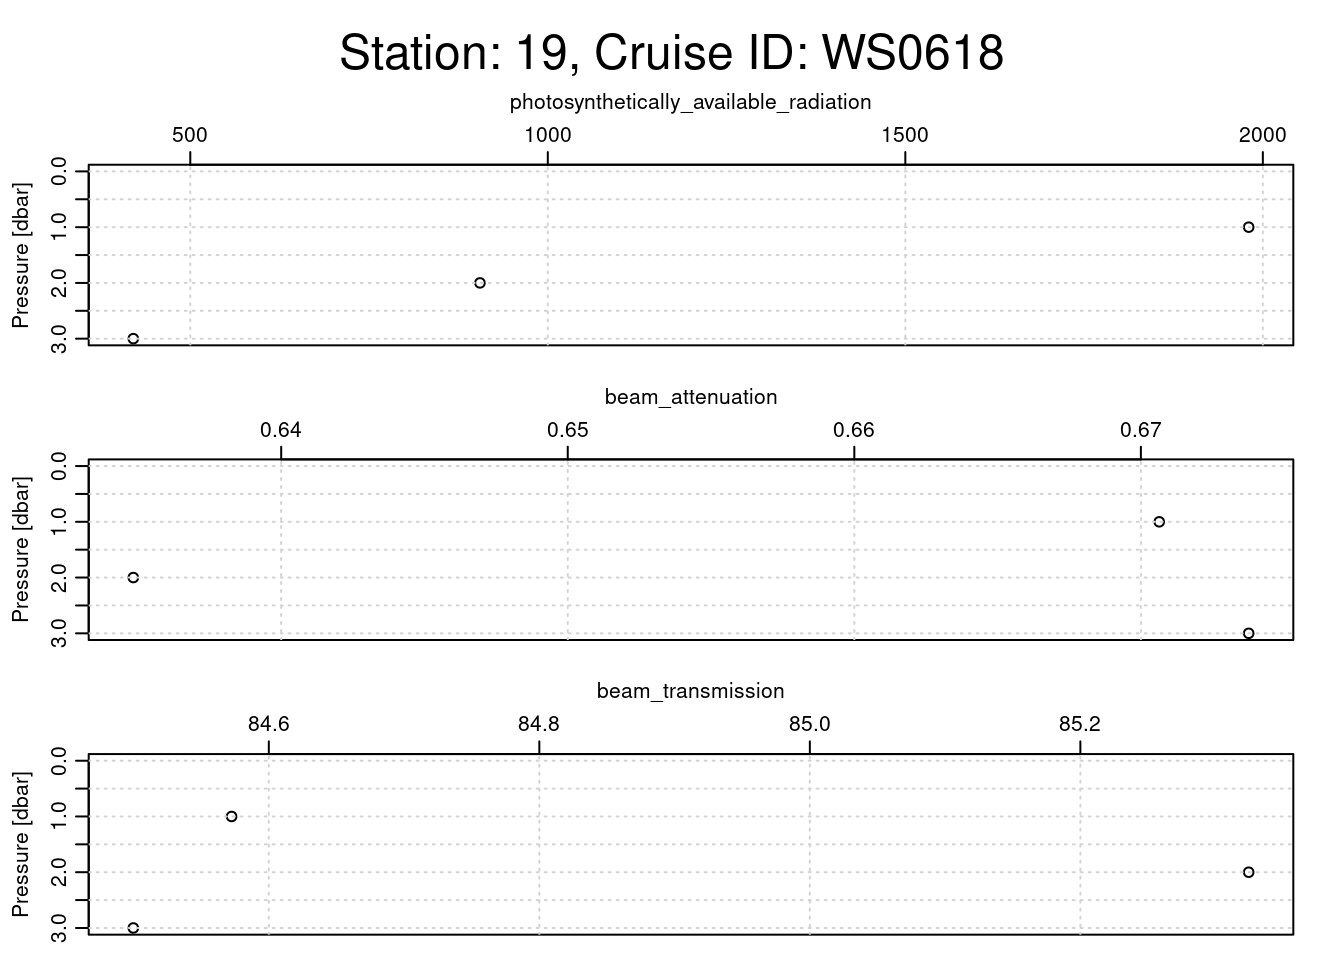
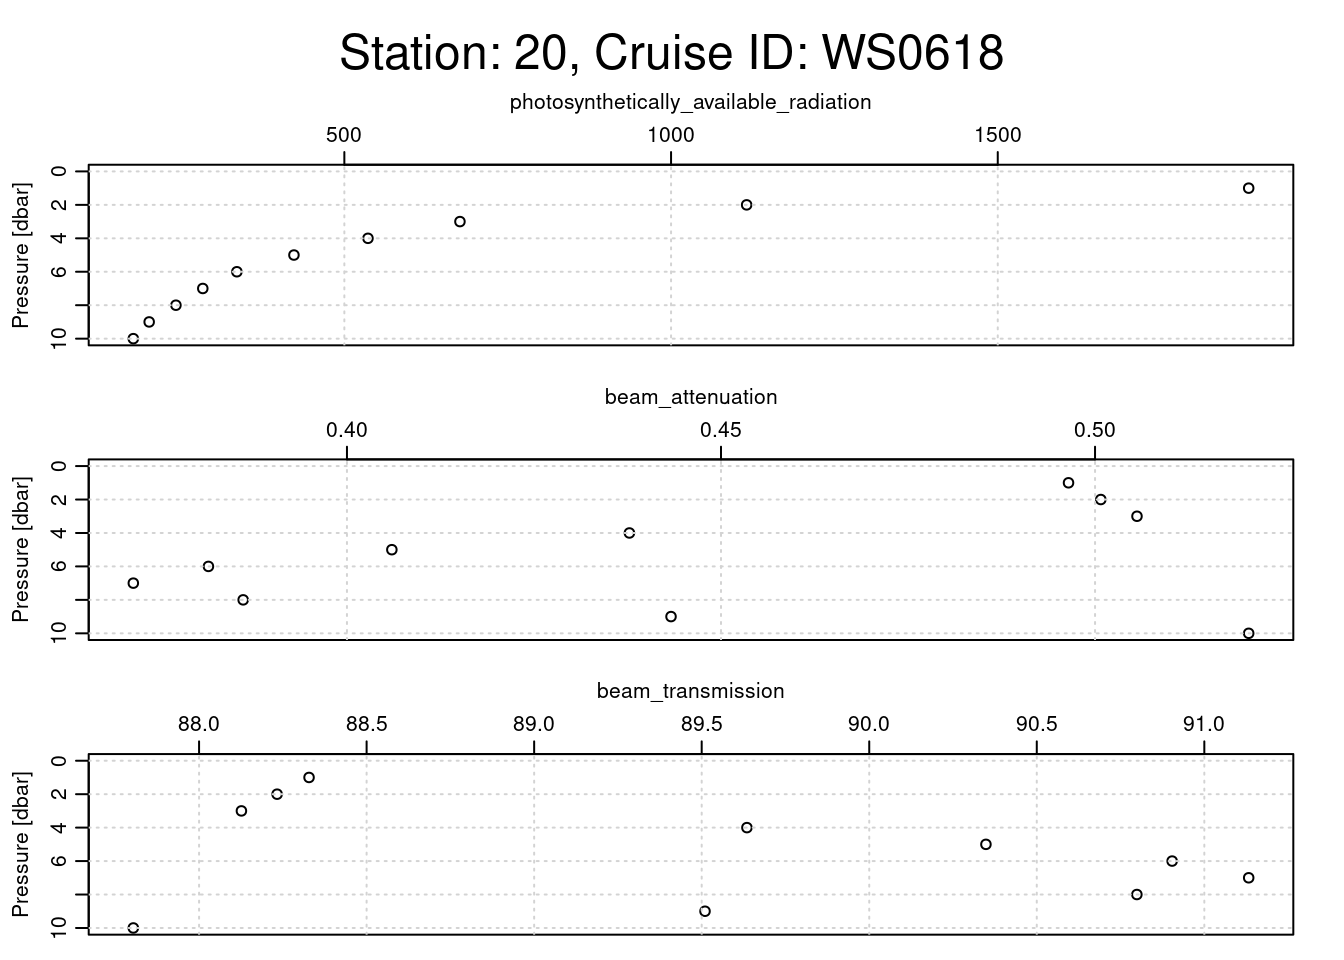
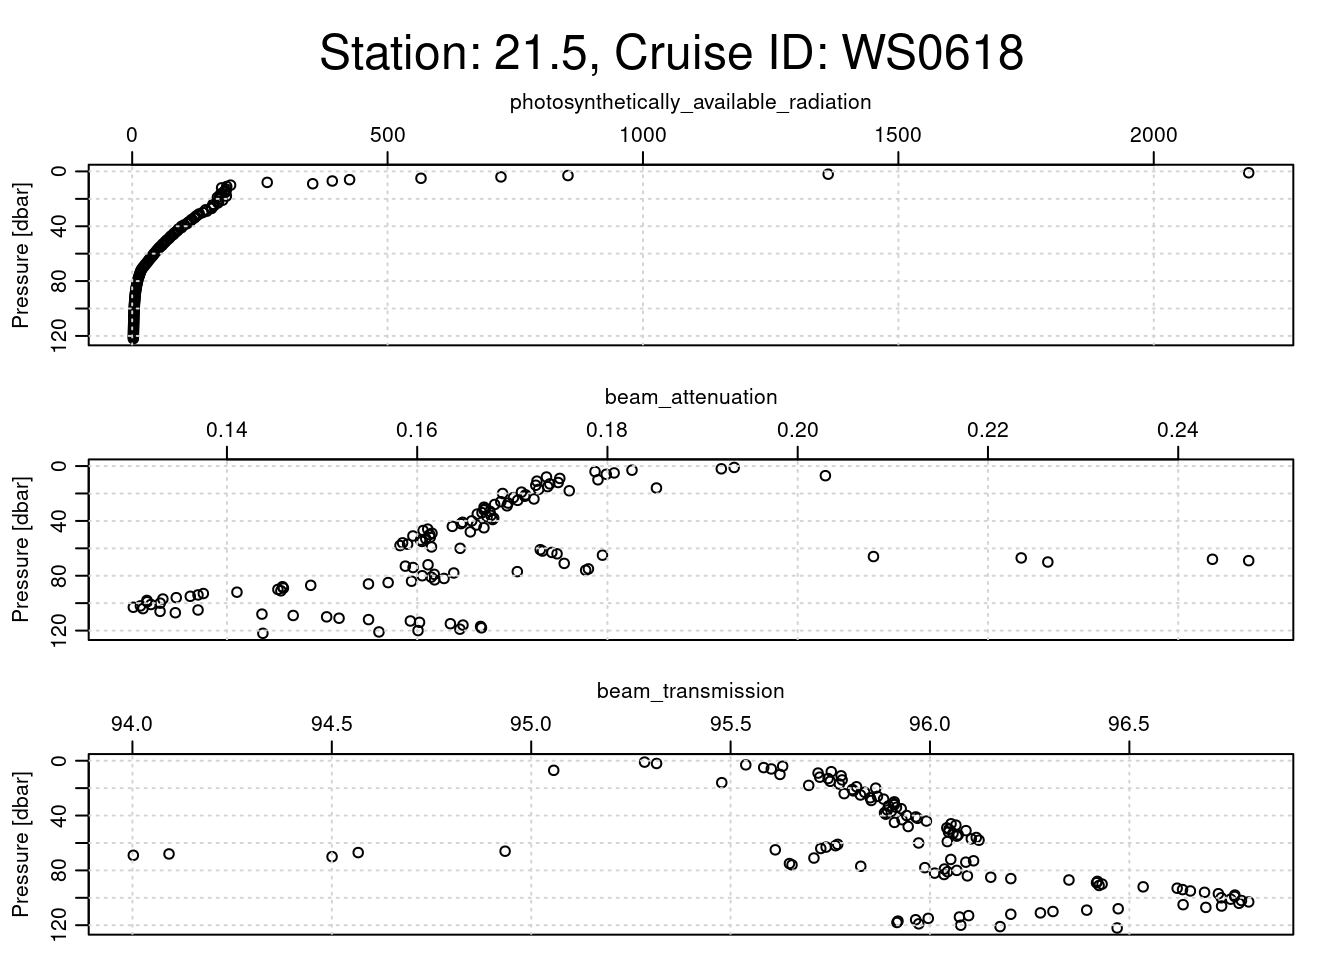
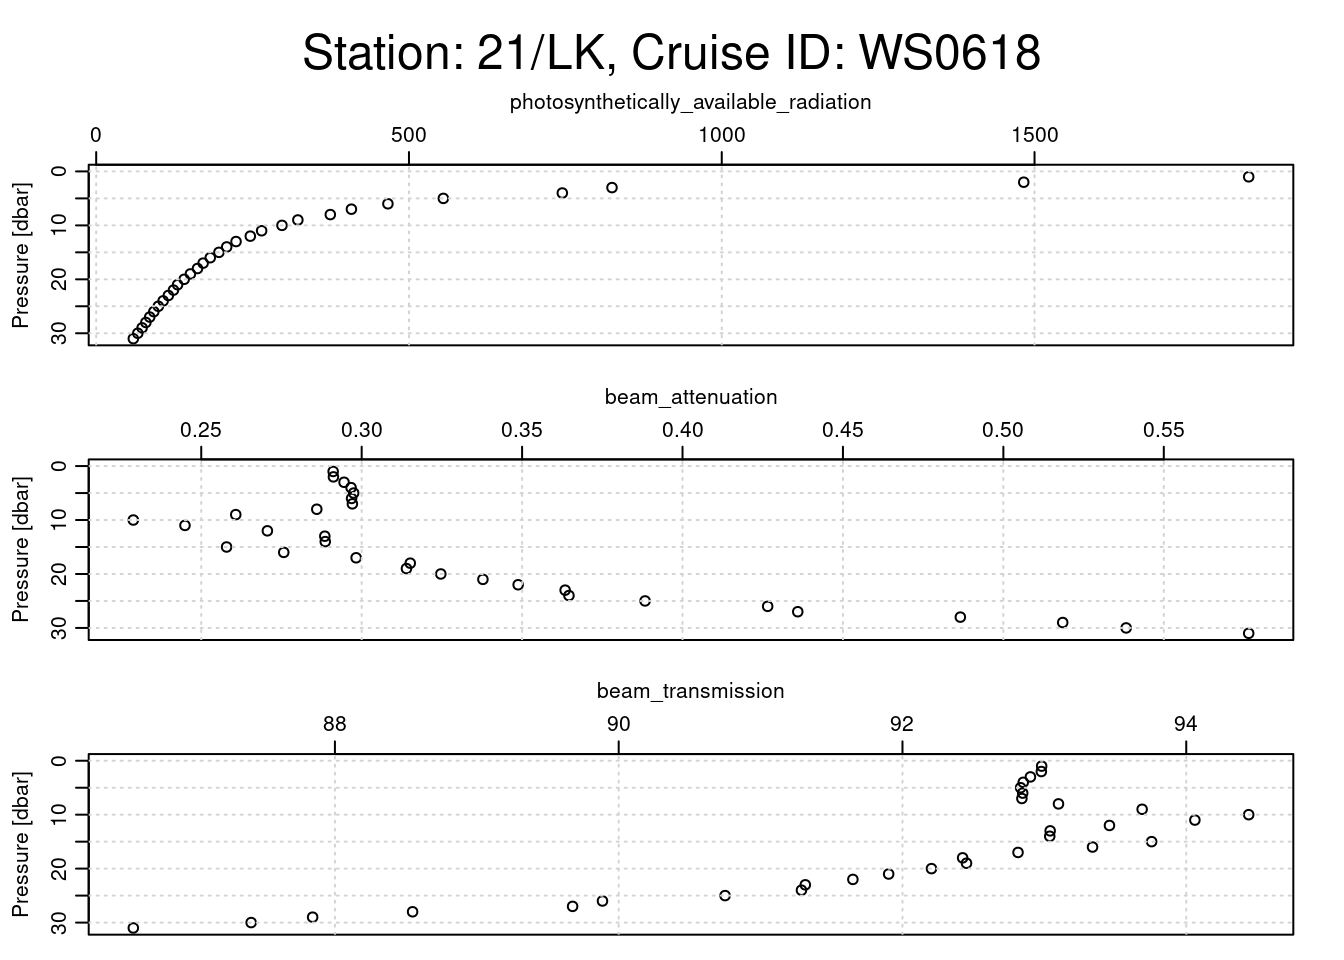
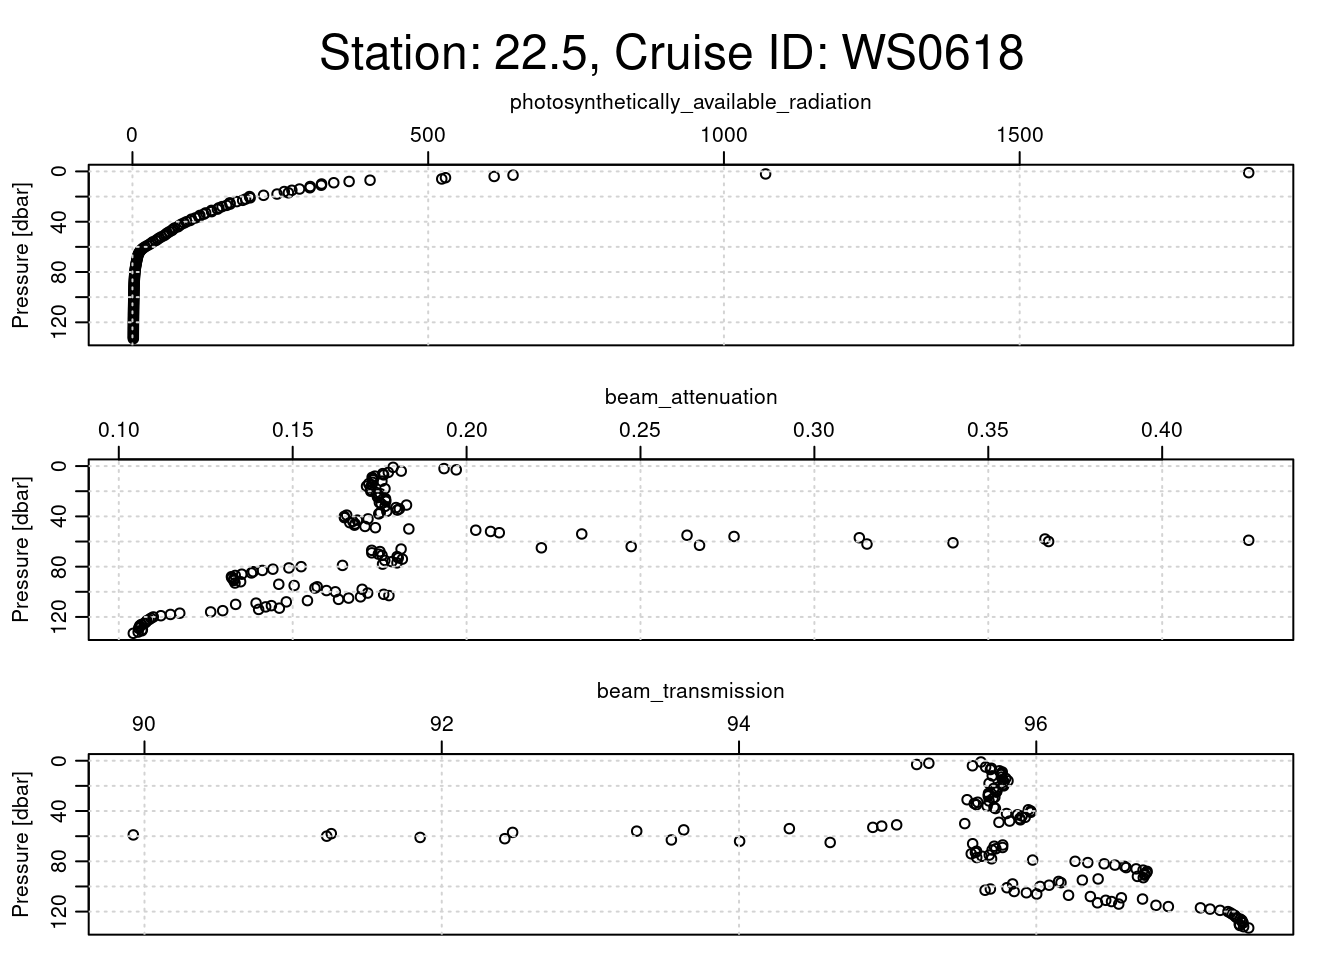
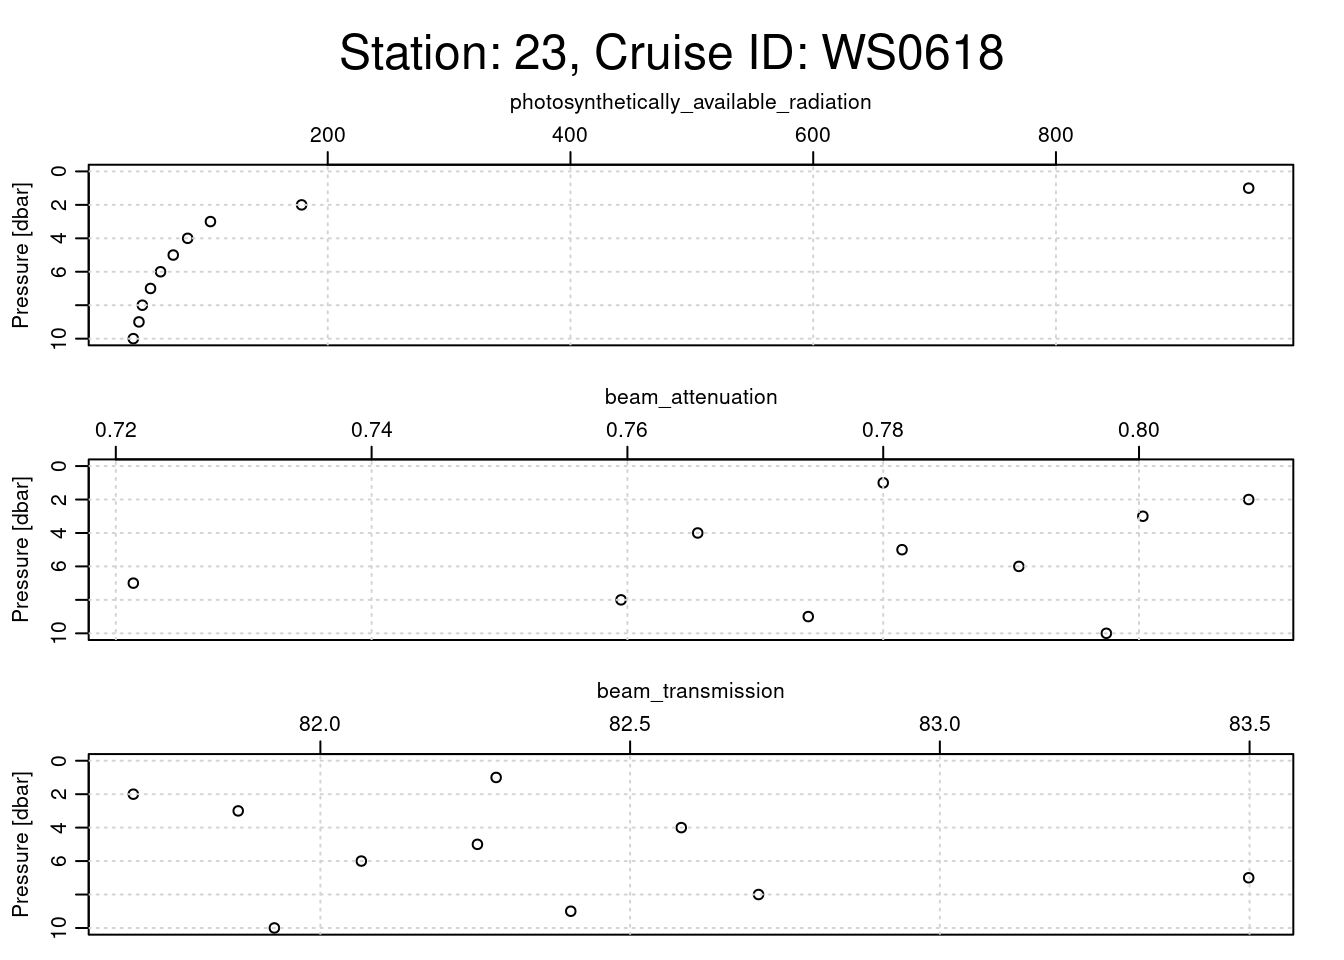
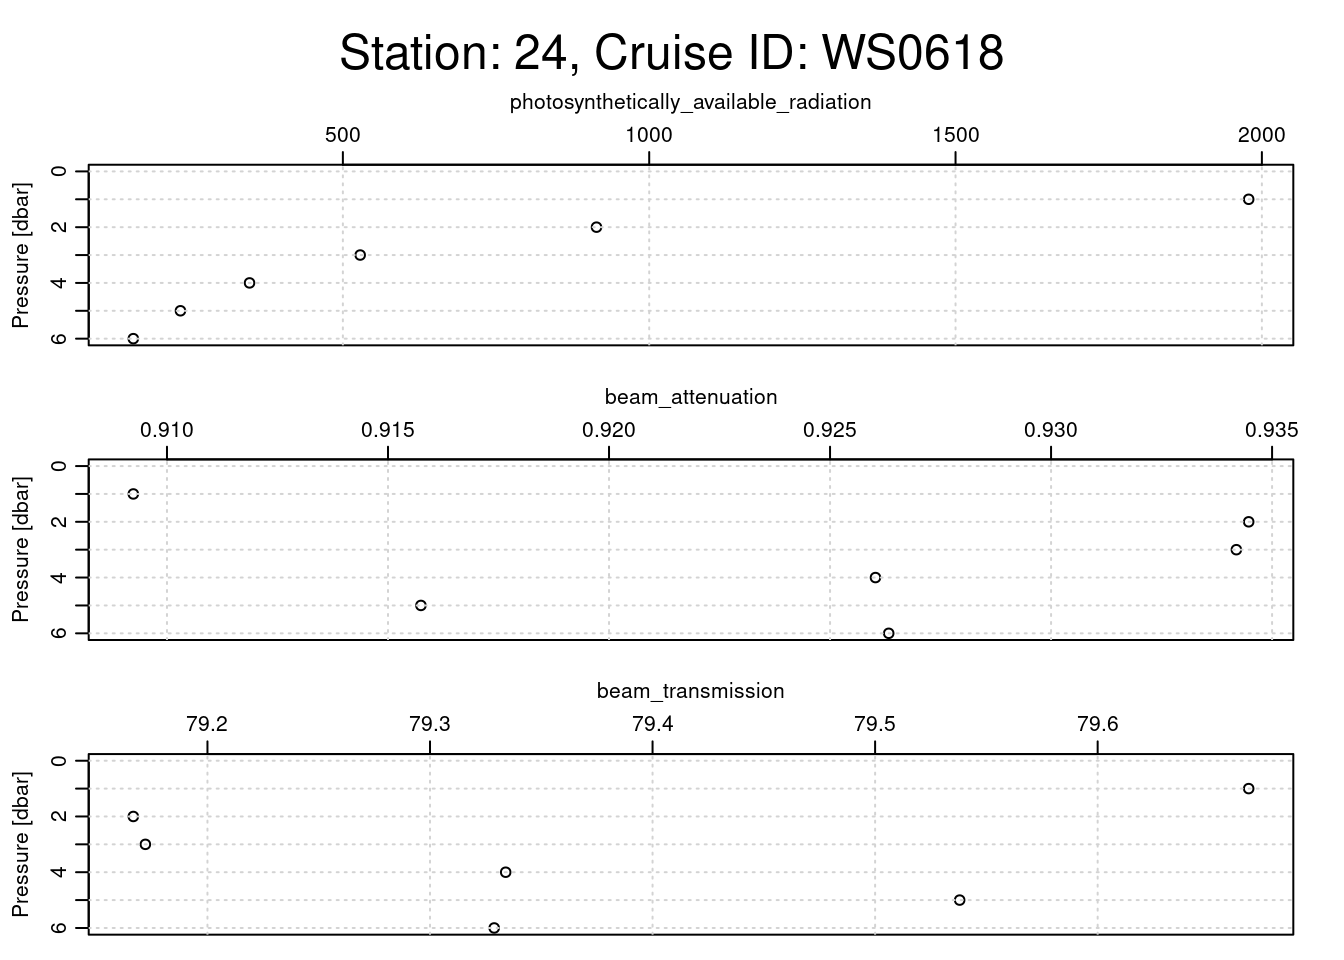
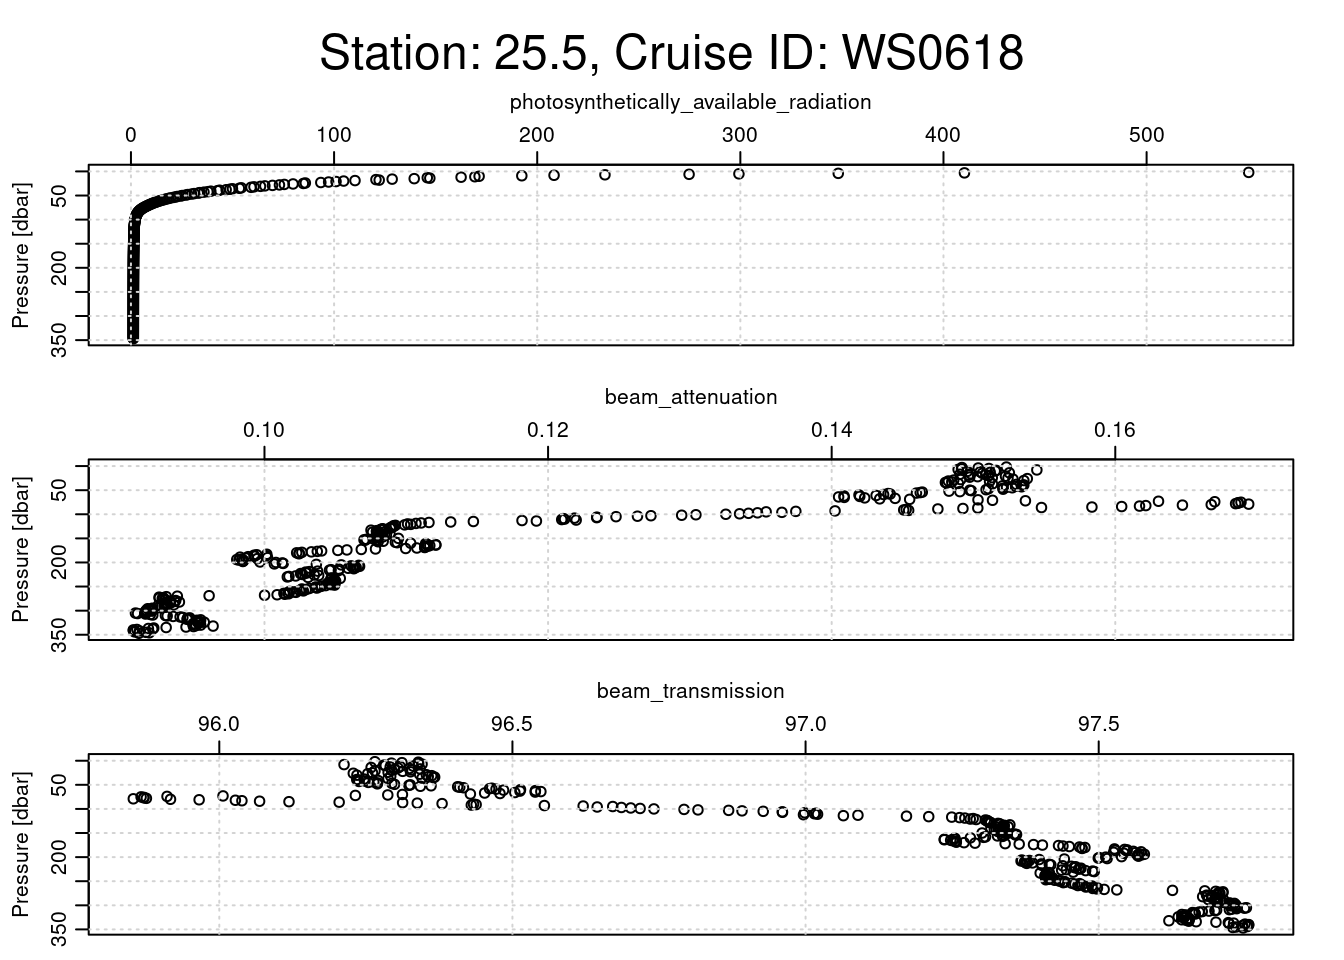
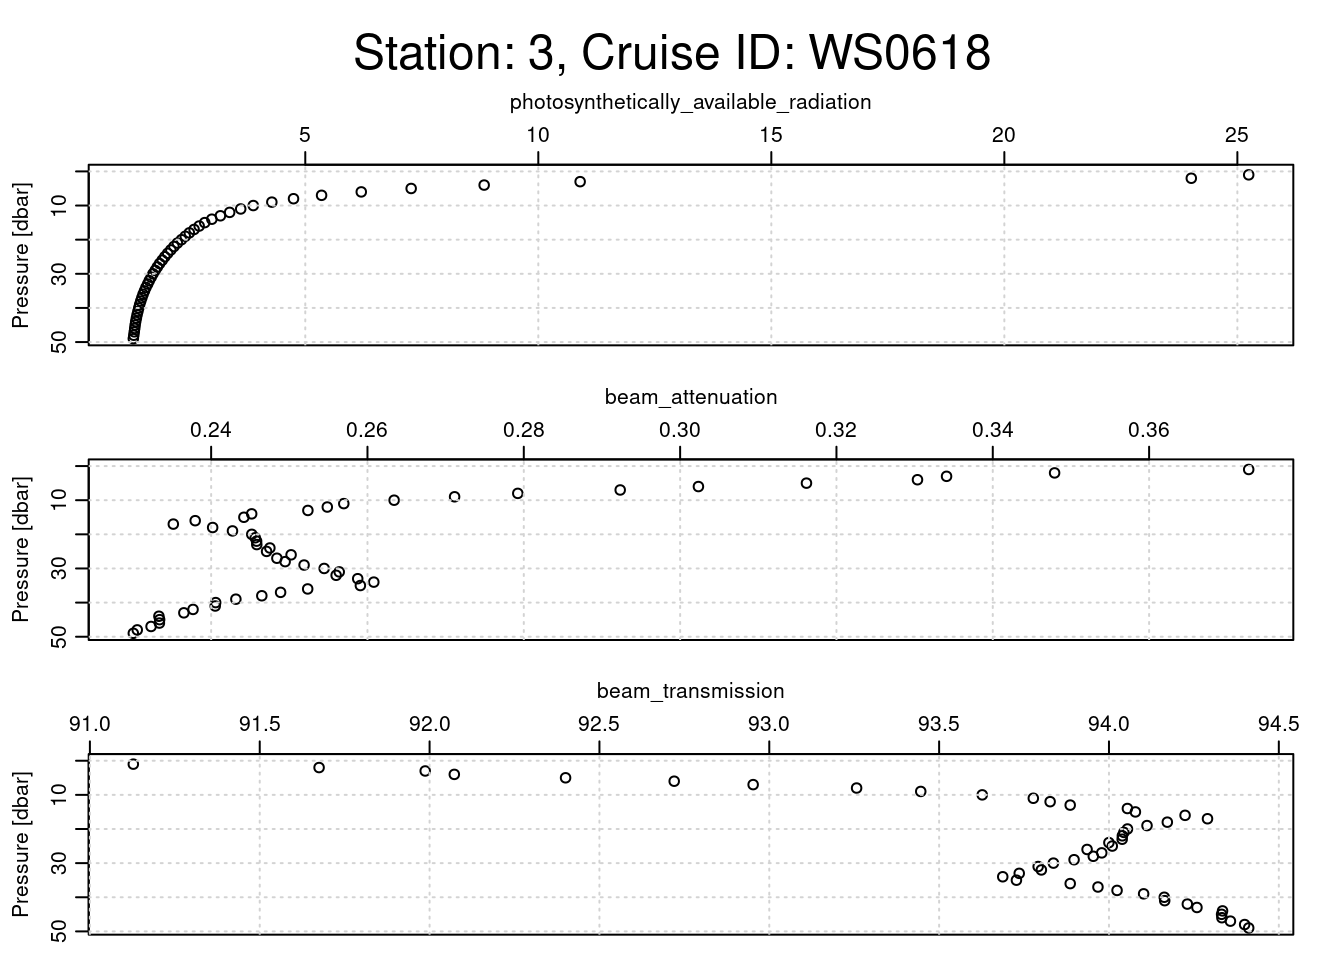
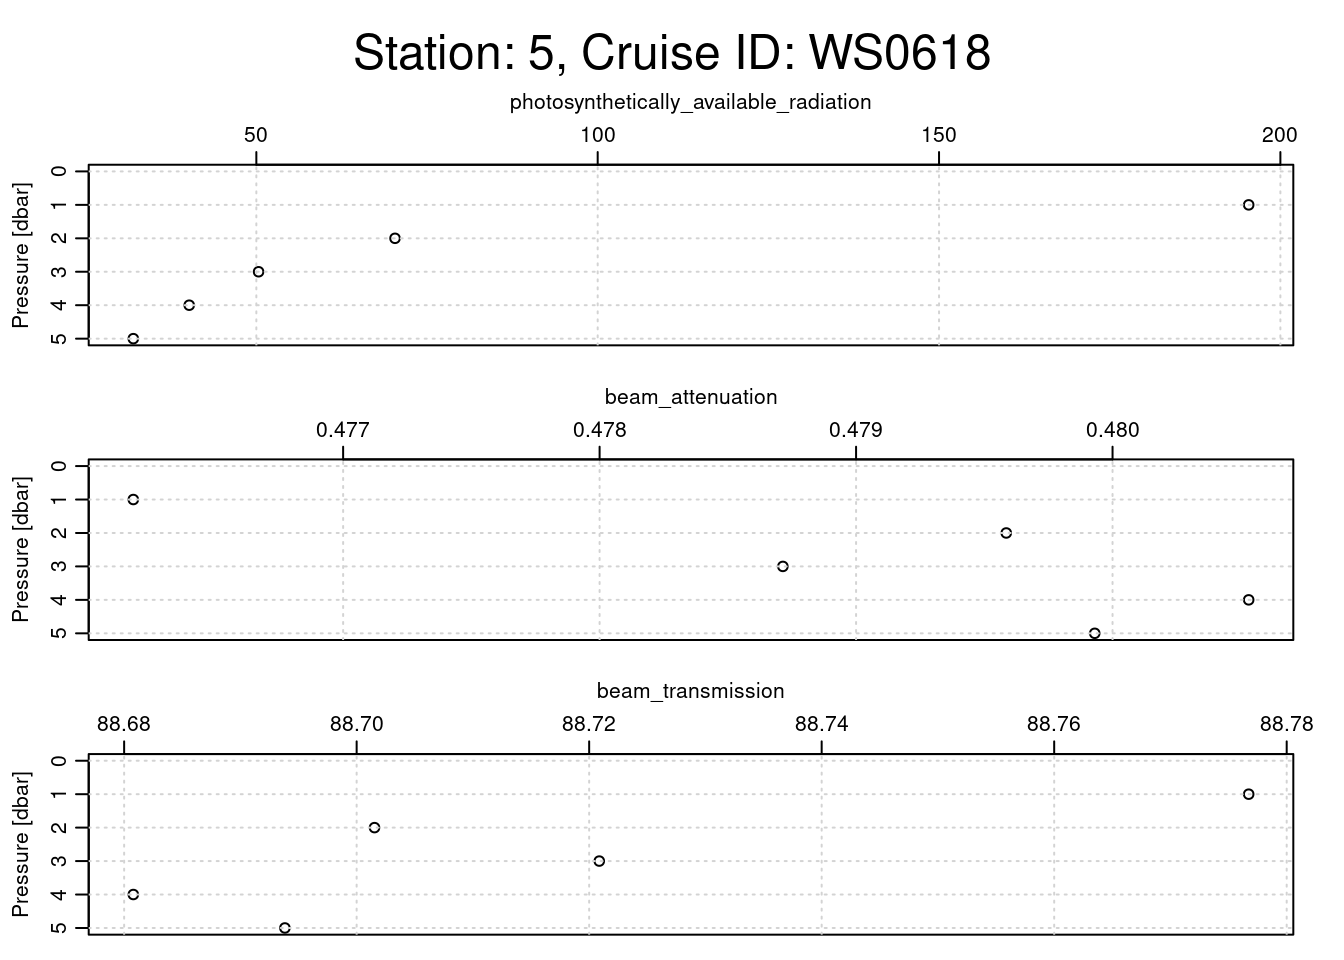
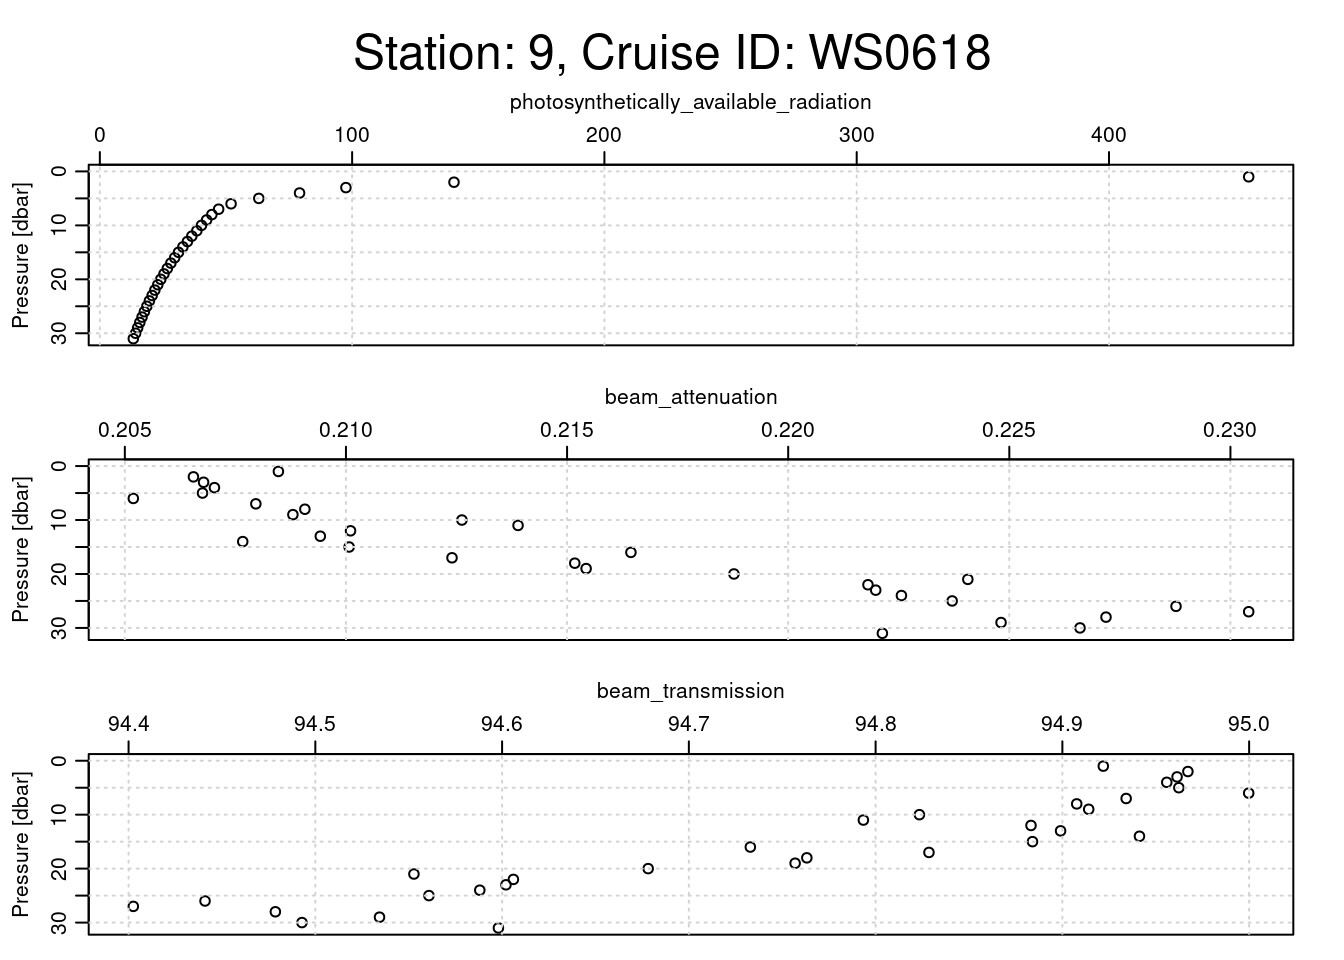
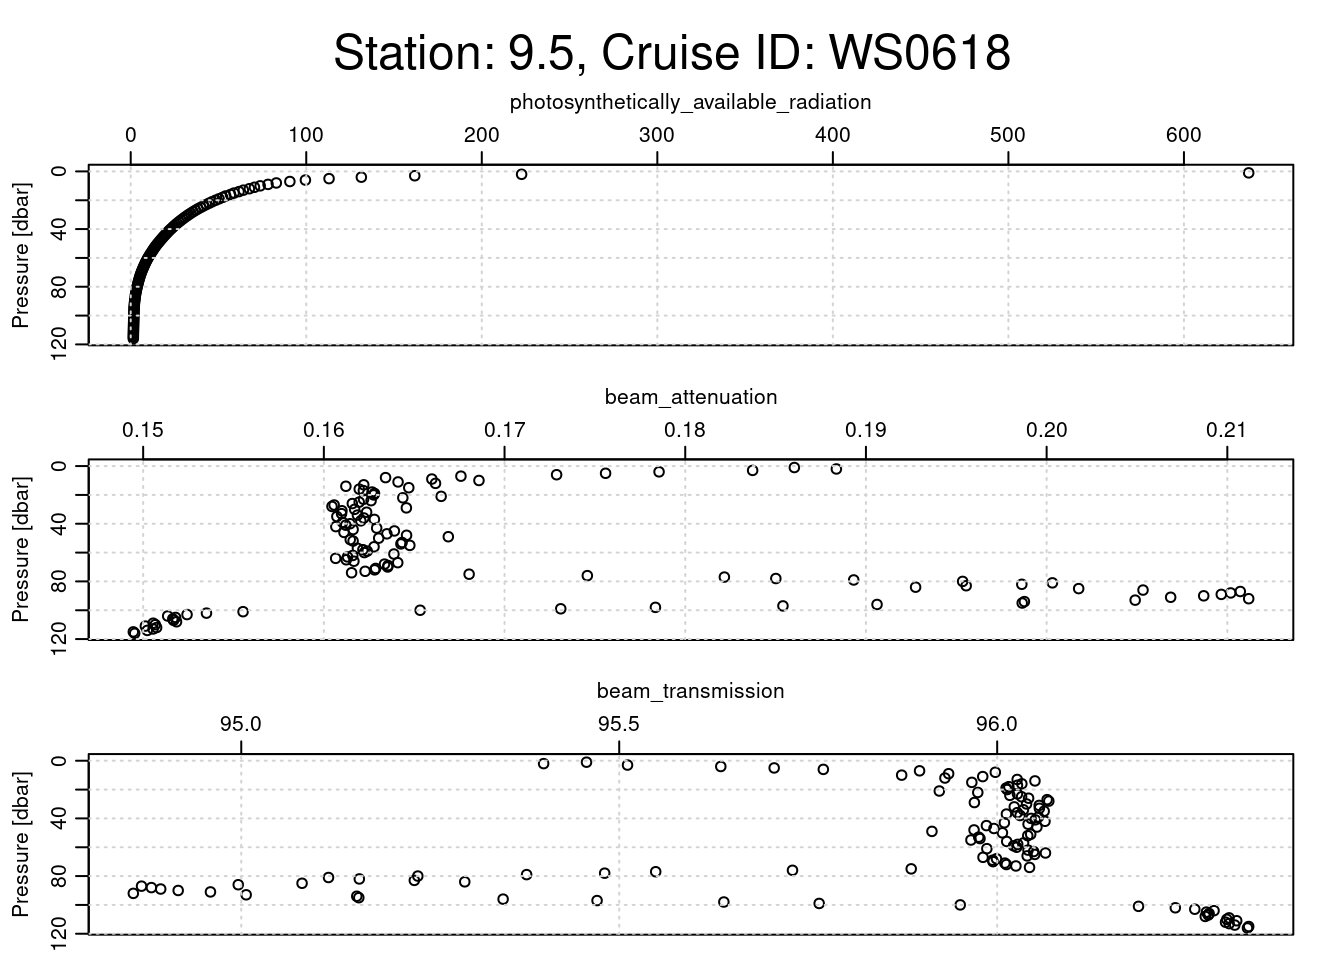
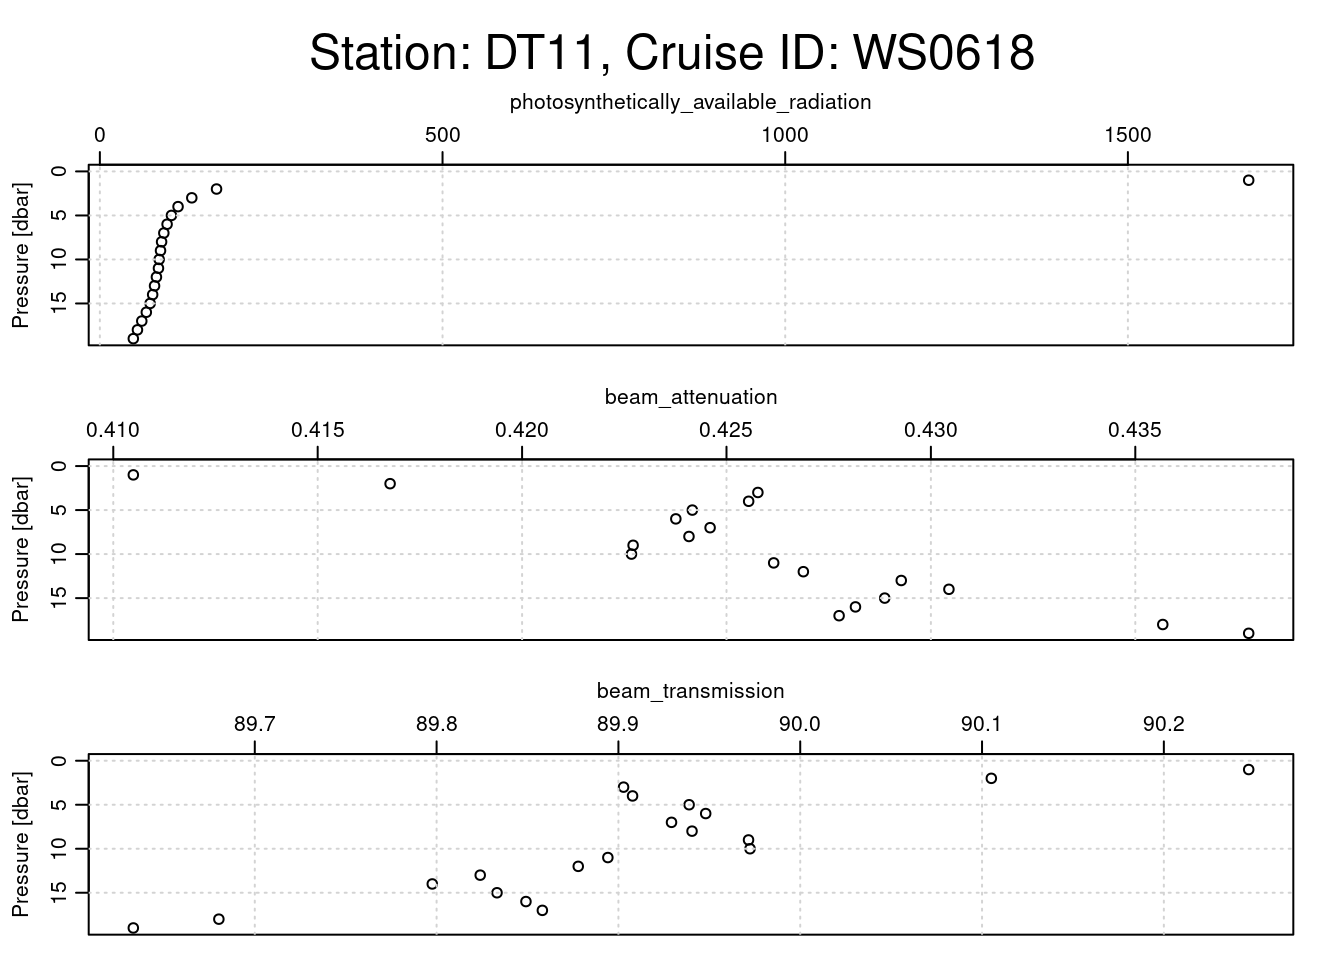
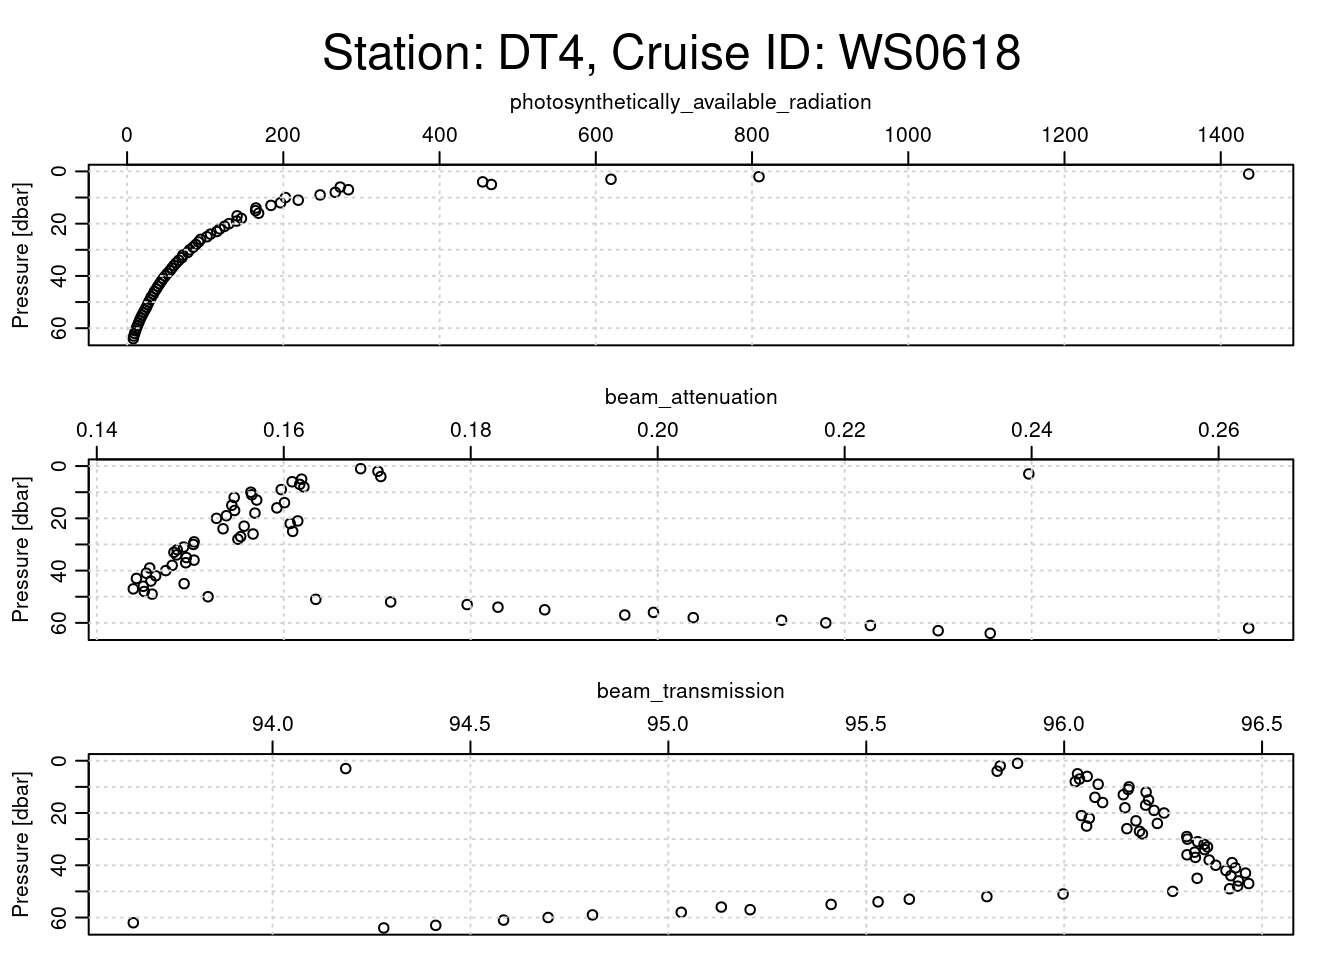
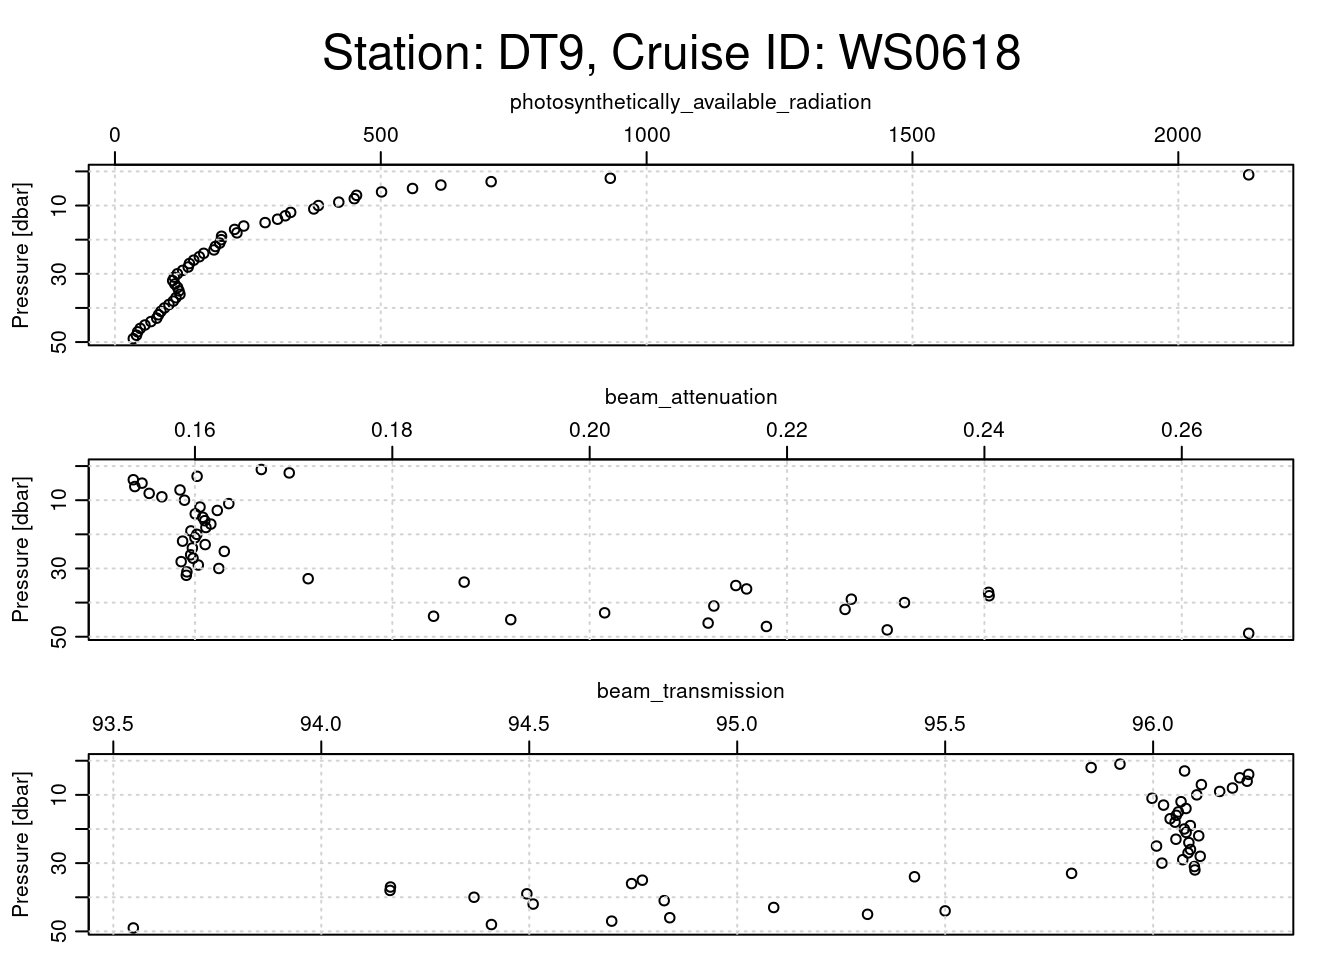
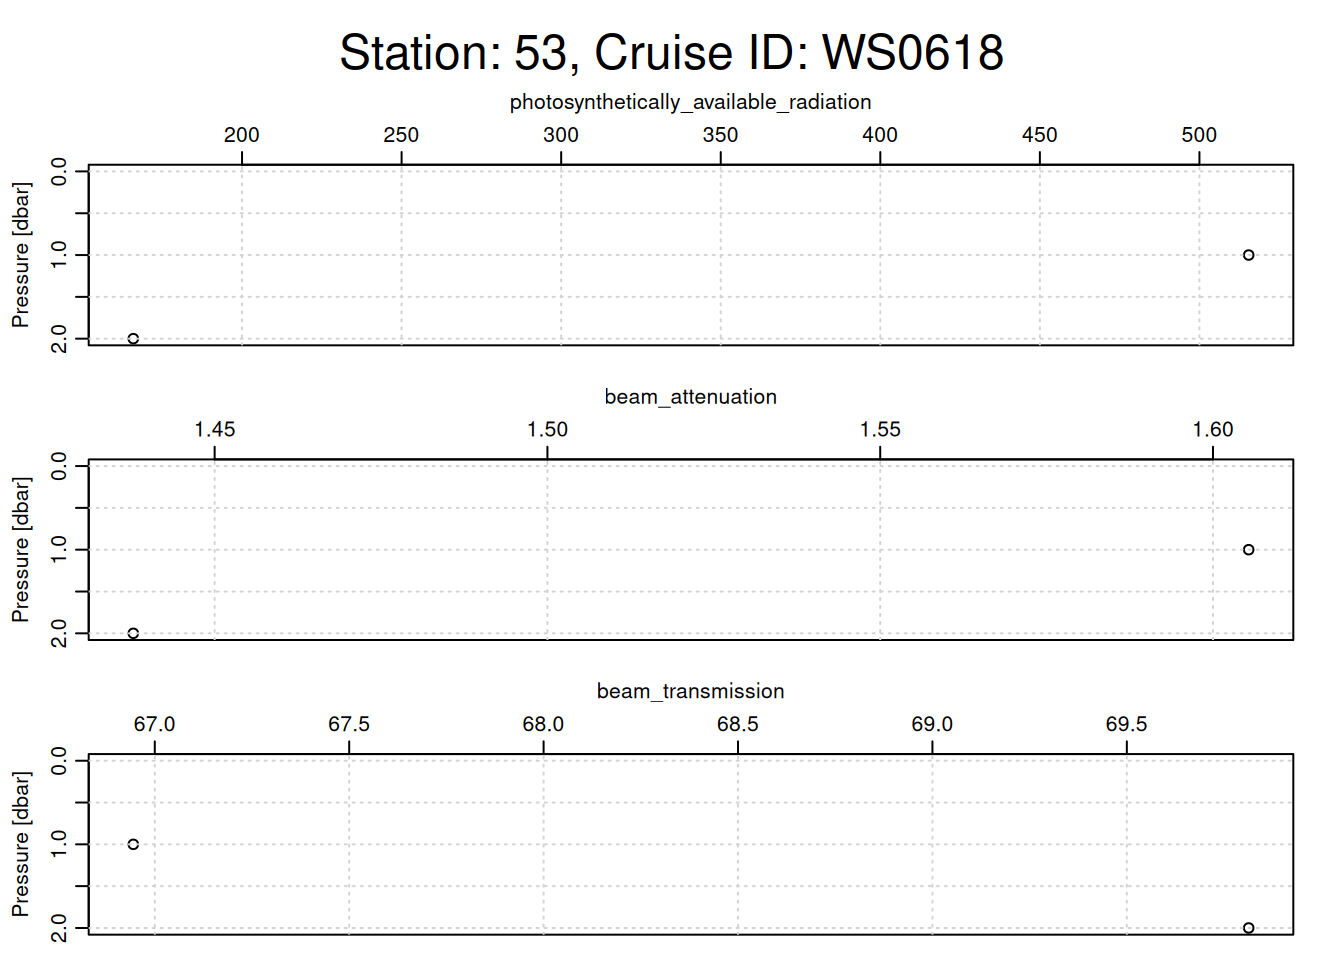
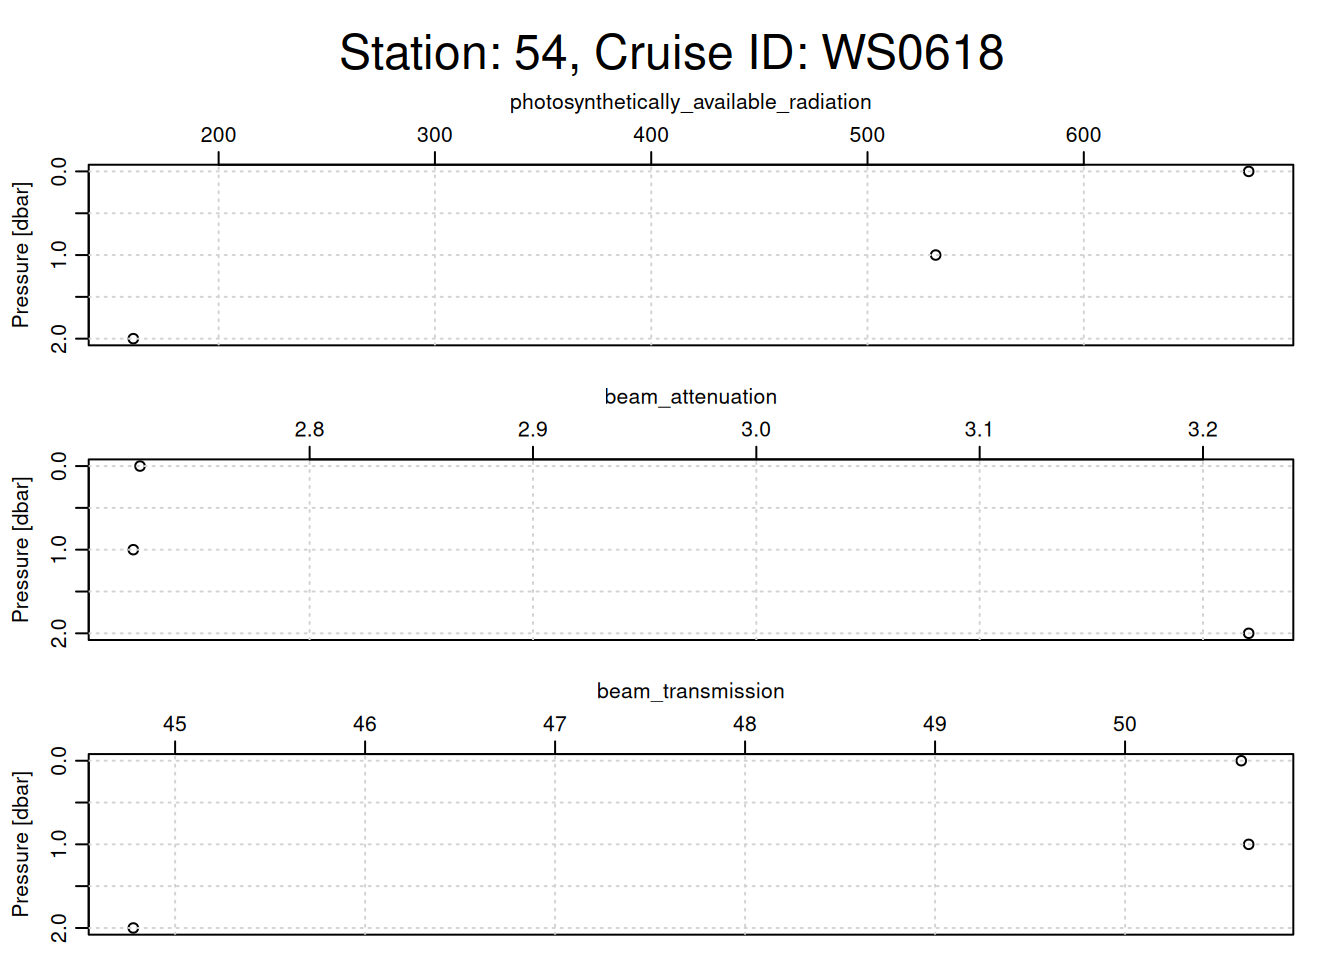
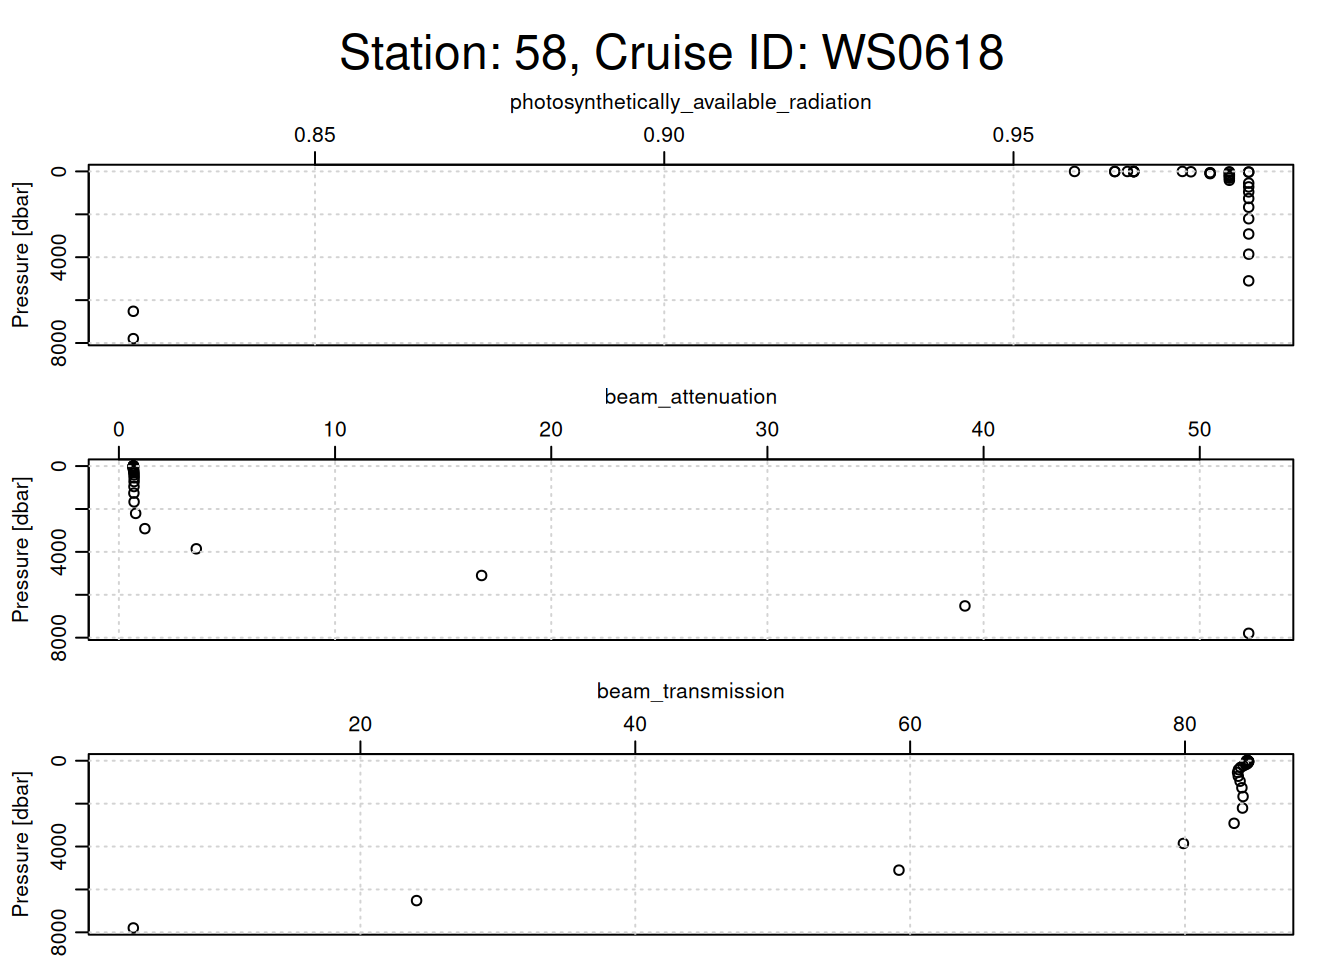
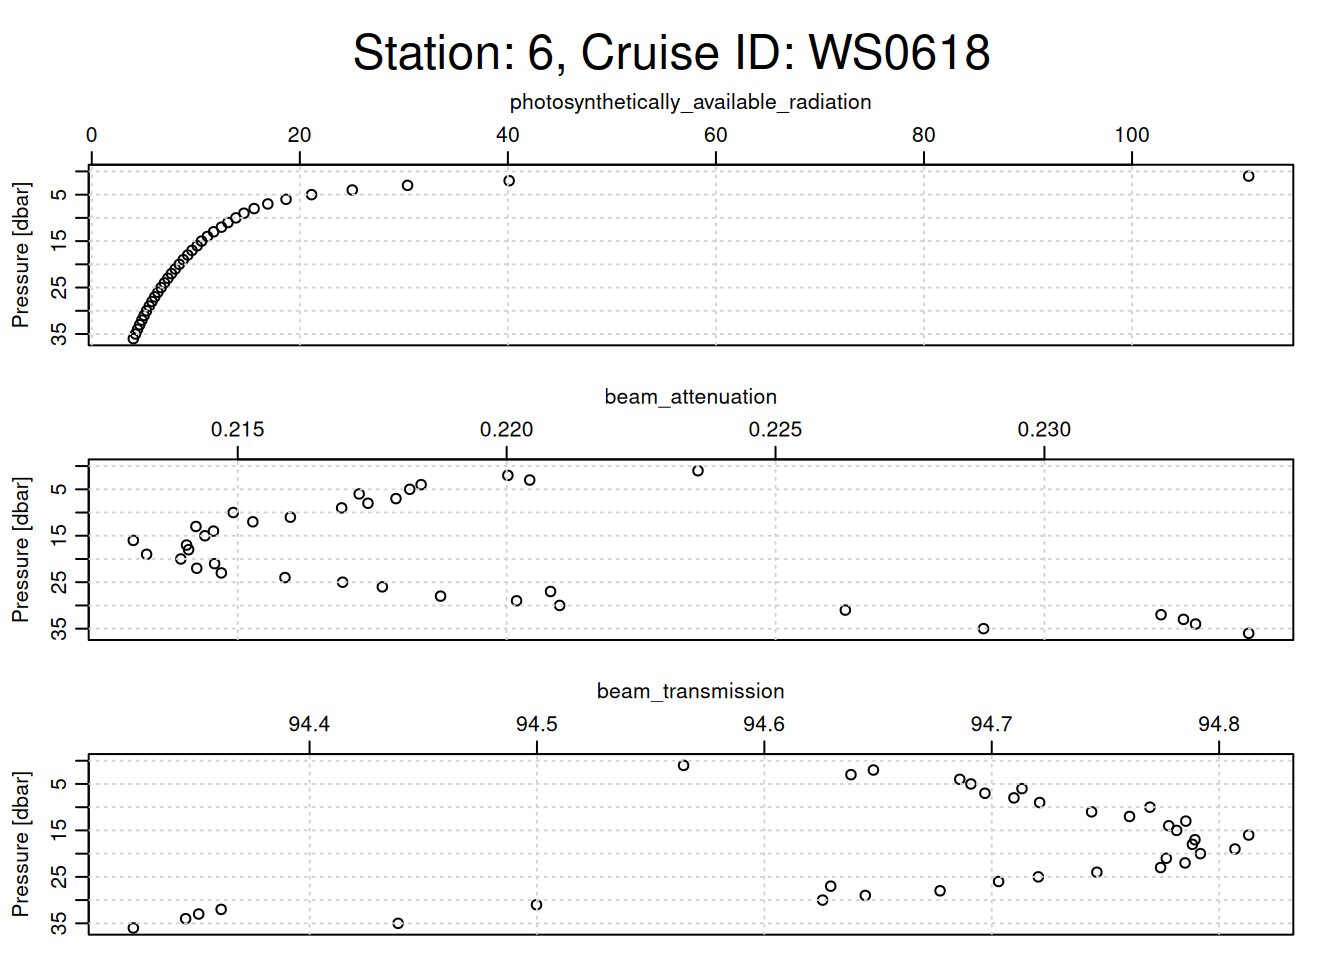
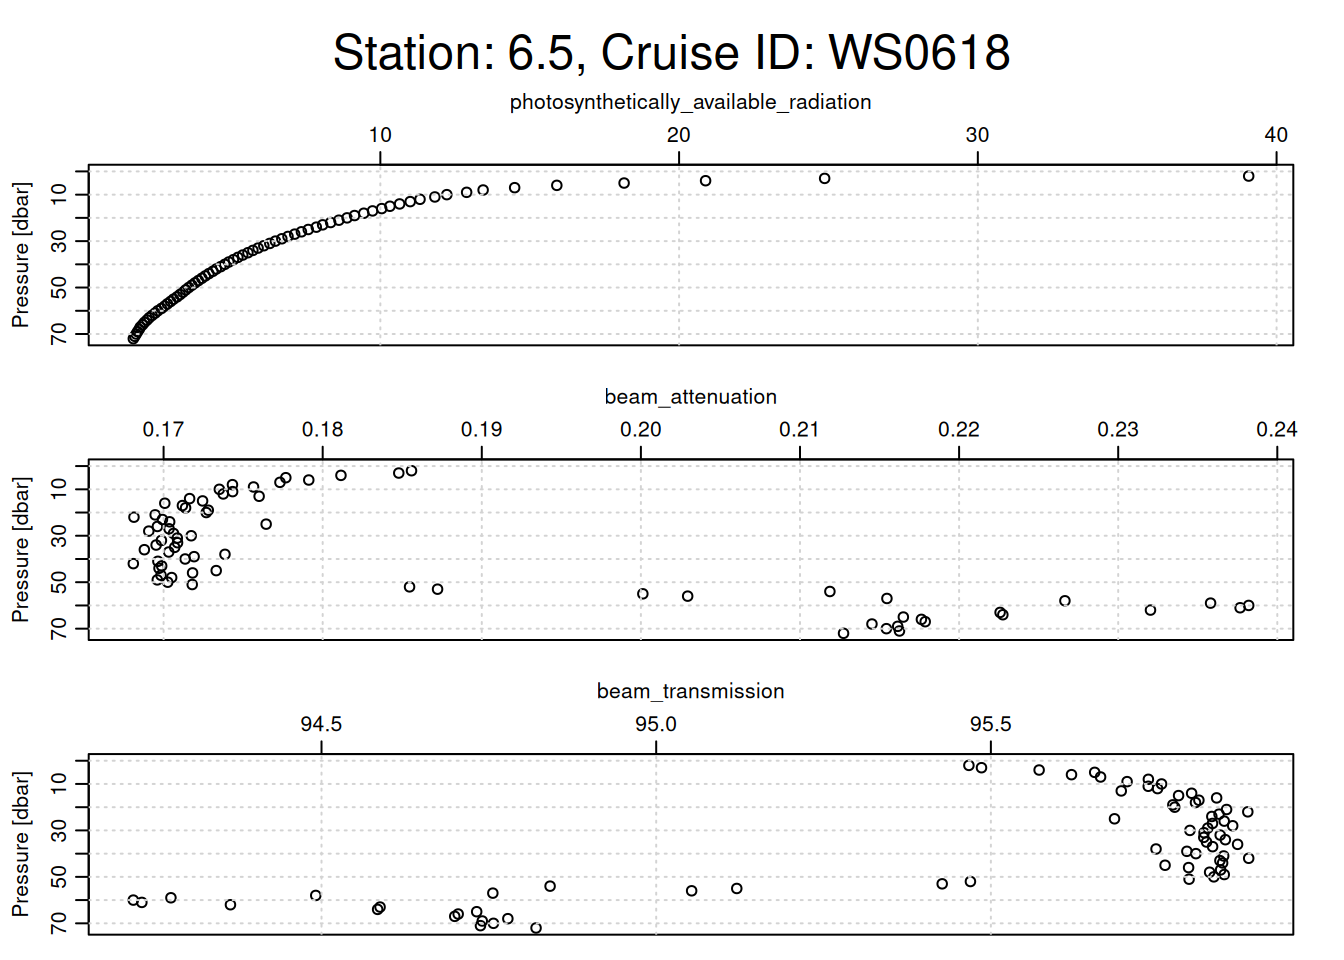
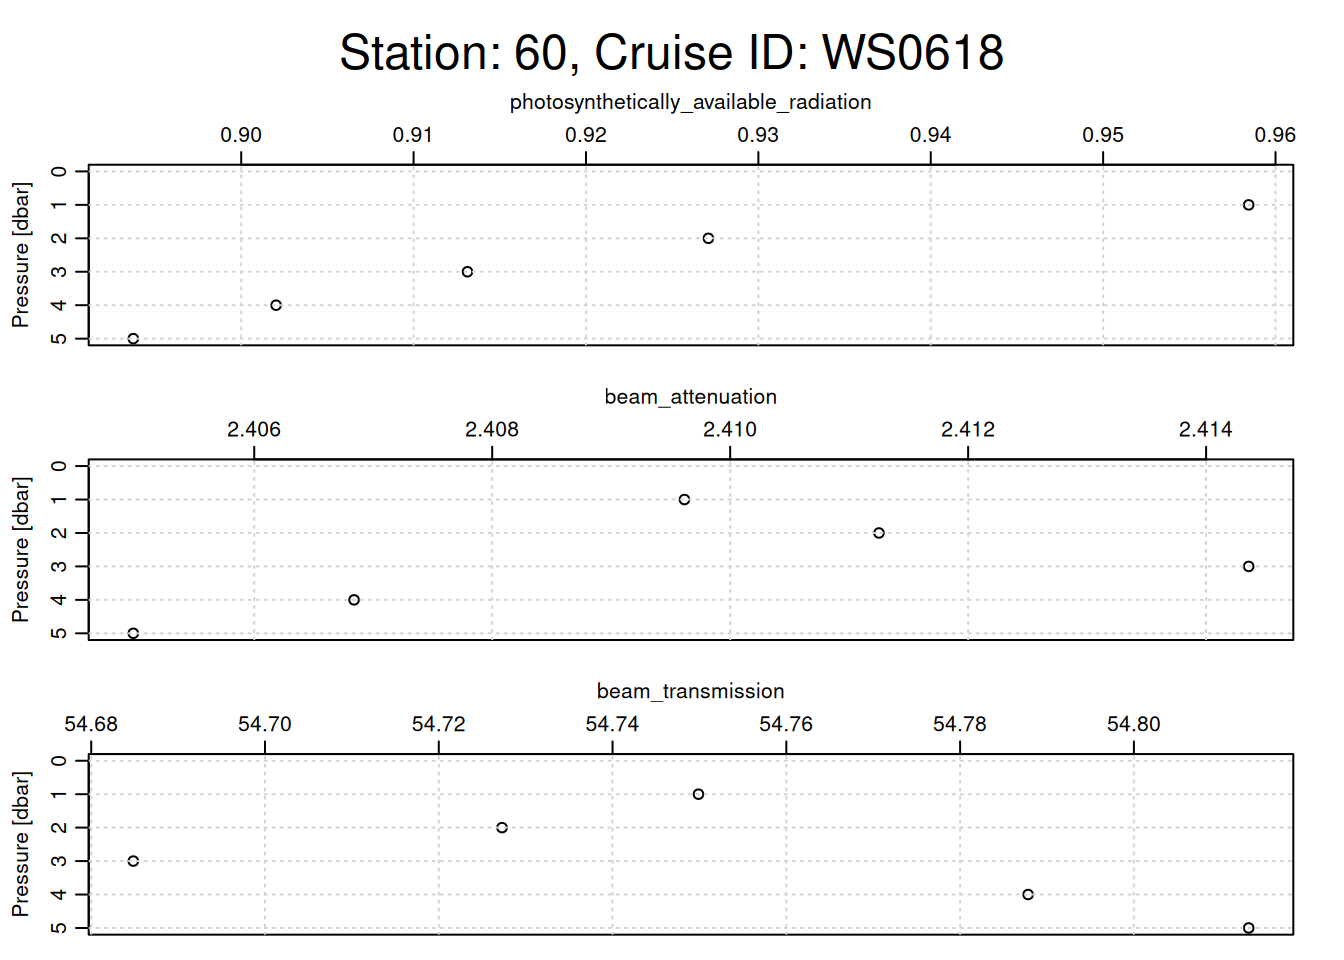
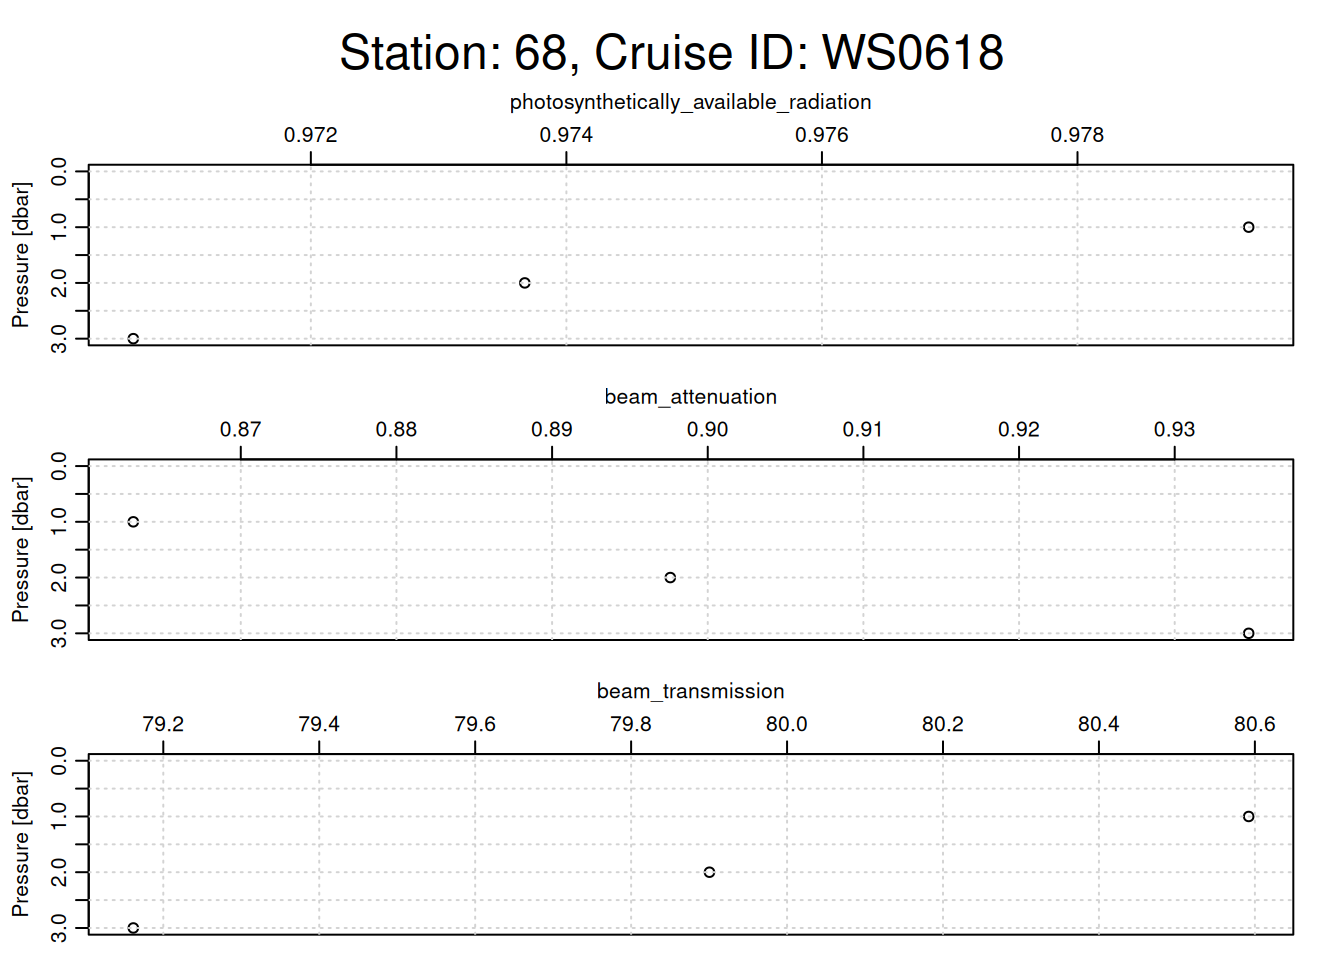
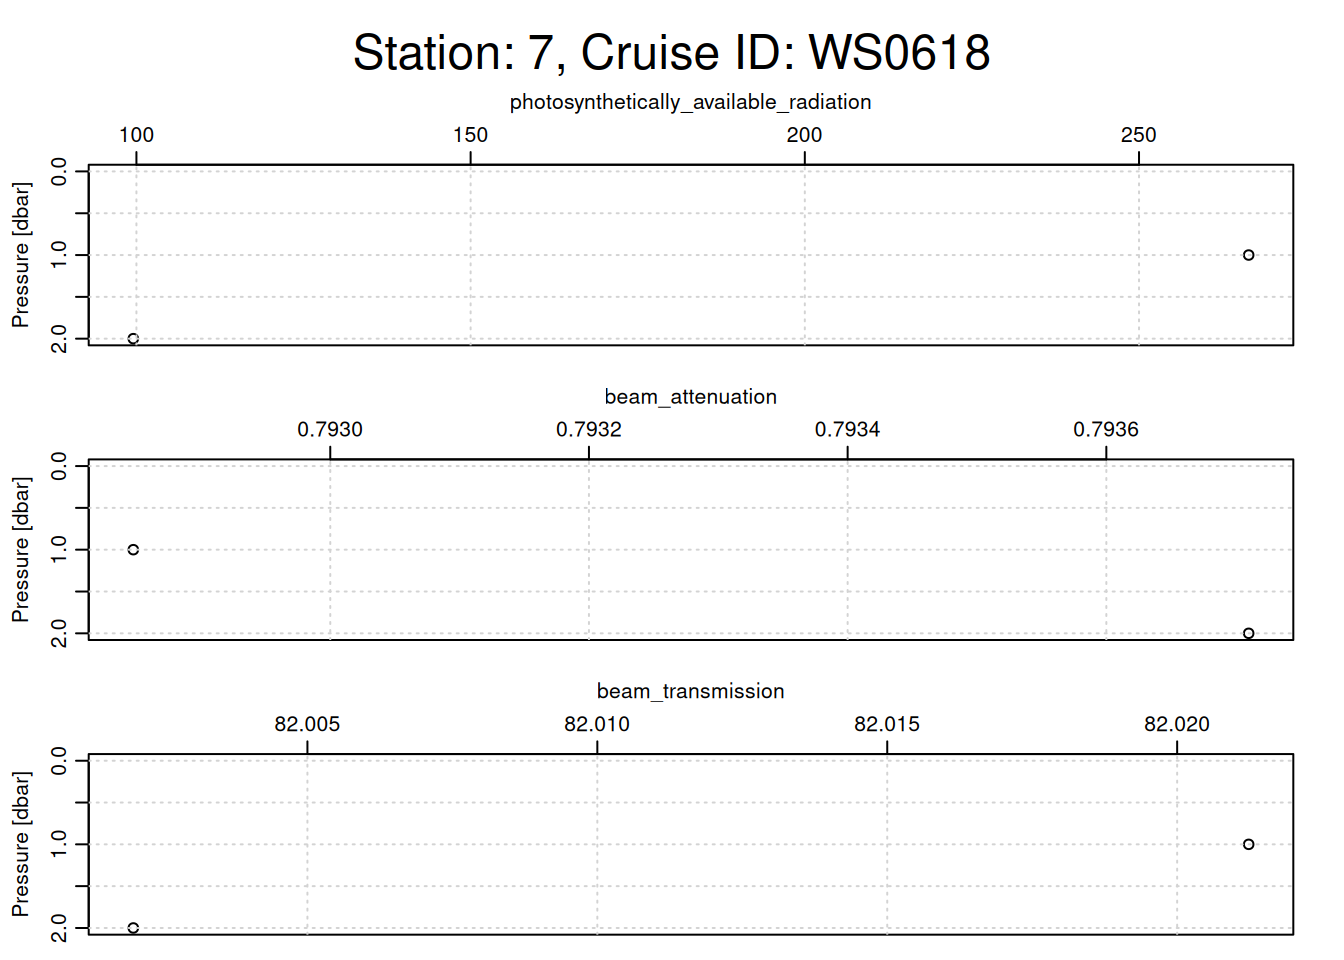
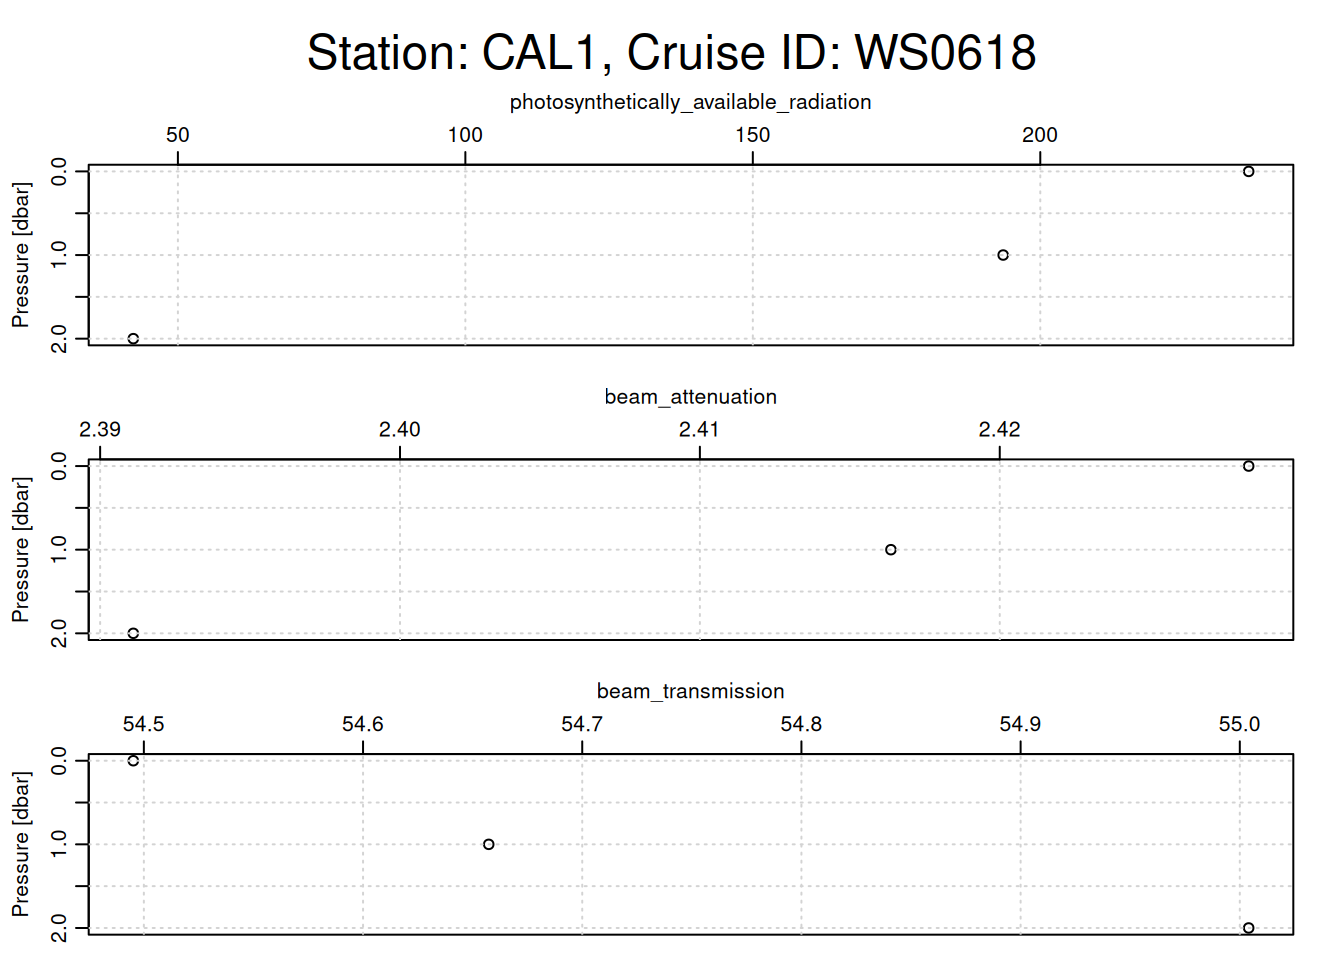
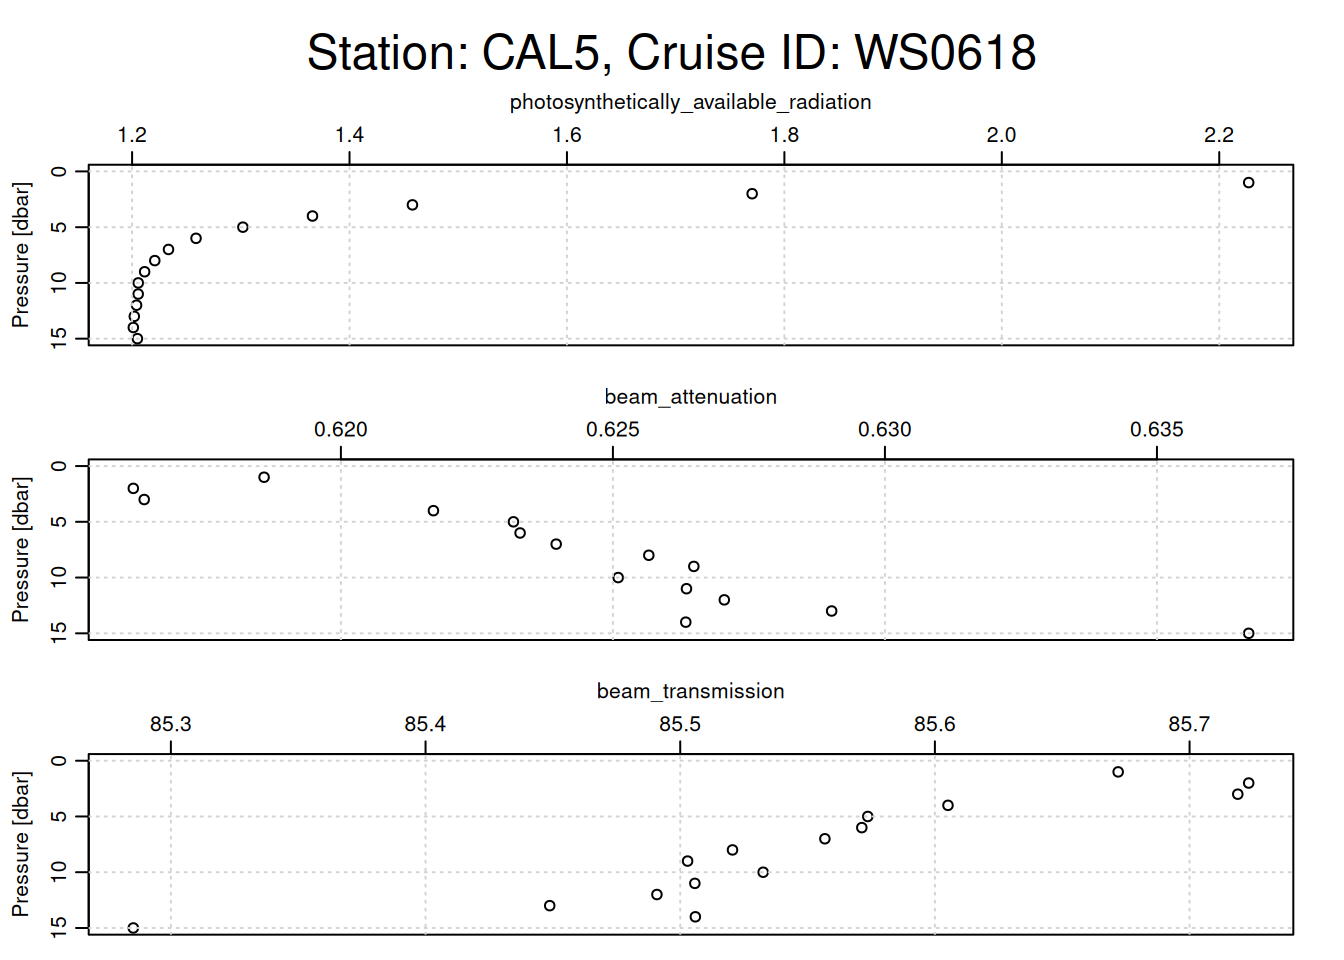
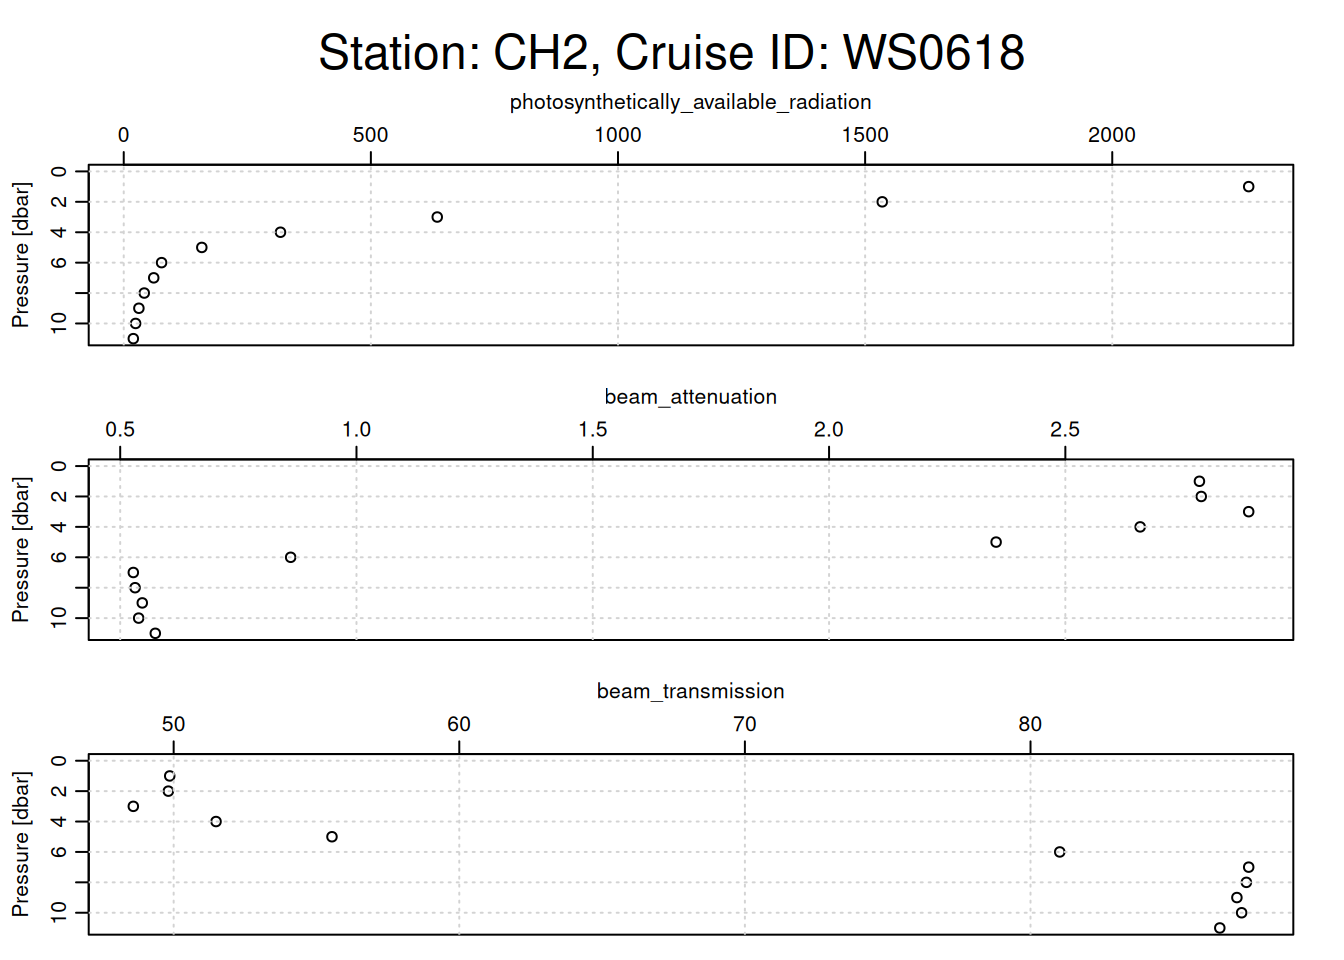
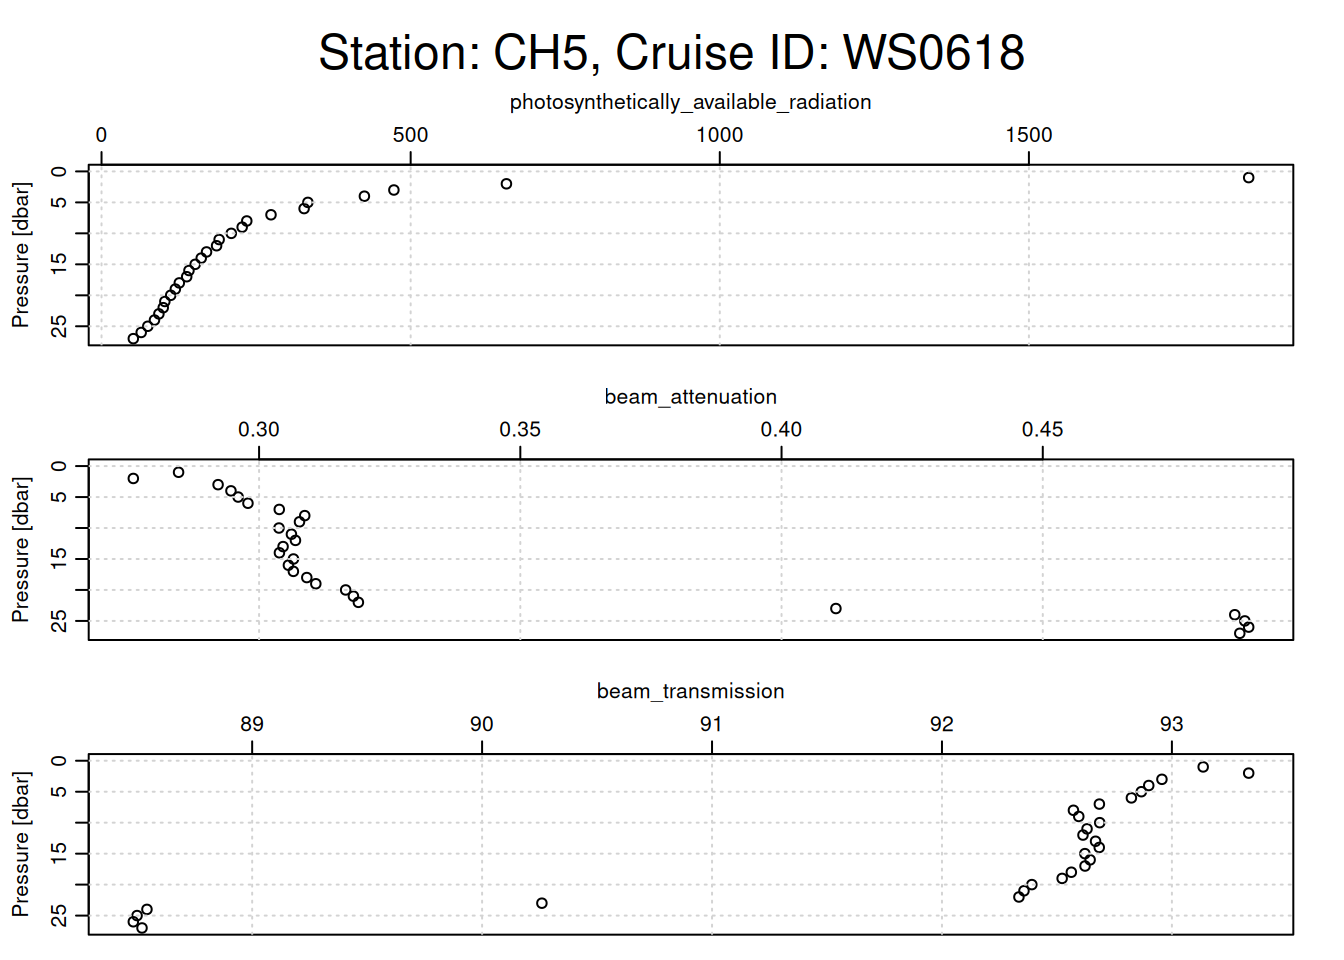
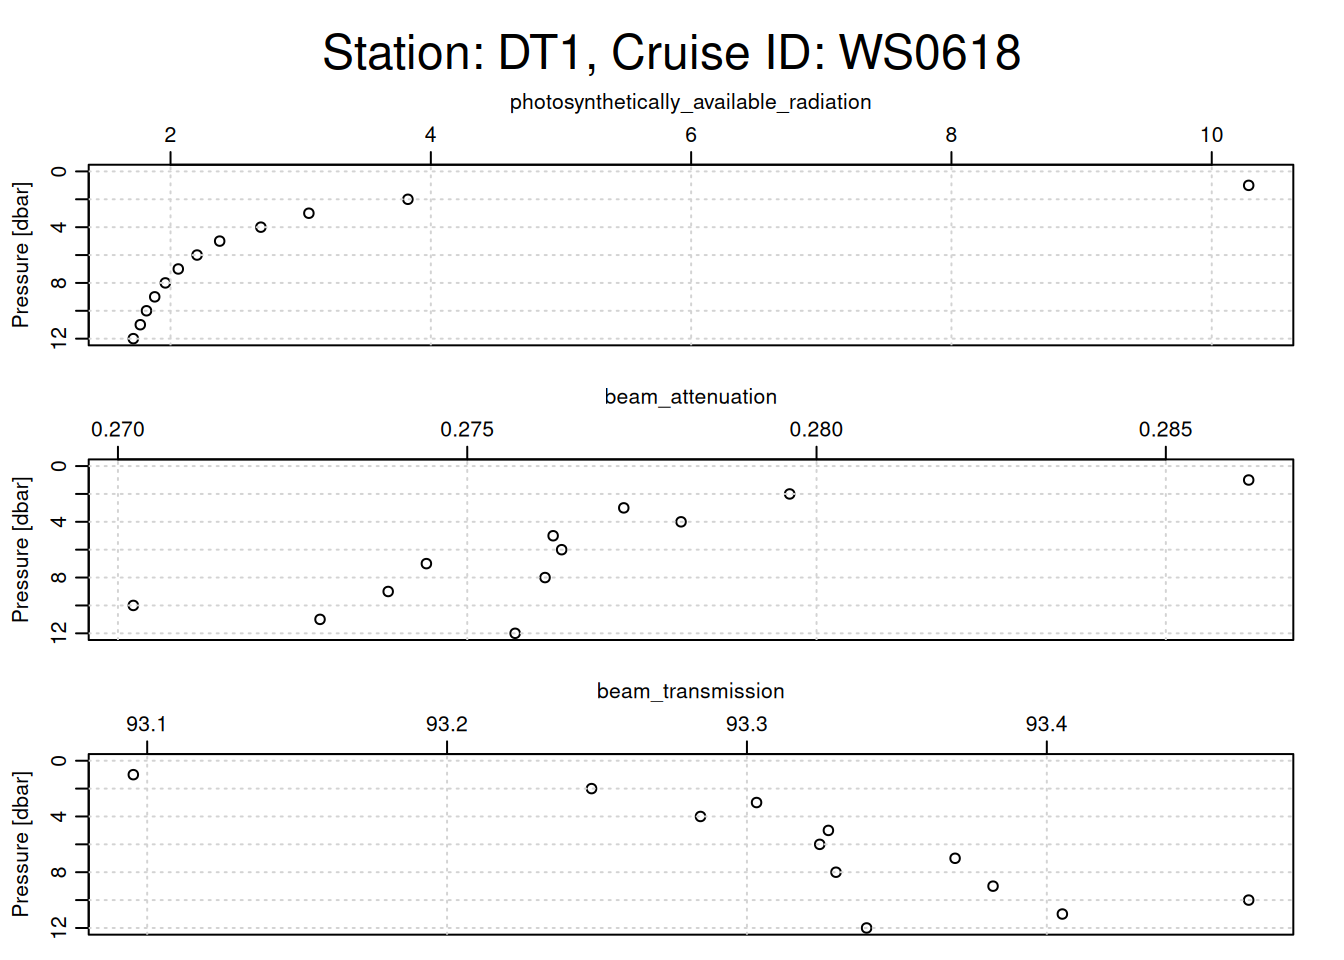
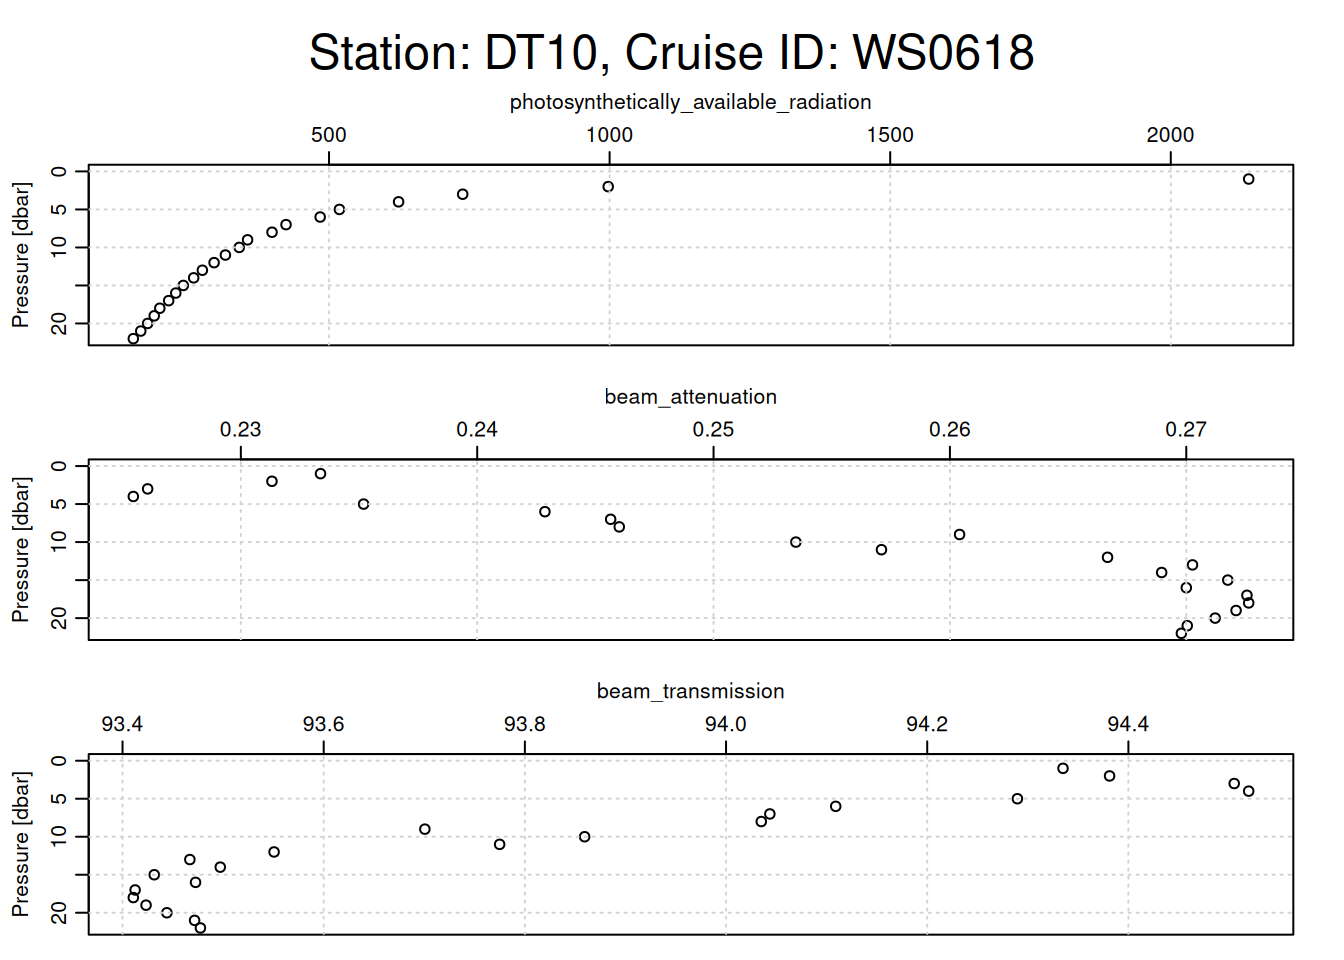
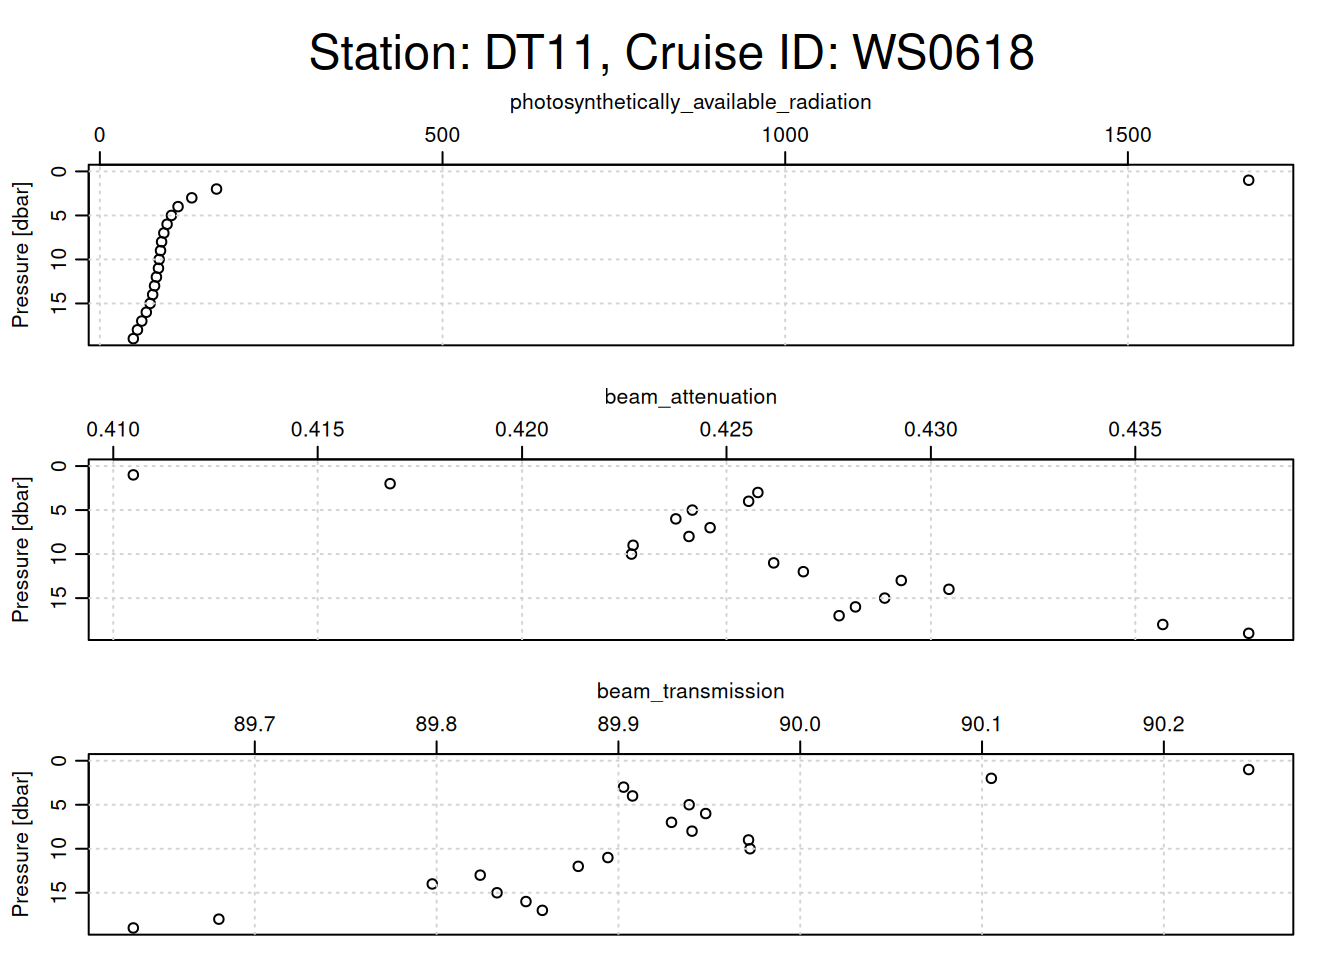
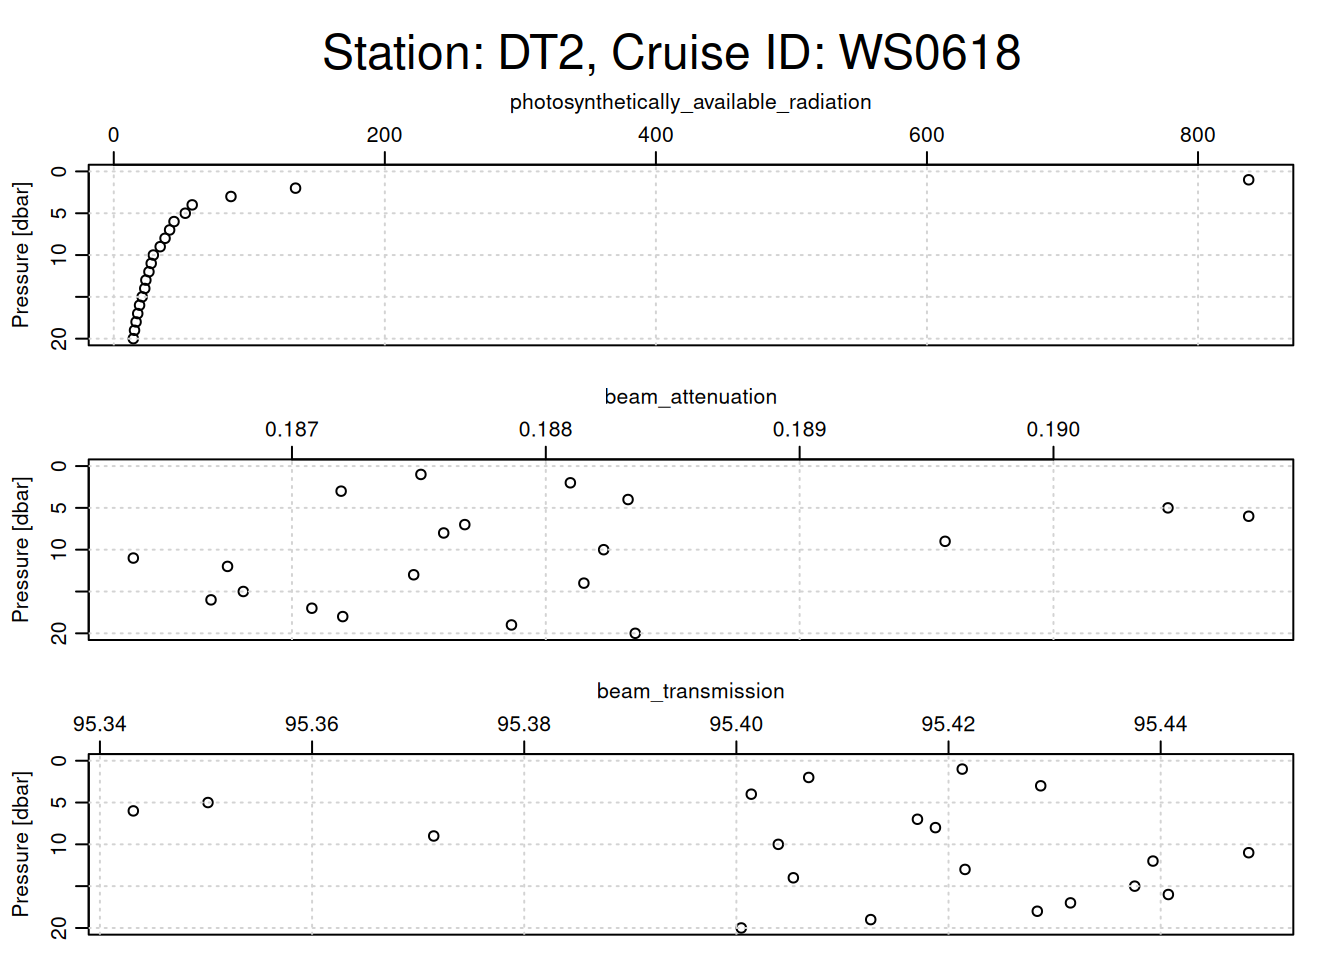
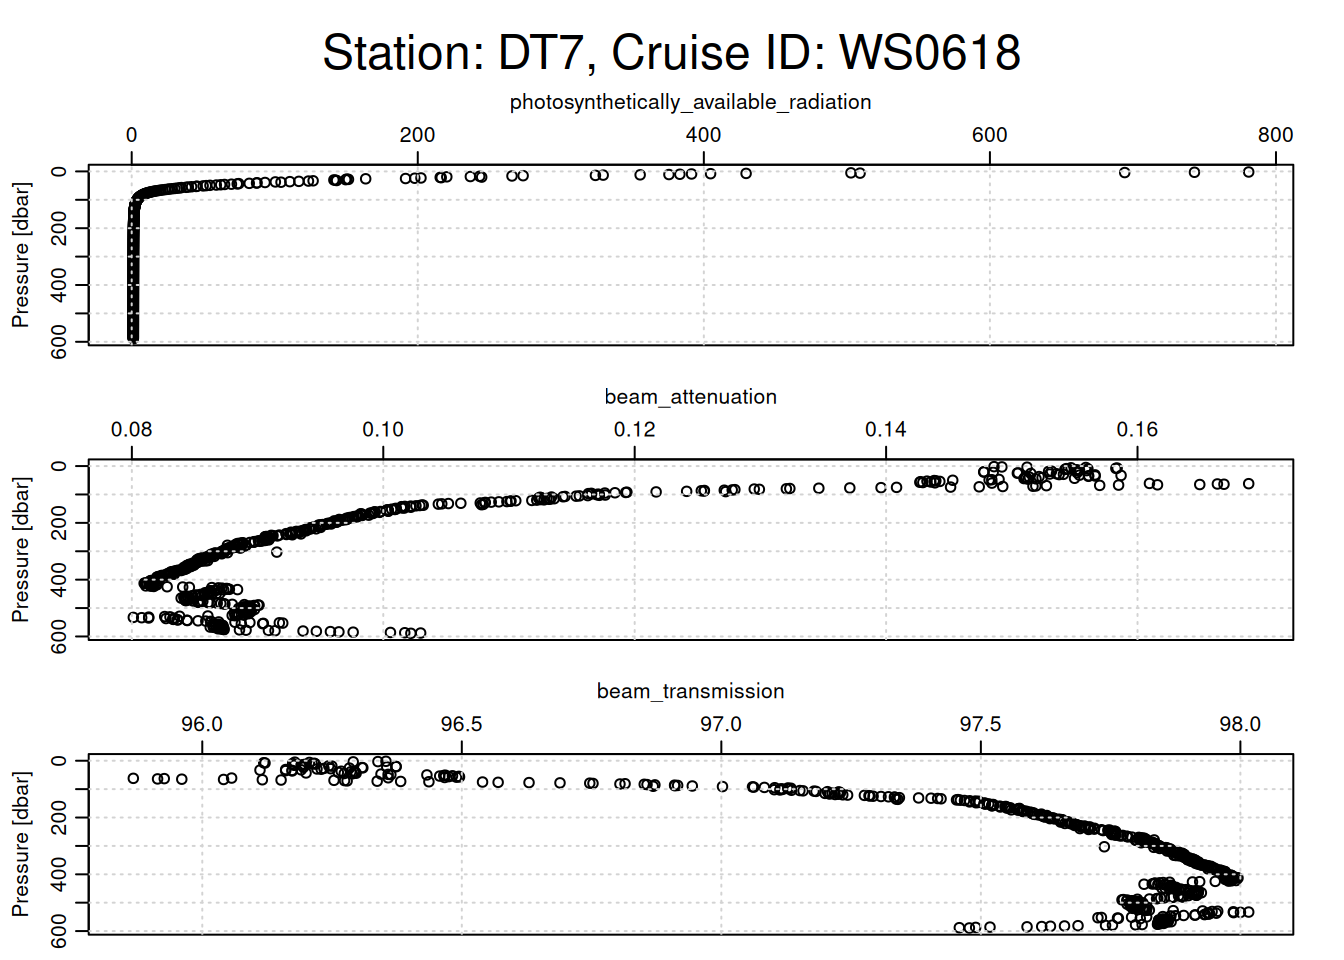
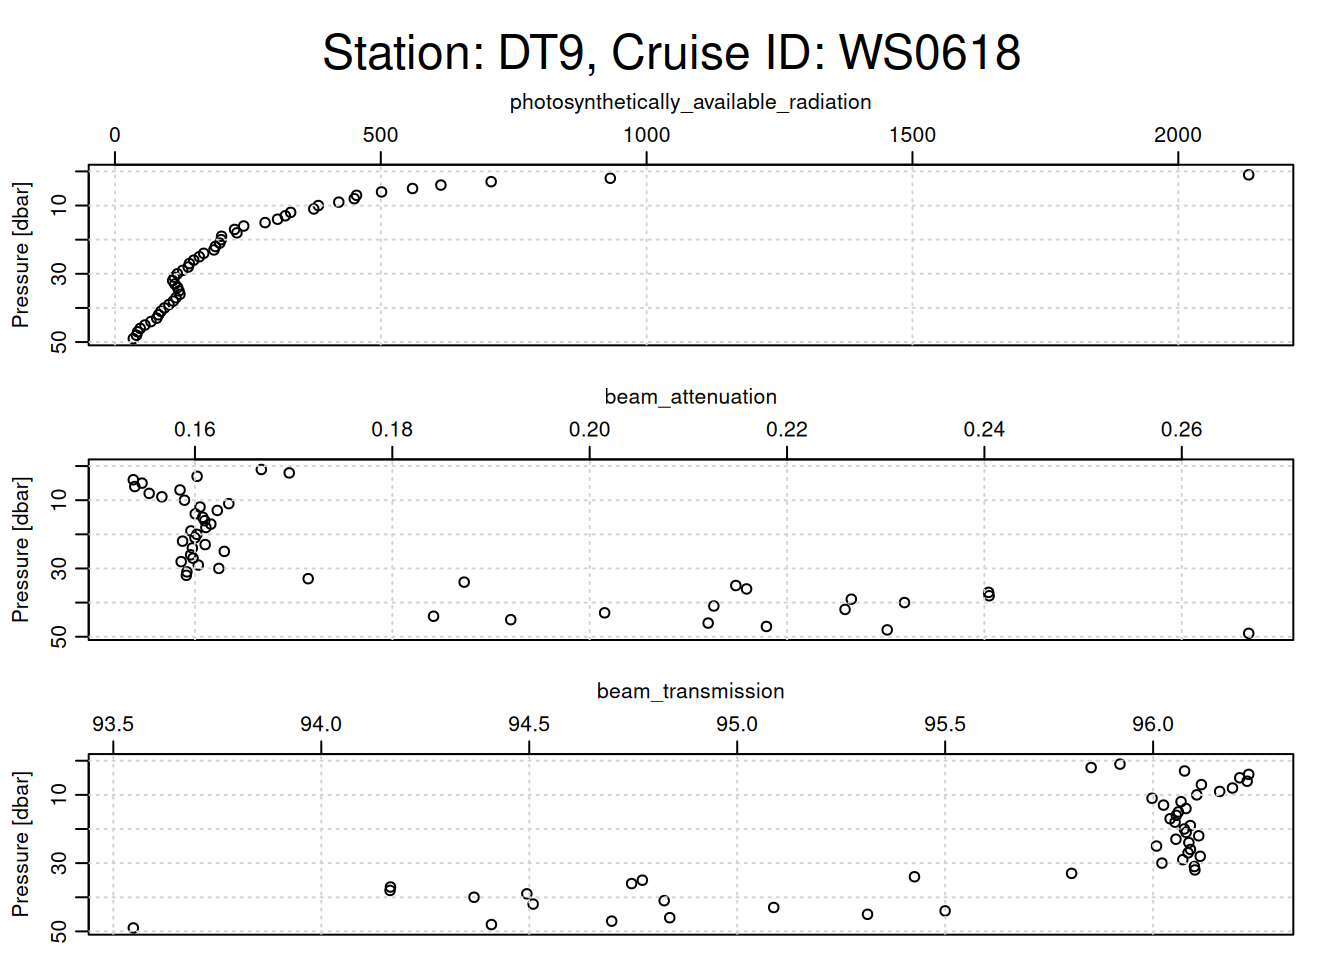
plotting other optical parameters for each cast
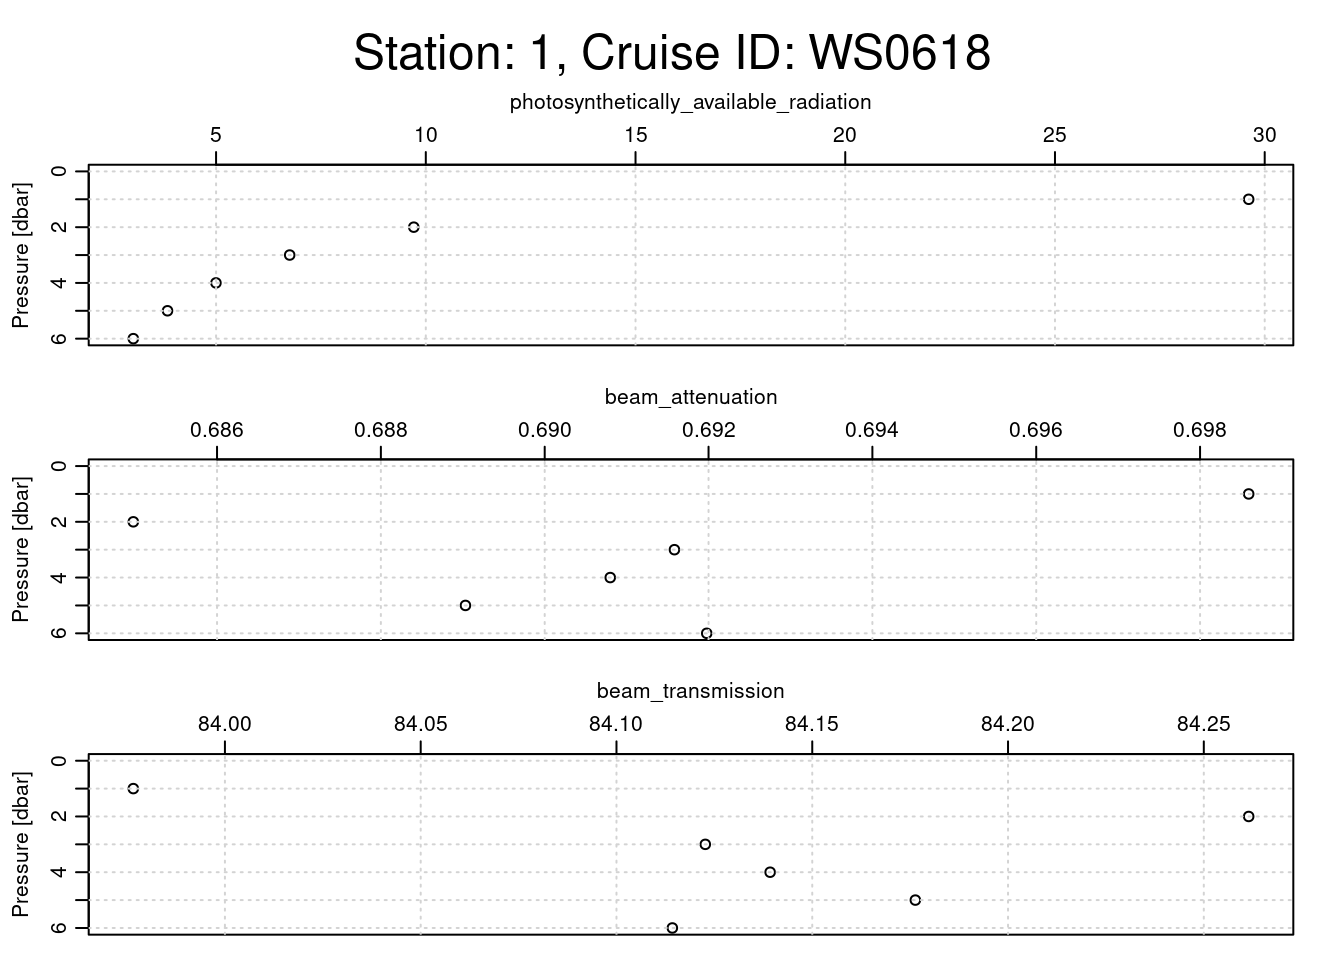
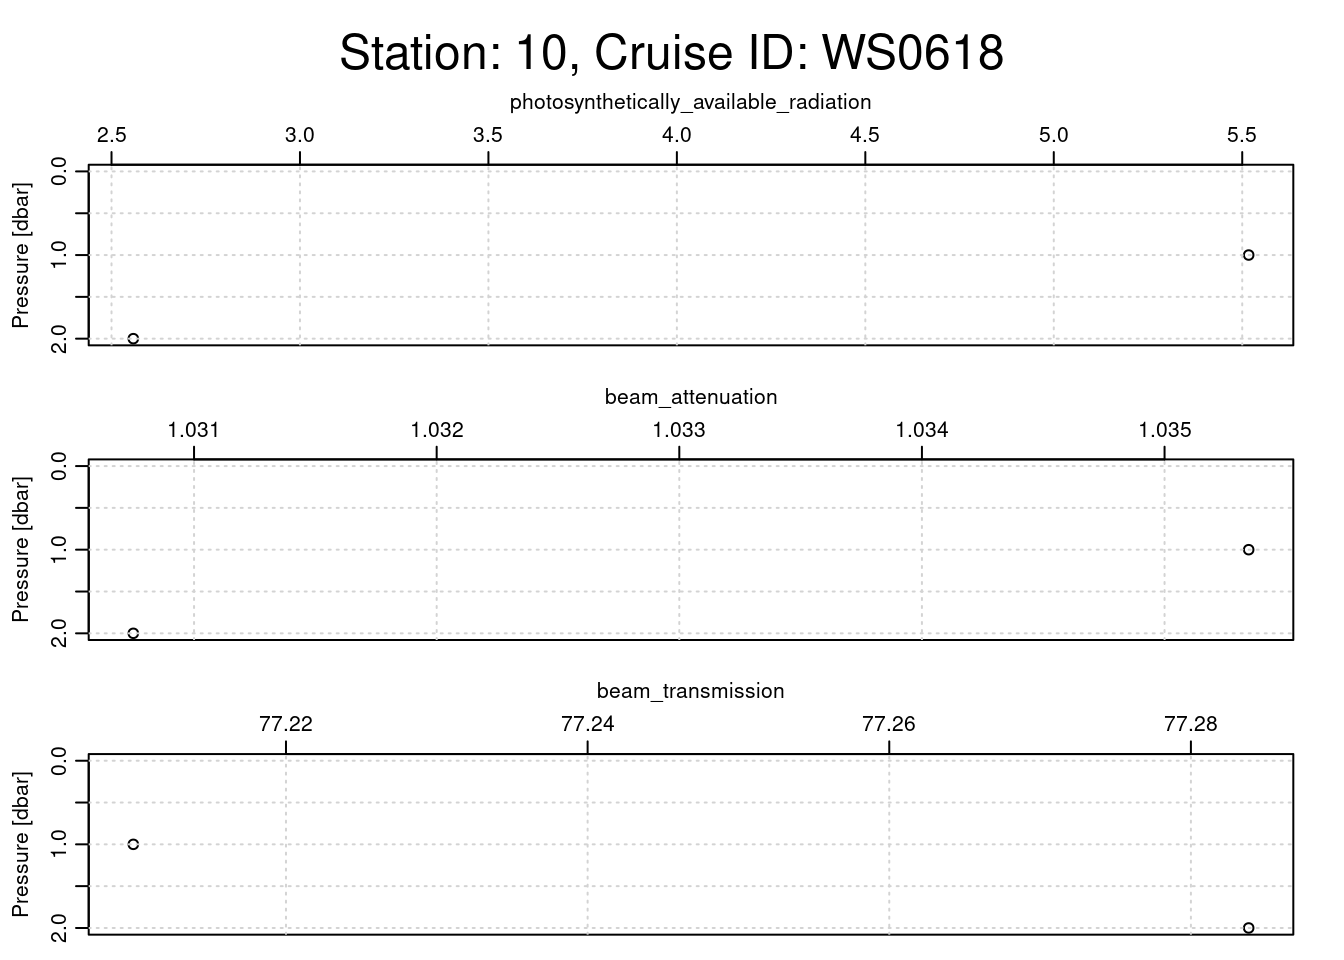
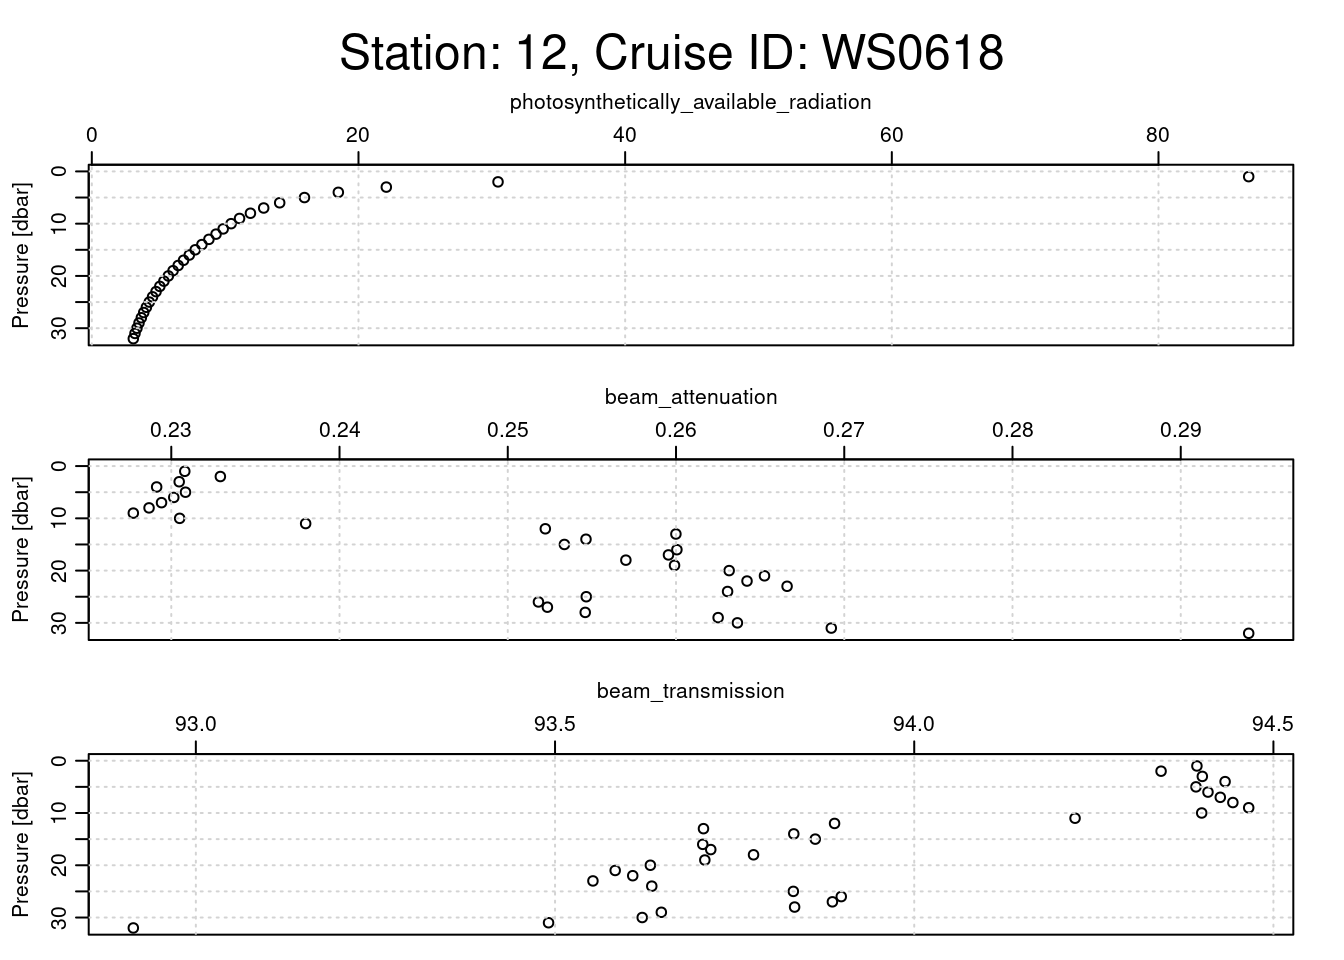
# Loop through each CTD castfor (i inseq(ctd_FK)){ cast <- ctd_FK[[i]] # Assuming each sublist contains only one relevant CTD objecttryCatch({# Extract metadata for station name and cruise ID station_name <- cast@metadata$station[1] cruise_id <- cast@data$cruise_id[1]# Generate a title with station name and cruise ID overall_title <- glue::glue("Station: {station_name}, Cruise ID: {cruise_id}")# Set margins: increase the outer margin for the titlepar(oma =c(0, 0, 3, 0)) # Top outer margin increased for title# Plotting function with specific parameters oce::plot(x =ctdDecimate(ctdTrim(cast)),which =c("photosynthetically_available_radiation","beam_attenuation","beam_transmission" ),main =""# No main title for individual subplots )# Place a single overall title at the top of the plot framemtext(overall_title, side =3, line =1, outer =TRUE, cex =1.5)# Reset outer margins to defaultpar(oma =c(0, 0, 0, 0)) }, error =function(e) {print(e$message) # Print any errors that occur during plotting })}
[1] "unknown xtype value (\"529.94\")"
loop through every cast, clean, & save
combined_df <-data.frame()for (i inseq(ctd_FK)){tryCatch({ cast <- ctd_FK[[i]] # 1 is selecting only the first sublist# print(class(cast))# clean cast trimmed_cast <-ctdTrim(cast) decimated_cast <-ctdDecimate(trimmed_cast, p =0.5) # binned to 0.5 m# convert to df cast_df <-as.data.frame(decimated_cast@data)# Add metadata# assumes station ID and cruise ID the same for all & just uses 1st one cast_df <-mutate( cast_df,station = cast@data$station[1],cruise_id = cast@data$cruise_id[1] )# drop NA rows left by cleaning cast_df <-subset(cast_df, !is.na(scan))# Append the data to the combined dataframe combined_df <-rbind(combined_df, cast_df) }, error =function(e){print(glue("error in cast {cast@metadata$station[1]}"))print(e) })}# Save to CSVfile_path <-here(glue("data/cleaned/{cruise_id}.csv"))write.csv(combined_df, file_path, row.names =FALSE)