Warning: One or more parsing issues, call `problems()` on your data frame for details,
e.g.:
  dat <- vroom(...)
  problems(dat)
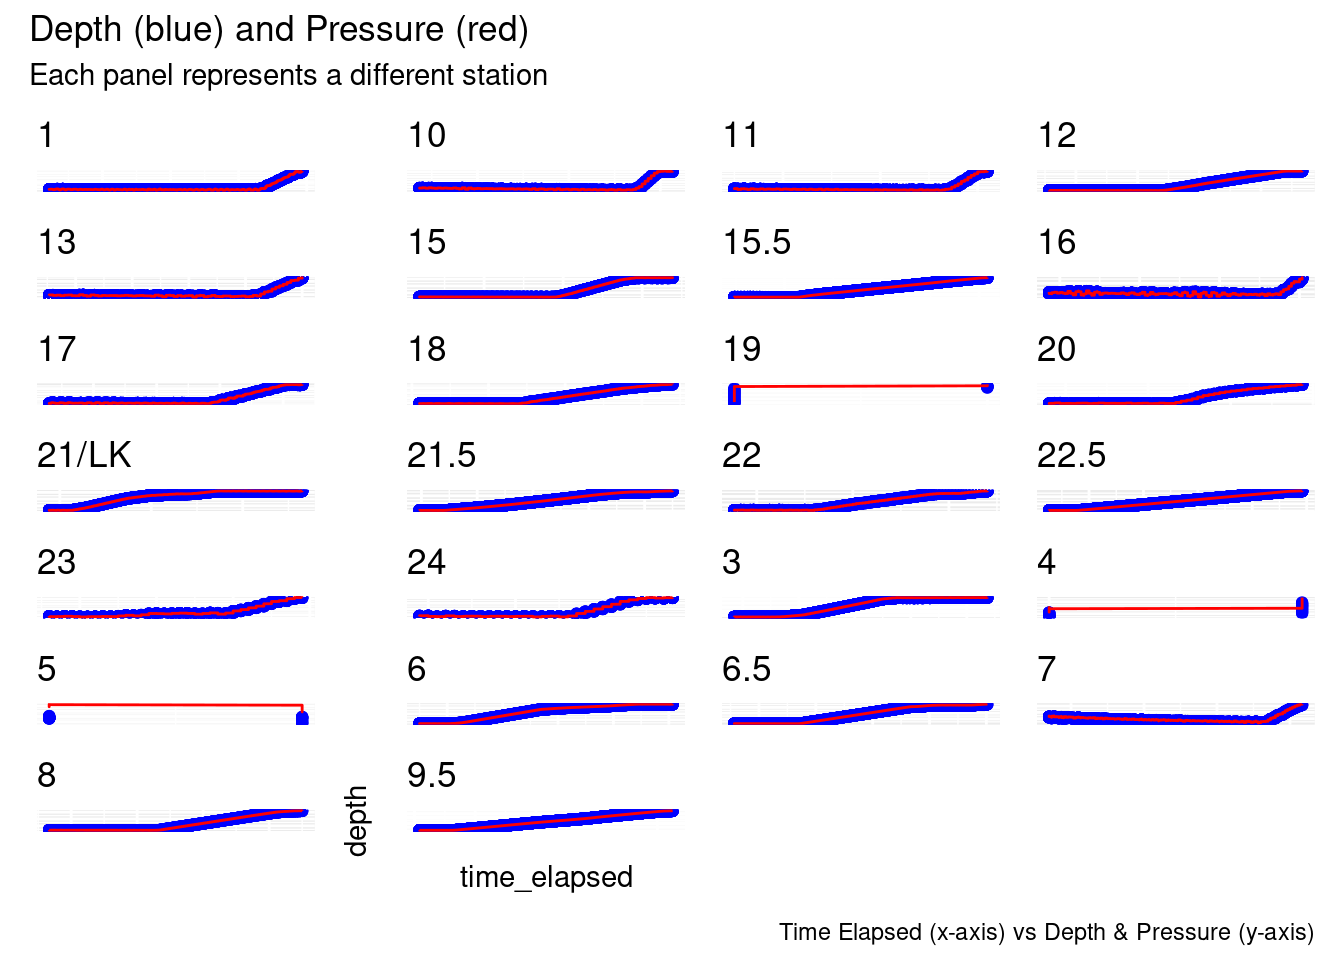
plot depth & pressure vs time elapsed
tryCatch({ plots <-list()for (station_name inunique(cruise_df$station)) { subset_df <-filter(cruise_df, station == station_name) plots[[station_name]] <-ggplot(subset_df, aes(x = time_elapsed)) +geom_point(aes(y = depth), color ="blue") +# Plot depth in bluegeom_line(aes(y = sea_water_pressure), color ="red") +# Plot sea water pressure in redggtitle(glue("{station_name}")) +theme(axis.title.x =element_blank(),axis.title.y =element_blank(),axis.text.x =element_blank(),axis.text.y =element_blank(),axis.ticks.x =element_blank(),axis.ticks.y =element_blank() ) # Remove individual axis titles and text }# drop nulls plots <- purrr::compact(plots)# Combine all plots into a grid combined_plot <-wrap_plots(plots) +plot_layout(ncol =4) +# Adjust ncol to set number of columns in the gridplot_annotation(title ="Depth (blue) and Pressure (red)",subtitle ="Each panel represents a different station",caption ="Time Elapsed (x-axis) vs Depth & Pressure (y-axis)" ) +theme(plot.tag =element_text(size =12, face ="bold"),plot.tag.position ="topleft",axis.title.x =element_text(margin =margin(t =10)),axis.title.y =element_text(margin =margin(r =10)) )print(combined_plot)}, error =function(er){print(er)});
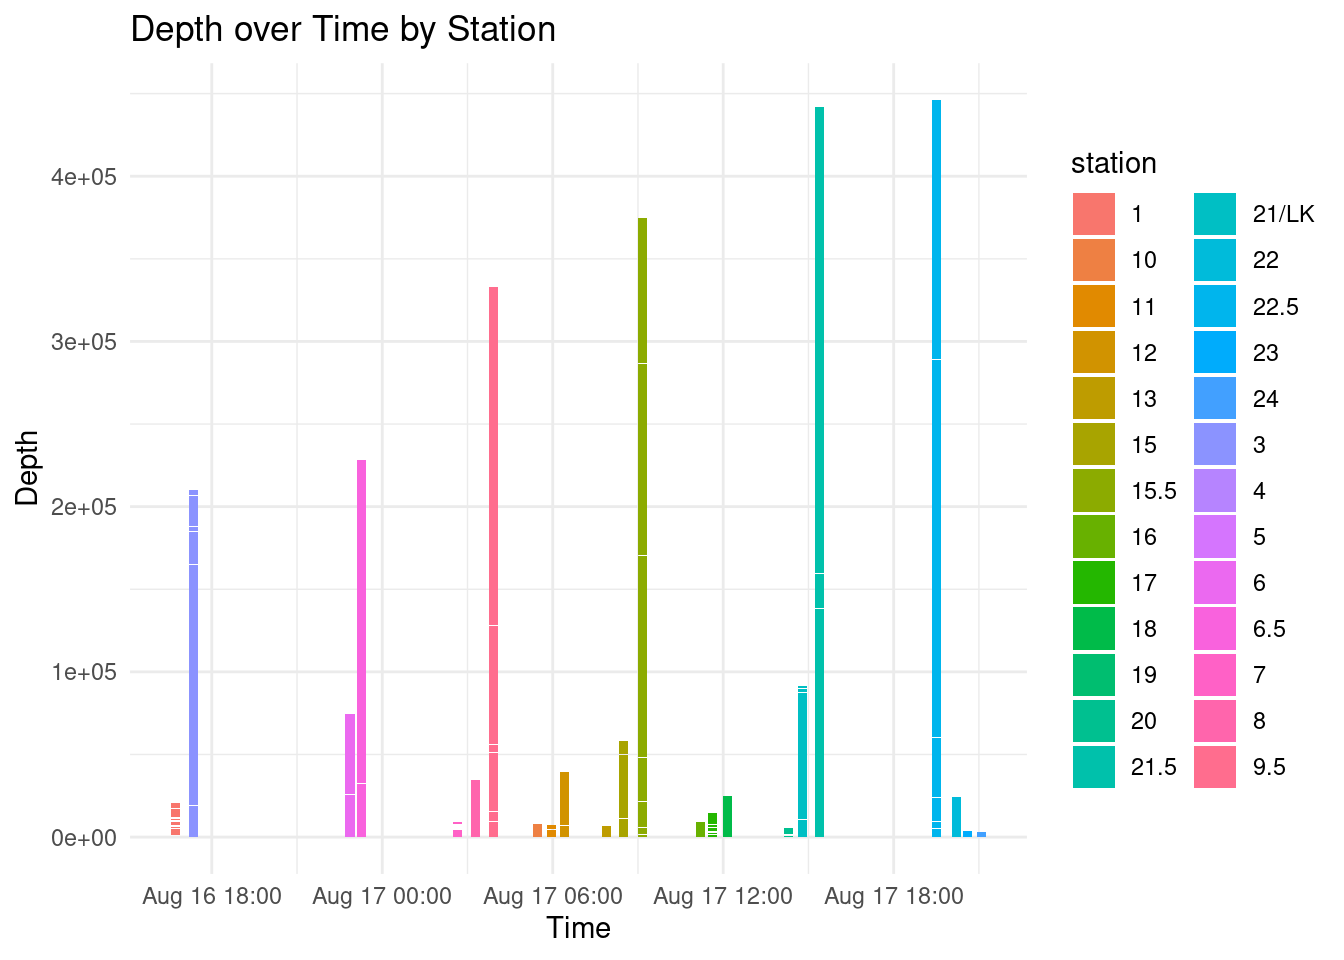
plot across all stations
p <-ggplot(cruise_df, aes(x = time, y = depth, fill = station)) +geom_col() +# This creates the bars# geom_text(aes(label = station), vjust = -0.3) + # This adds labels to each bar, adjust vjust for positionlabs(x ="Time", y ="Depth", title ="Depth over Time by Station") +# Set labels and titletheme_minimal() # Use a minimal themeprint(p)
create oce.ctd objects from dataframes
ctd_load <-function(data, other_params =NULL) {# create csv into ctd object test_ctd <-as.ctd(salinity = data$sea_water_salinity,temperature = data$sea_water_temperature,pressure = data$sea_water_pressure,station = data$station )# add additional columns to ctd objectif (!is.null(other_params)) {for (param_name in other_params) { test_ctd <-oceSetData(object = test_ctd,name = param_name,value = data[[param_name]] ) } }print(glue("{data$station[1]}:\t{length(test_ctd@data$scan)} scans"))return(test_ctd)}# Define other parameters to addother_params <-c("cruise_id", "station", "time", "time_elapsed", "latitude", "longitude", "sea_water_electrical_conductivity", "CDOM", "dissolved_oxygen","oxygen_saturation", "chlorophyll_concentration", "chlorophyll_fluorescence", "photosynthetically_available_radiation", "beam_attenuation","beam_transmission", "depth", "sea_water_sigma_t","descent_rate", "sound_velocity","altimeter")# Split data by station and create data listctd_FK <- cruise_df %>%split(.$station) %>%map(~ctd_load(.x, other_params = other_params)) # ~ is a lambda(x)
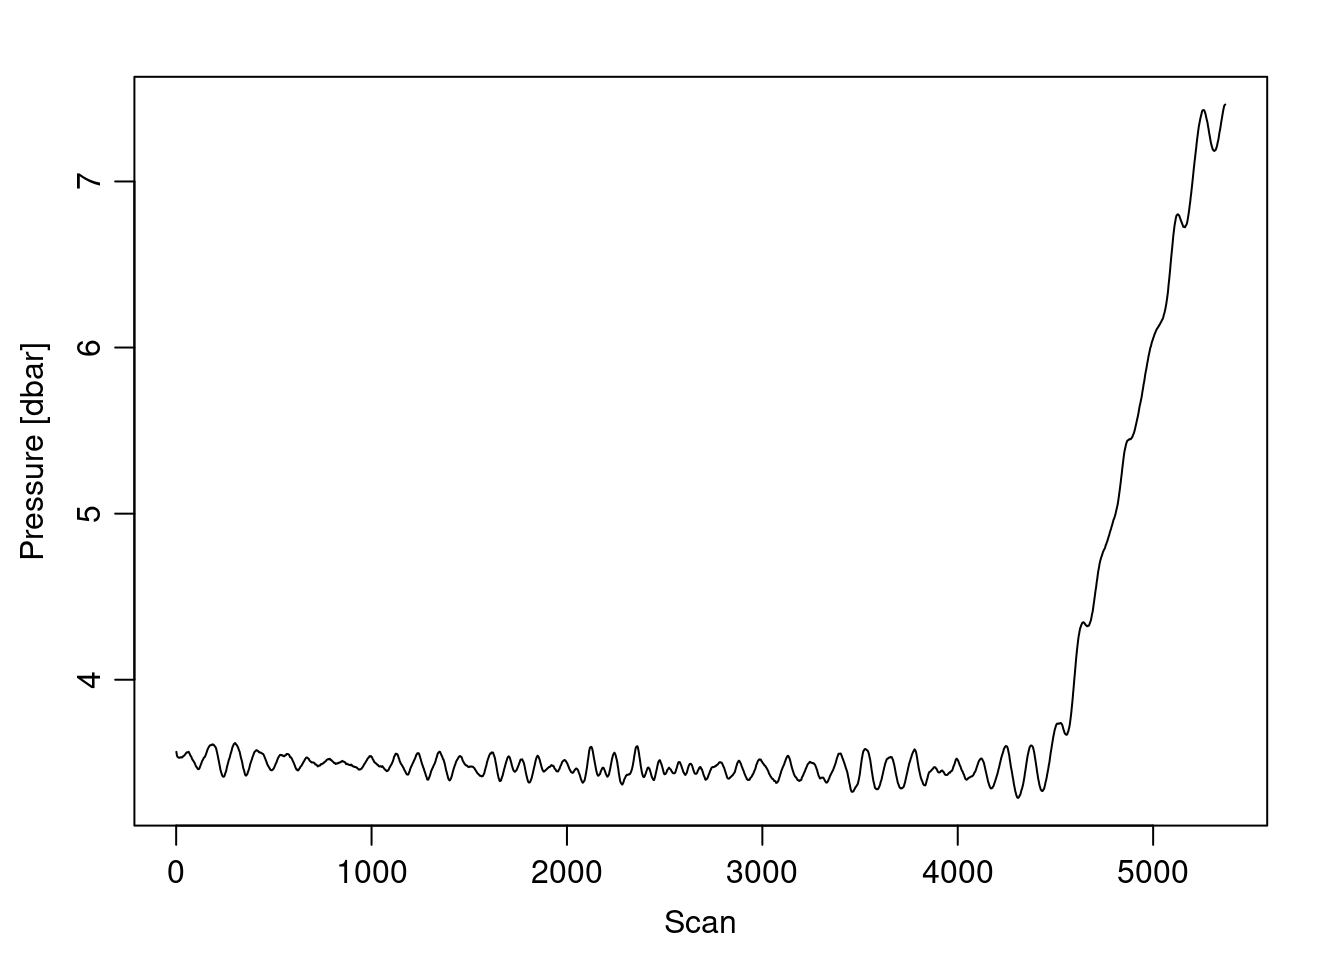
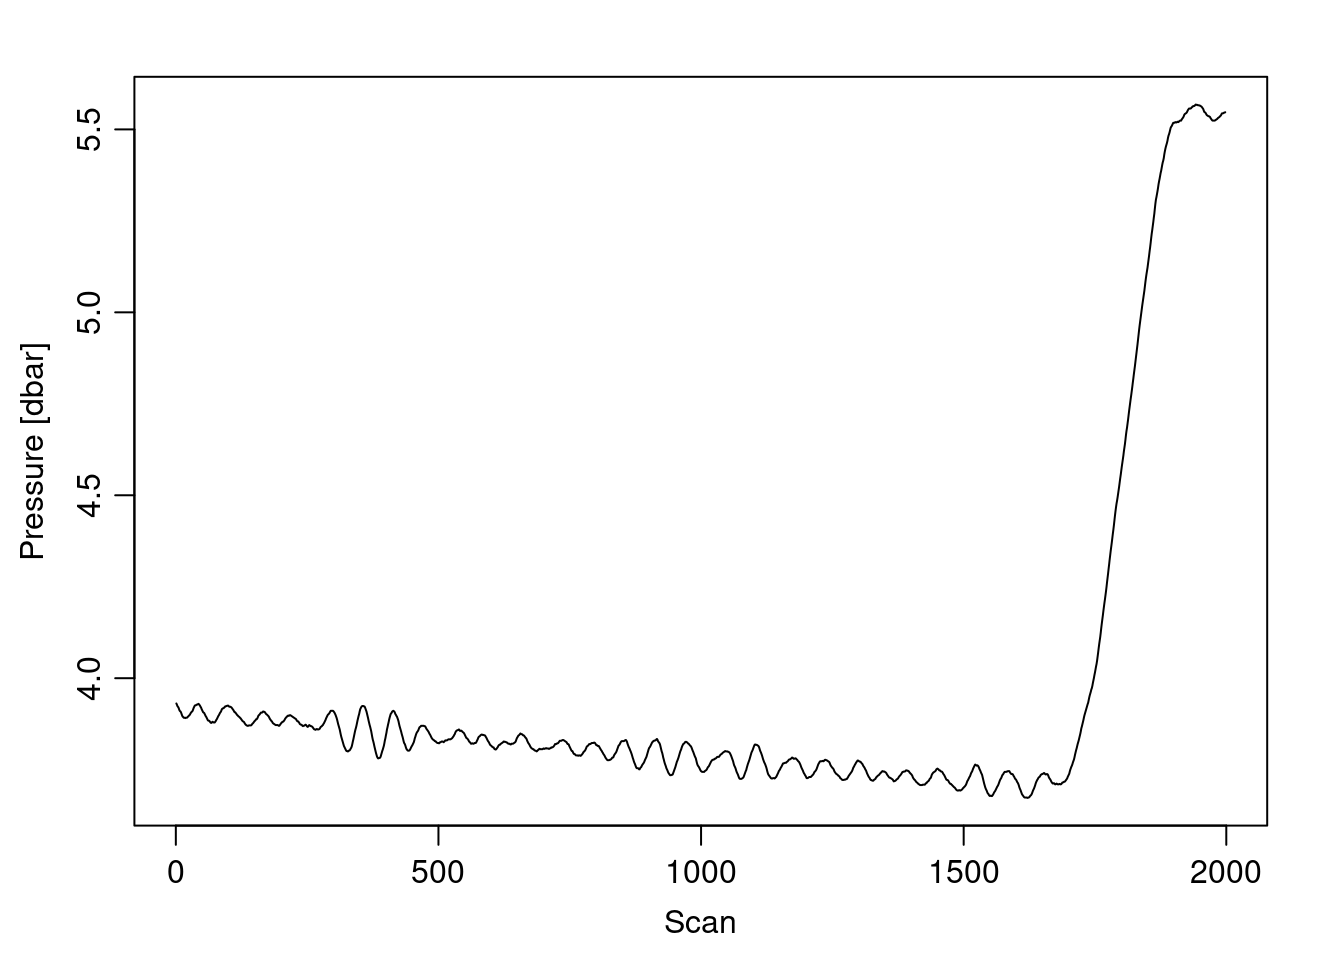
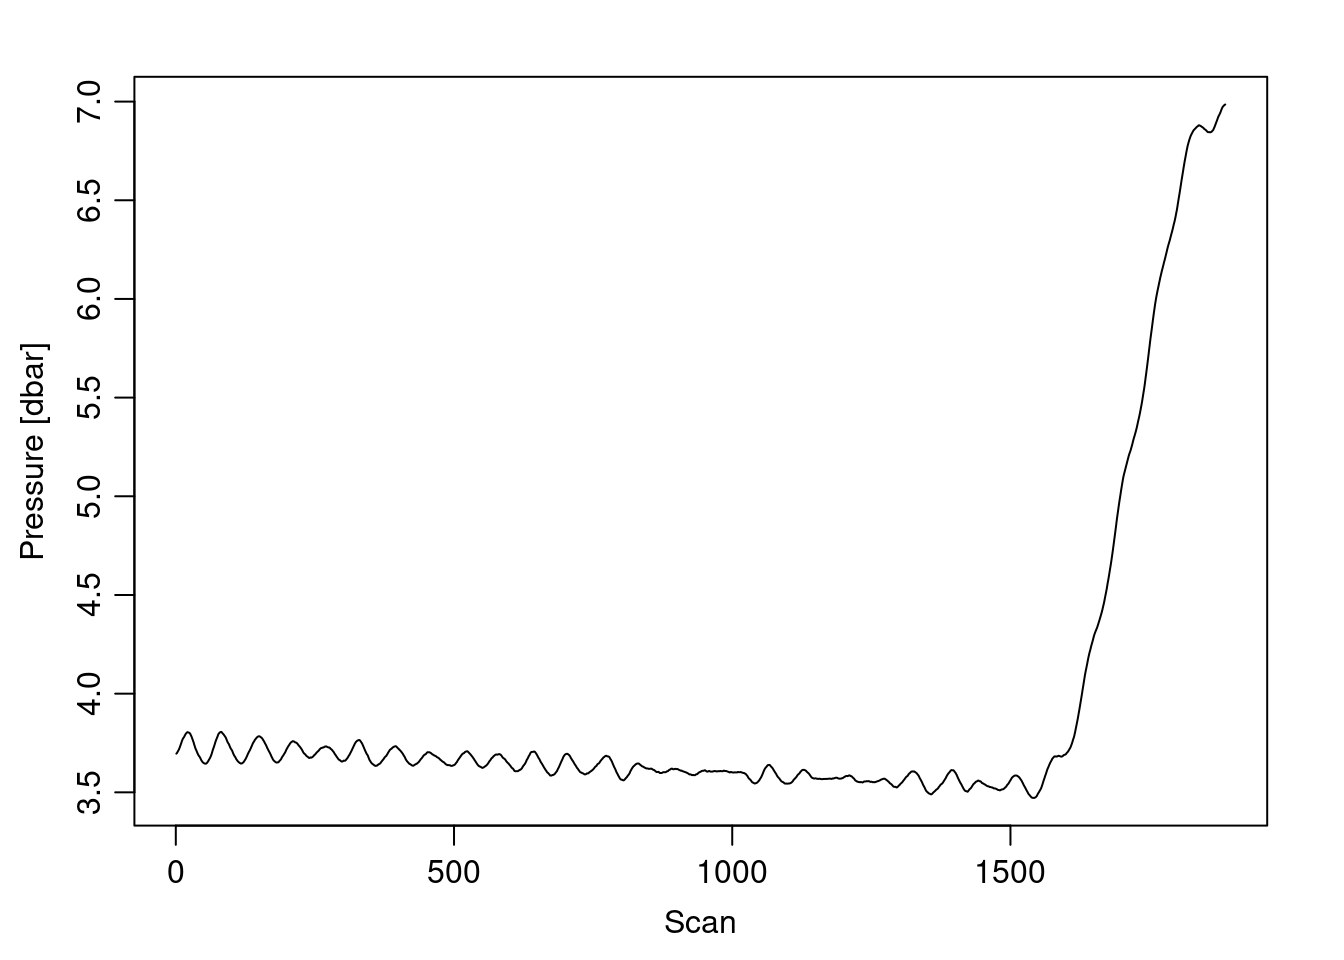
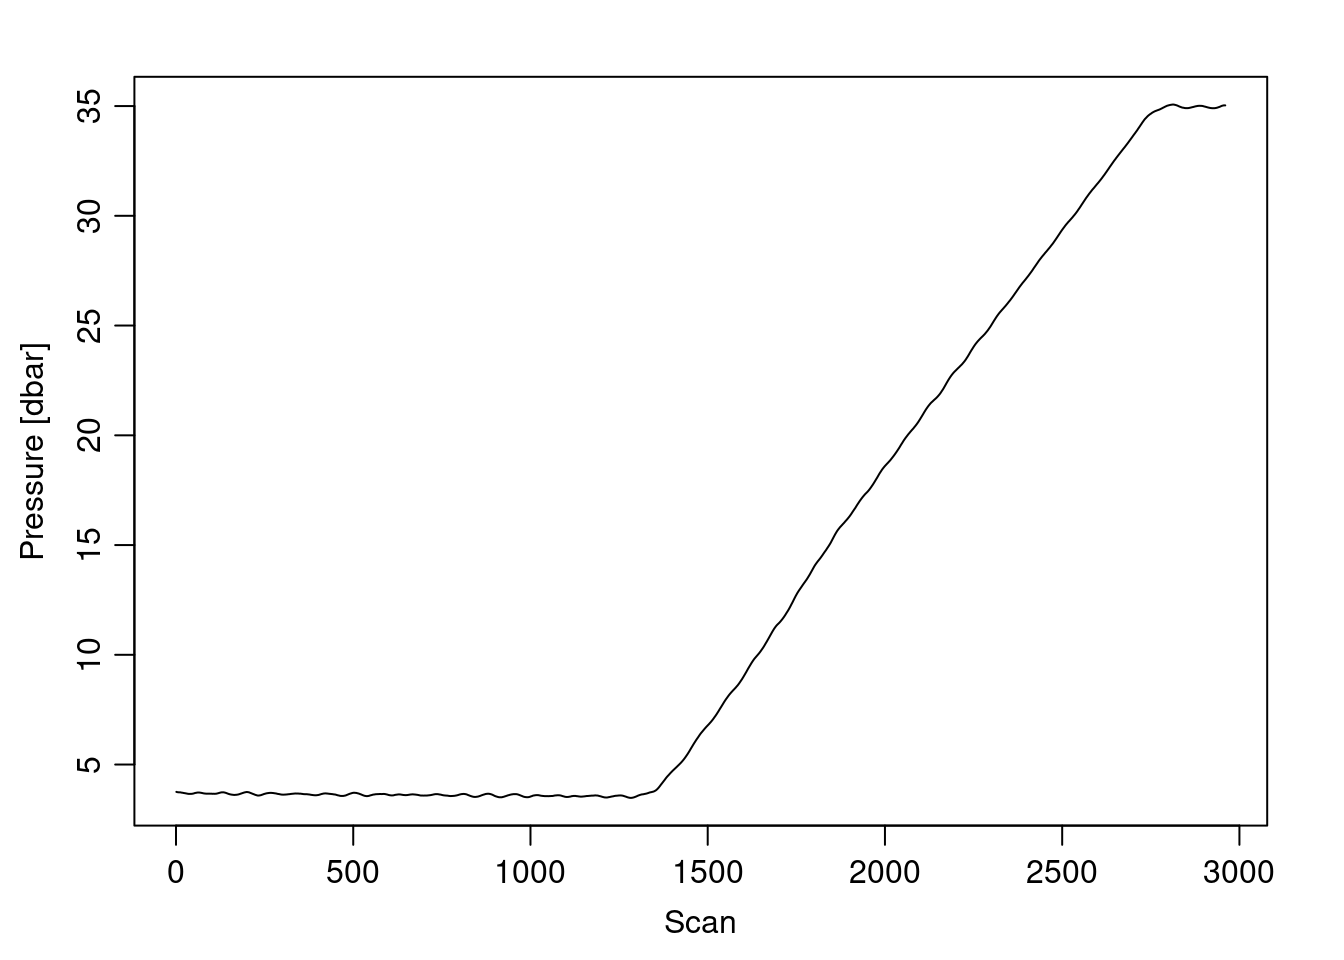
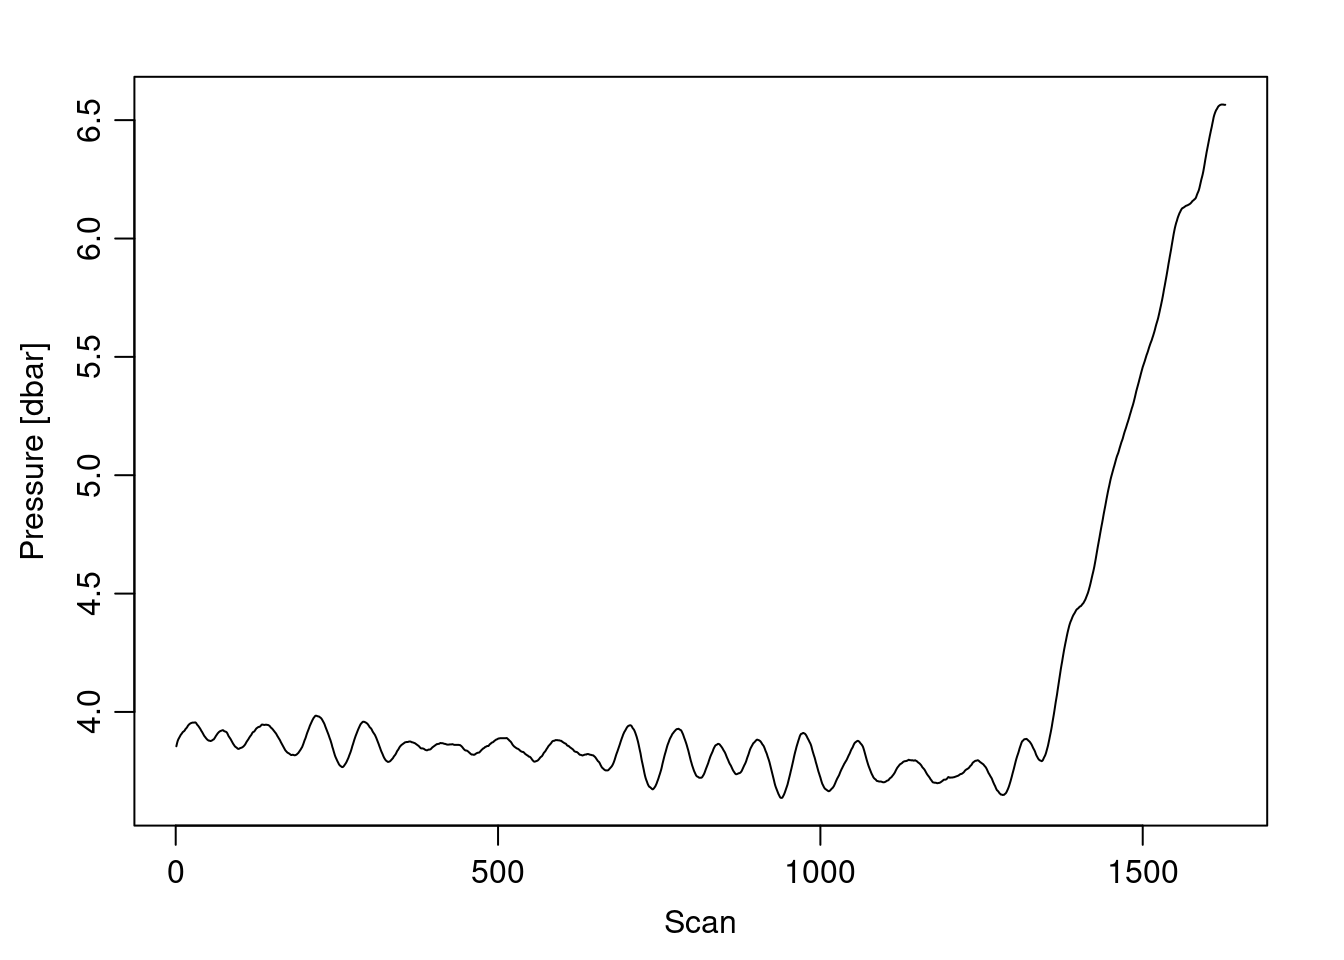
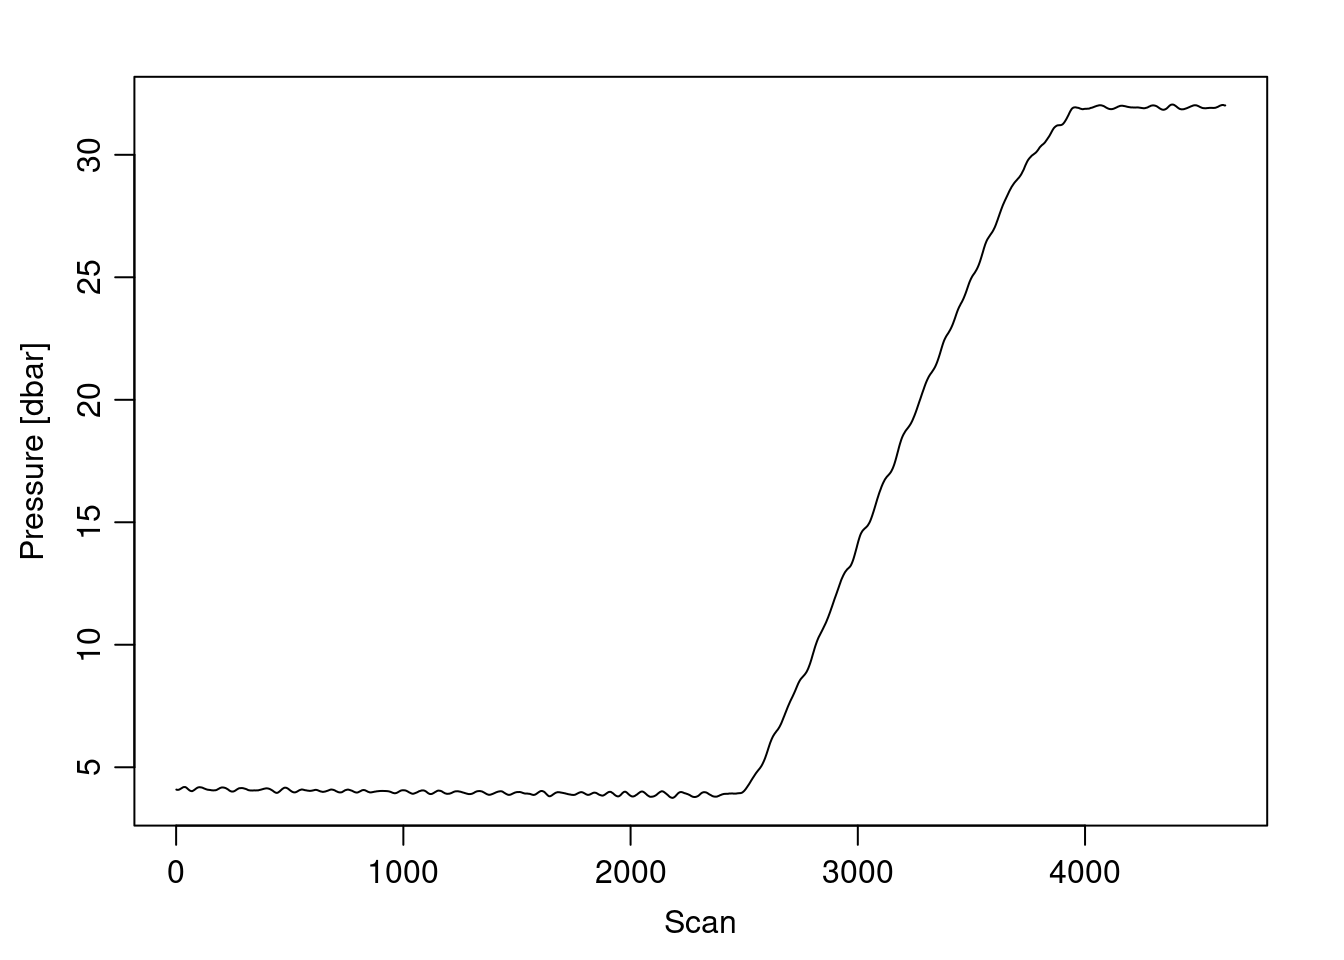
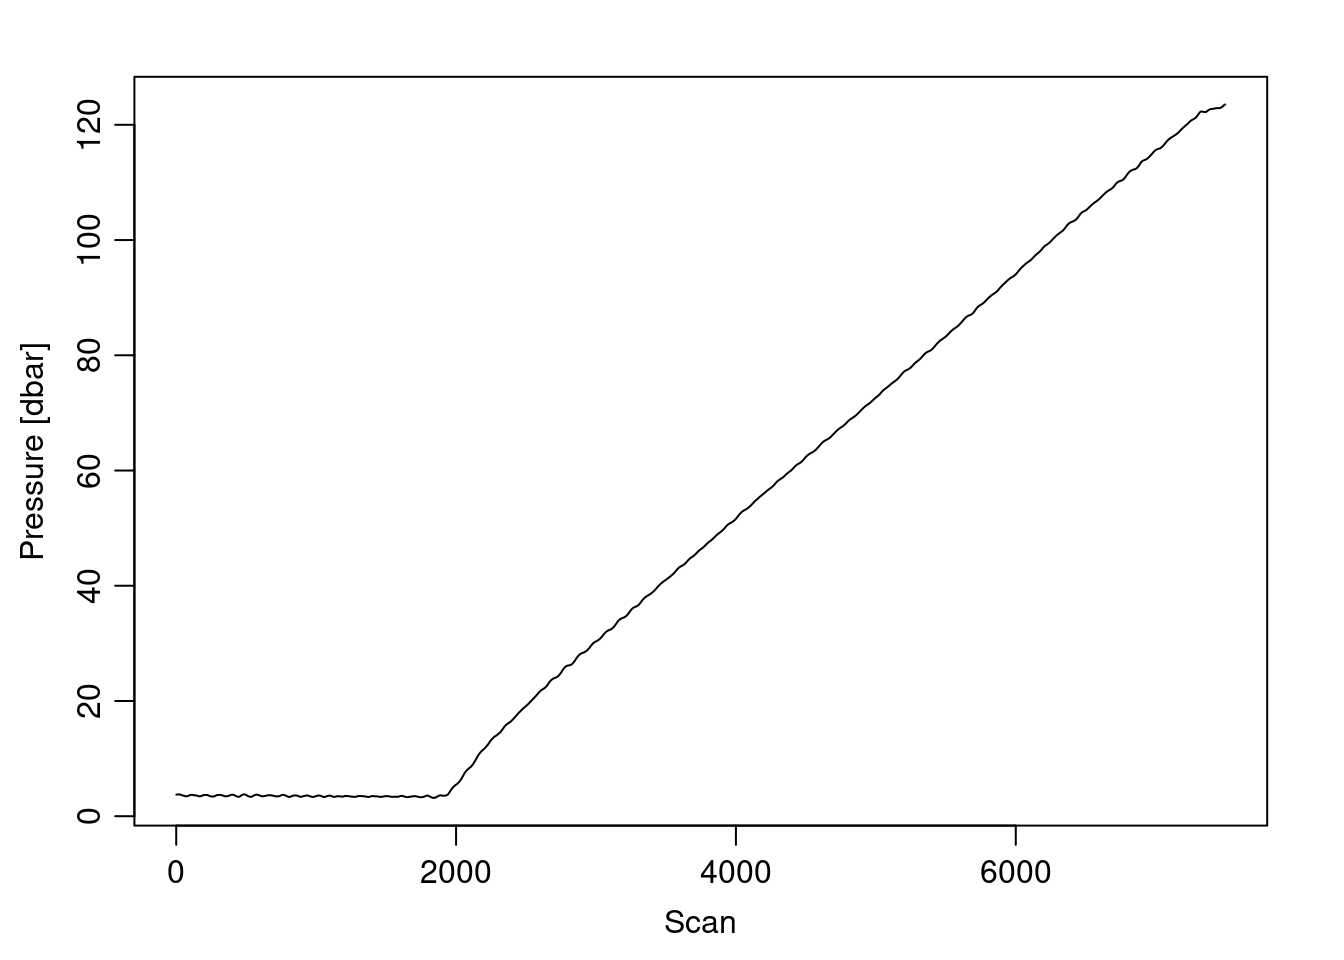
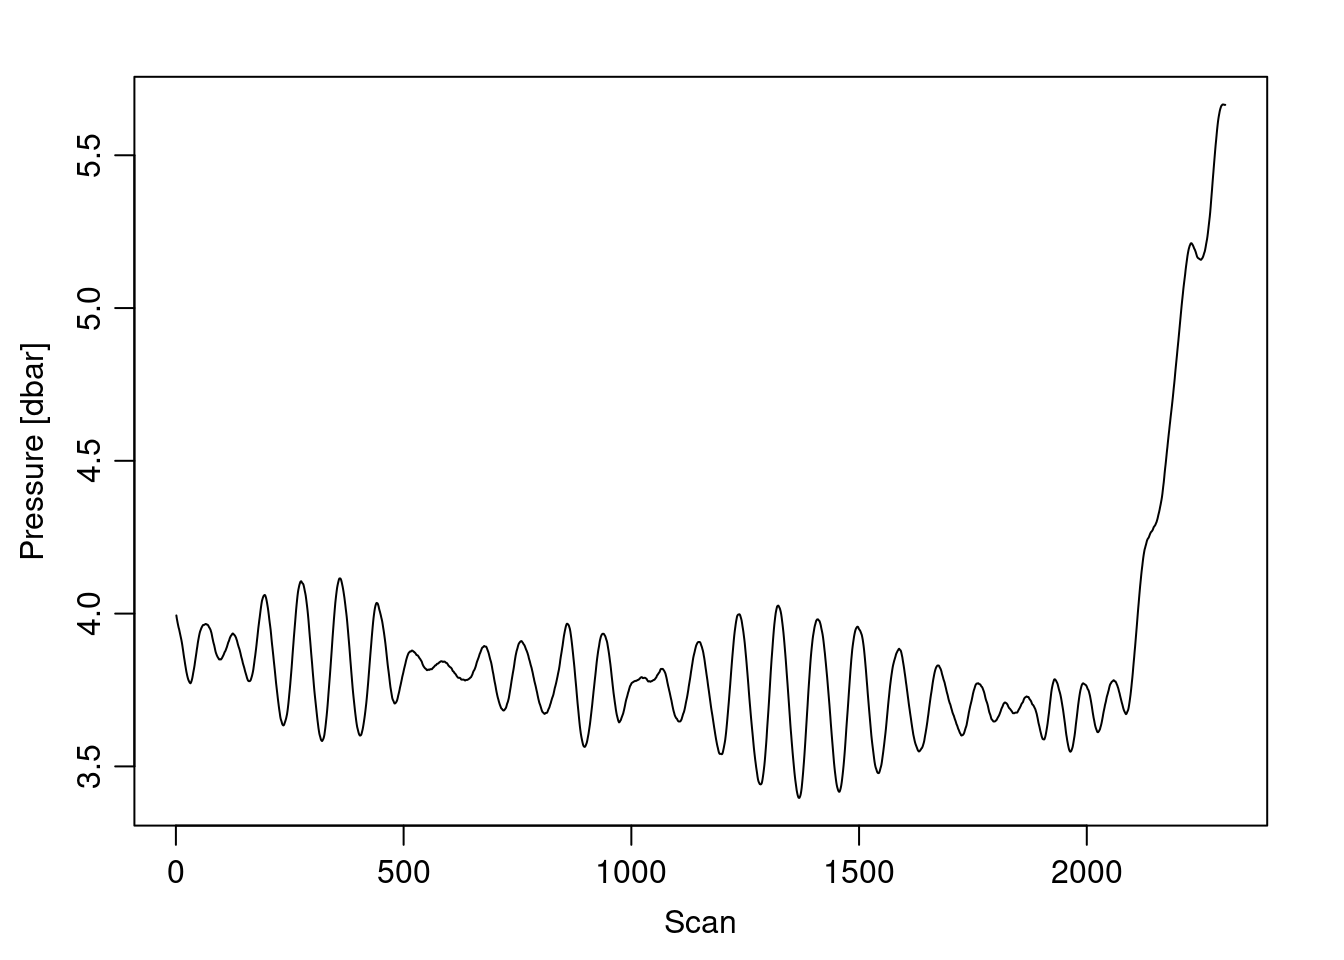
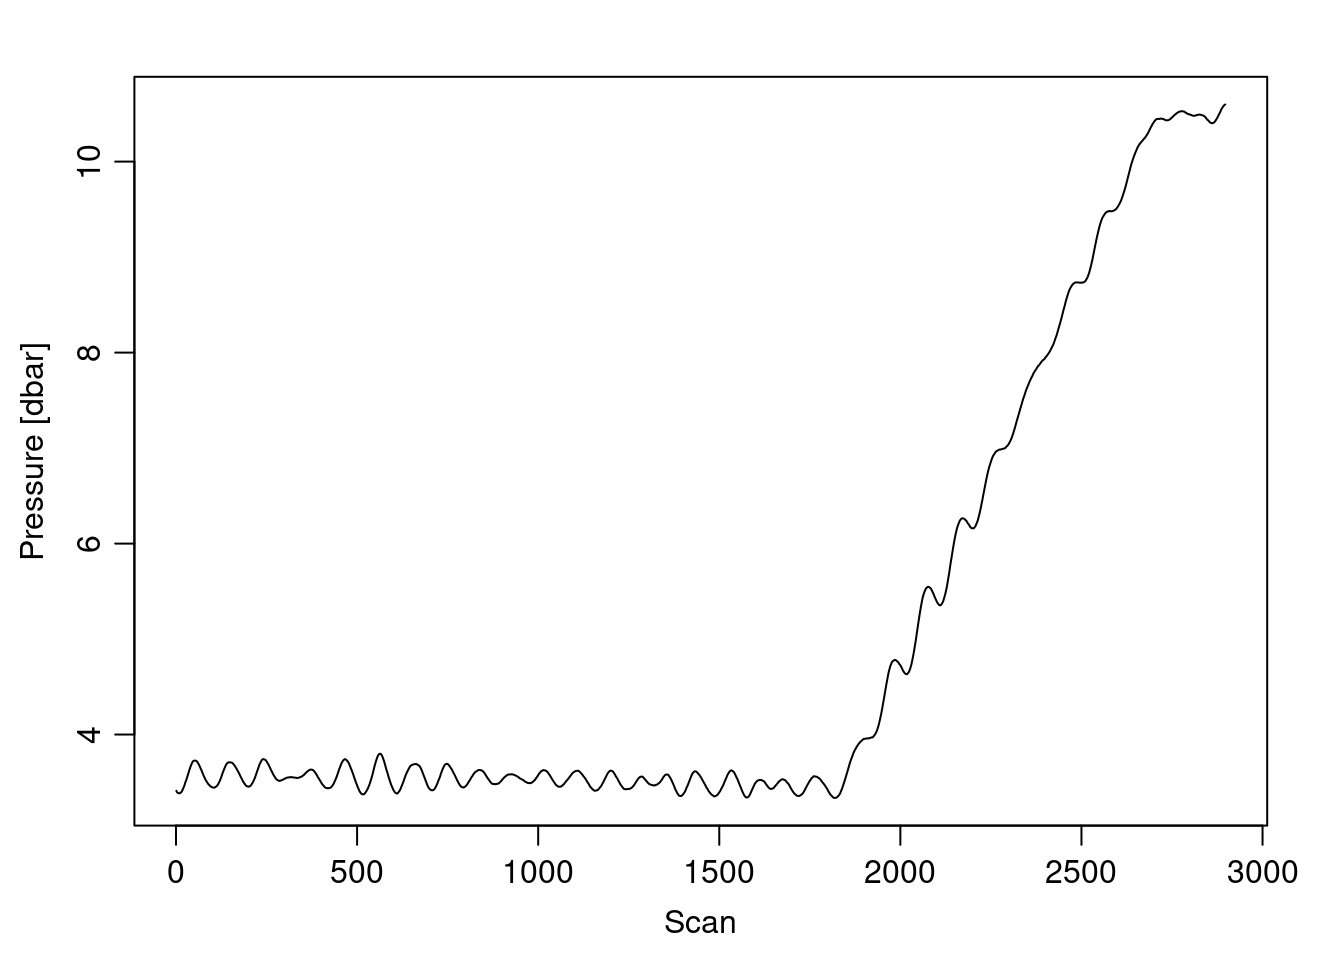
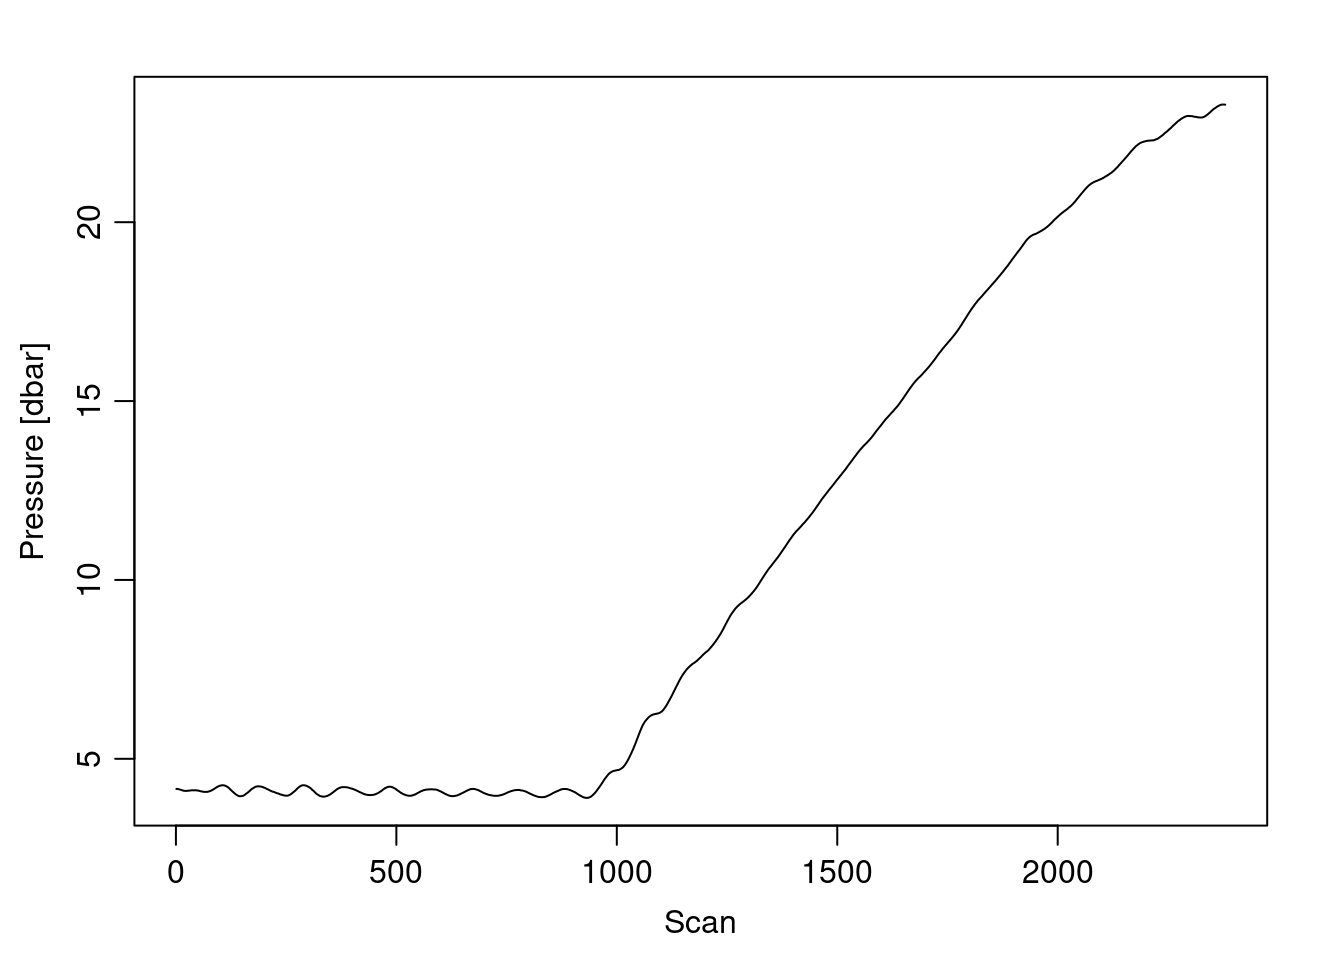
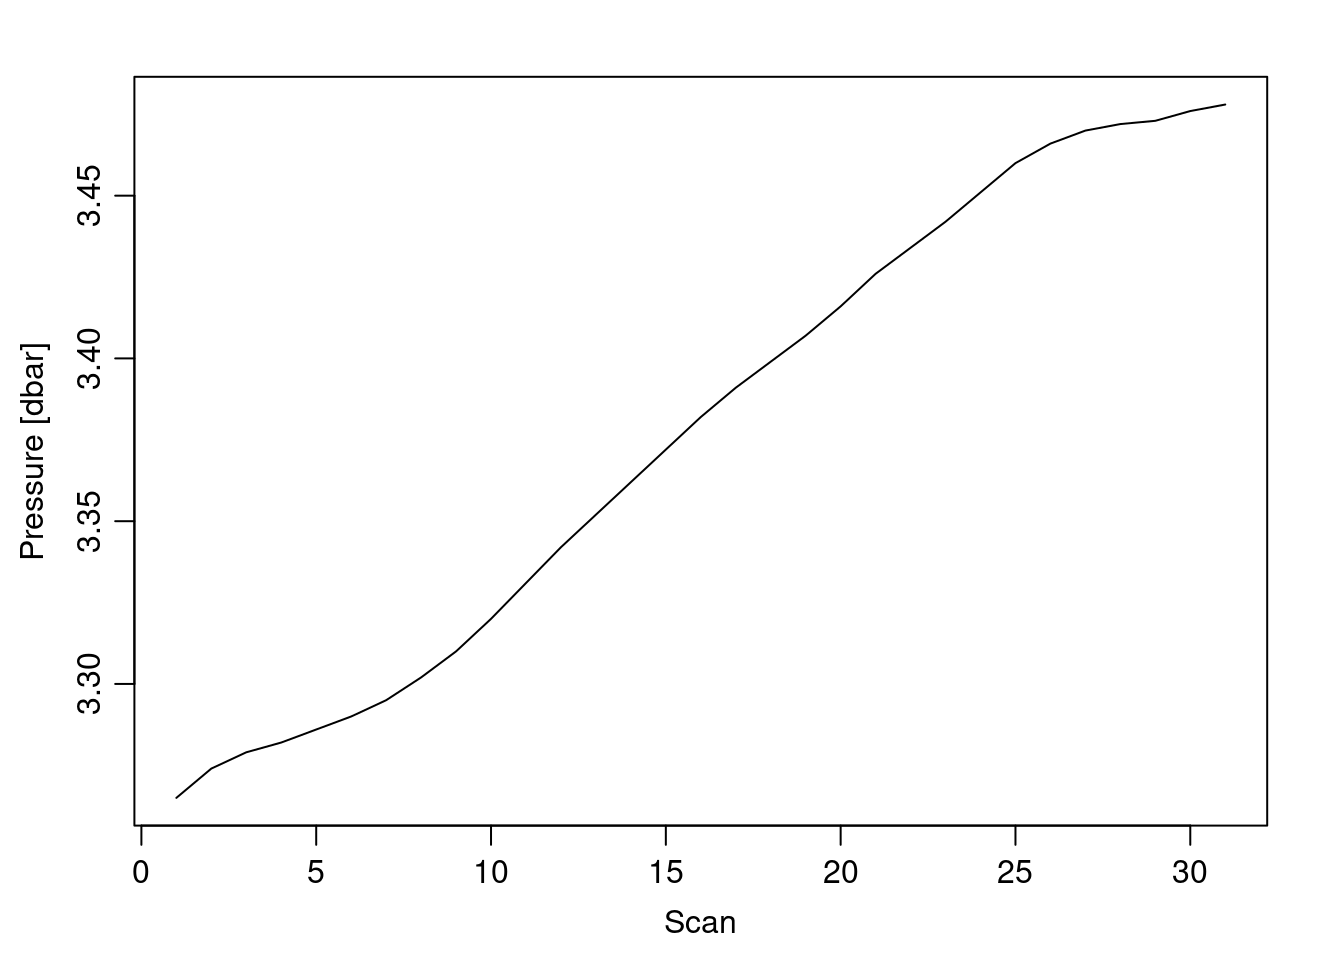
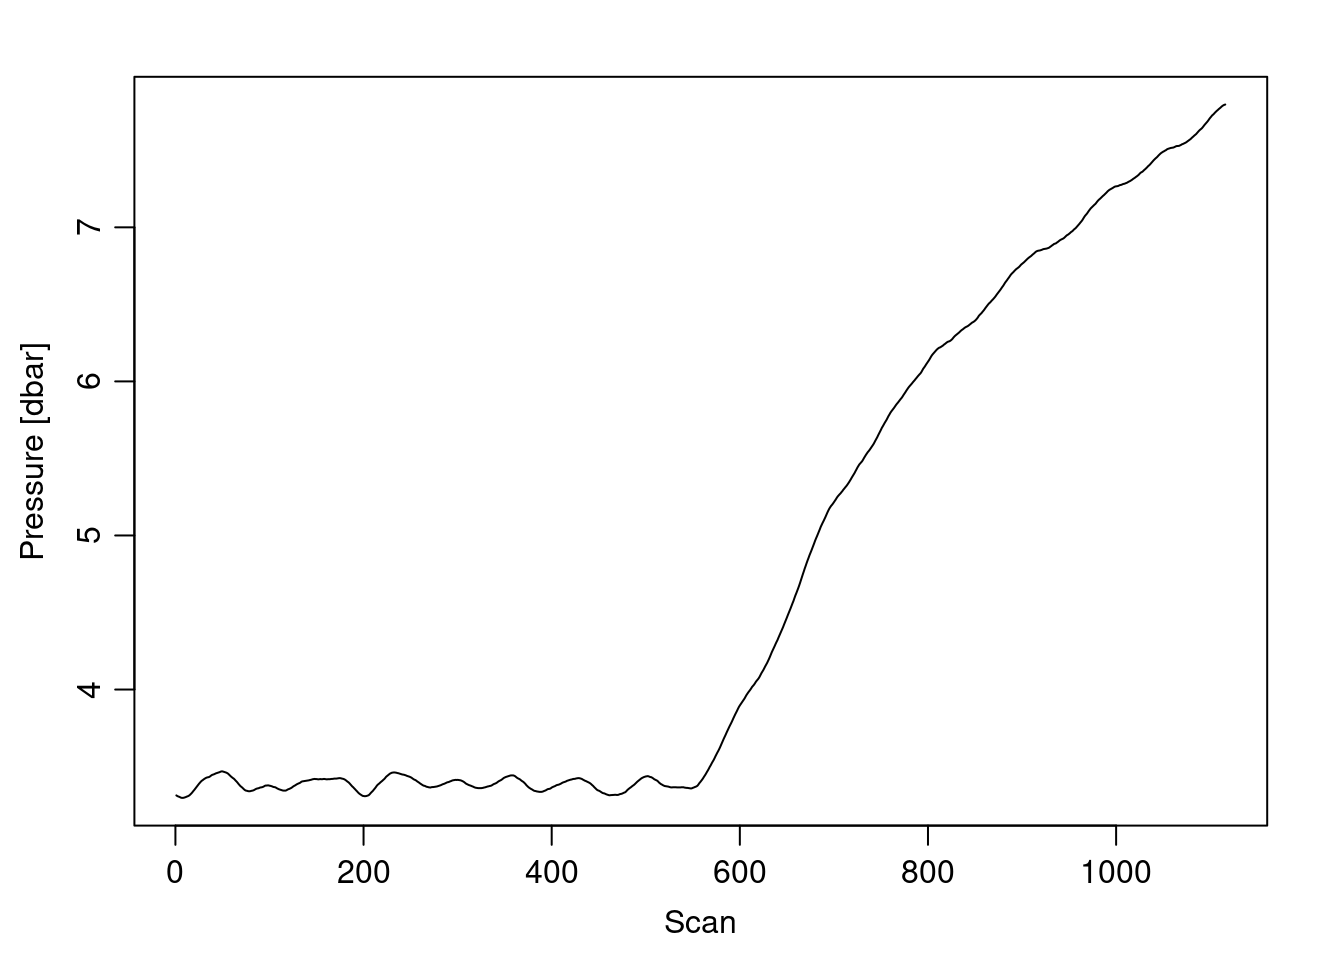
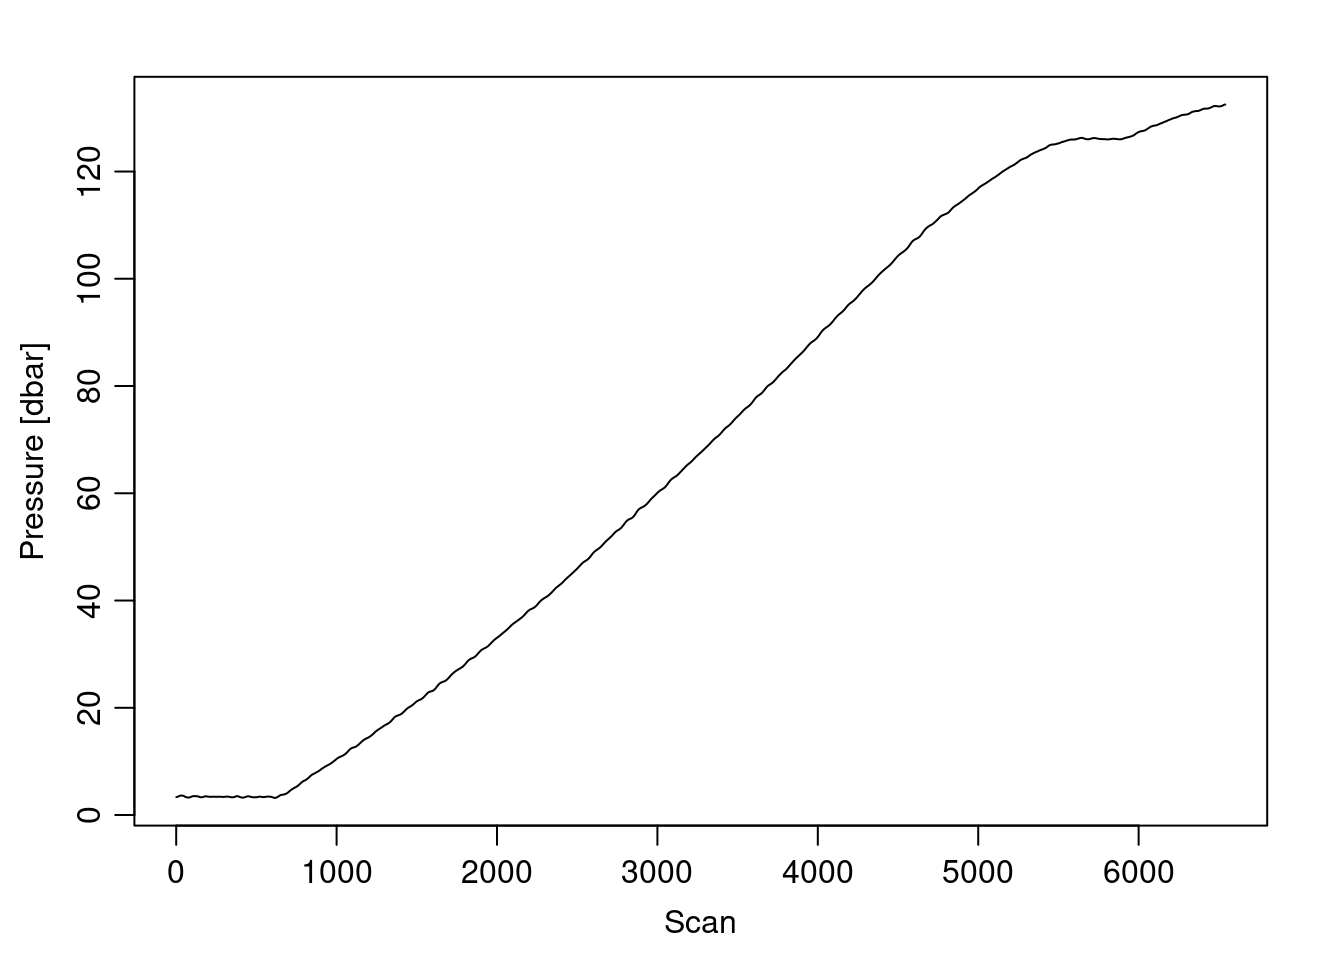
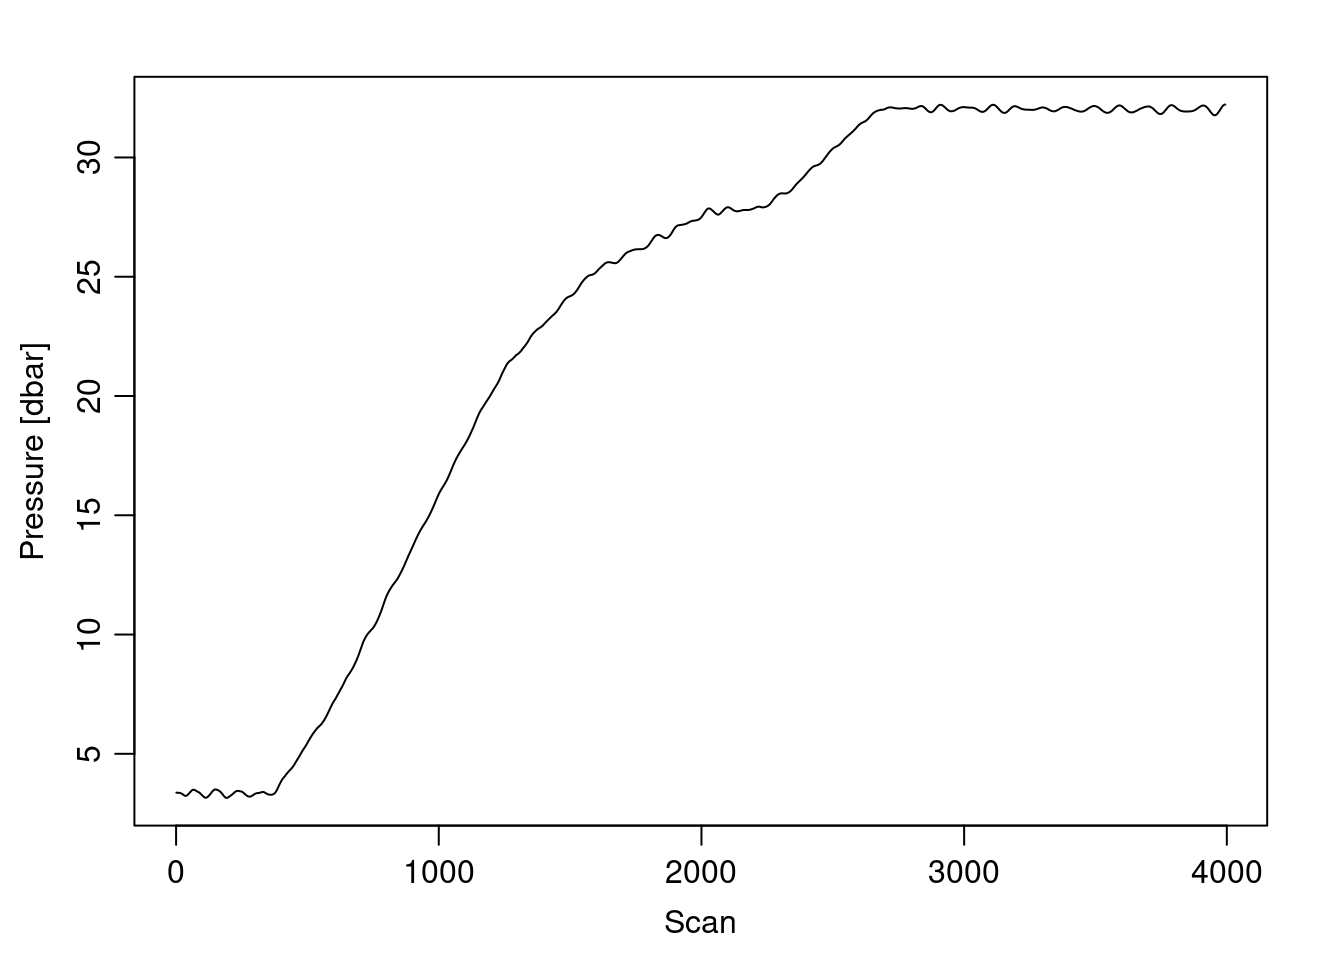
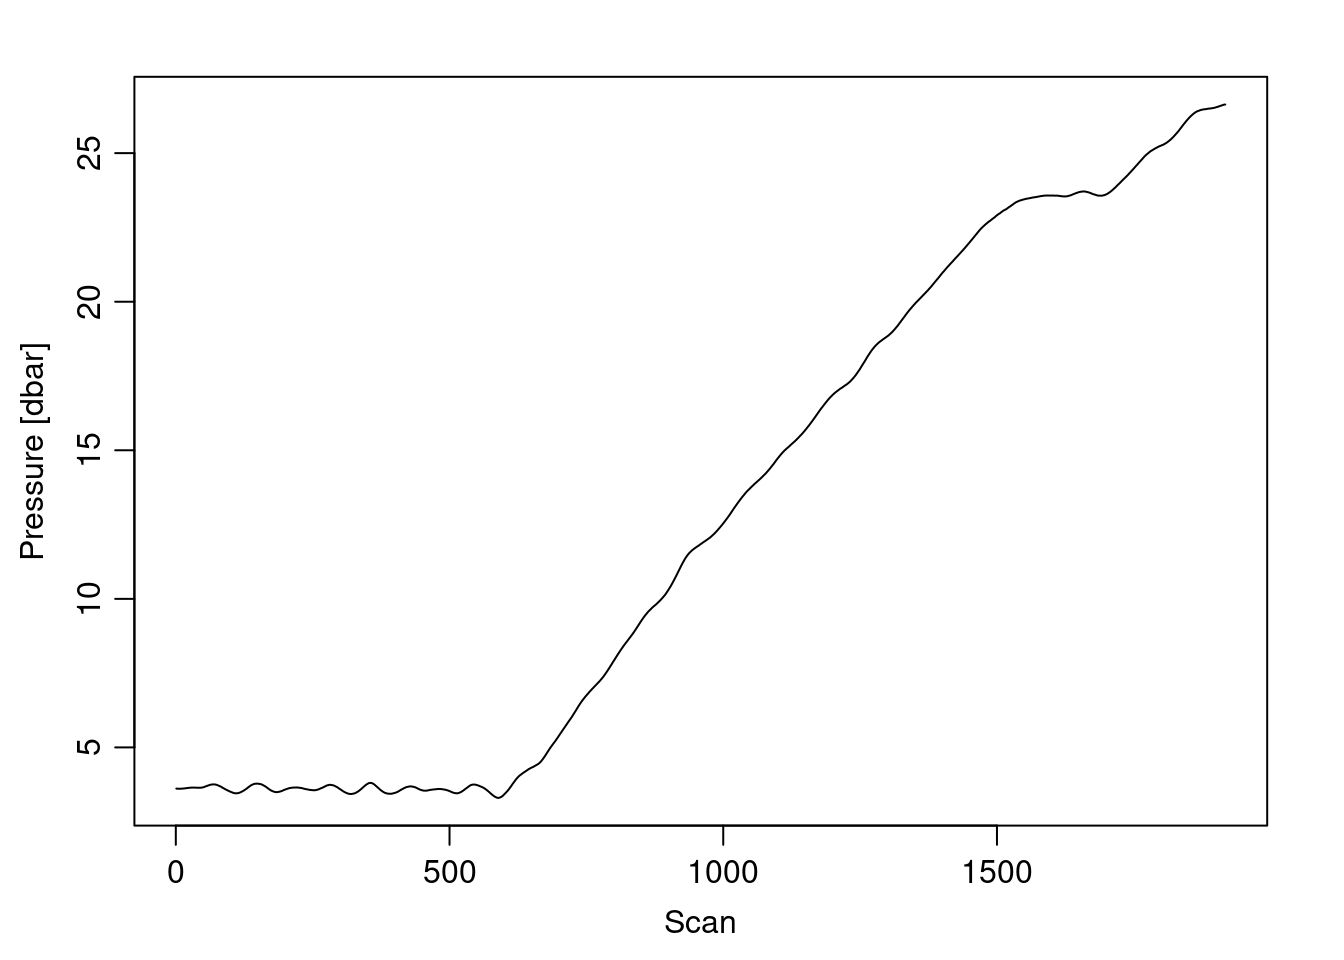
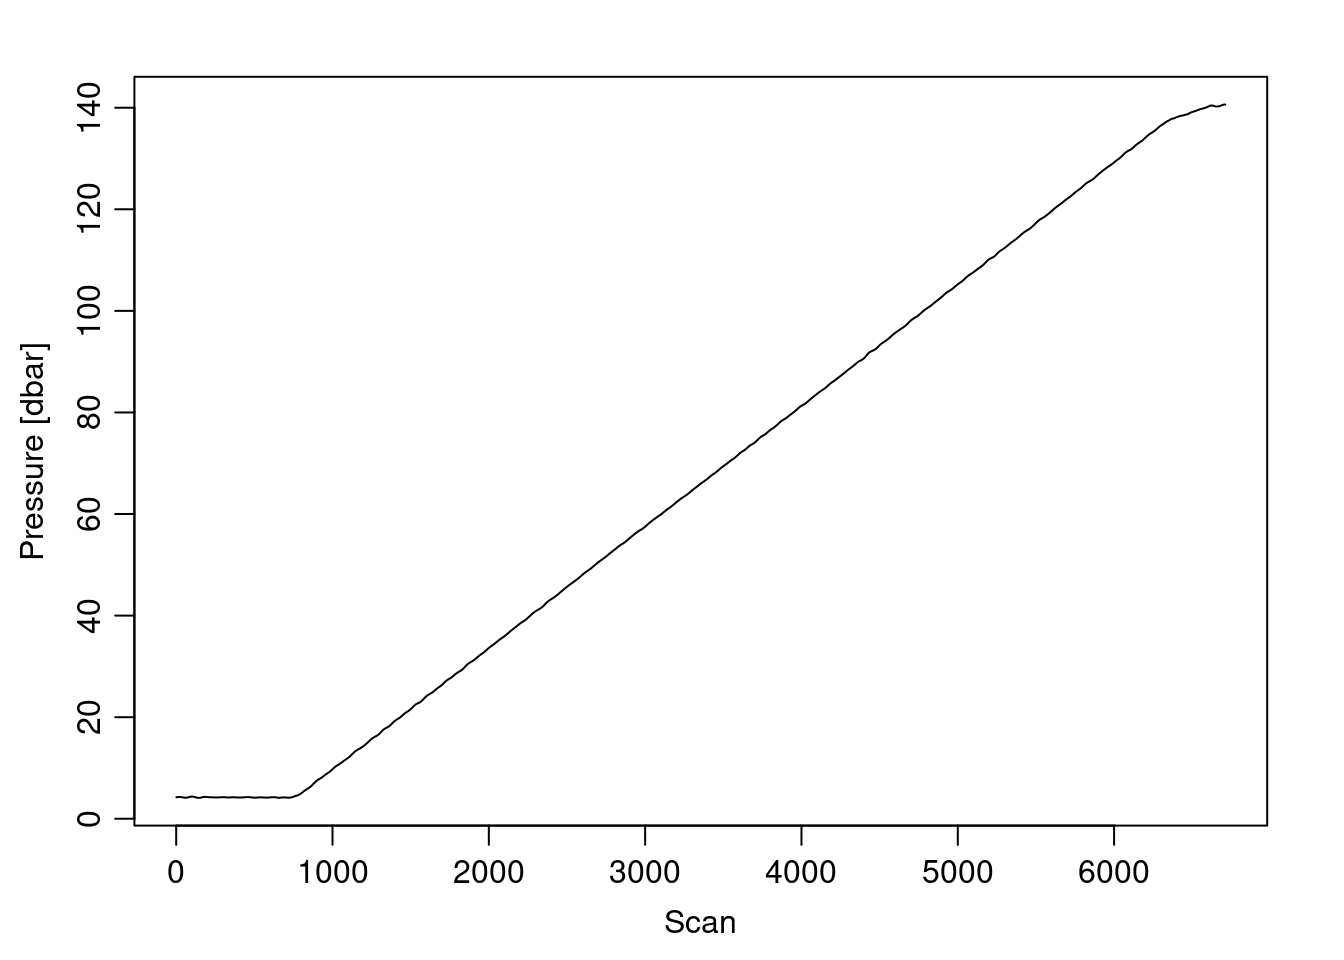
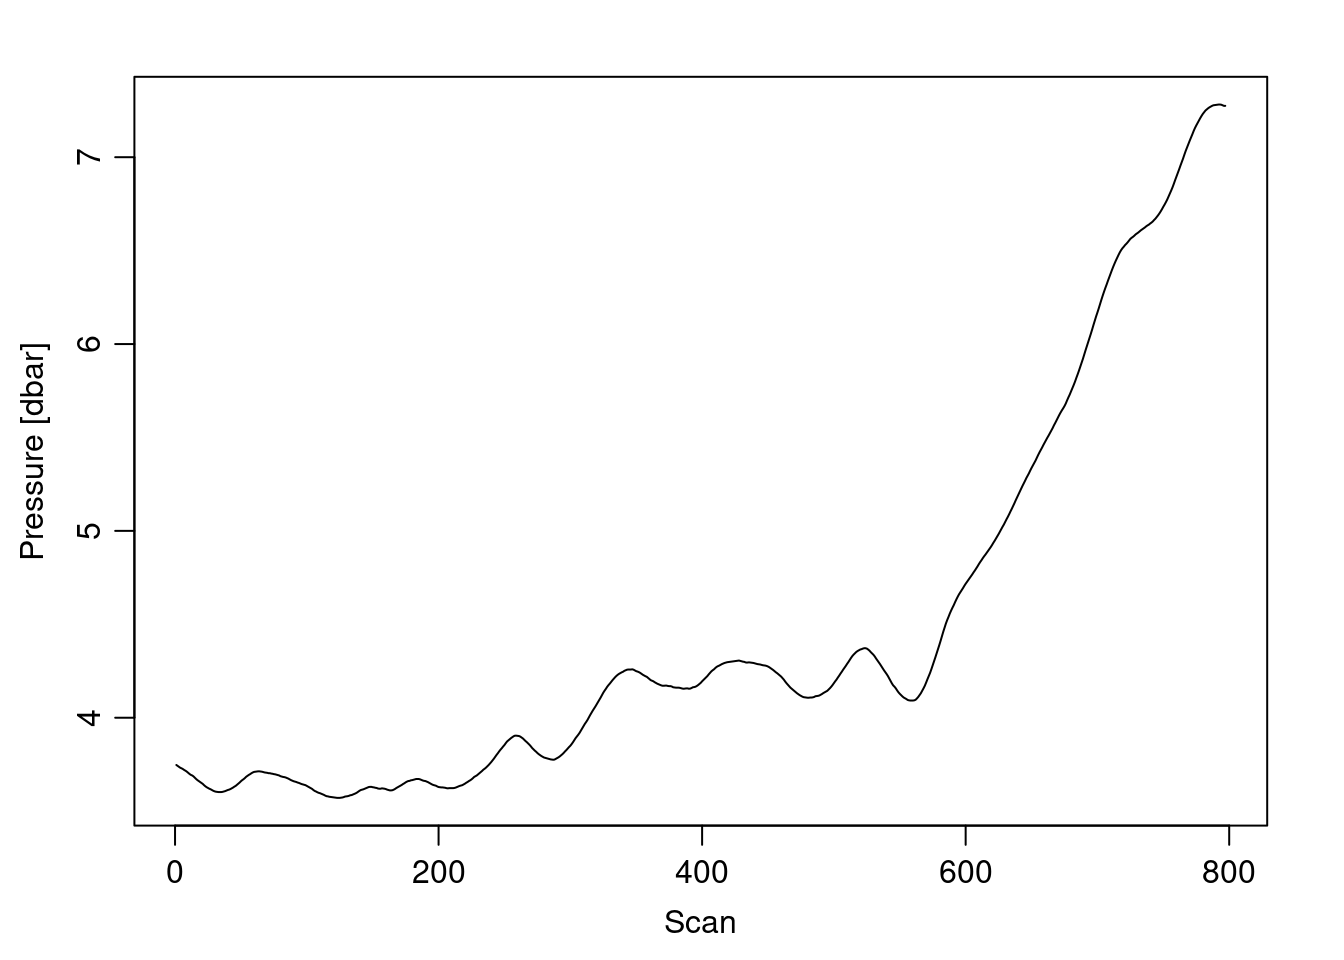
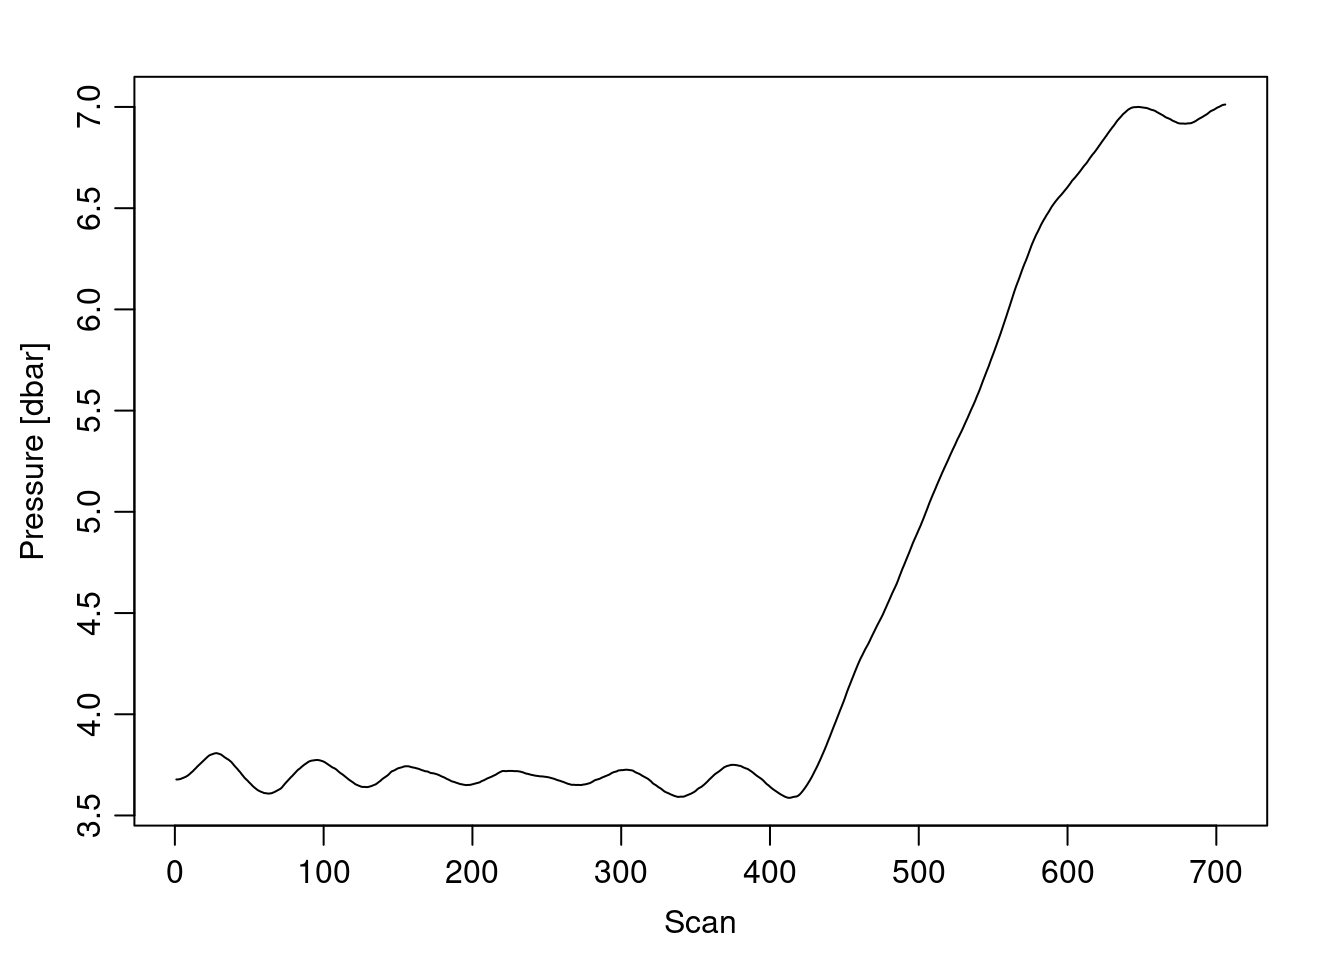
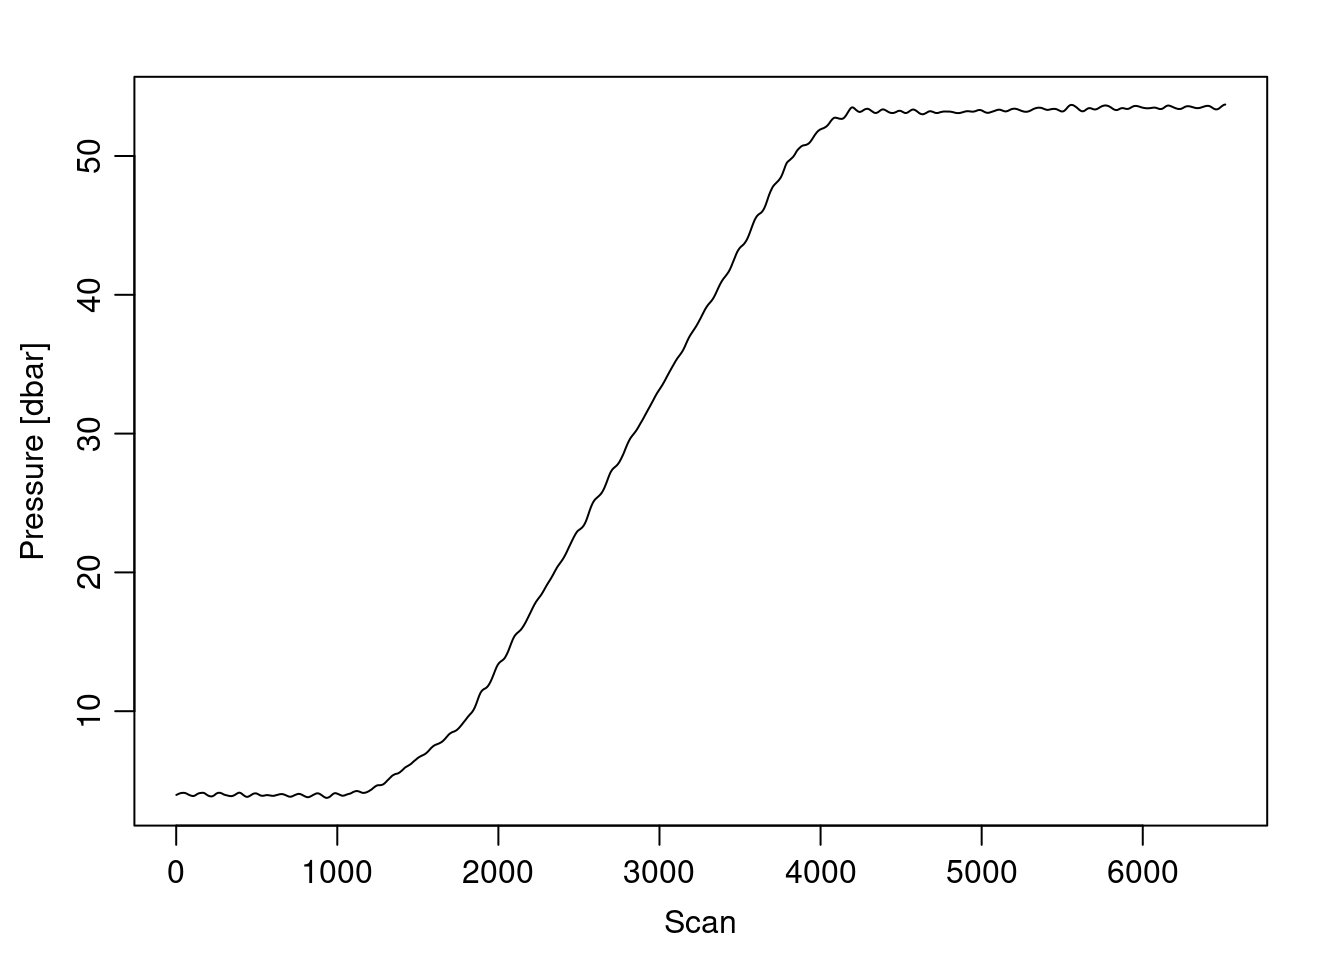
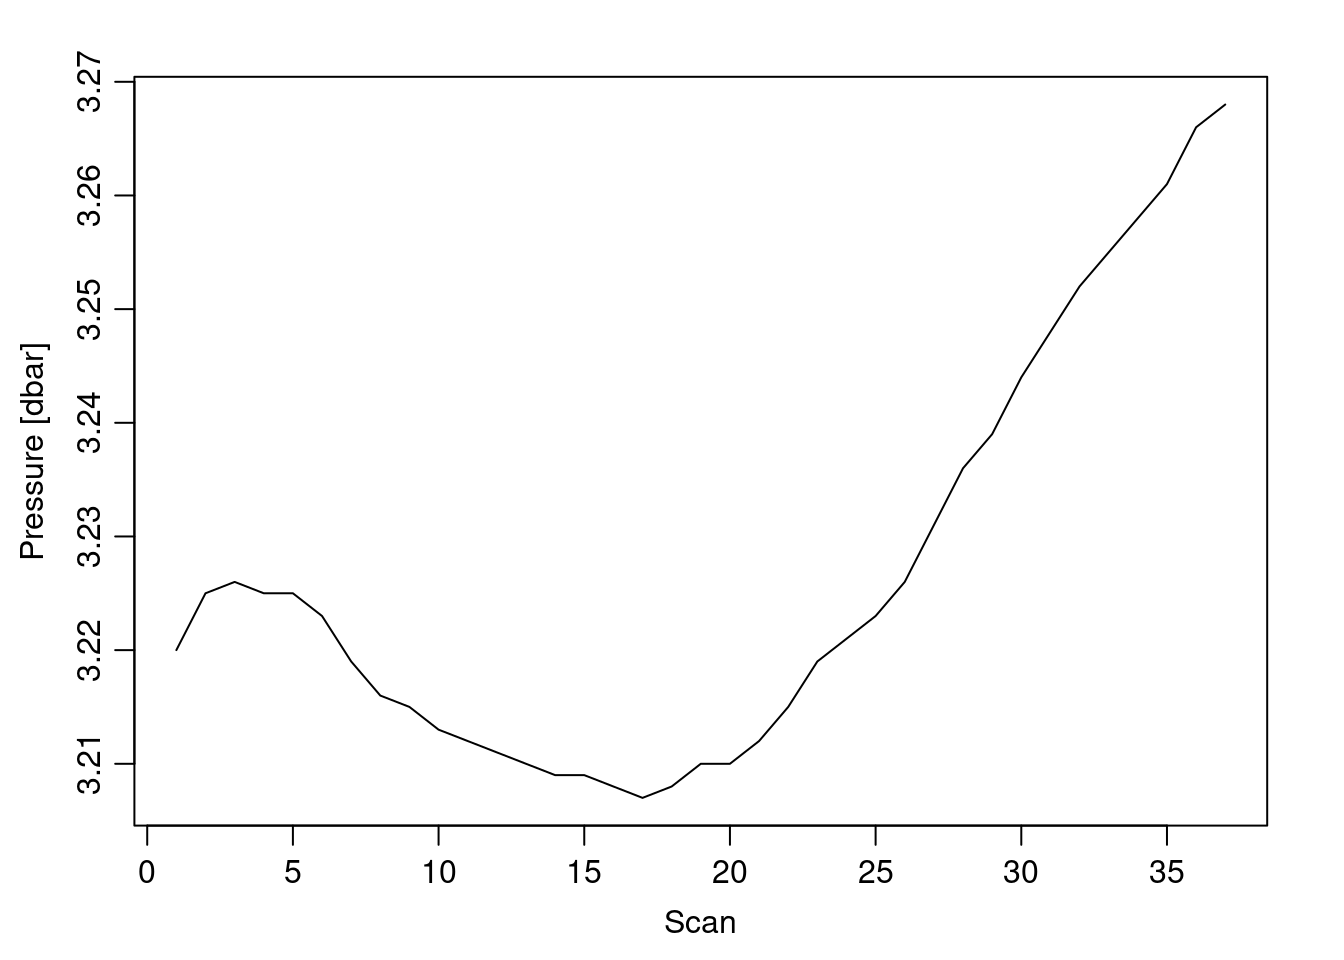
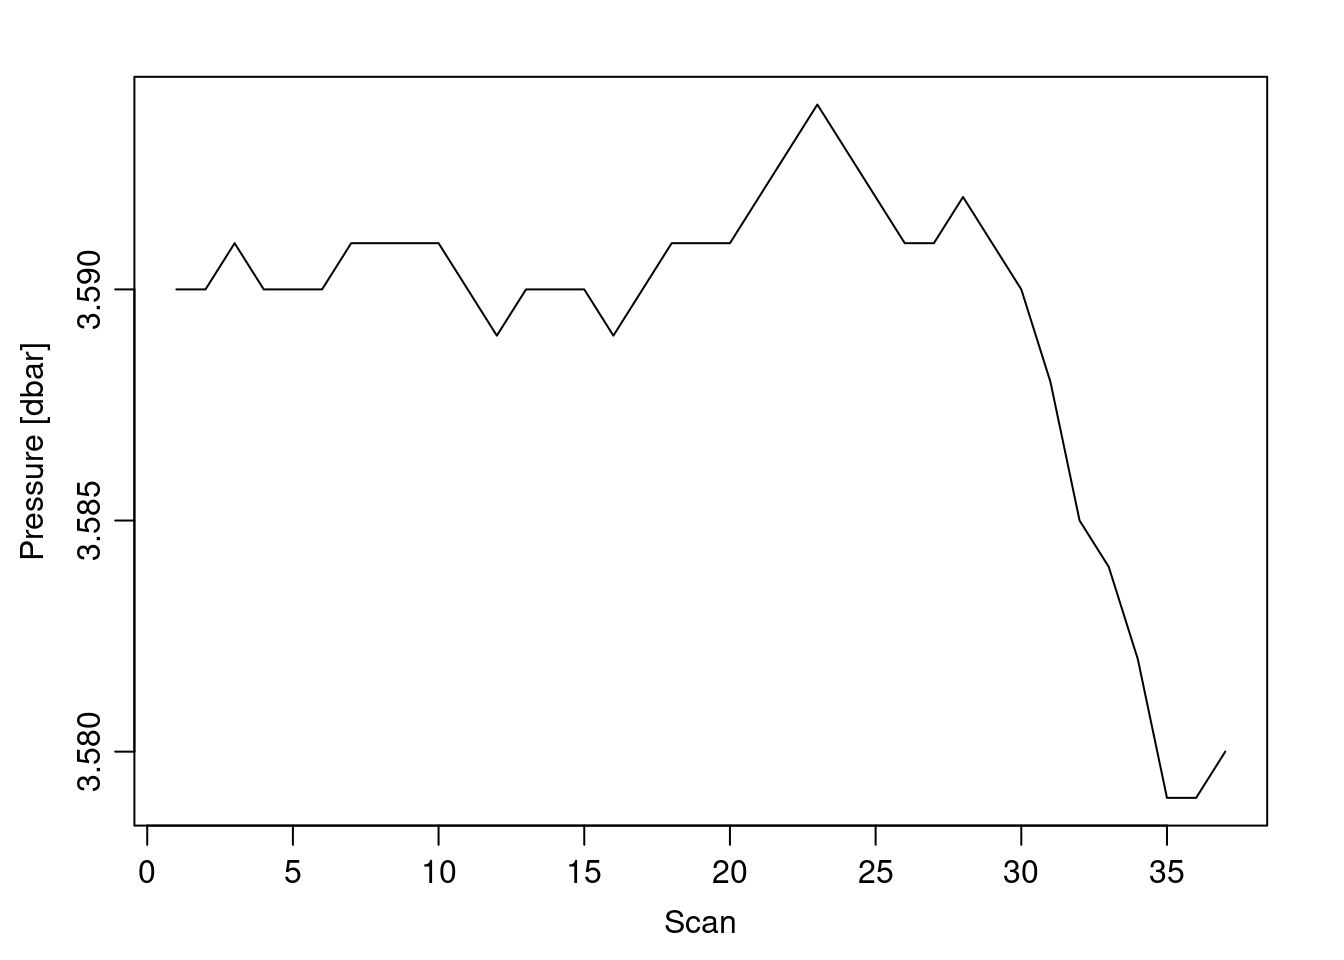
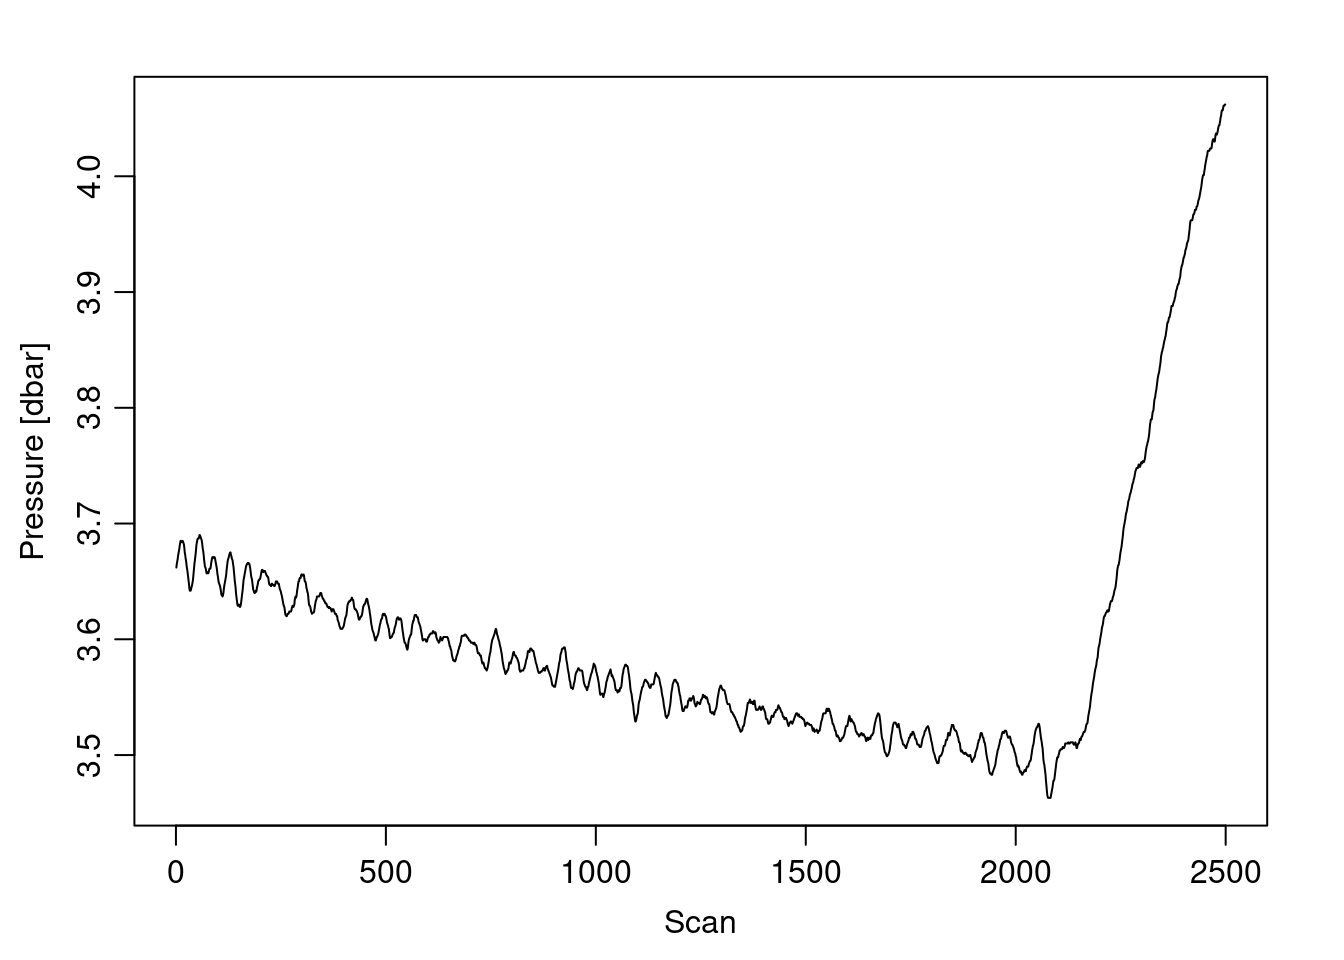
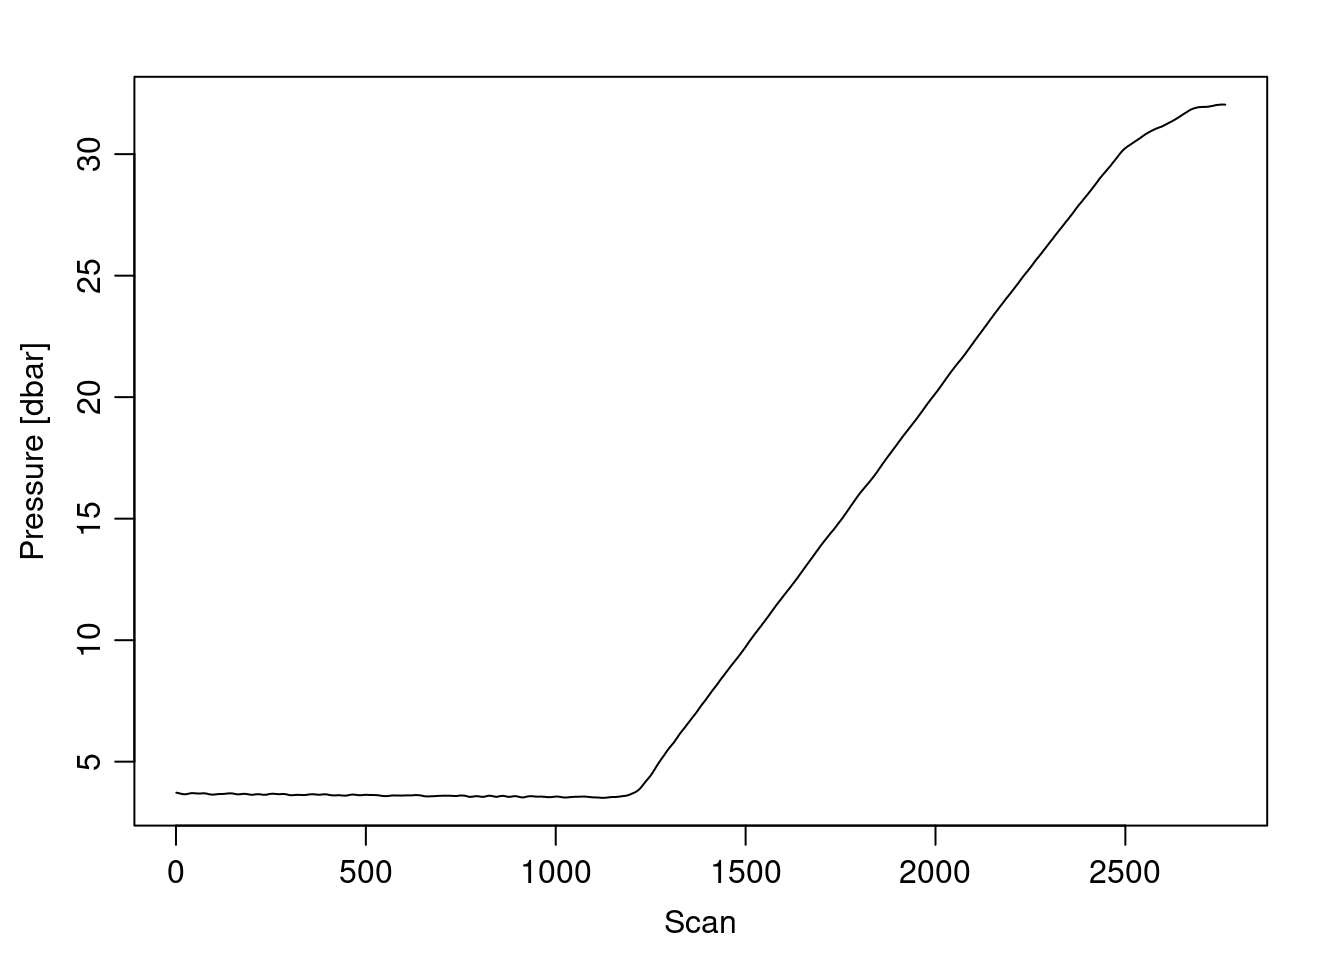
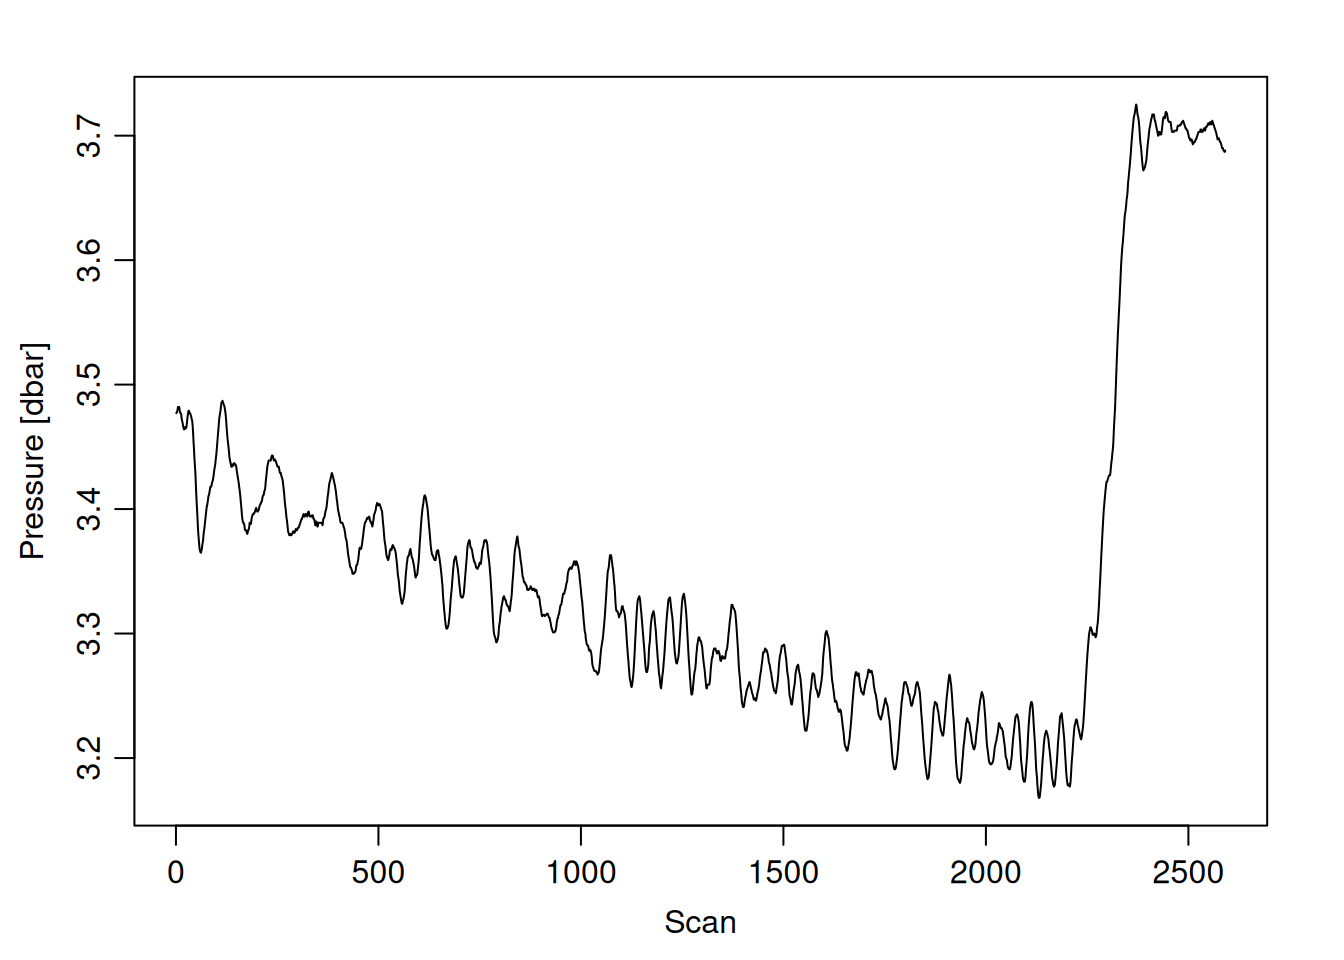
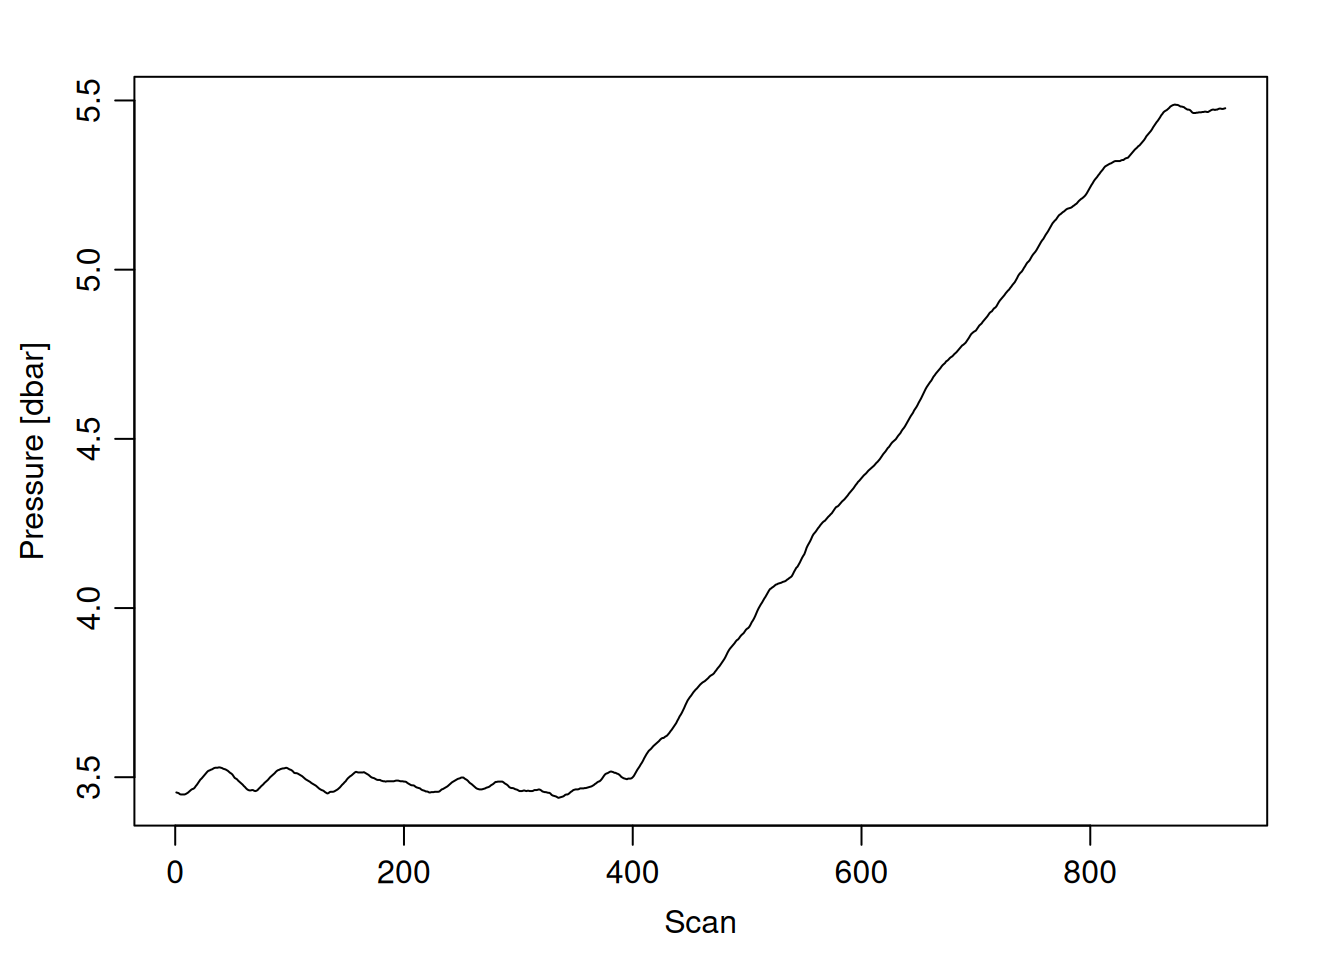
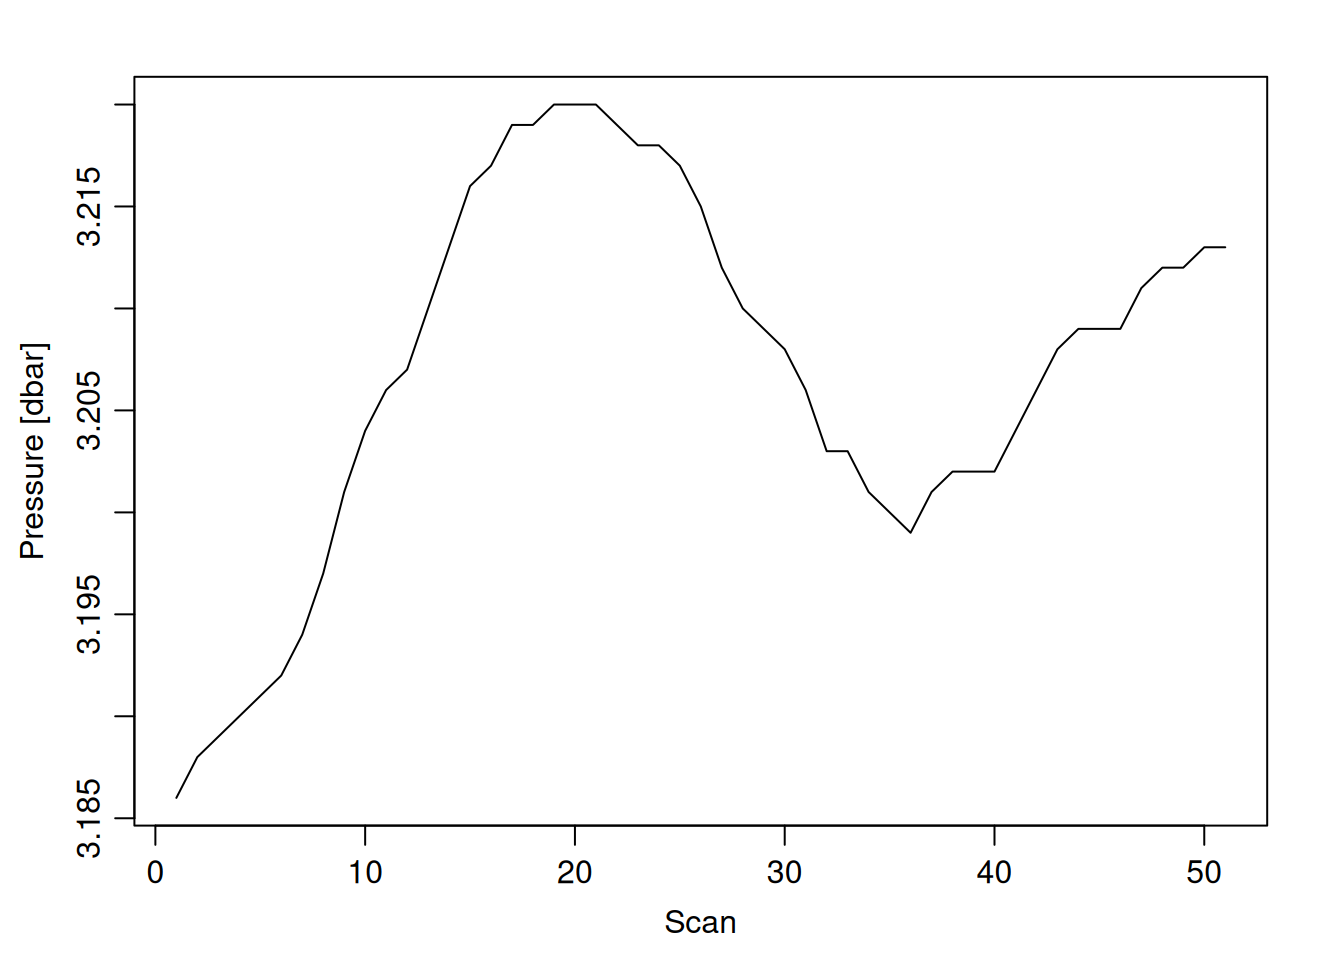
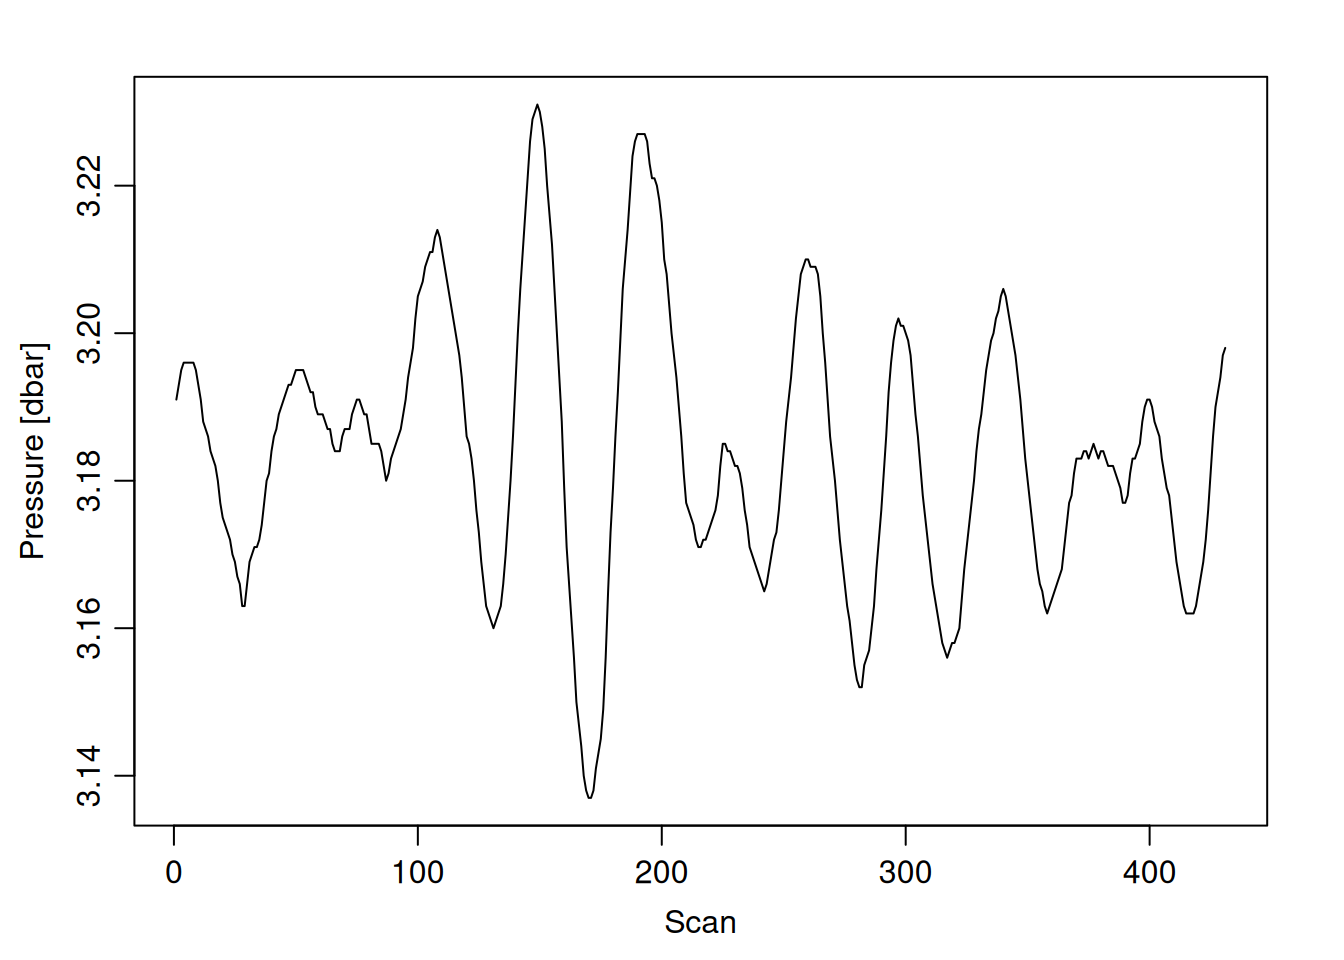
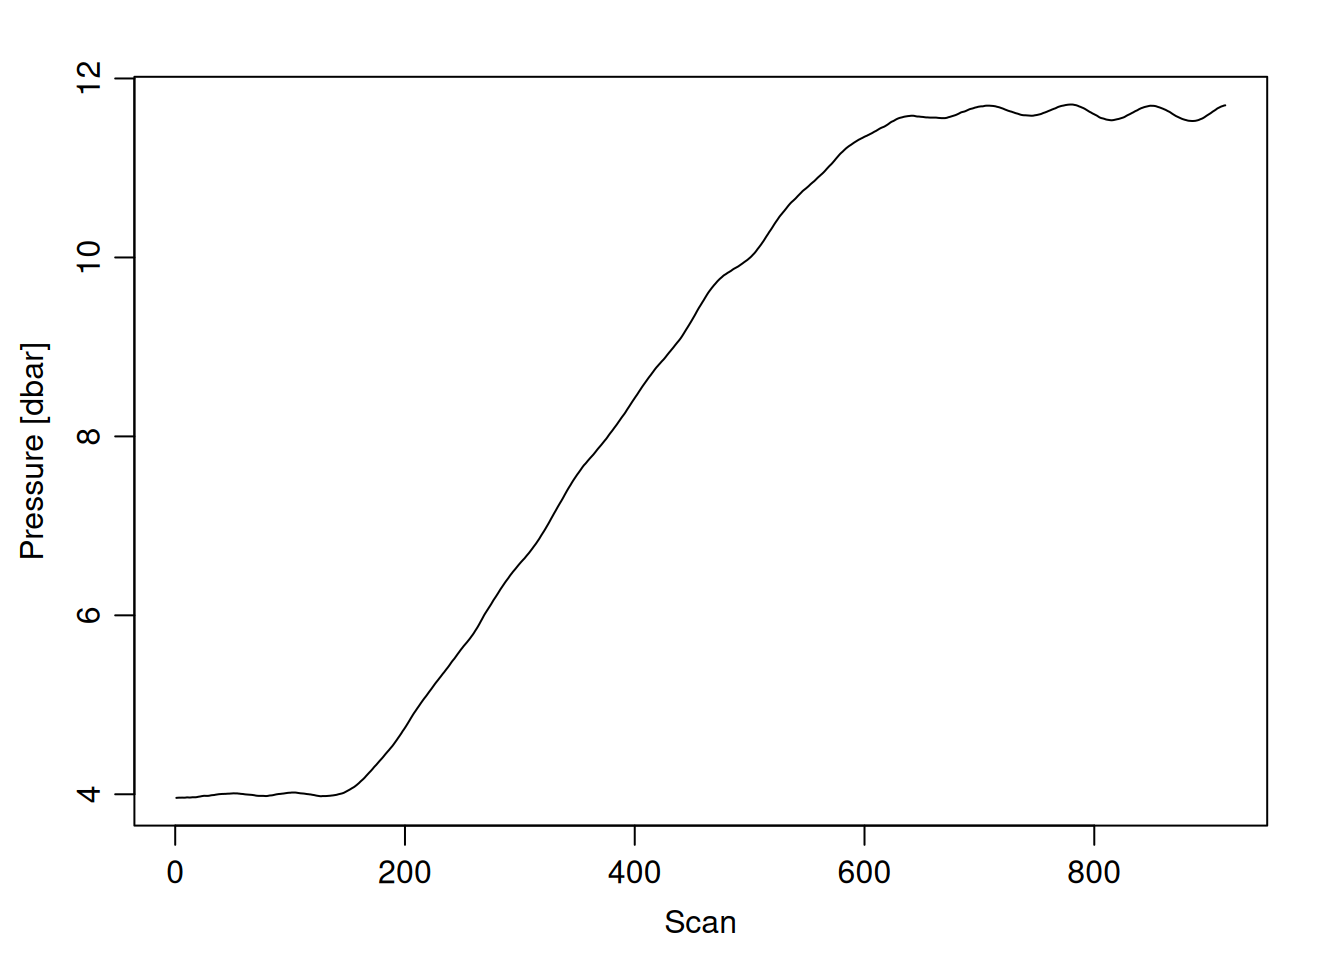
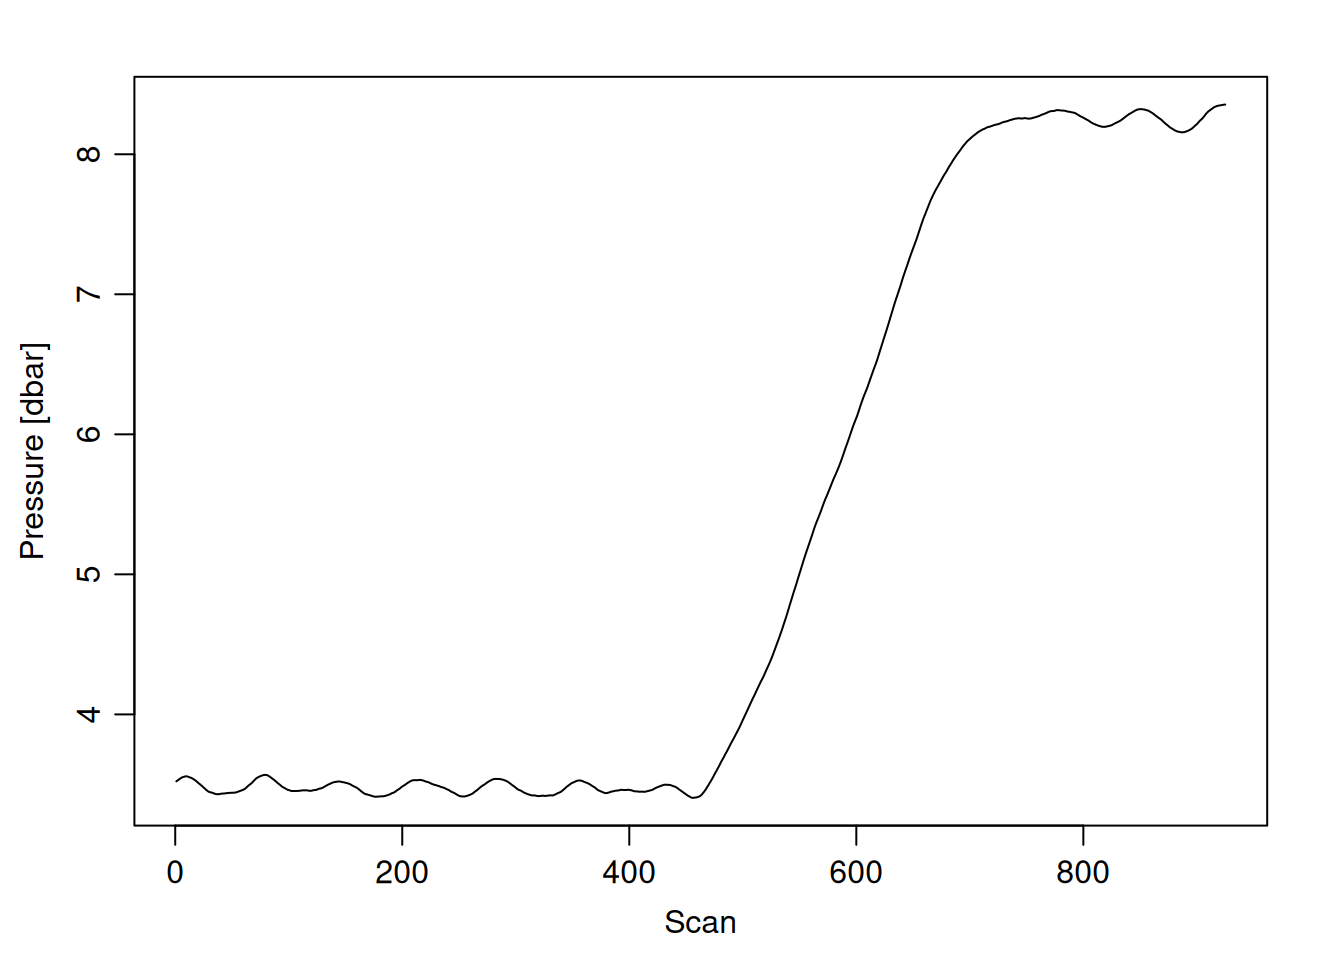
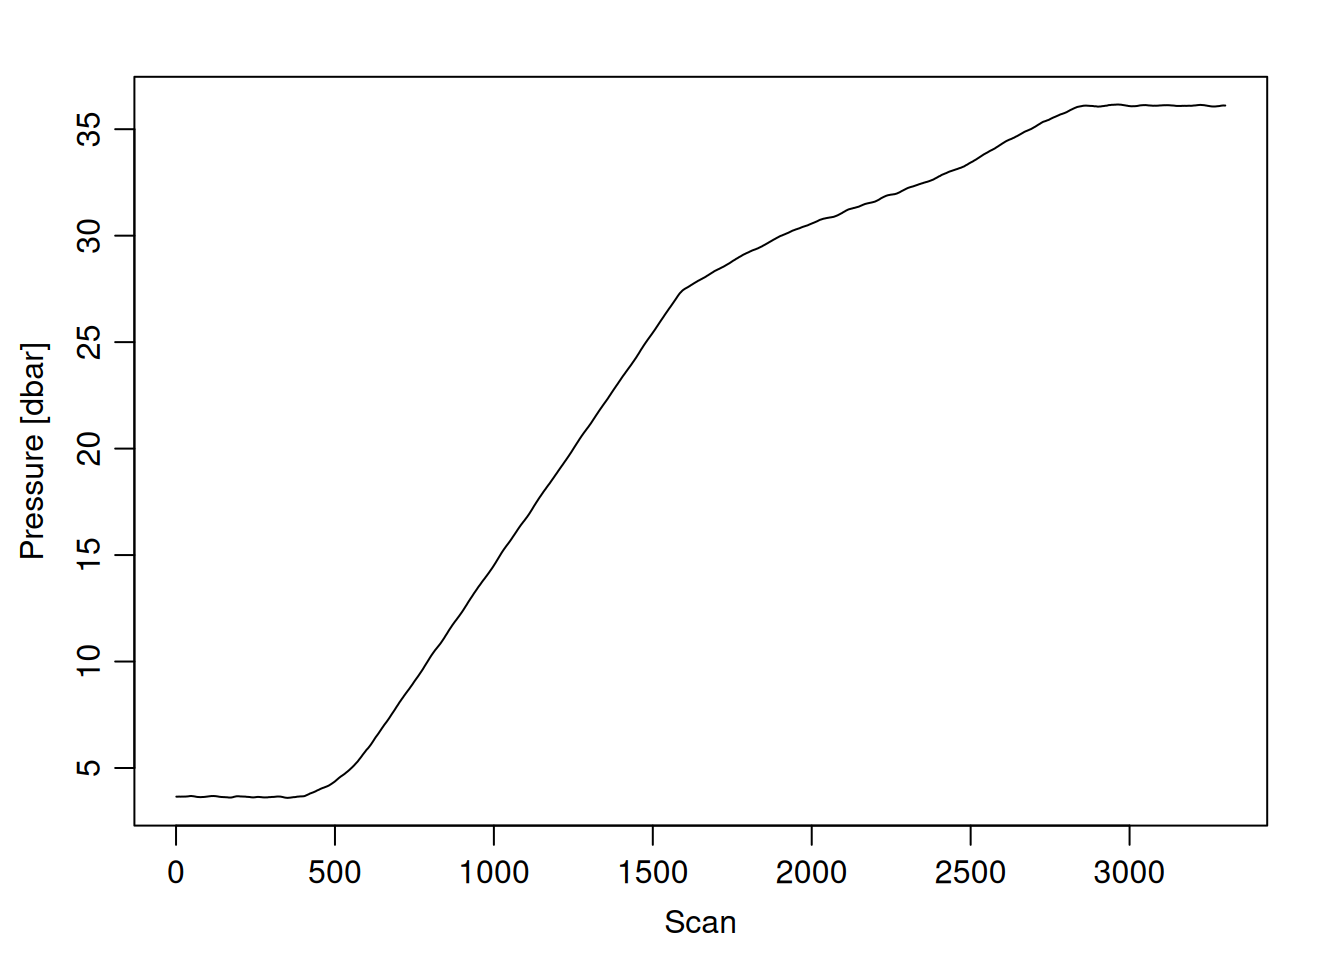
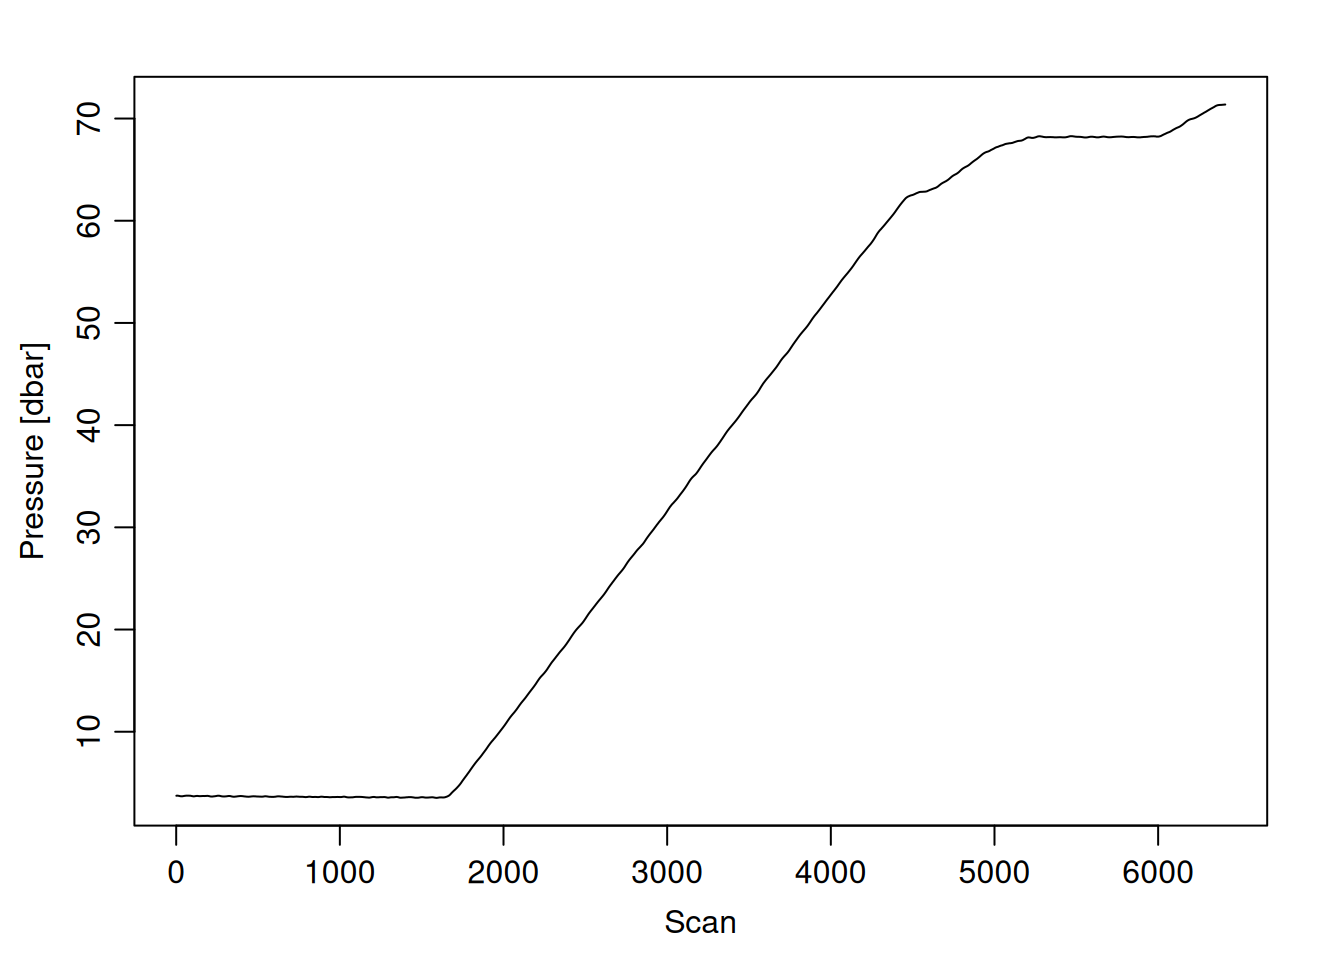
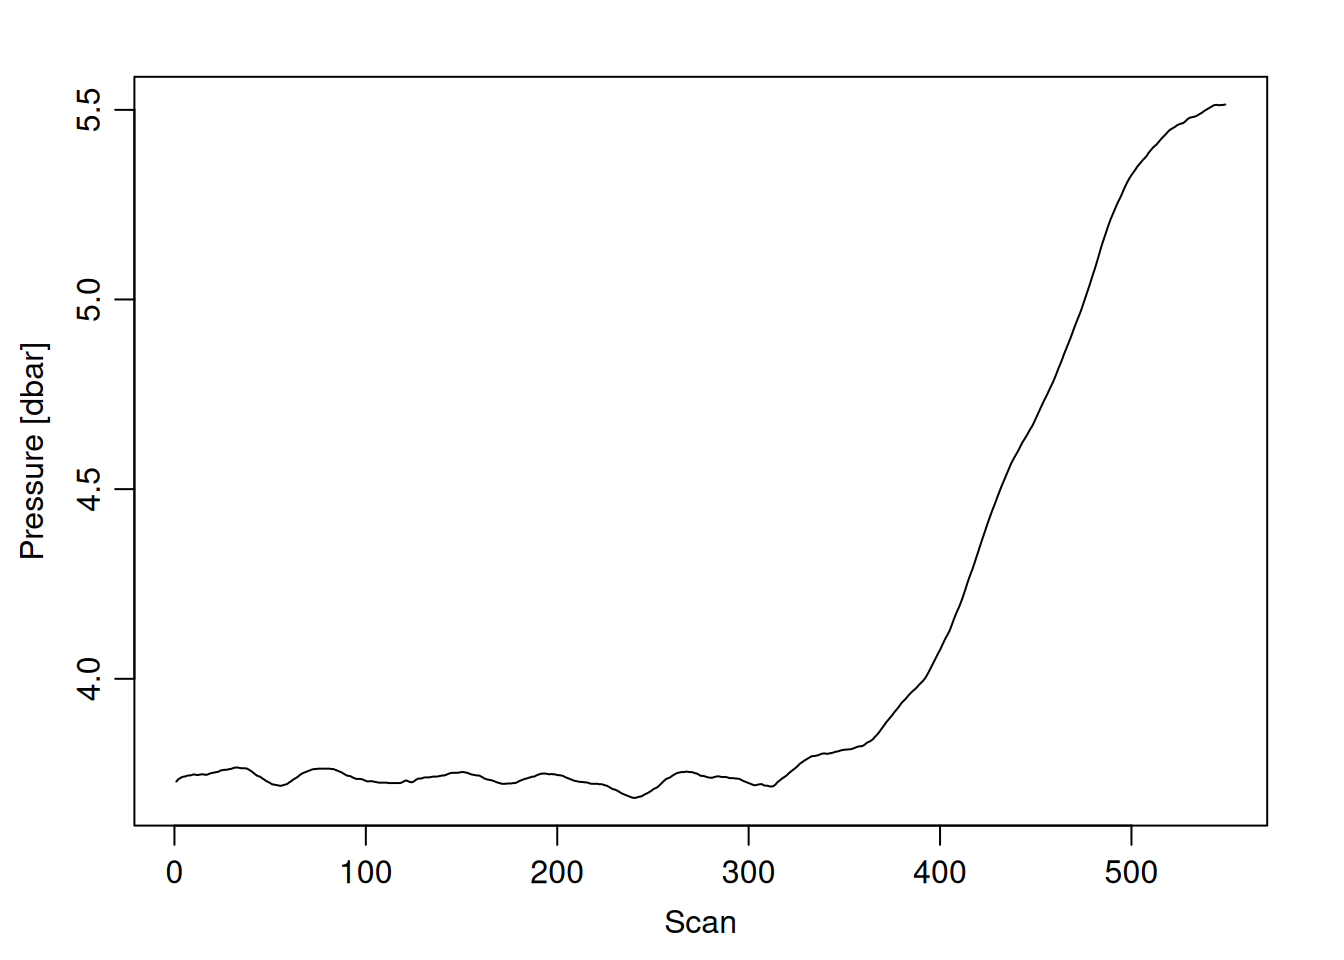
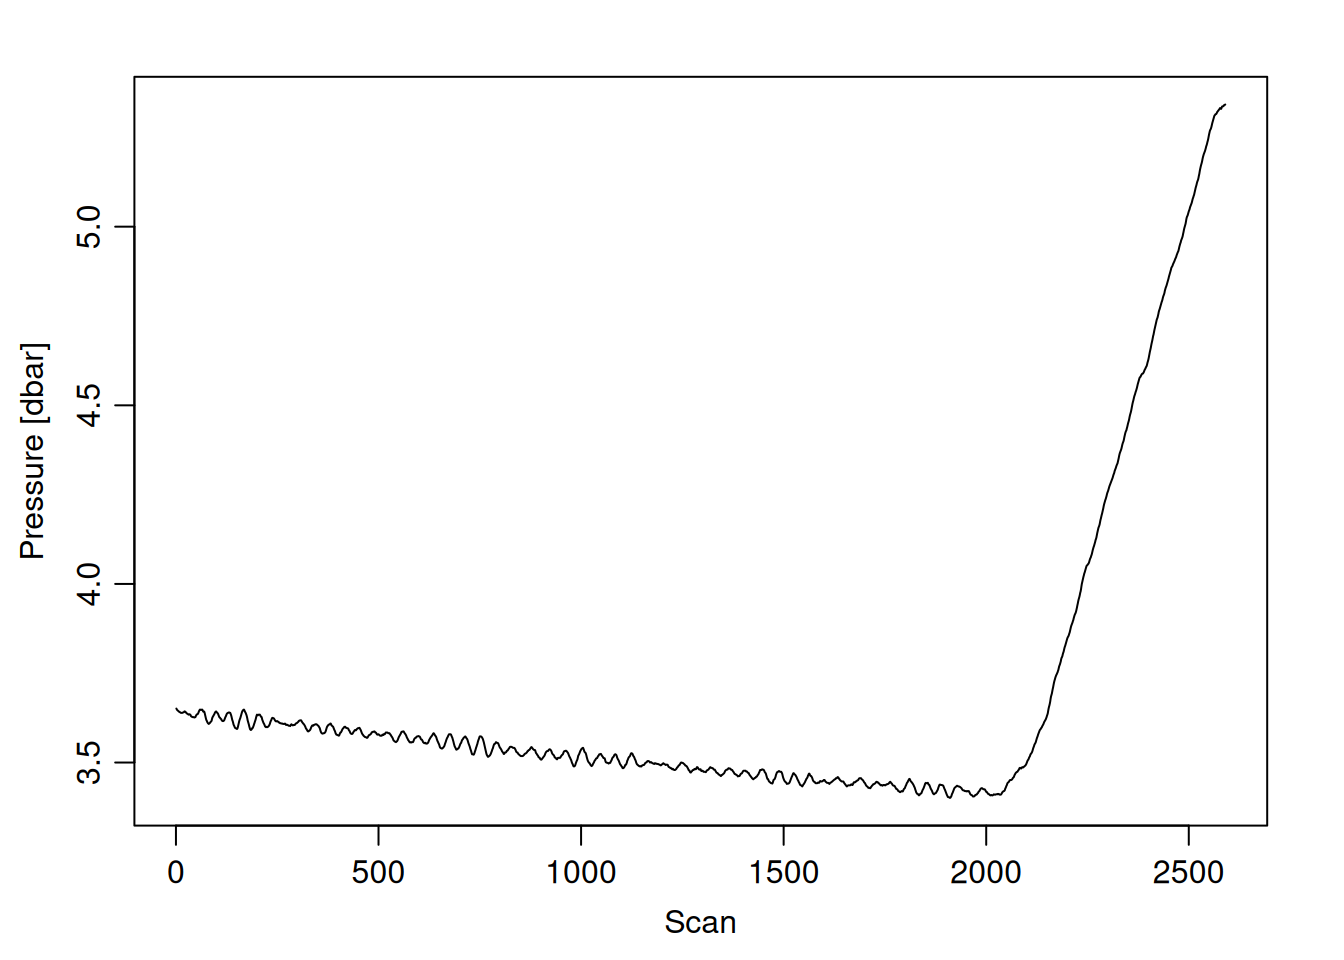
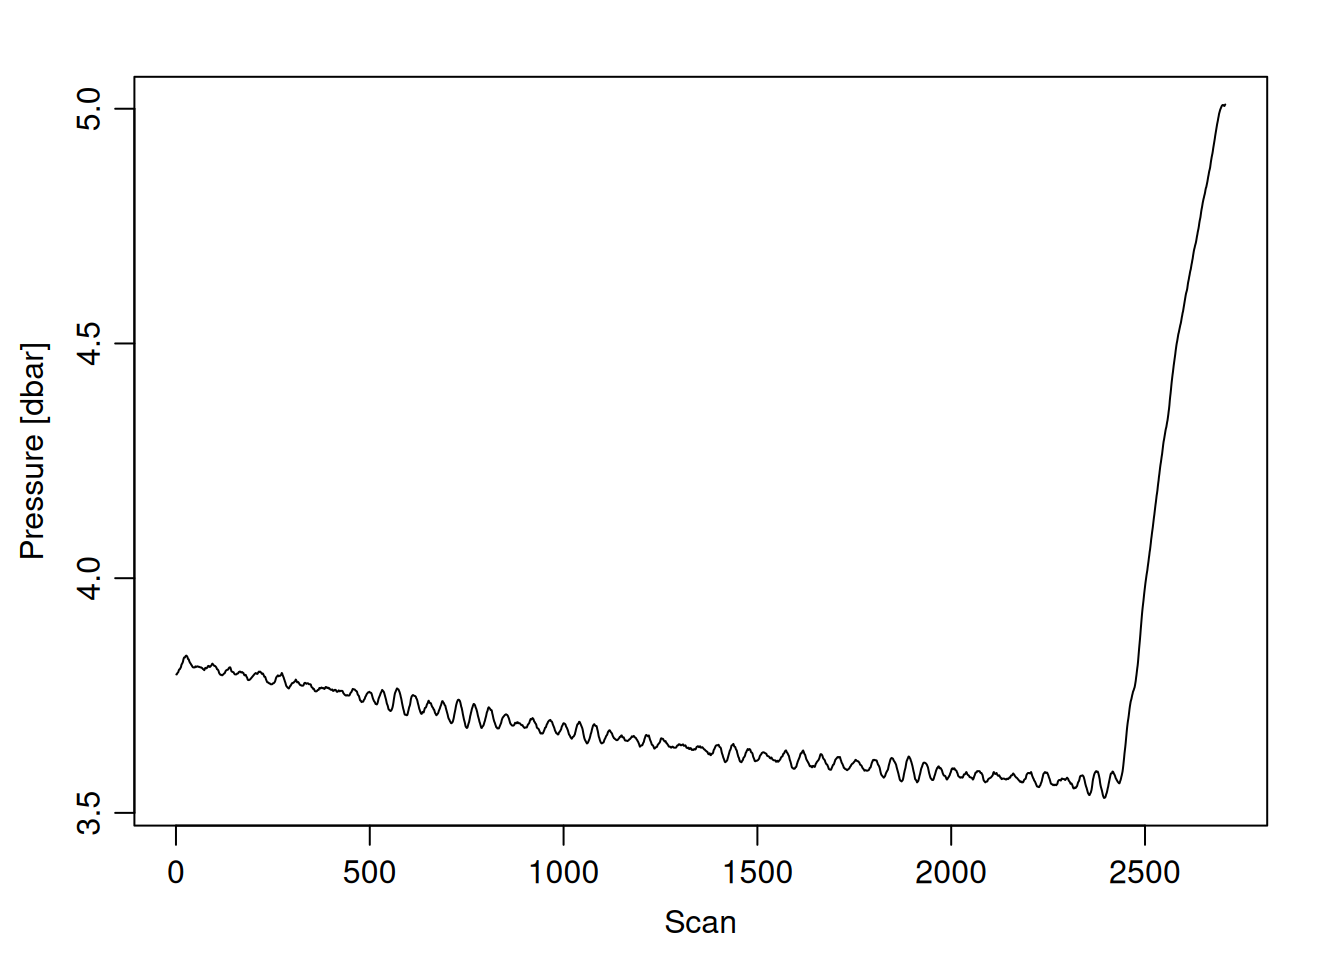
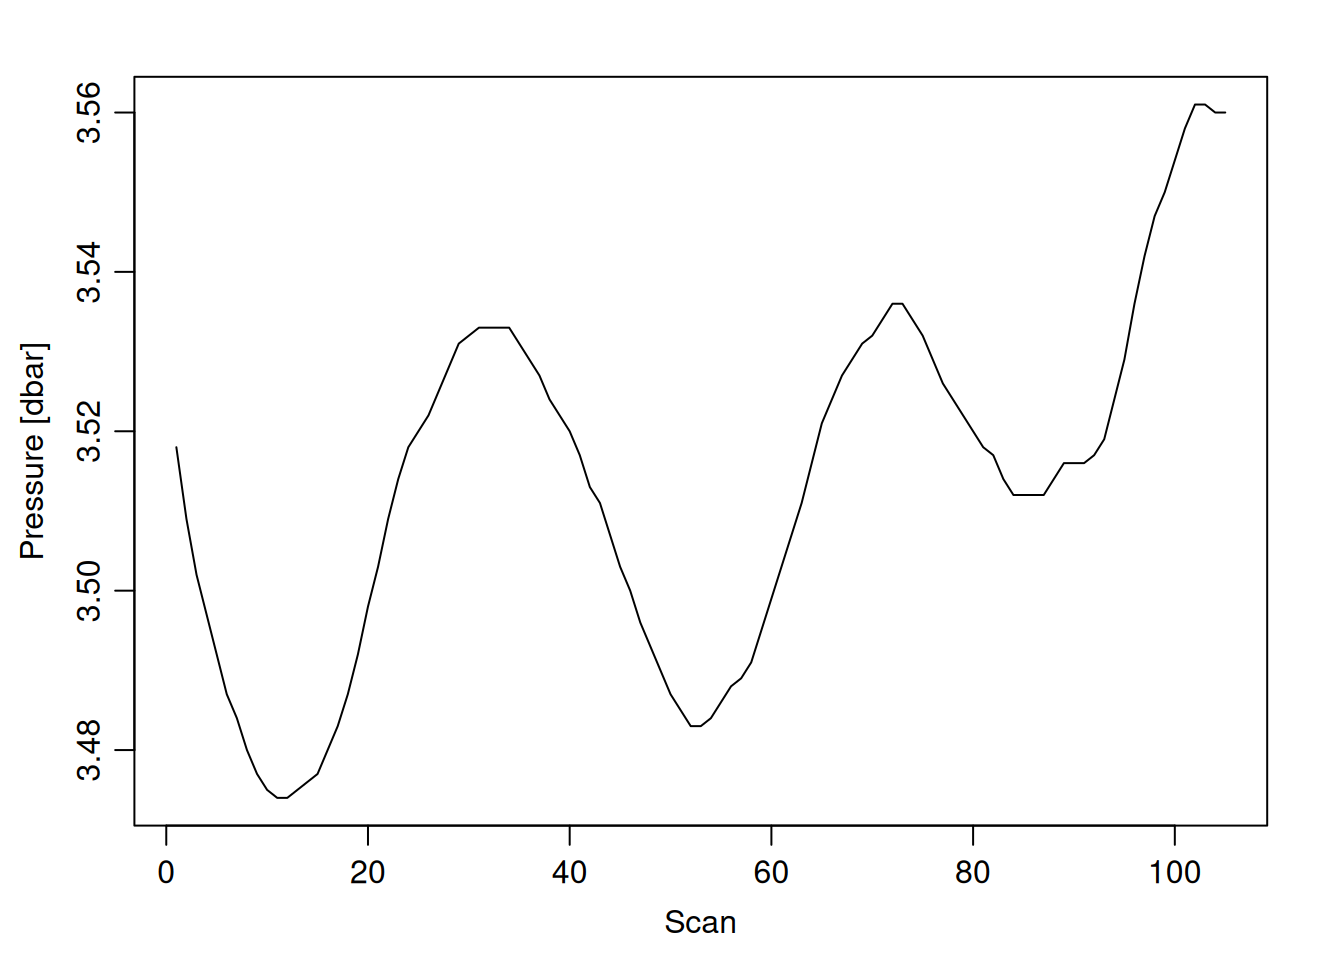
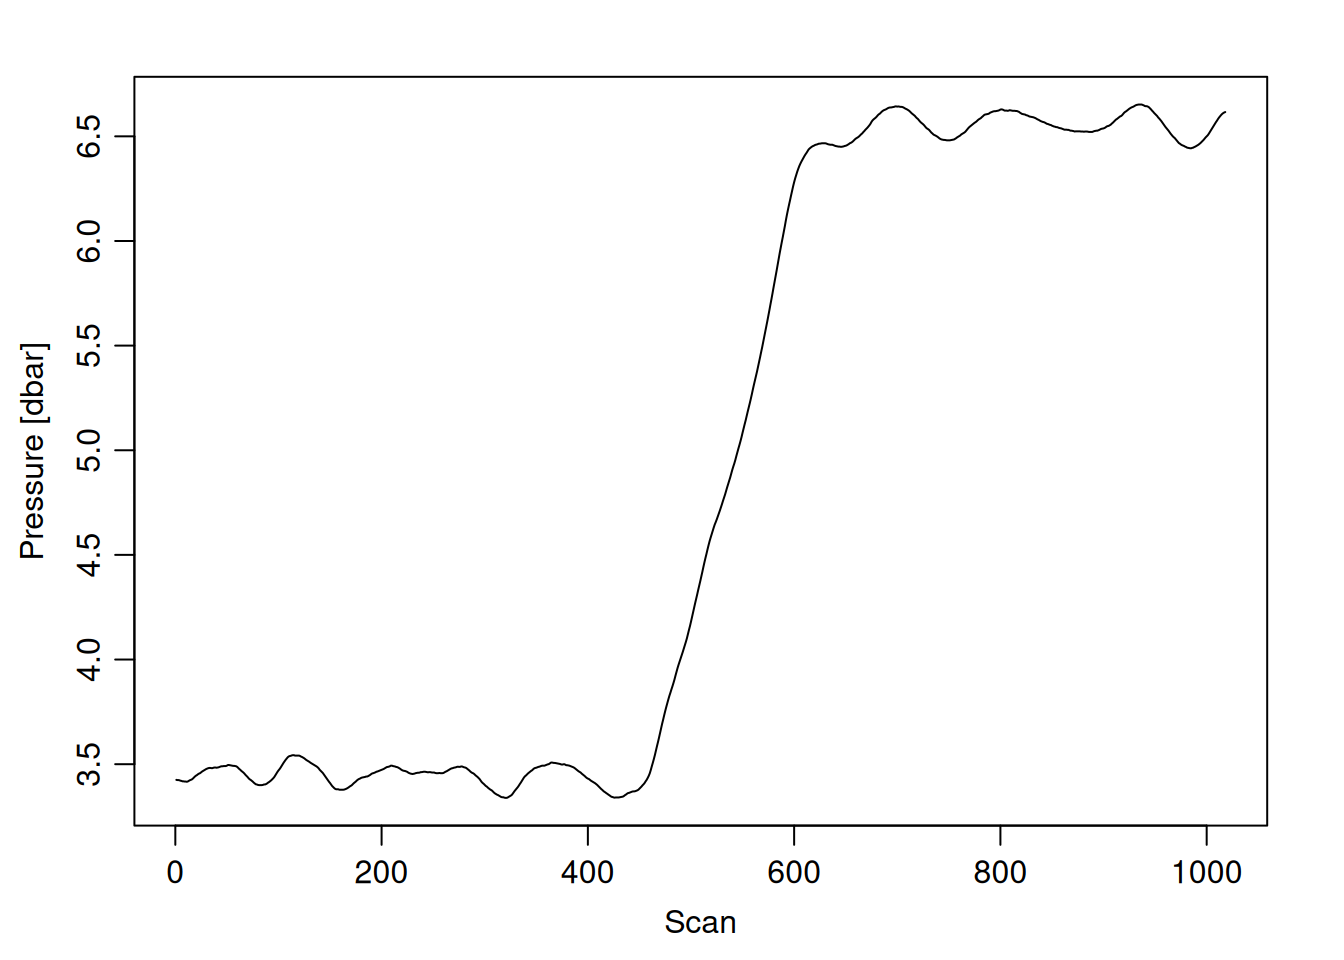
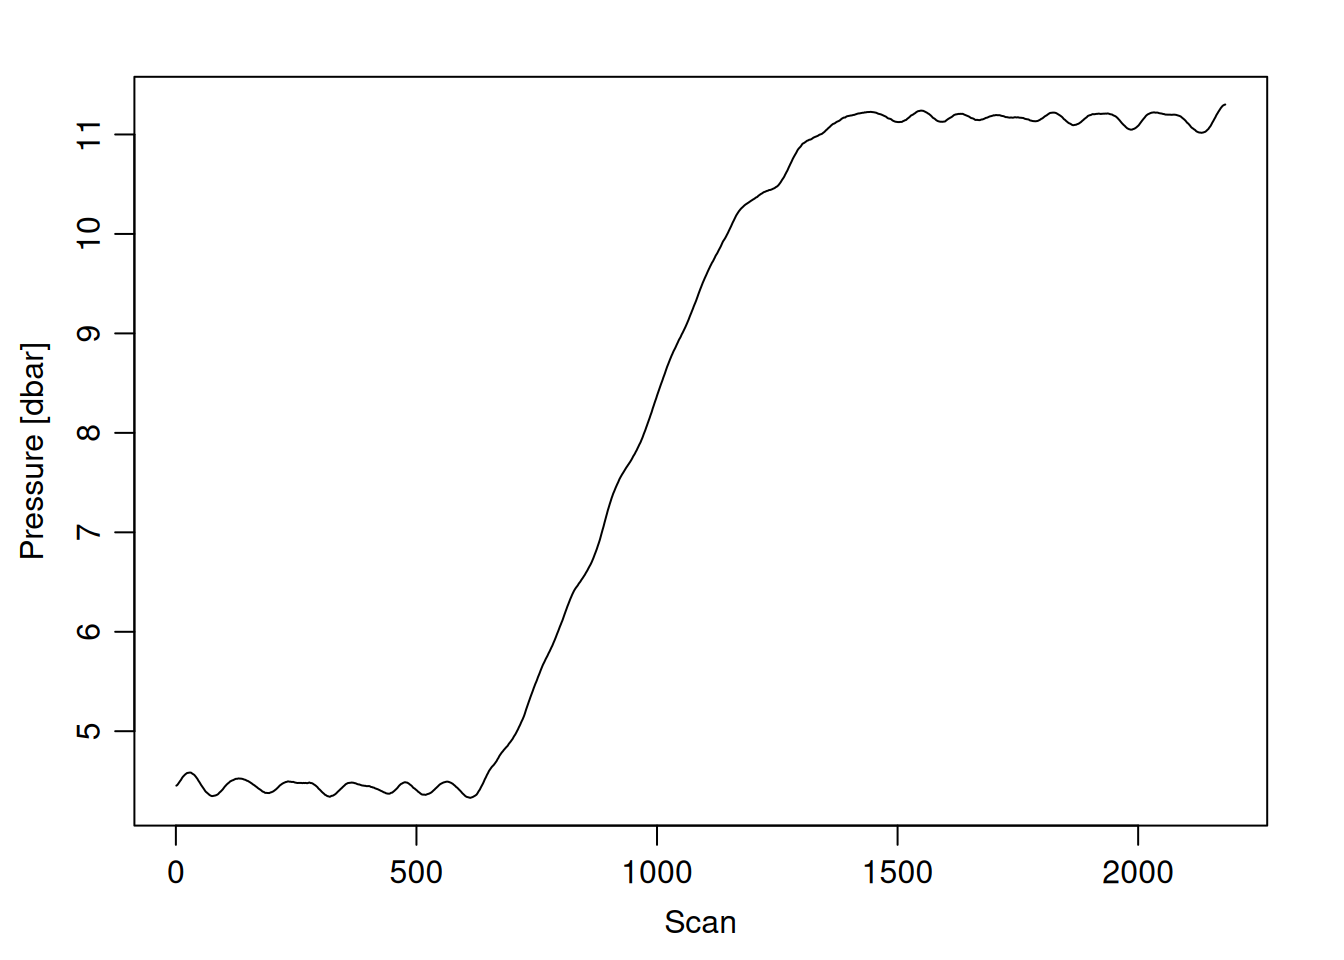
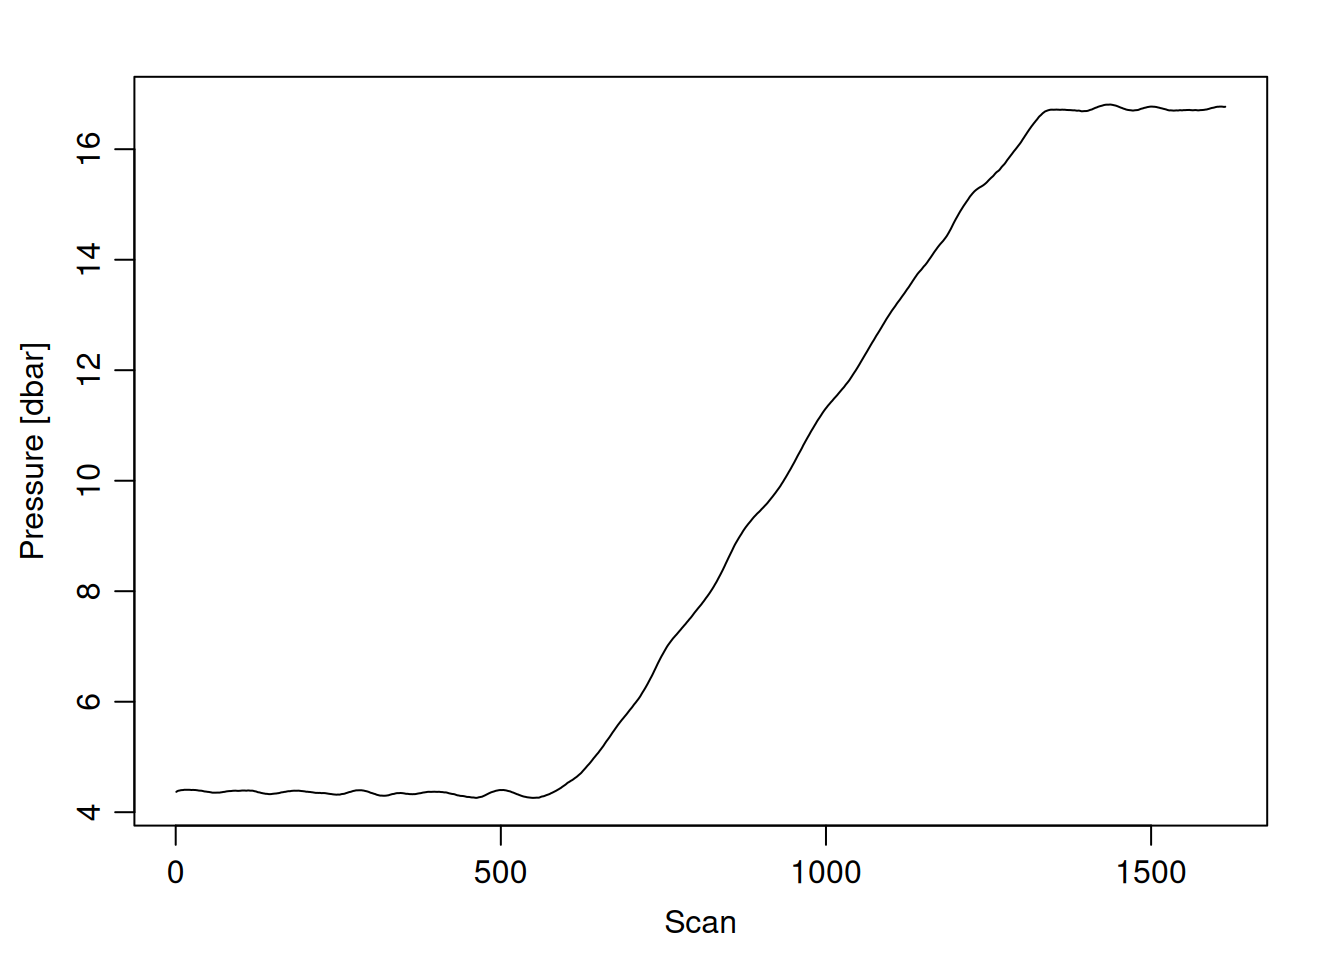
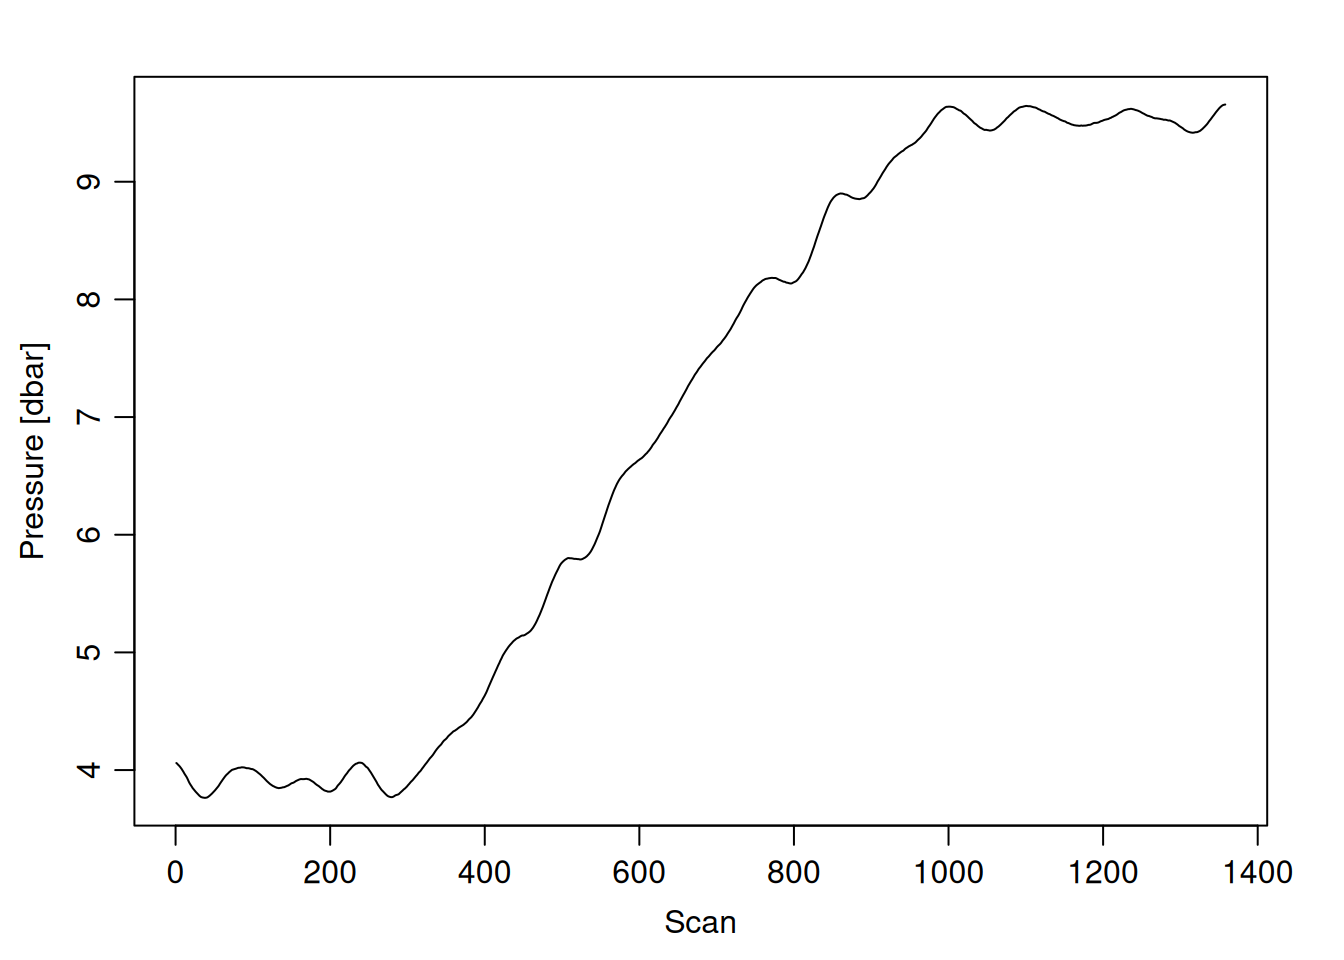
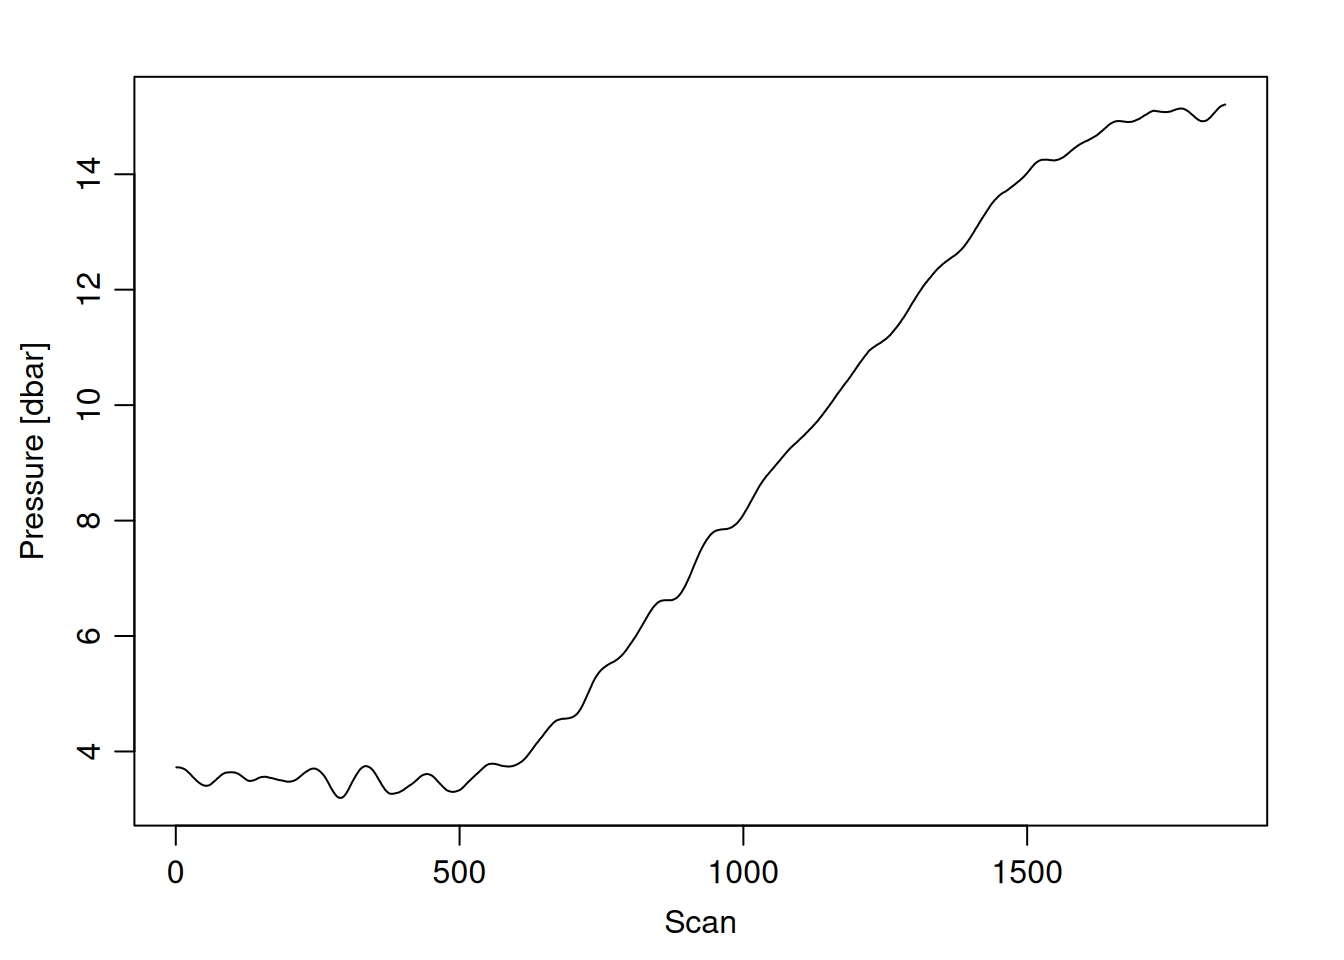
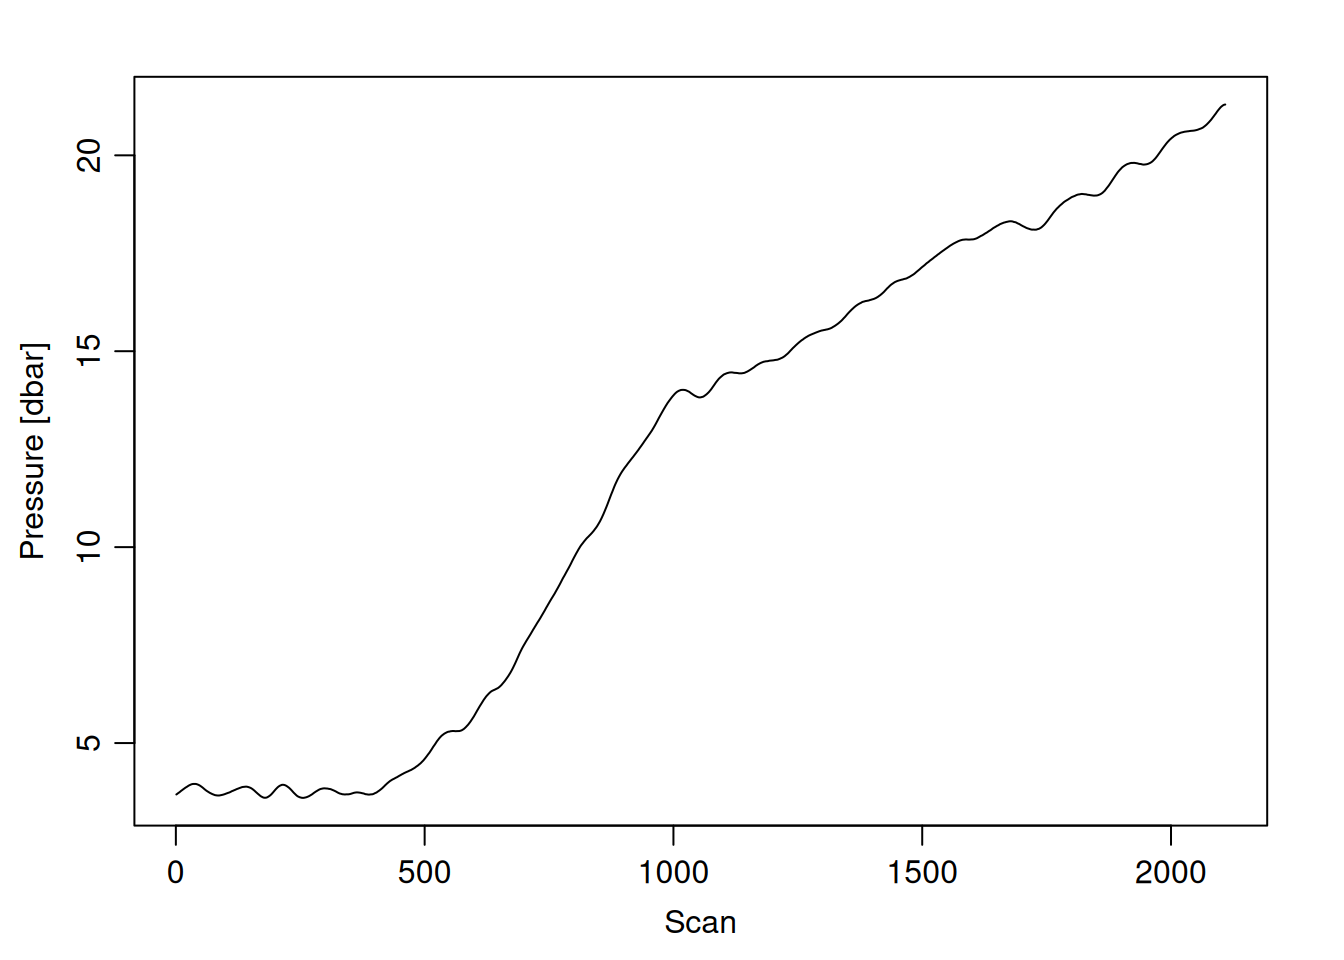
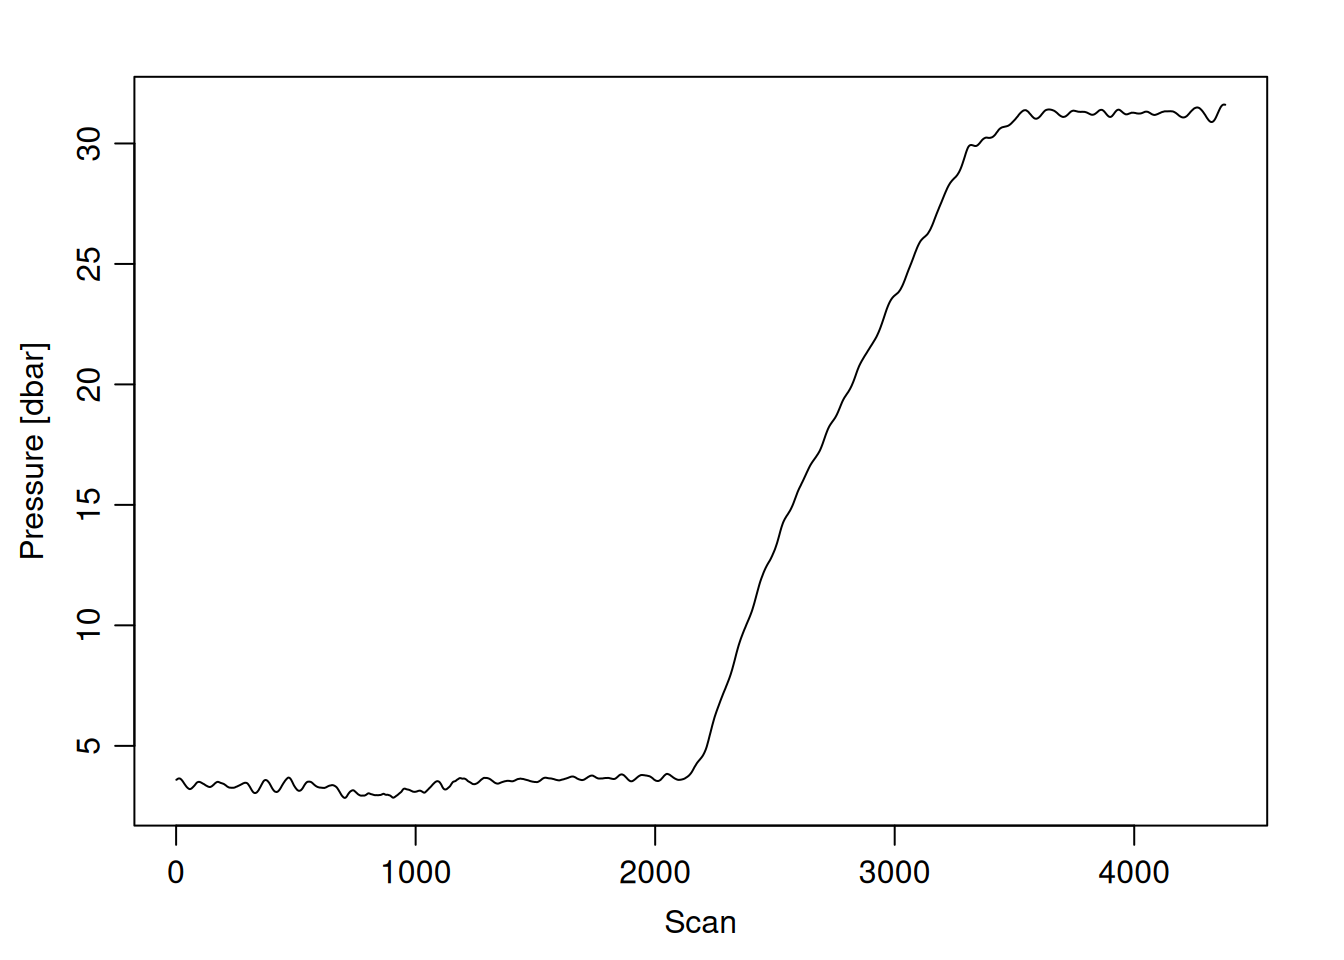
for (i inseq(ctd_FK)){ cast <- ctd_FK[[i]] # 1 is selecting only the first sublist# print(i)print(glue("=== station: {cast@metadata$station[1]}"))print(glue("# scans: {length(cast@data$scan)}"))plotScan(cast)}
=== station: 1
# scans: 5369
=== station: 10
# scans: 1998
=== station: 11
# scans: 1886
=== station: 12
# scans: 2960
=== station: 13
# scans: 1628
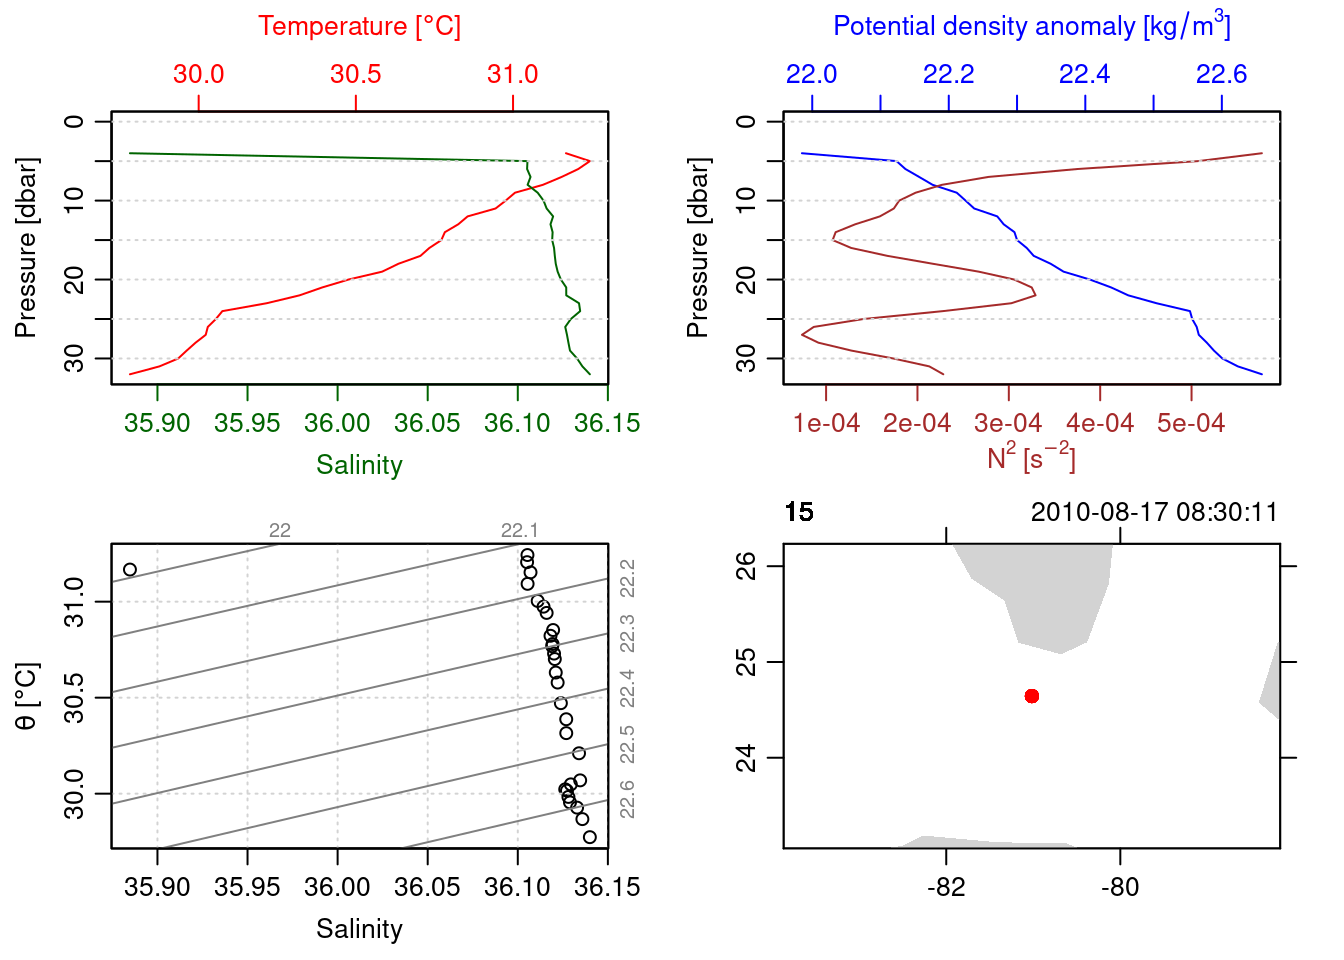
=== station: 15
# scans: 4617
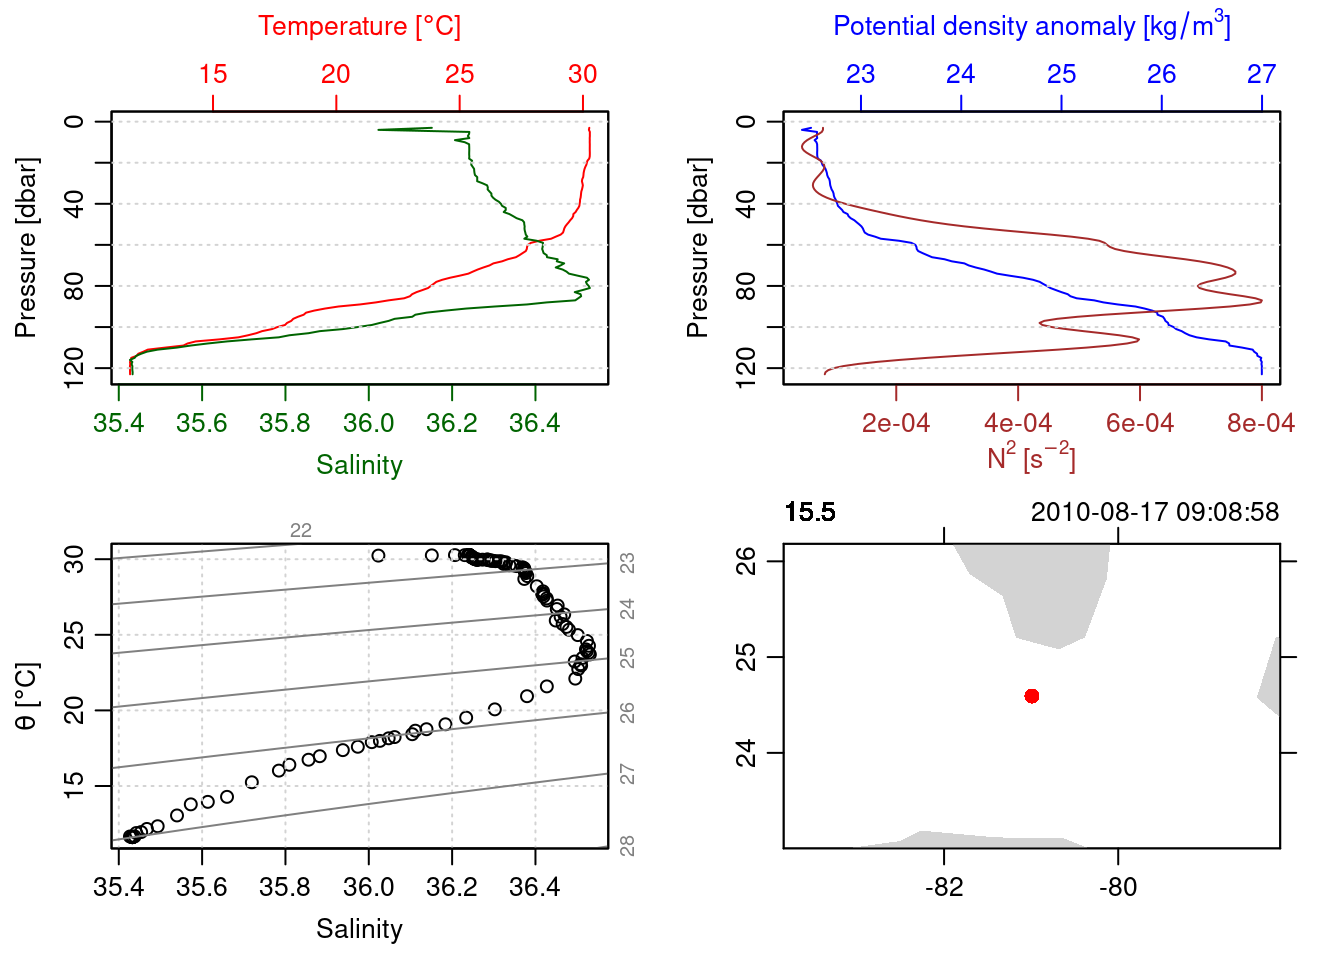
=== station: 15.5
# scans: 7497
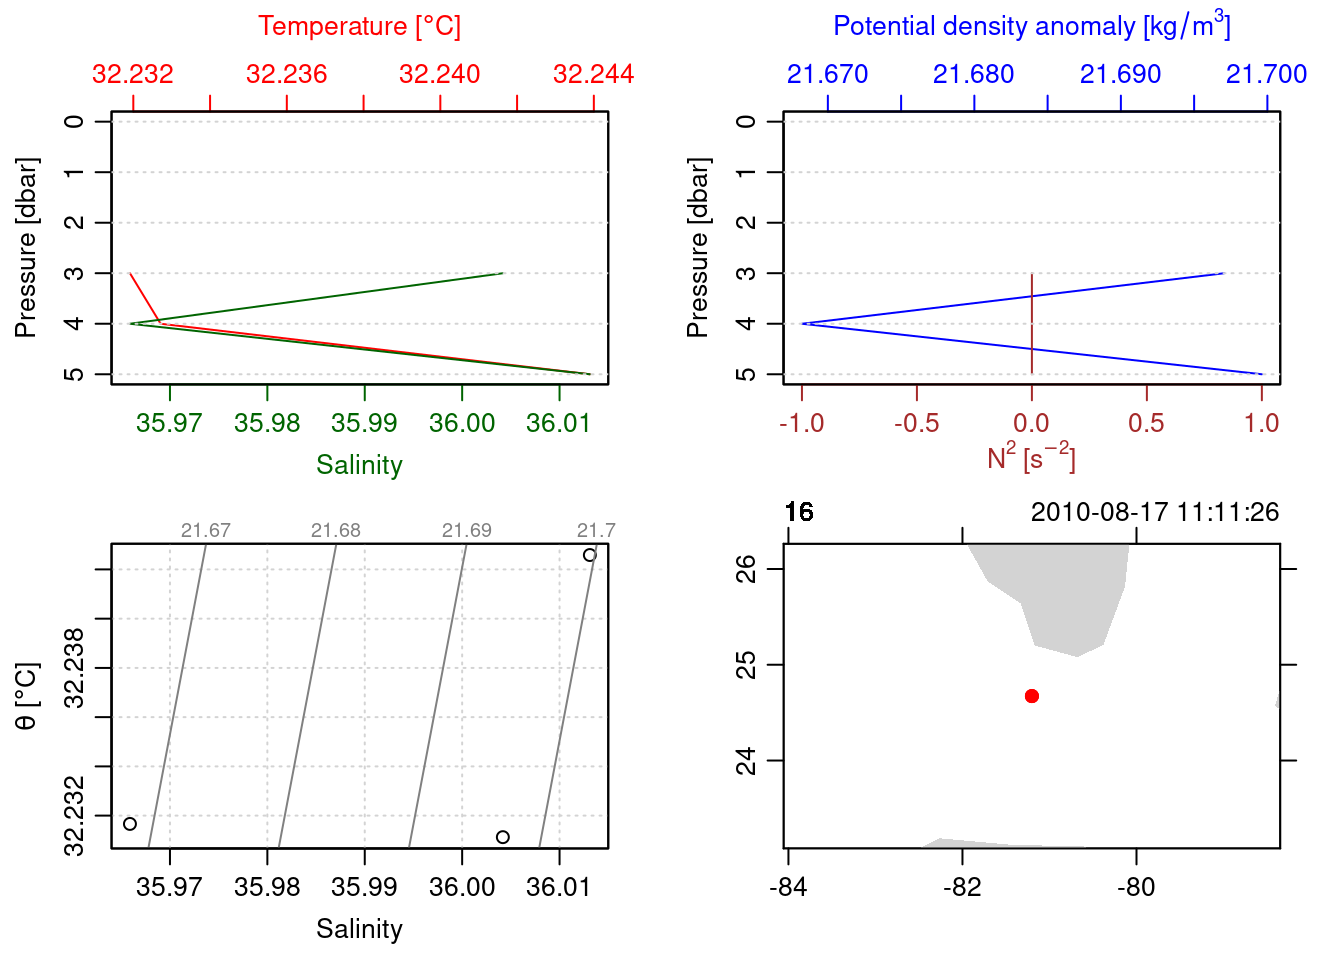
=== station: 16
# scans: 2304
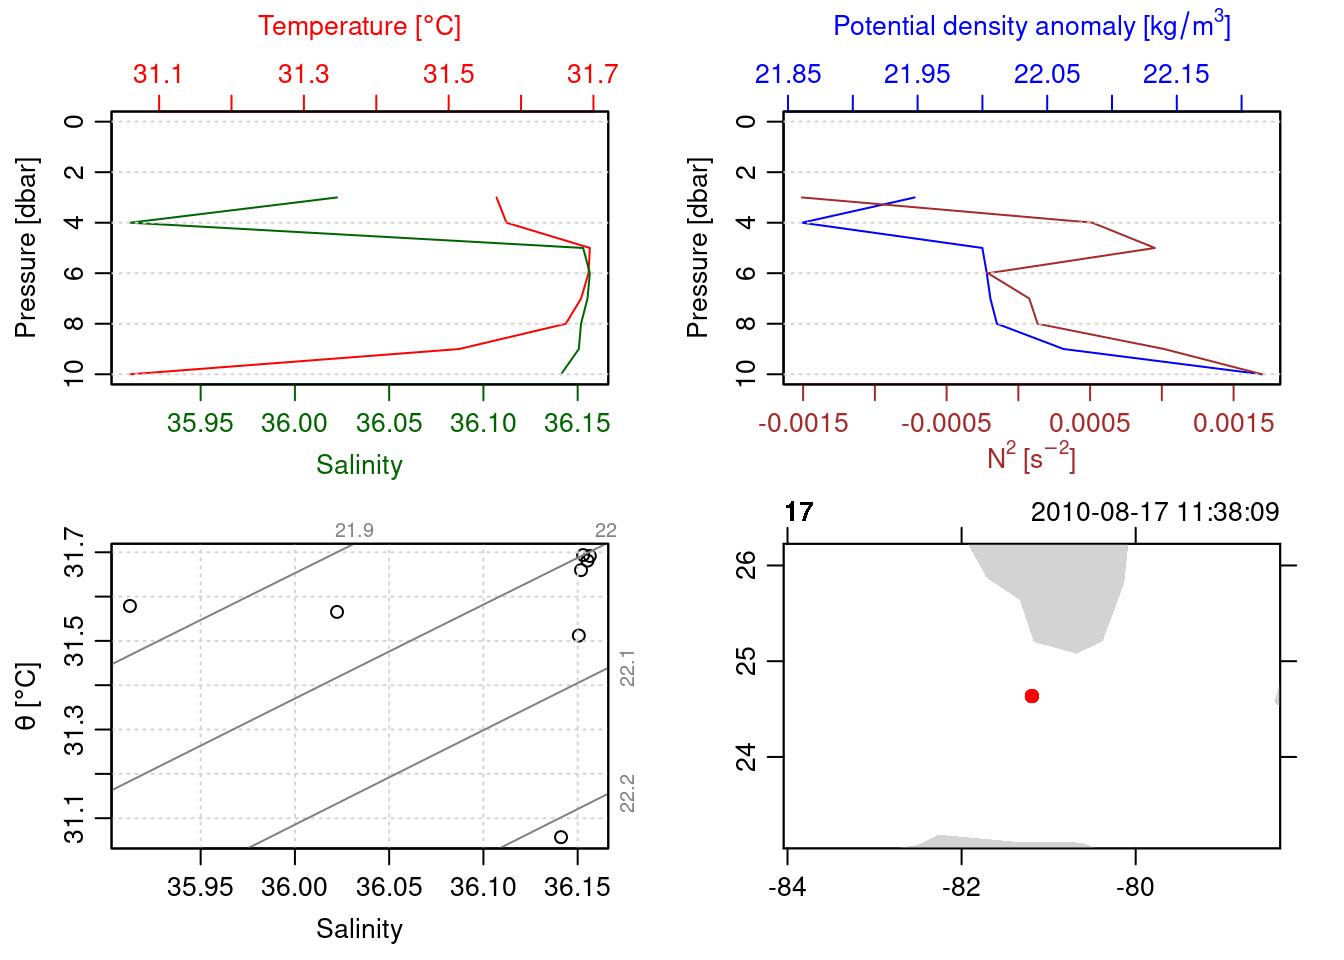
=== station: 17
# scans: 2897
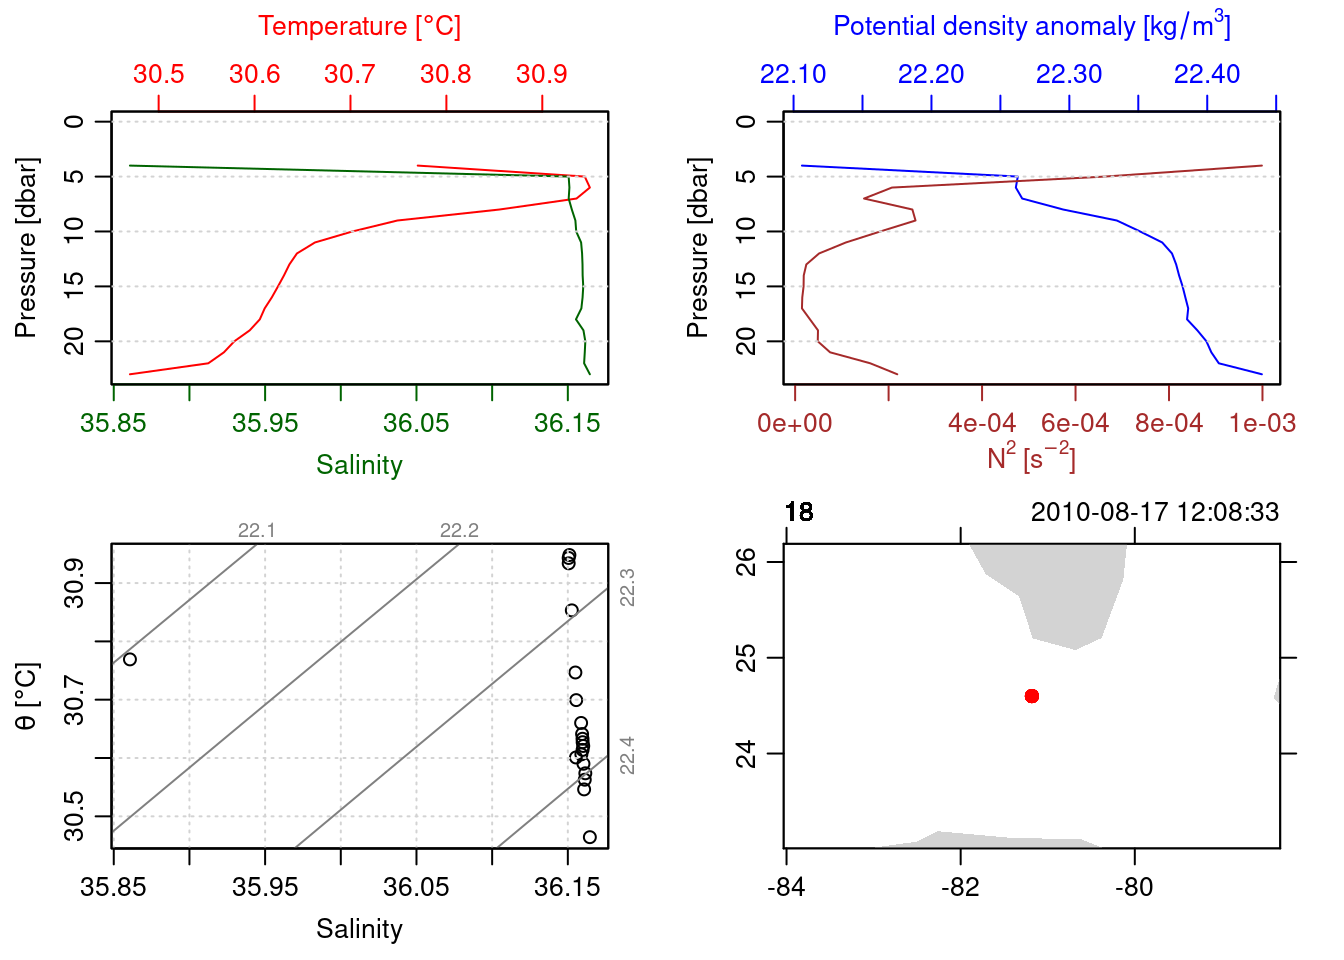
=== station: 18
# scans: 2380
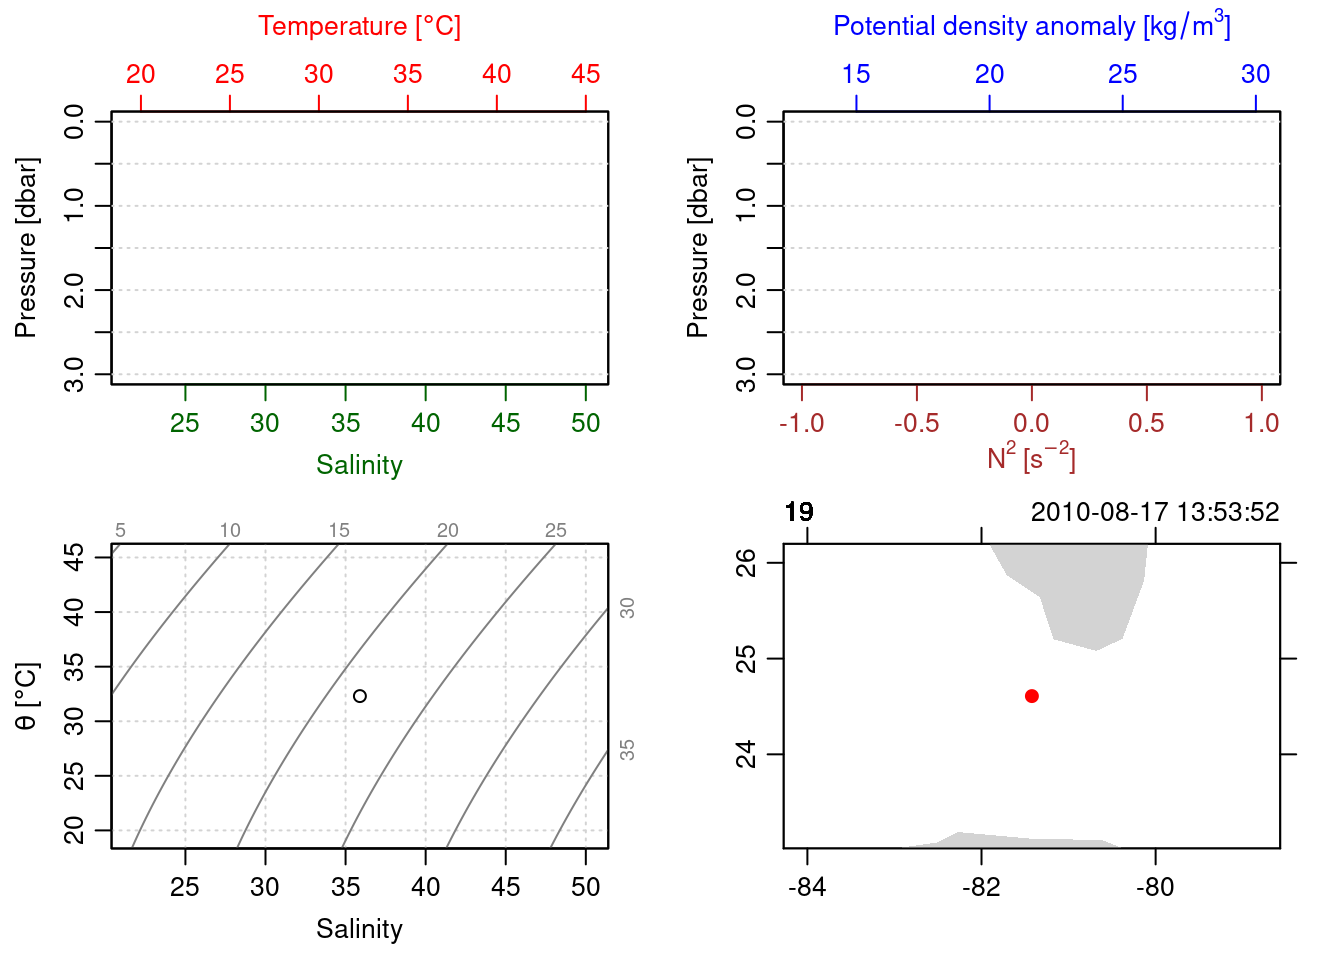
=== station: 19
# scans: 31
=== station: 1B
# scans: 197
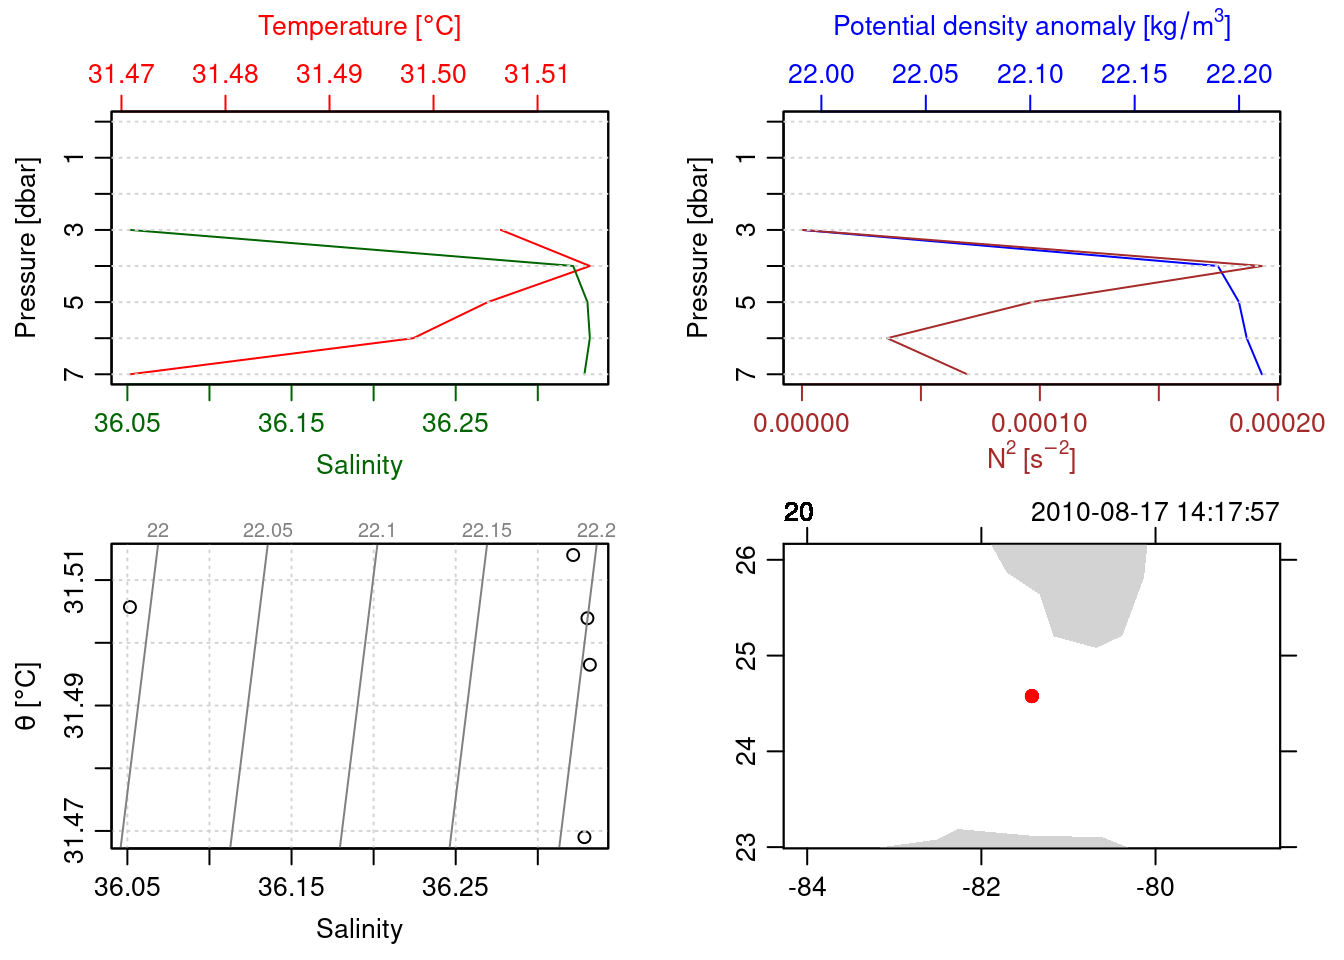
=== station: 20
# scans: 1116
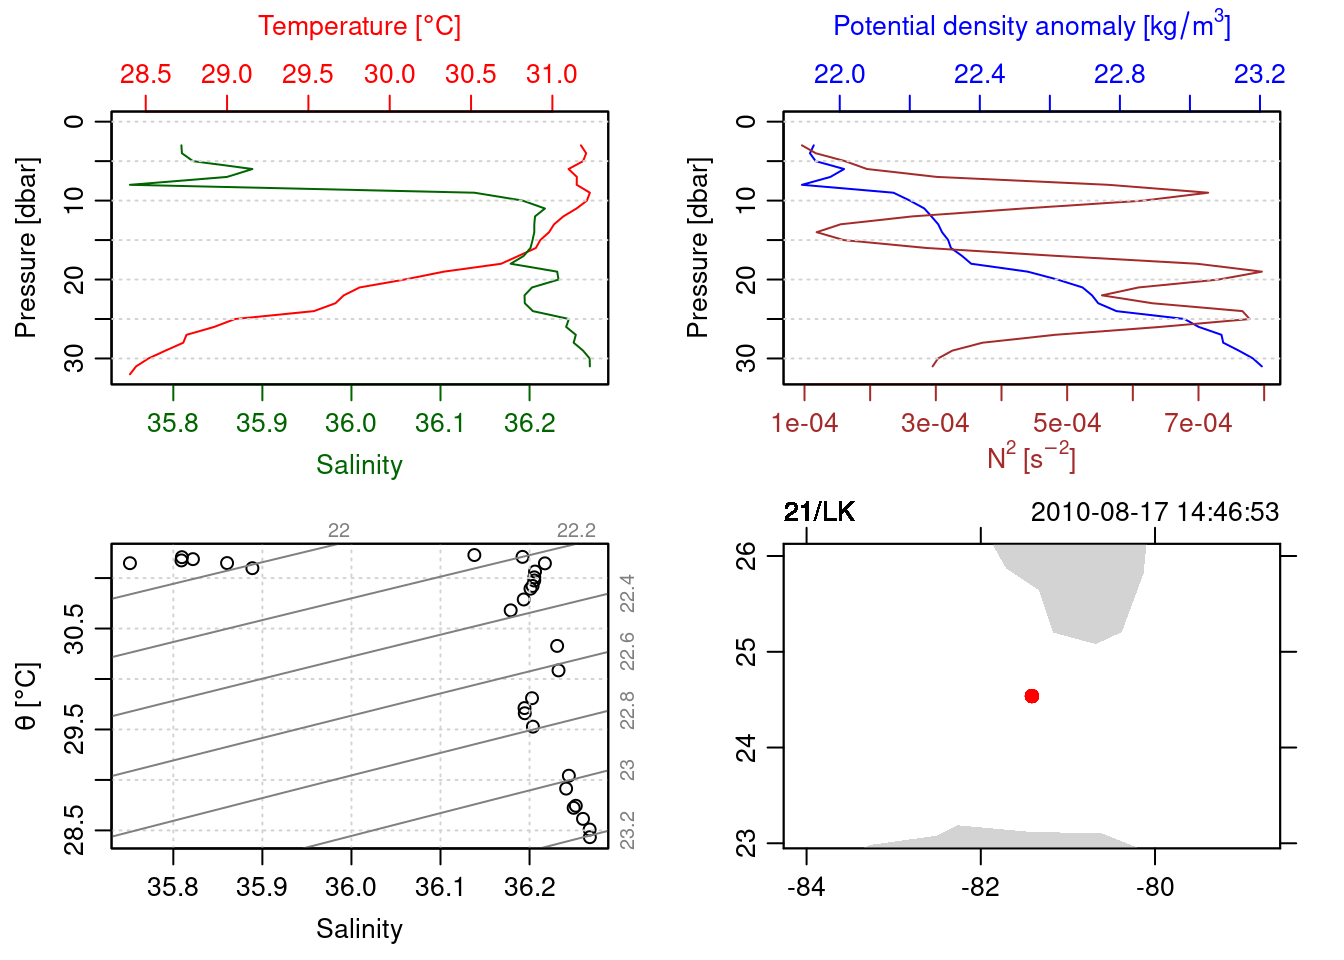
=== station: 21
# scans: 3994
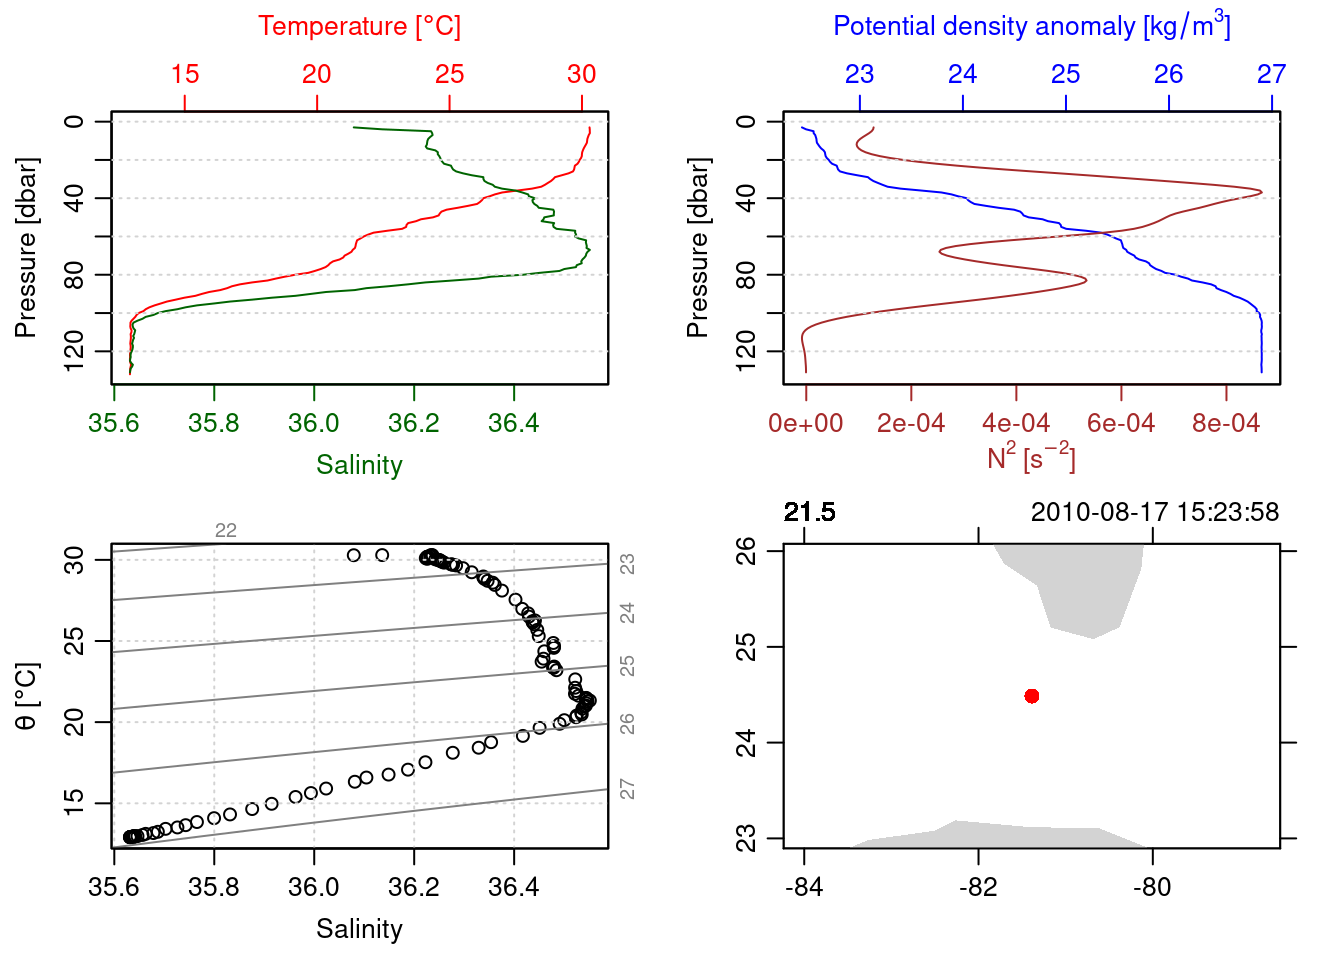
=== station: 21.5
# scans: 6540
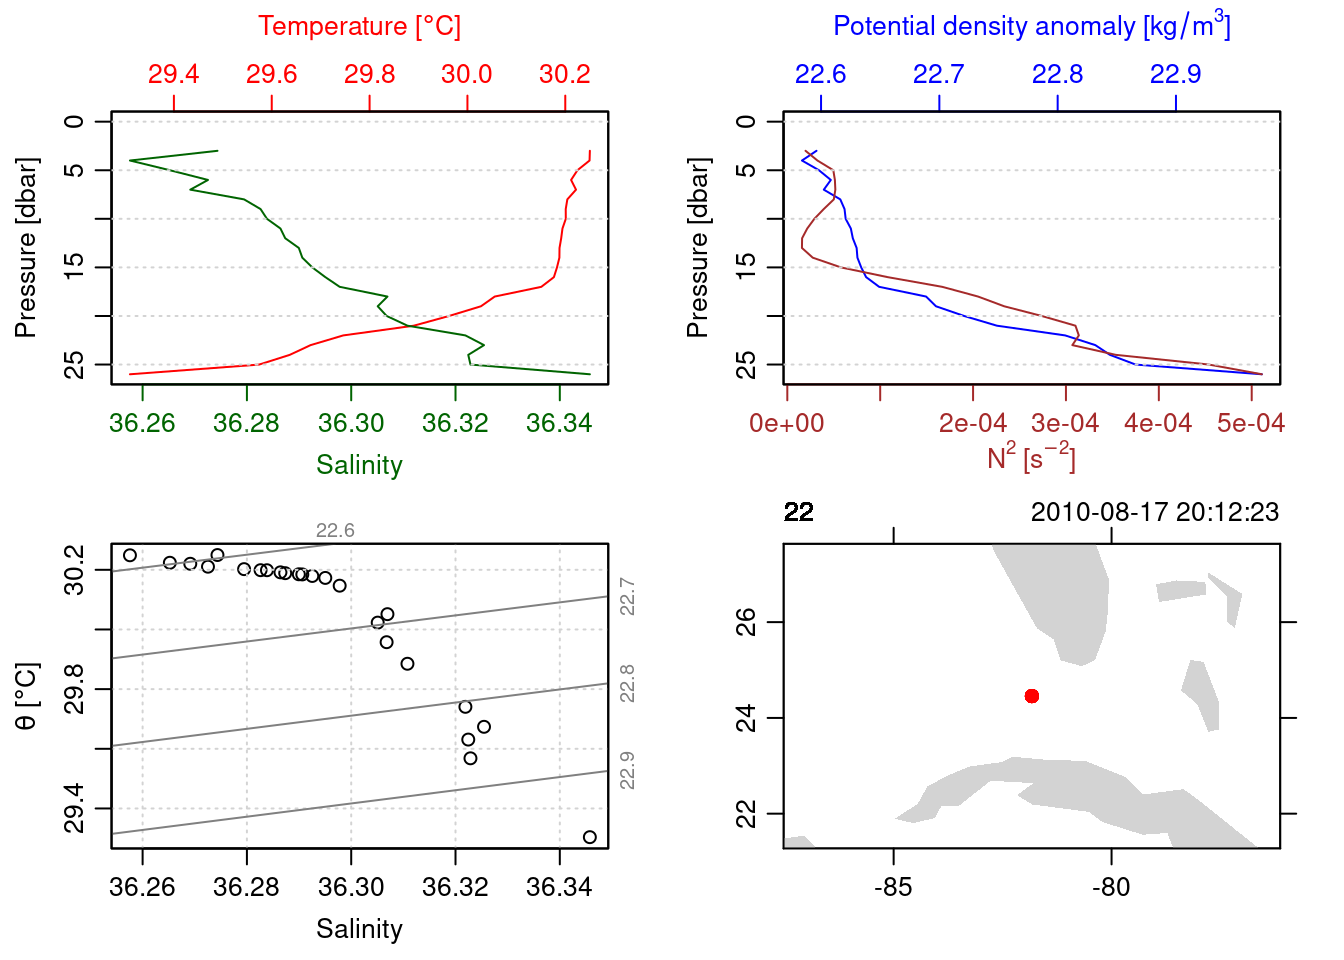
=== station: 22
# scans: 1917
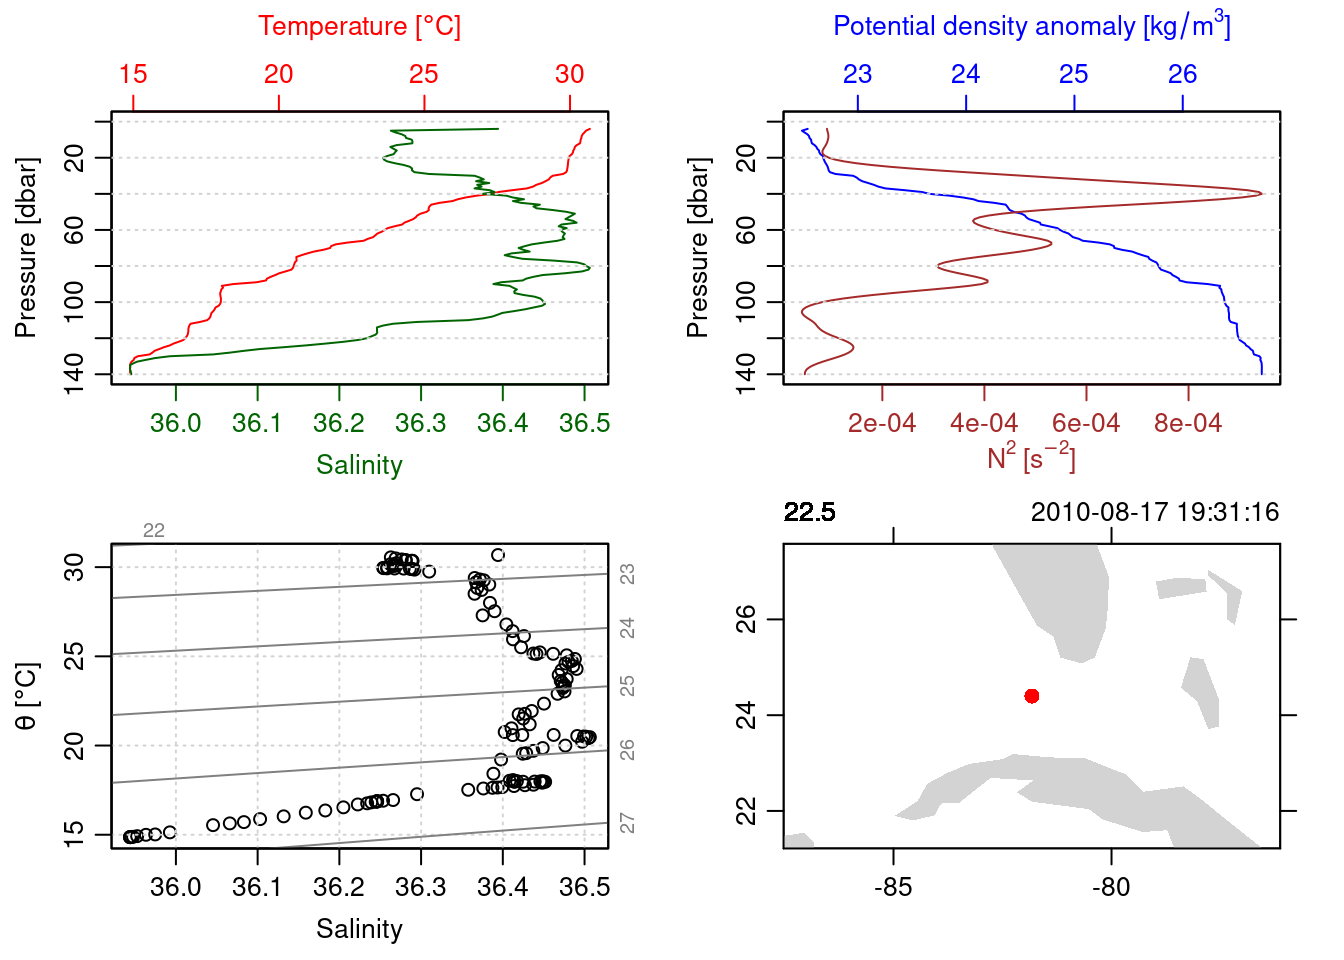
=== station: 22.5
# scans: 6711
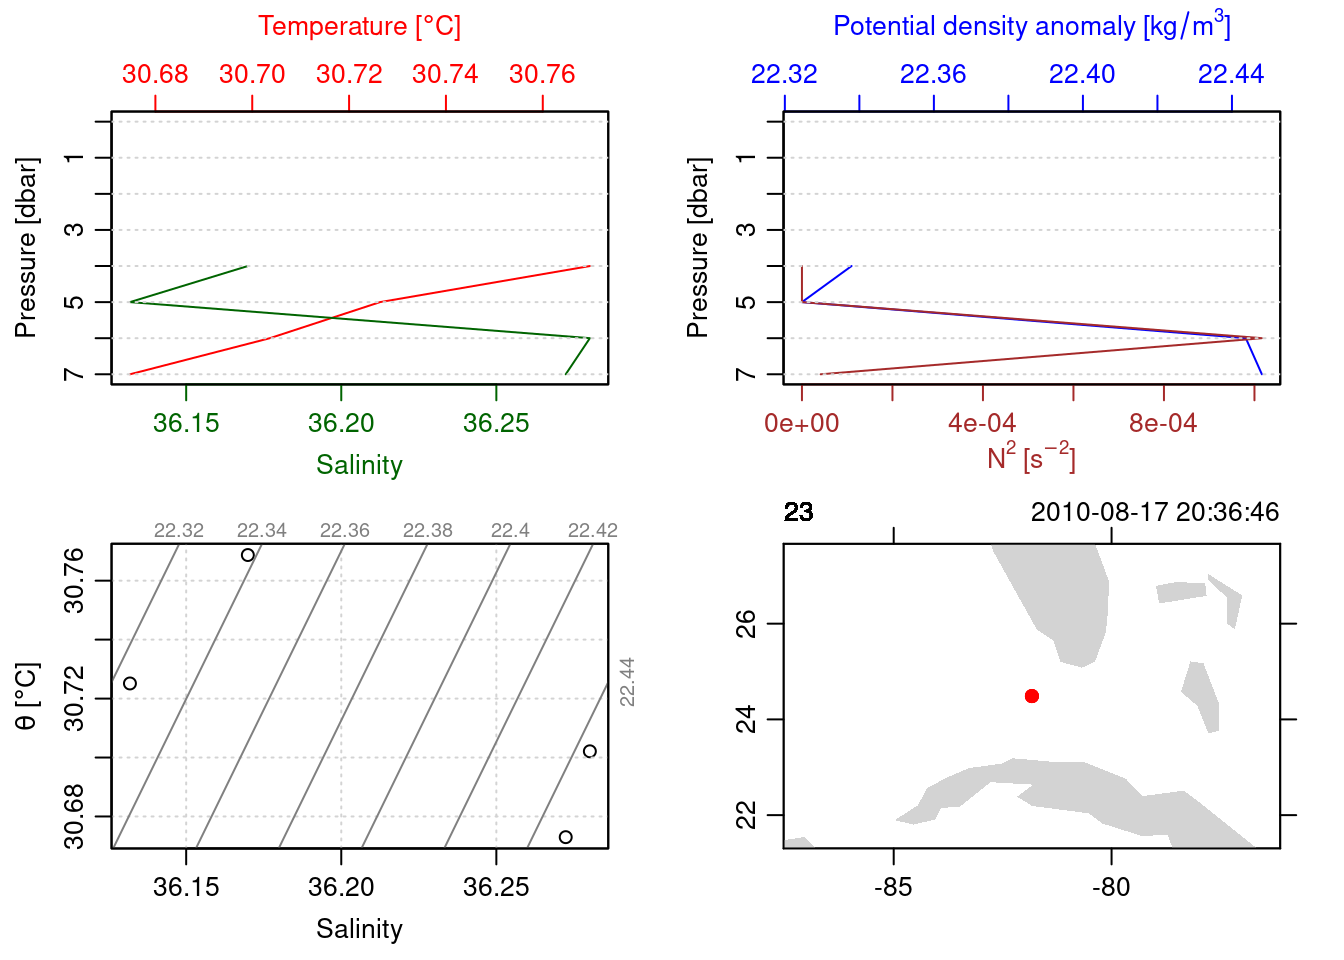
=== station: 23
# scans: 797
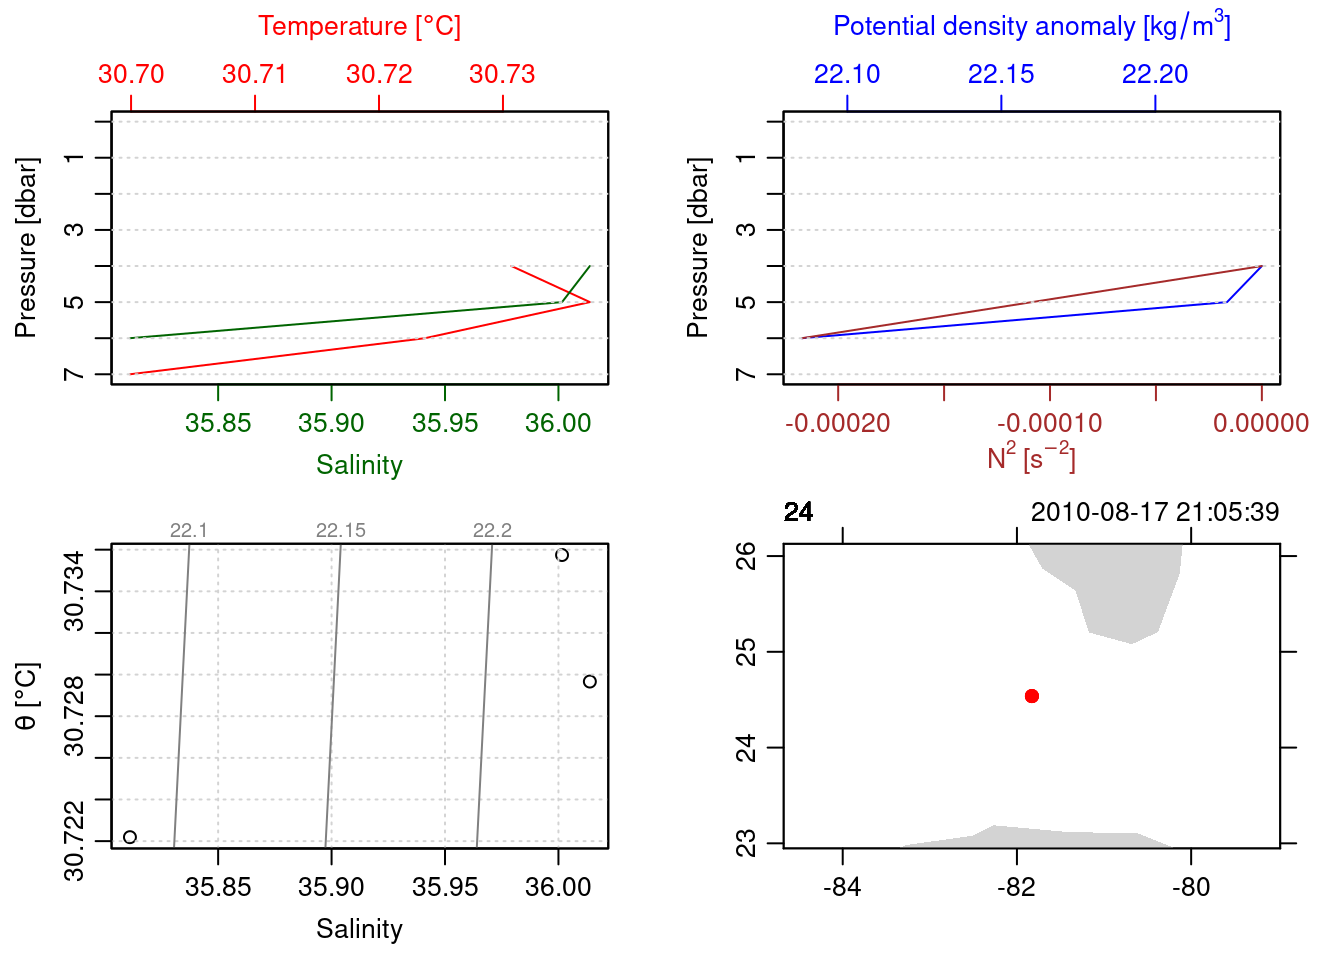
=== station: 24
# scans: 706
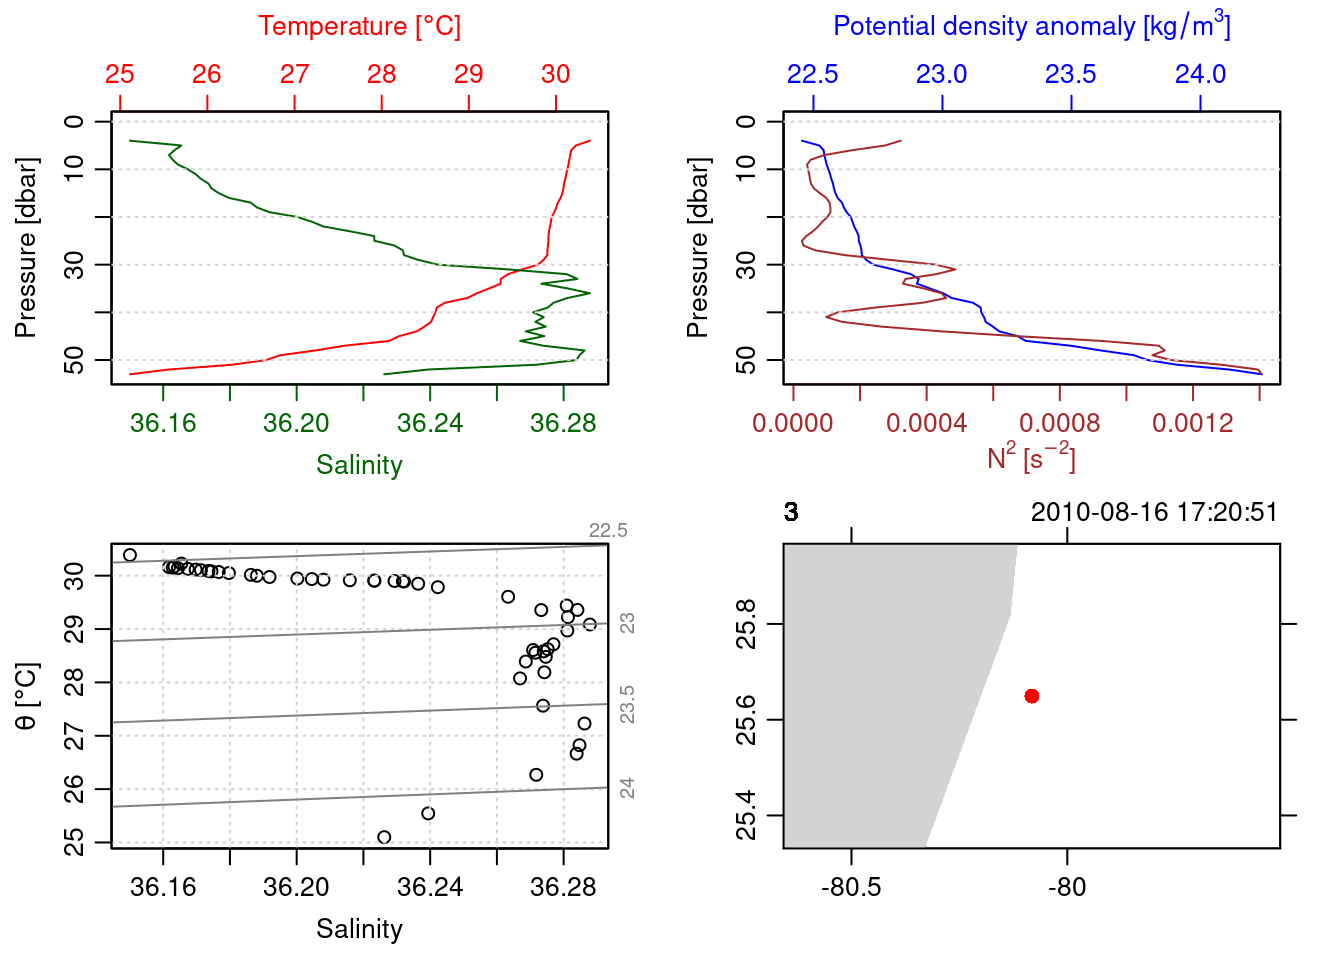
=== station: 3
# scans: 6512
=== station: 31
# scans: 3241
=== station: 32
# scans: 2364
=== station: 34
# scans: 2374
=== station: 39
# scans: 2161
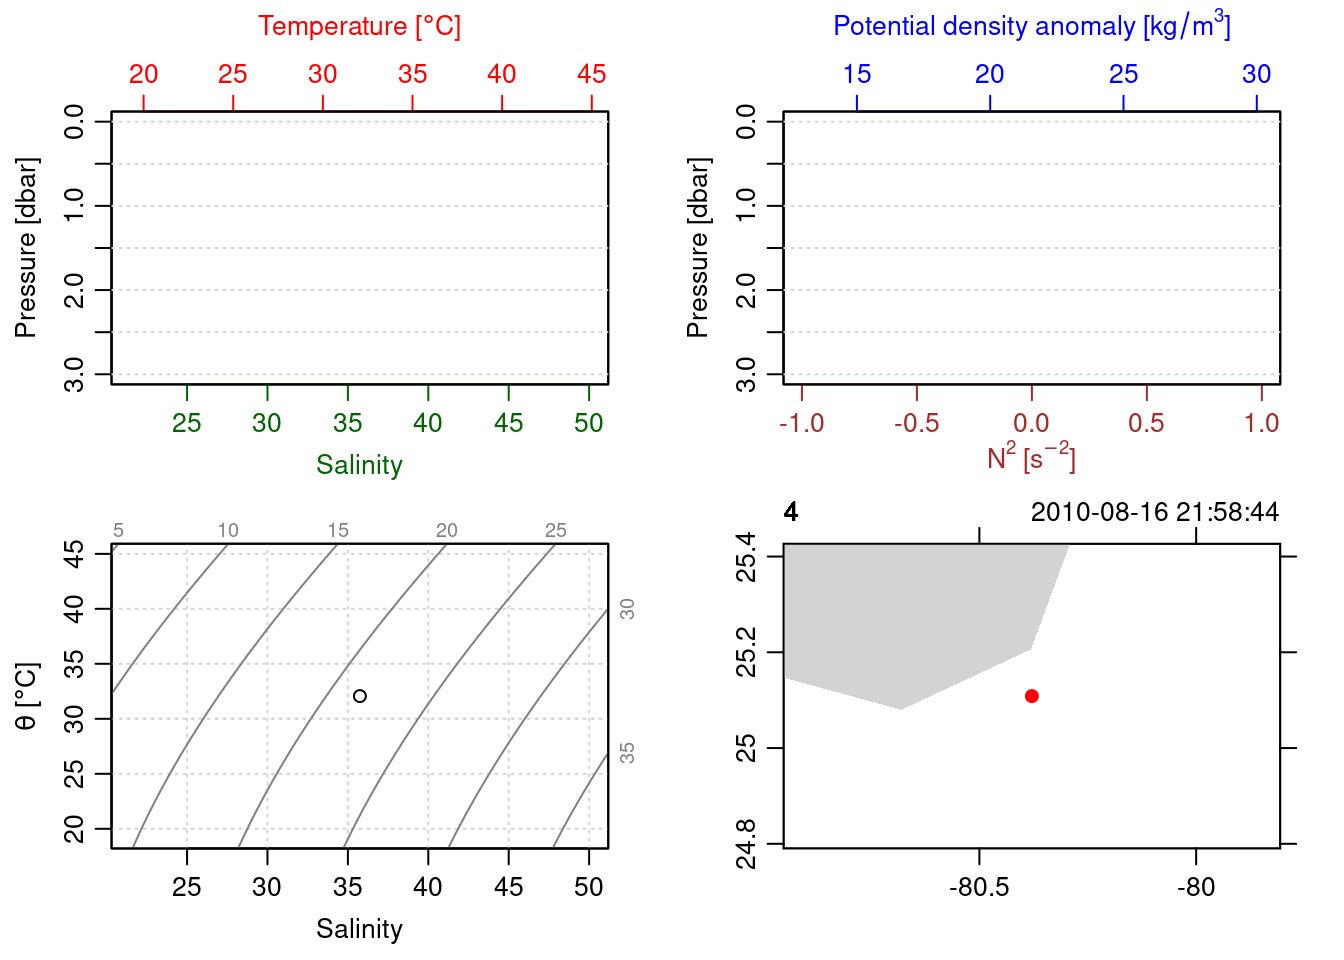
=== station: 4
# scans: 37
=== station: 41
# scans: 2731
=== station: 42
# scans: 2783
=== station: 45
# scans: 2915
=== station: 49
# scans: 2591
=== station: 5
# scans: 37
=== station: 50
# scans: 918
=== station: 53
# scans: 51
=== station: 54
# scans: 750
=== station: 56
# scans: 431
=== station: 58
# scans: 914
=== station: 59
# scans: 925
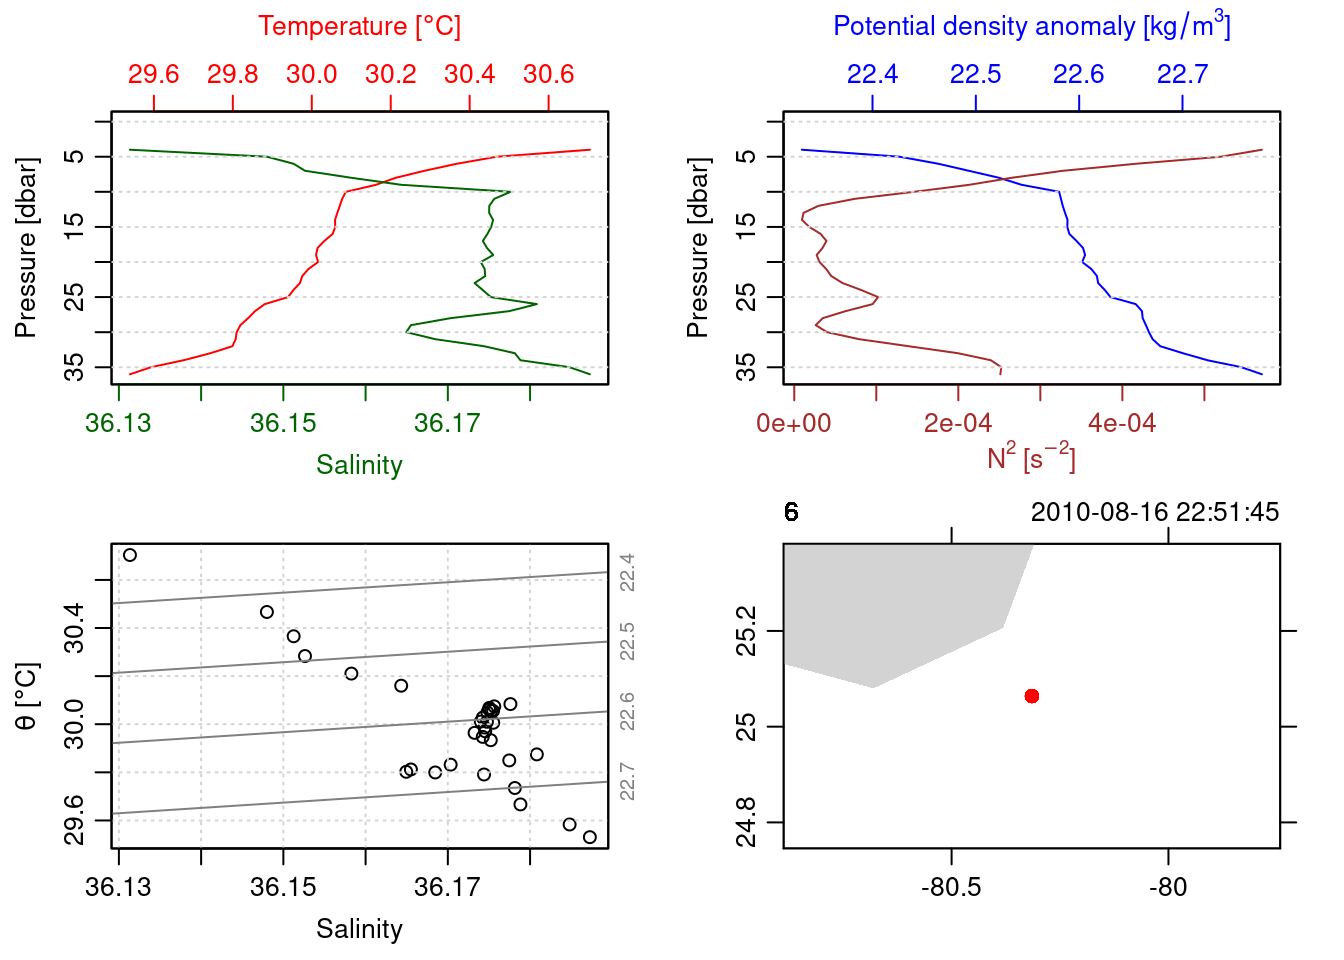
=== station: 6
# scans: 3301
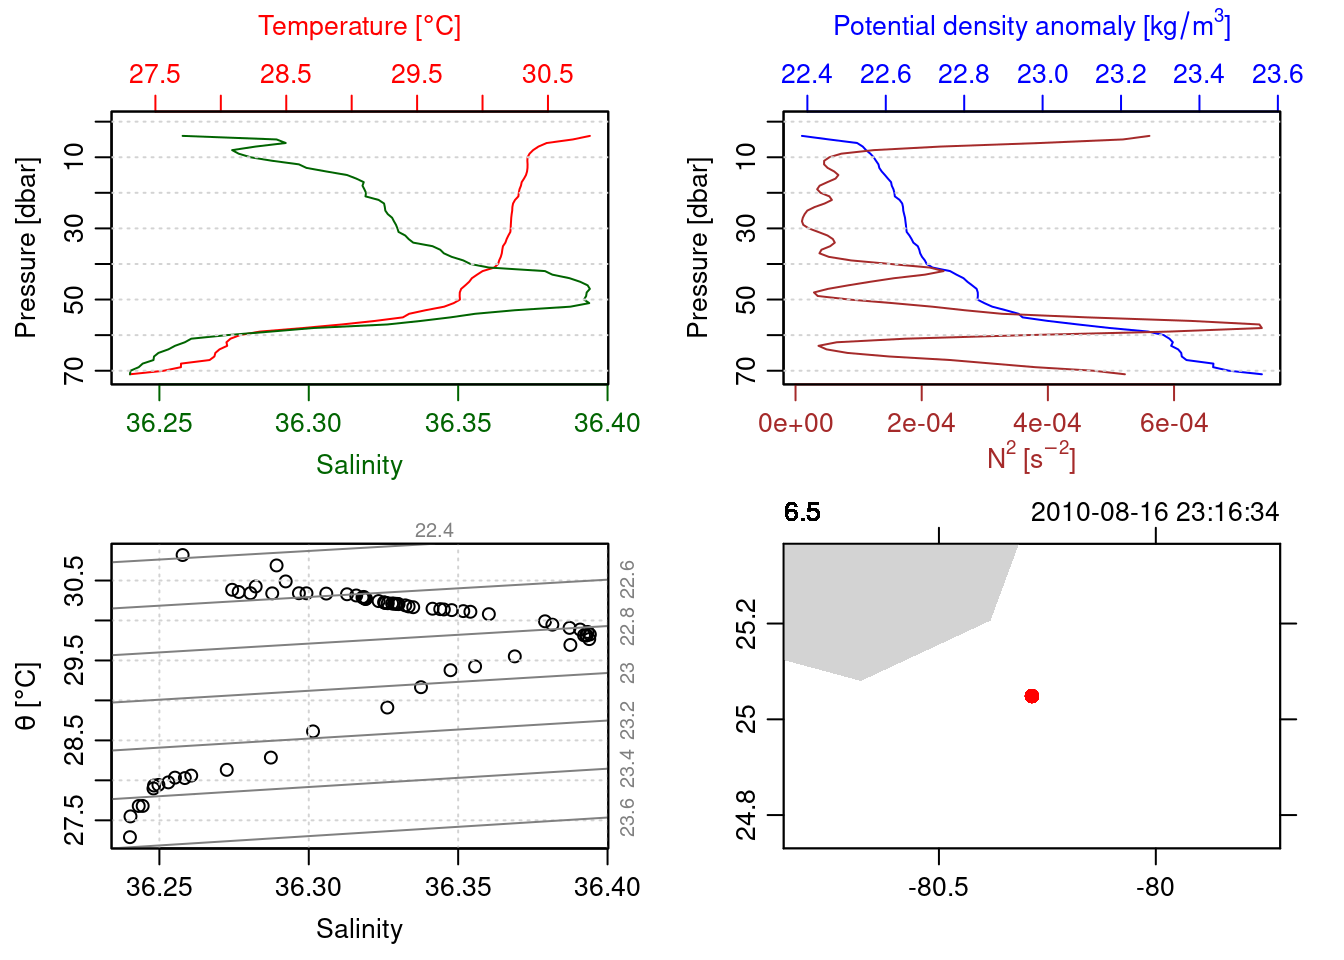
=== station: 6.5
# scans: 6410
=== station: 60
# scans: 549
=== station: 68
# scans: 2590
=== station: 69
# scans: 2707
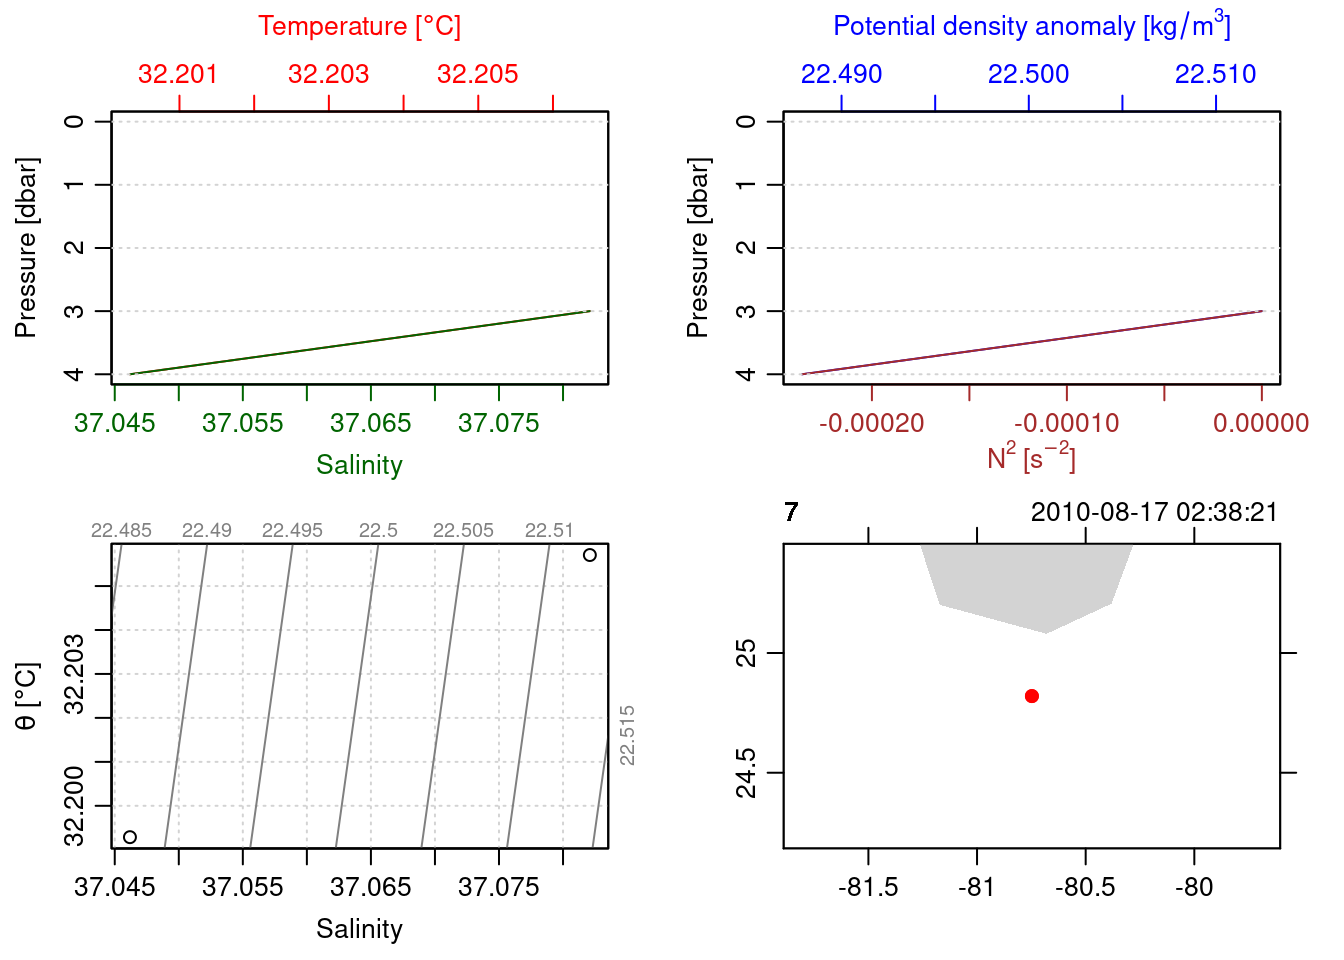
=== station: 7
# scans: 2499
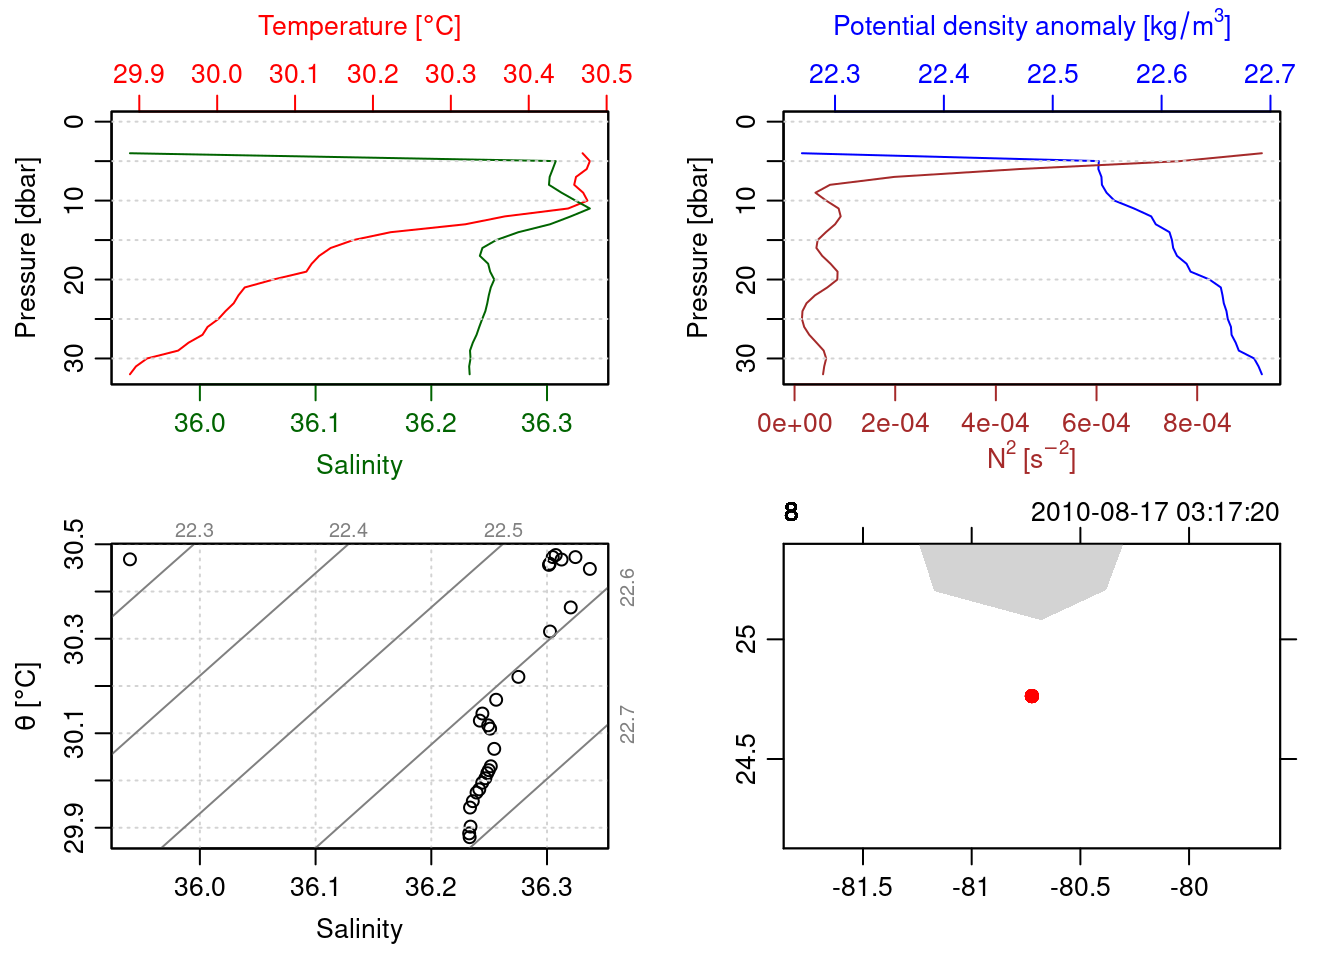
=== station: 8
# scans: 2763
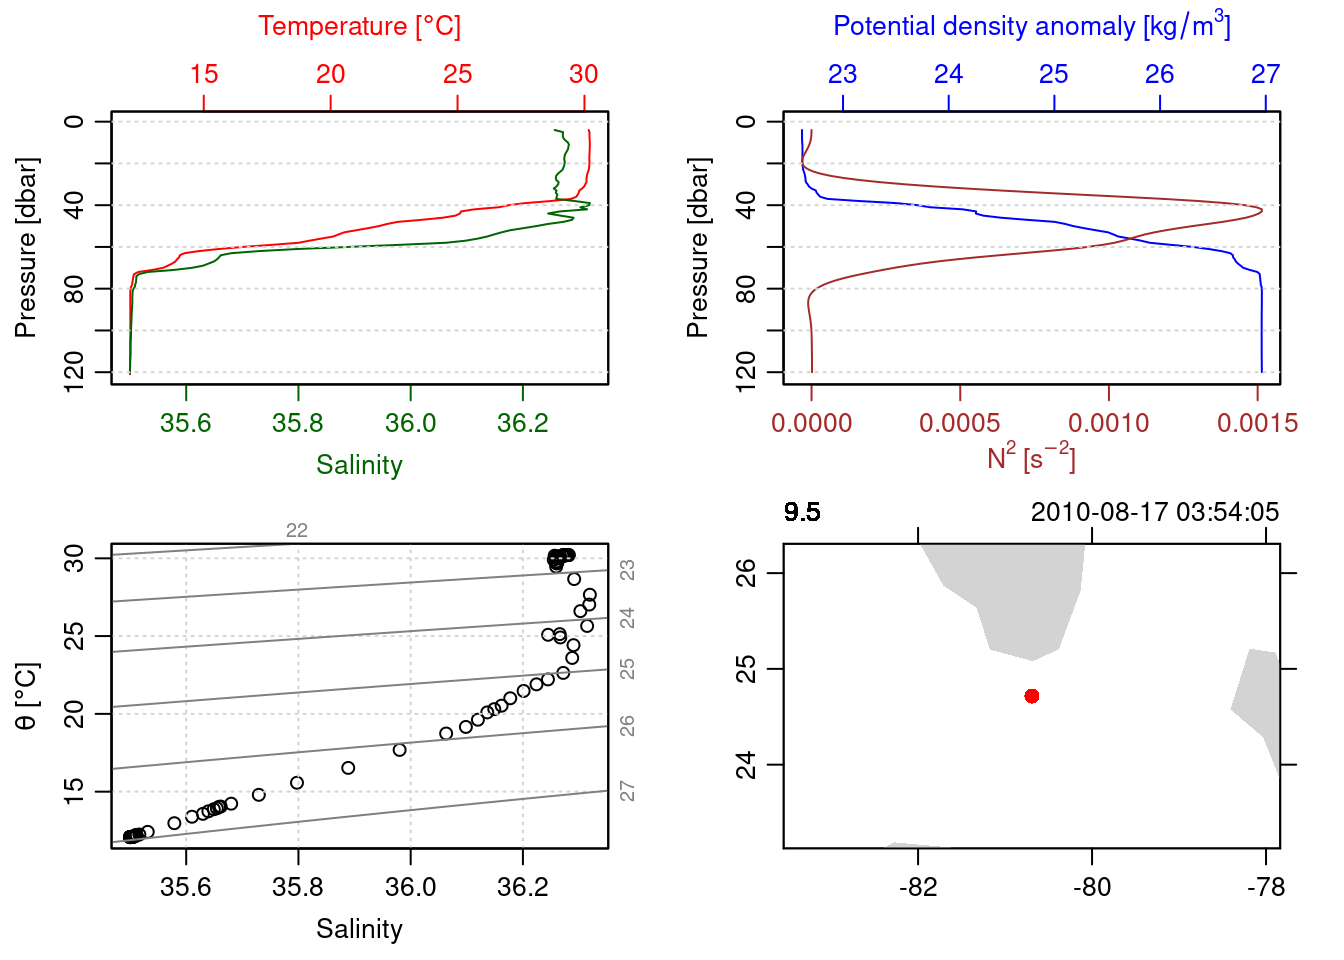
=== station: 9.5
# scans: 6010
=== station: CAL1
# scans: 105
=== station: CAL3
# scans: 1018
=== station: CAL4
# scans: 2181
=== station: CAL5
# scans: 1614
=== station: CH2
# scans: 1358
=== station: CH3
# scans: 1849
=== station: CH4
# scans: 2109
=== station: CH5
# scans: 4380
plotting each cast in the first list
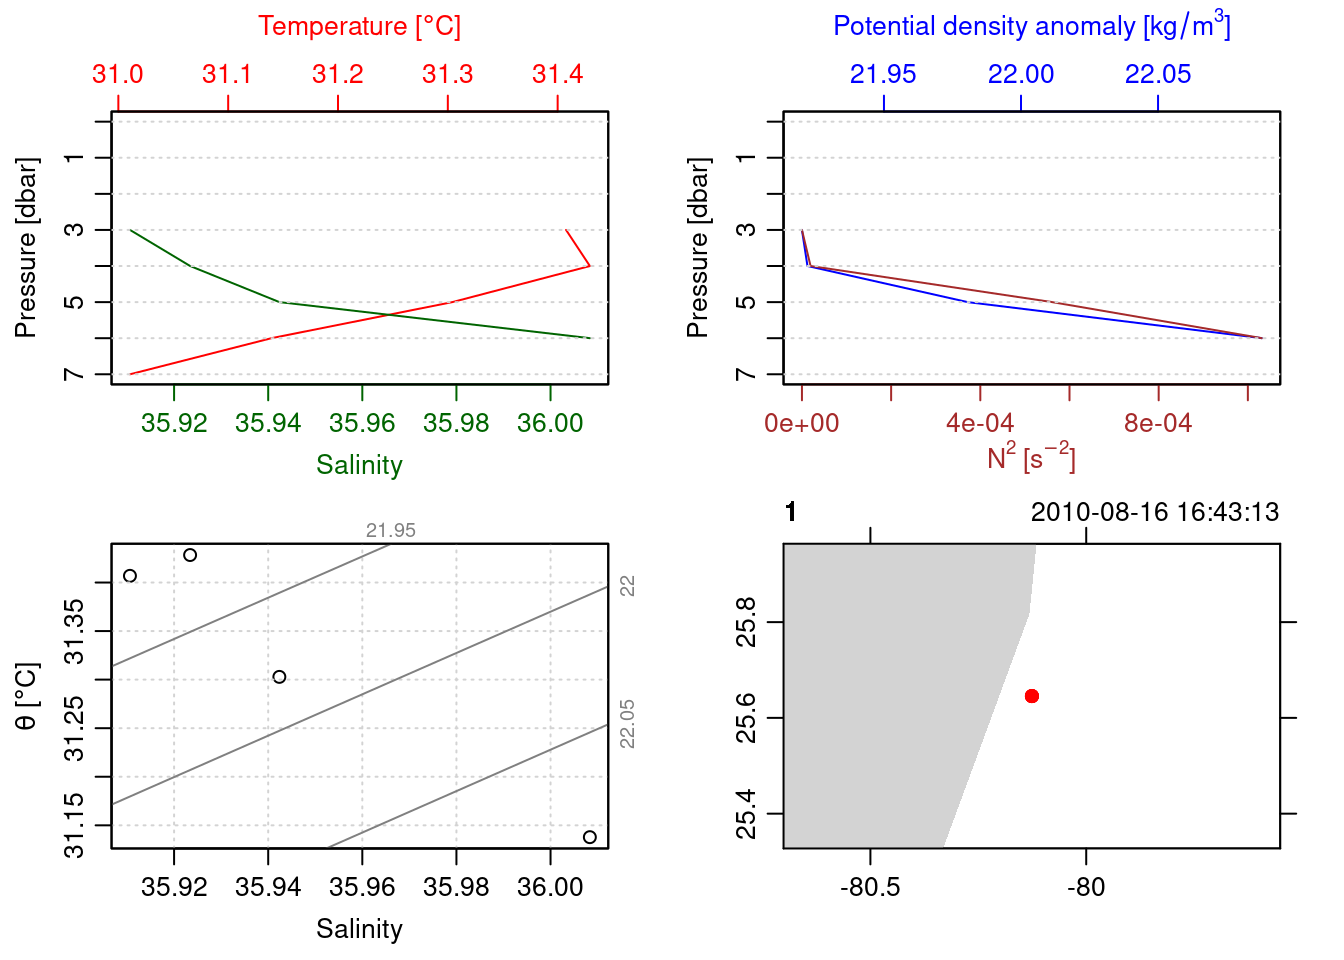
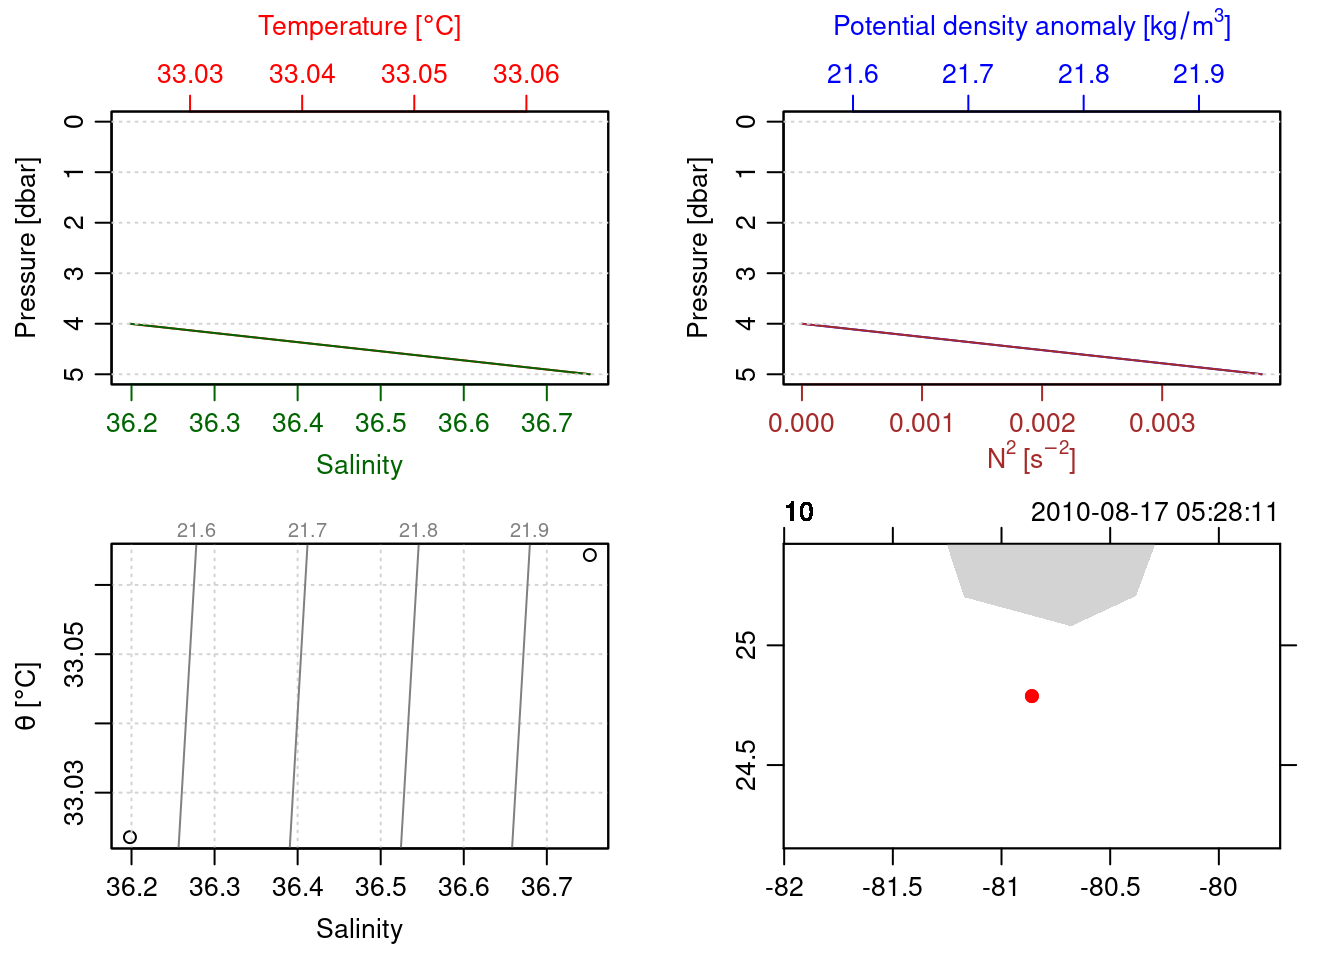
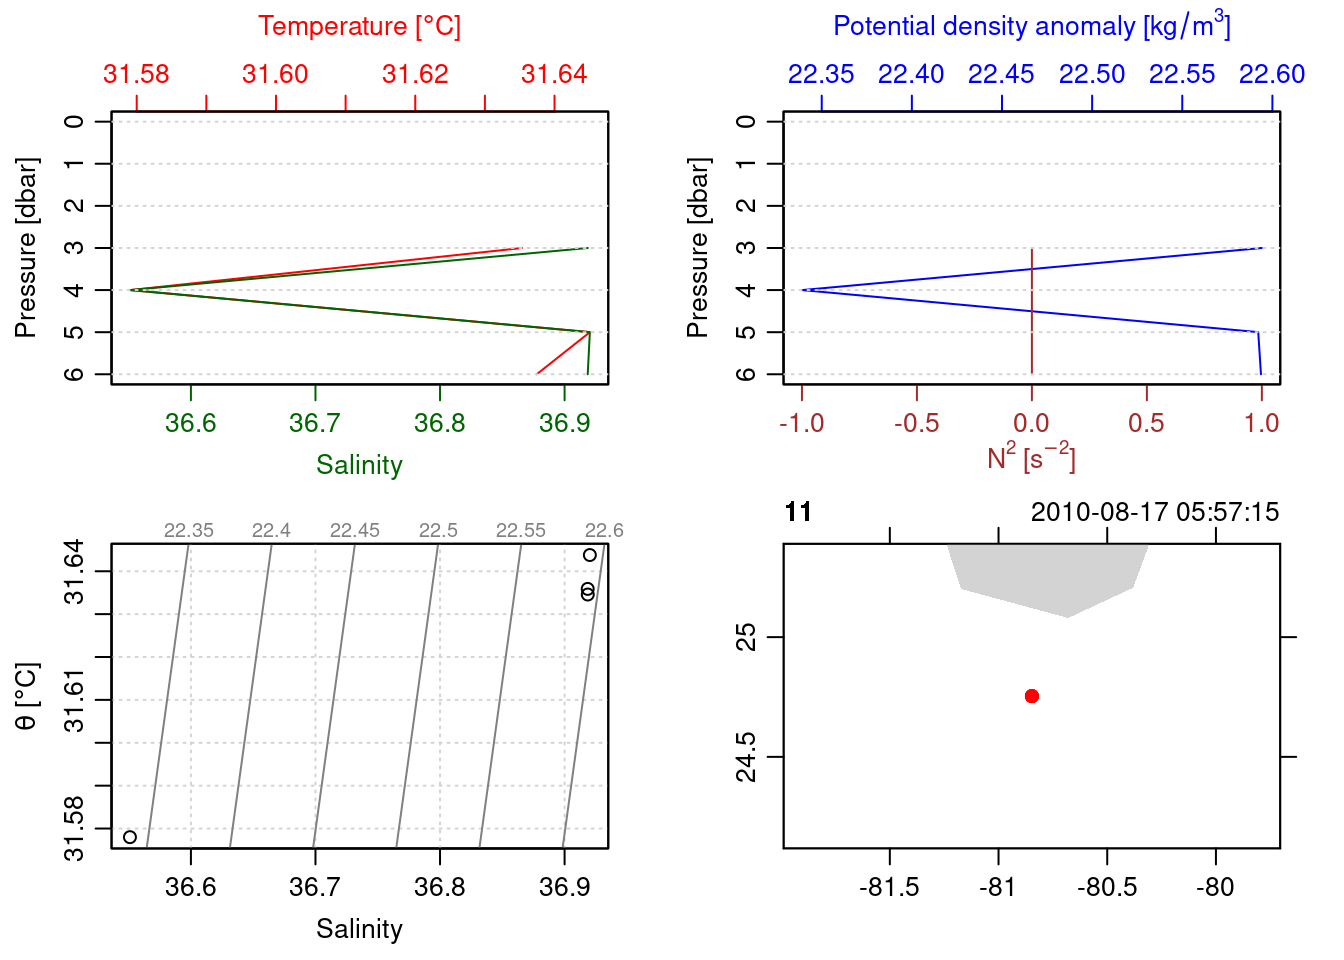
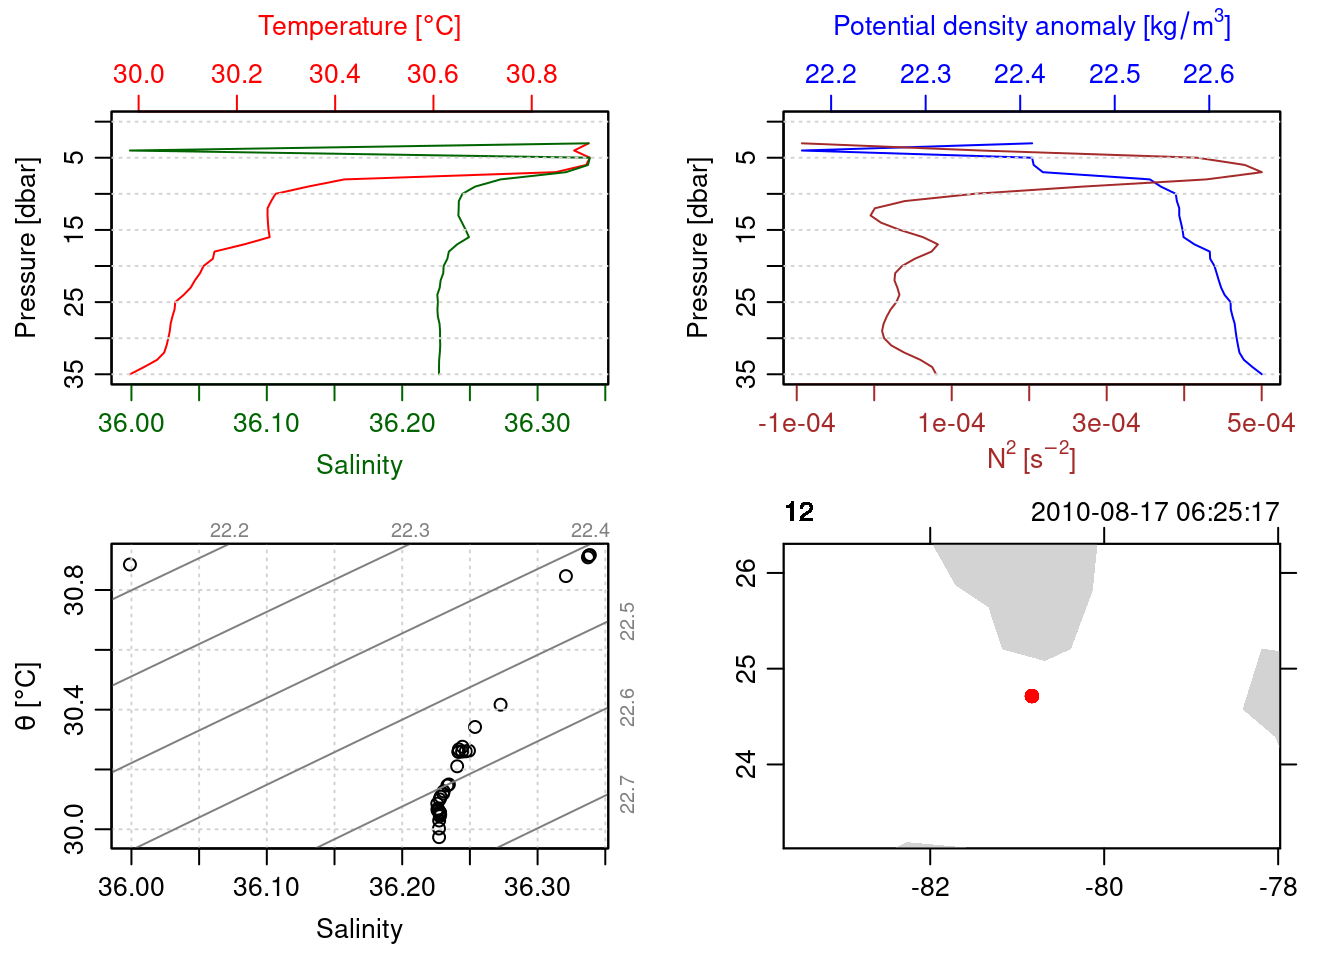
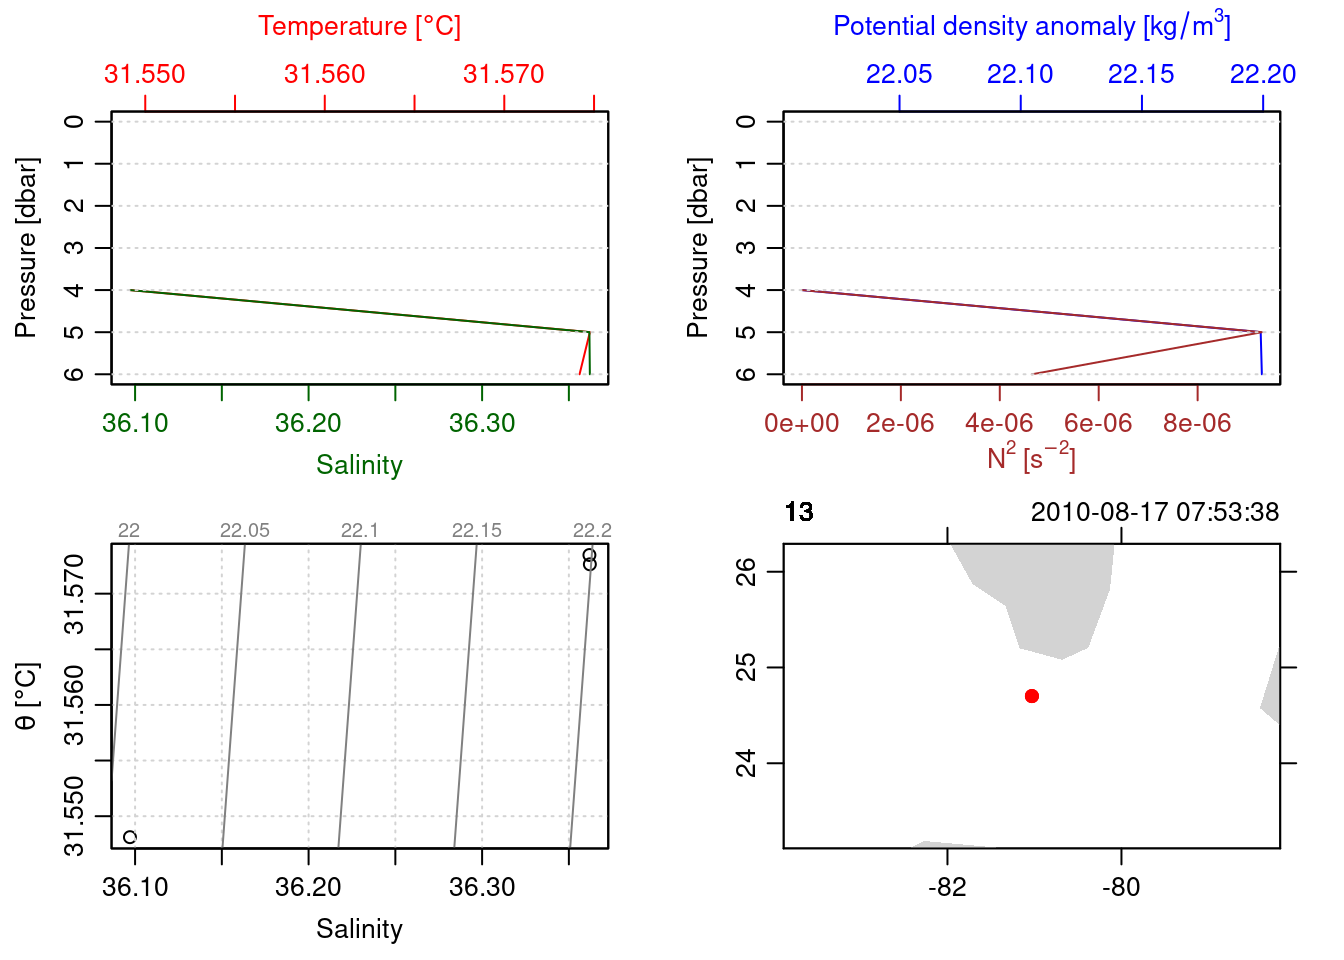
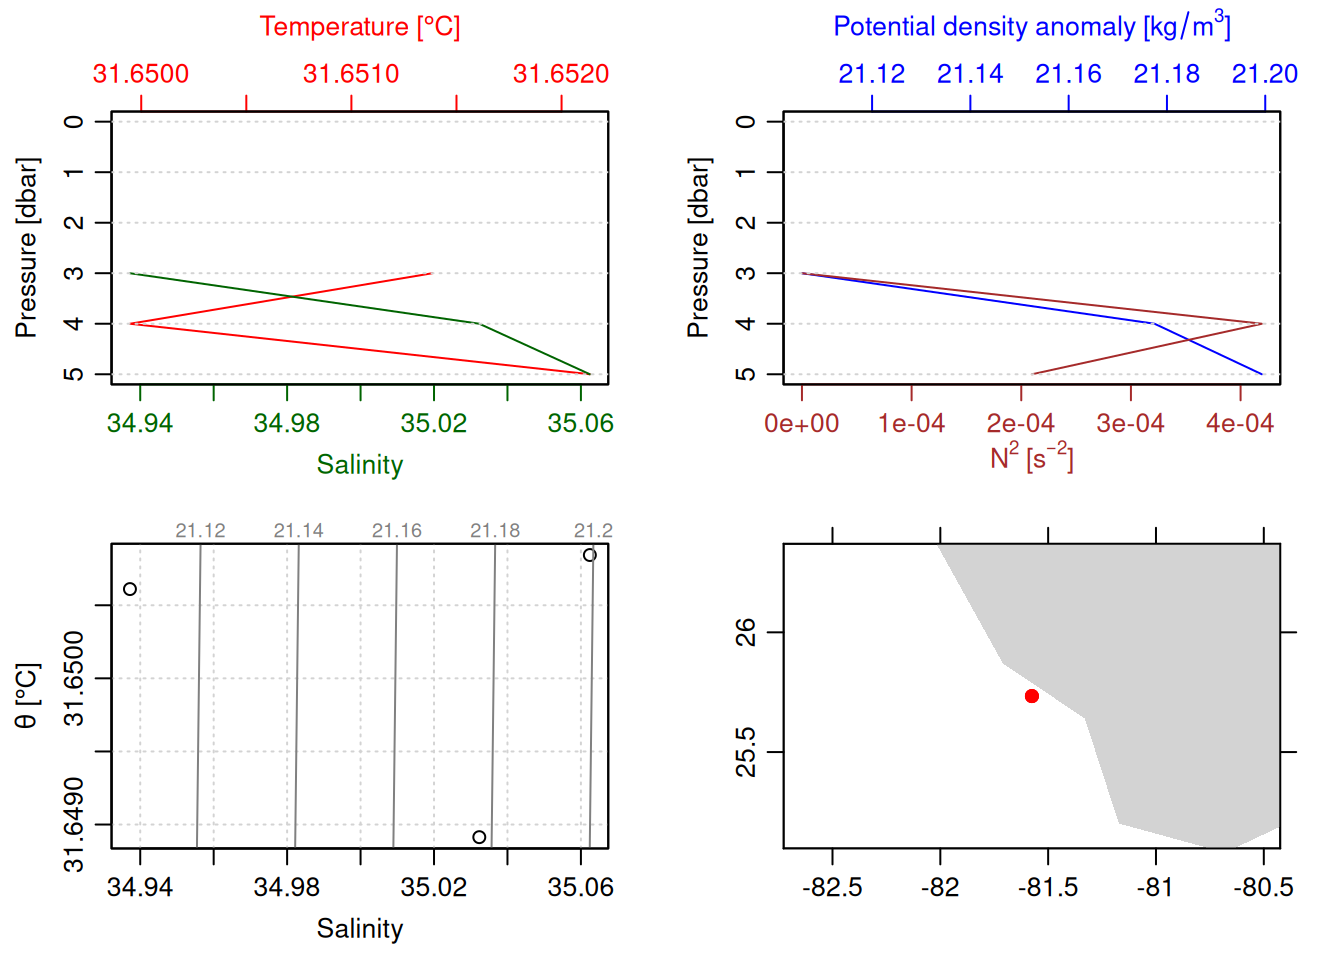
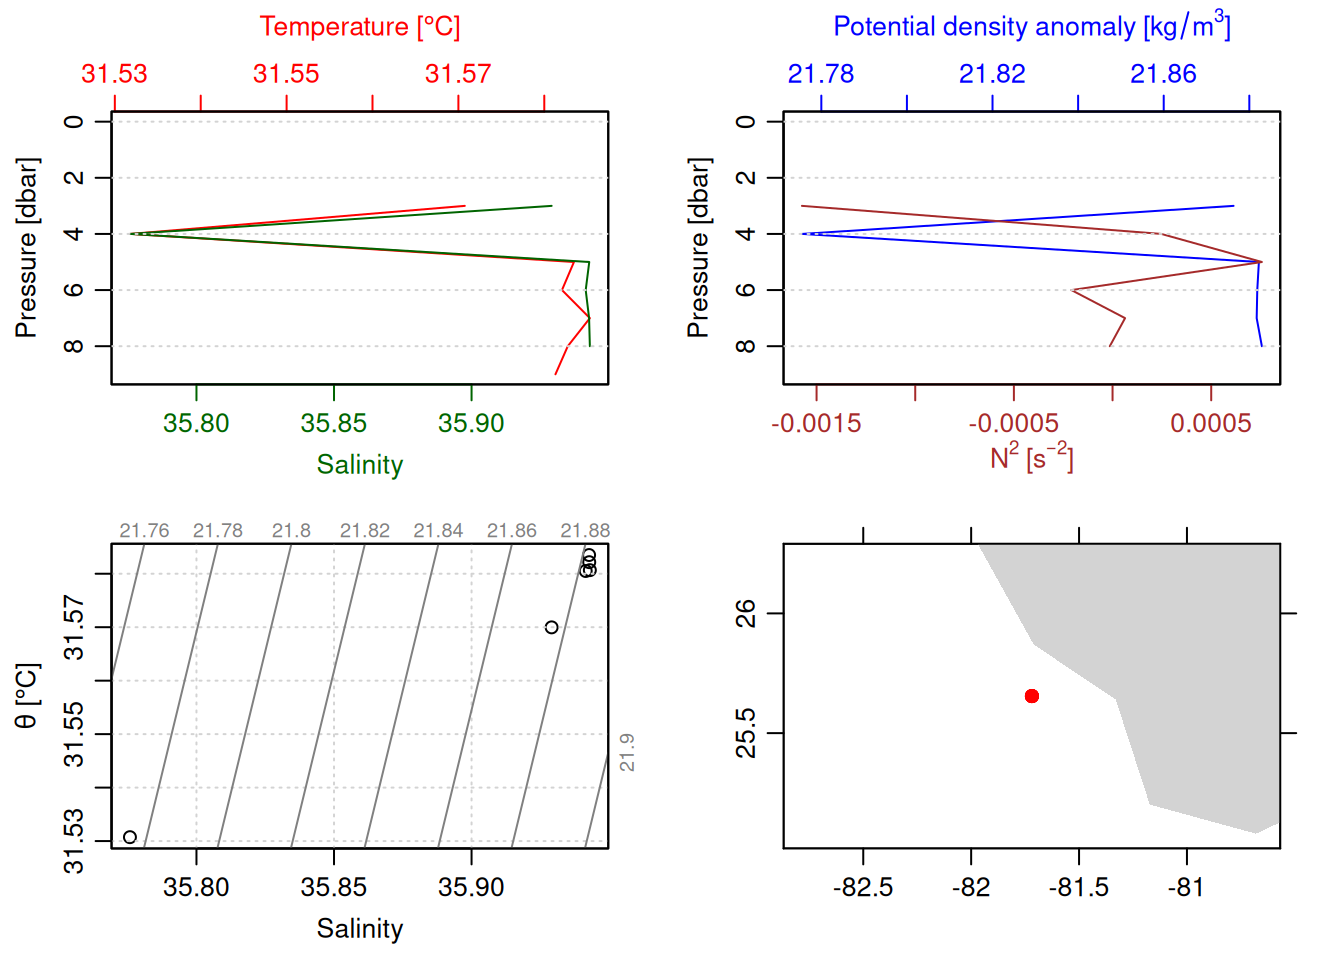
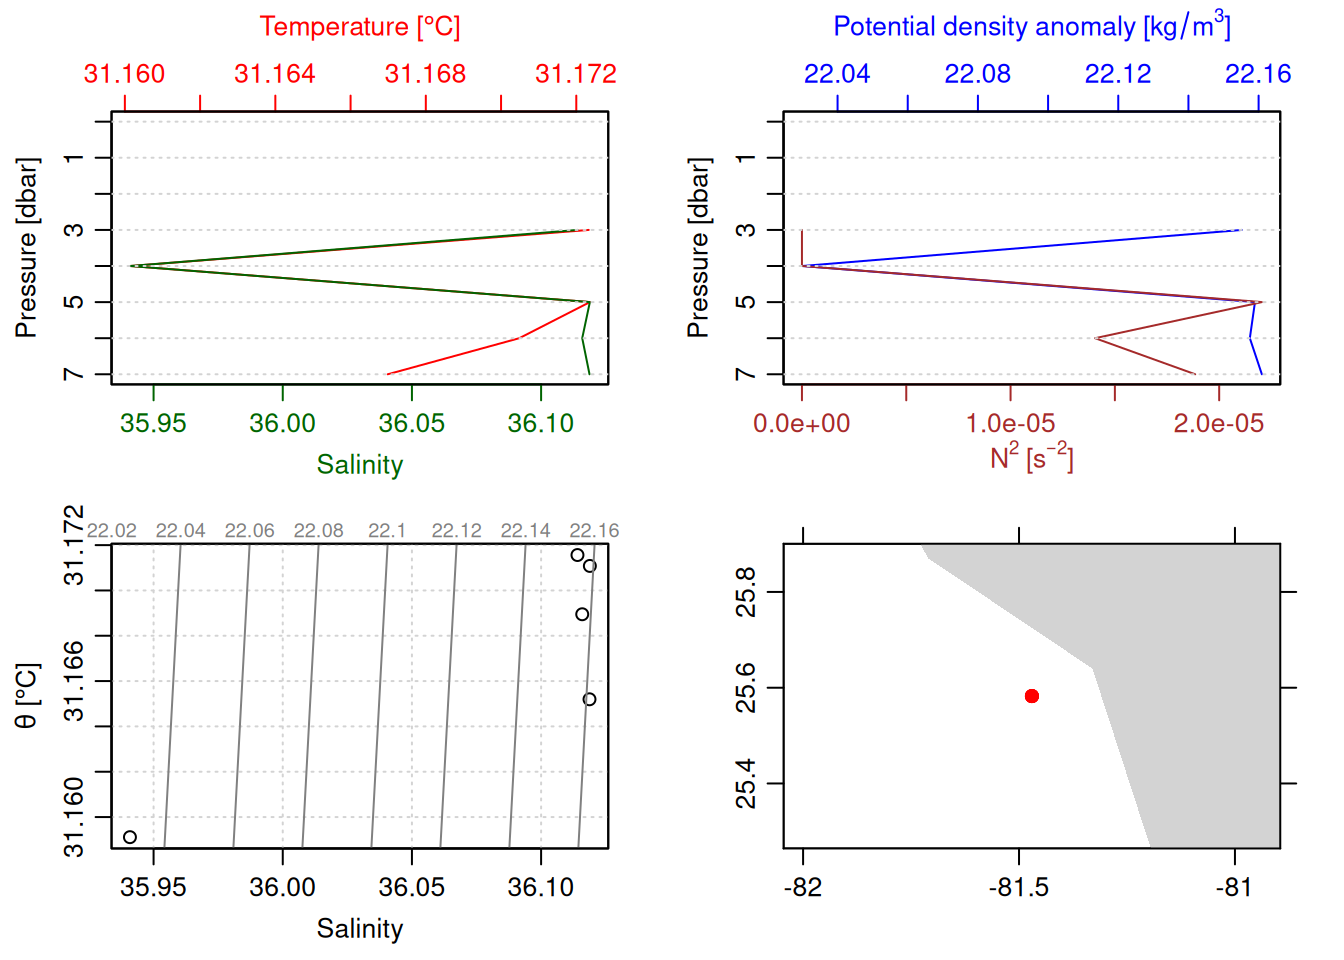
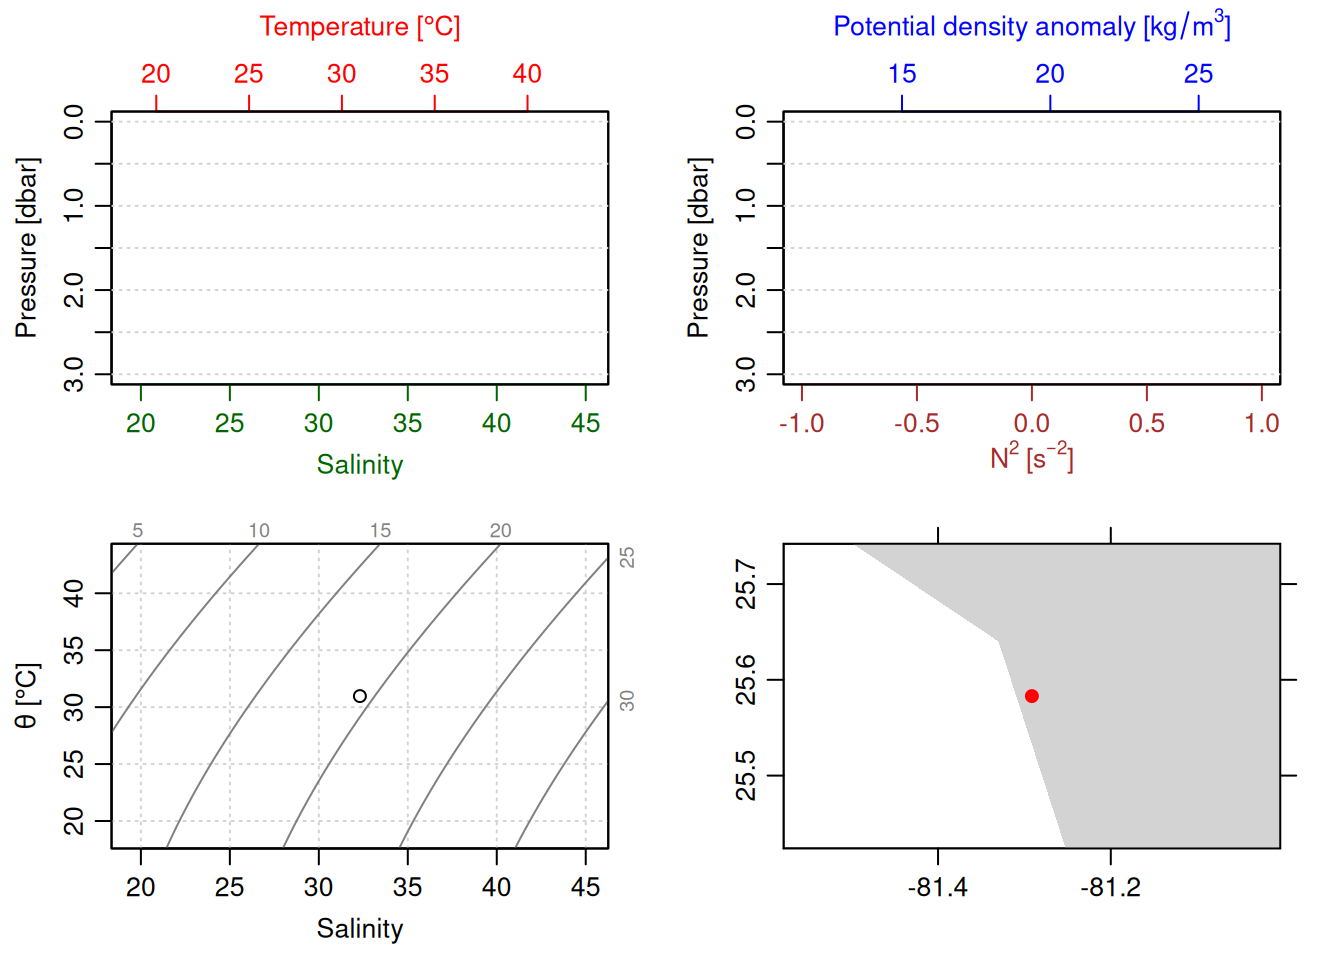
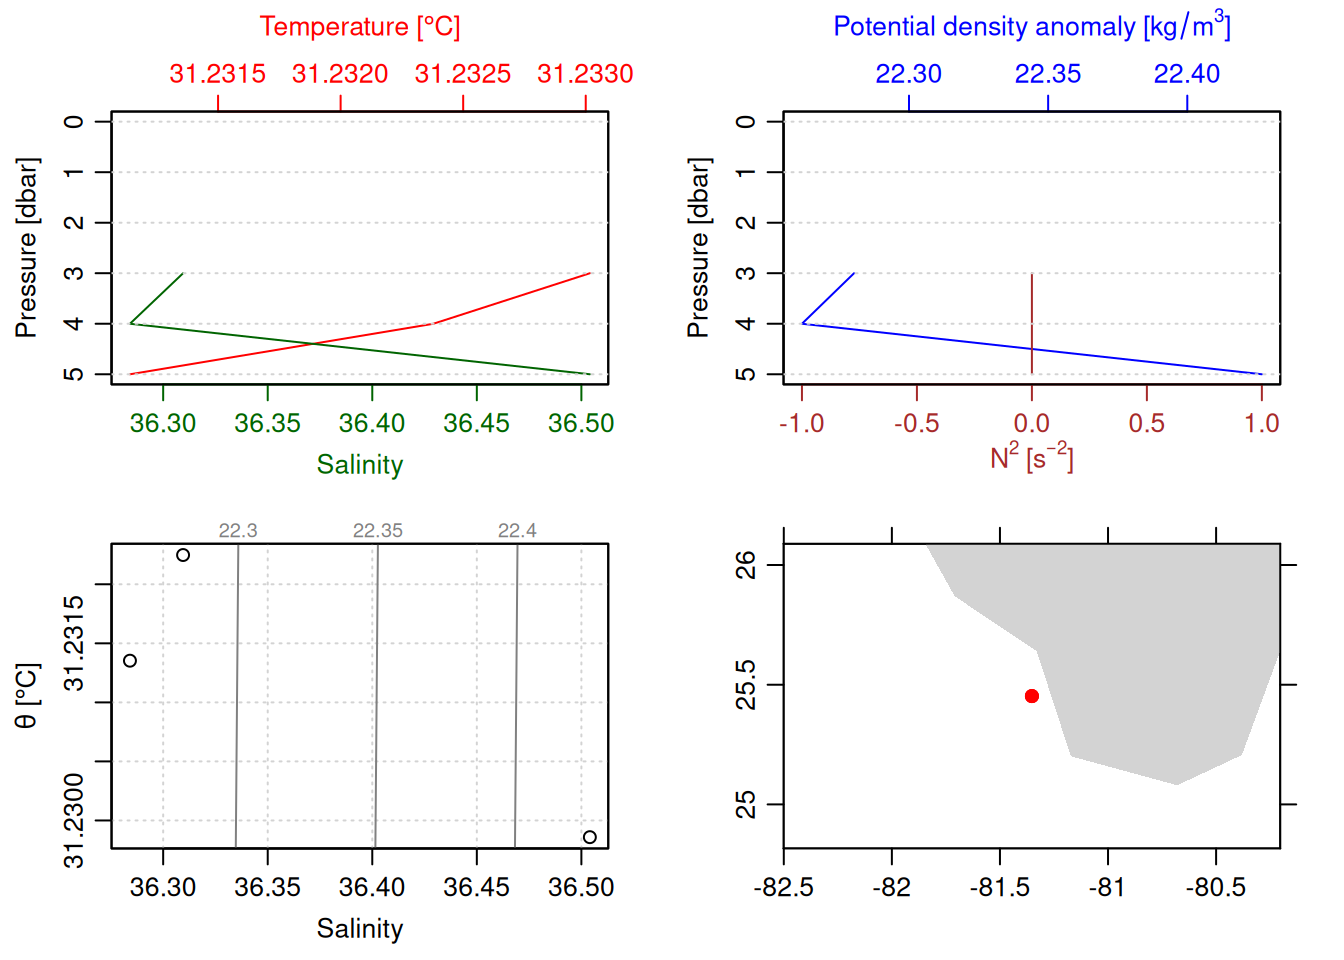
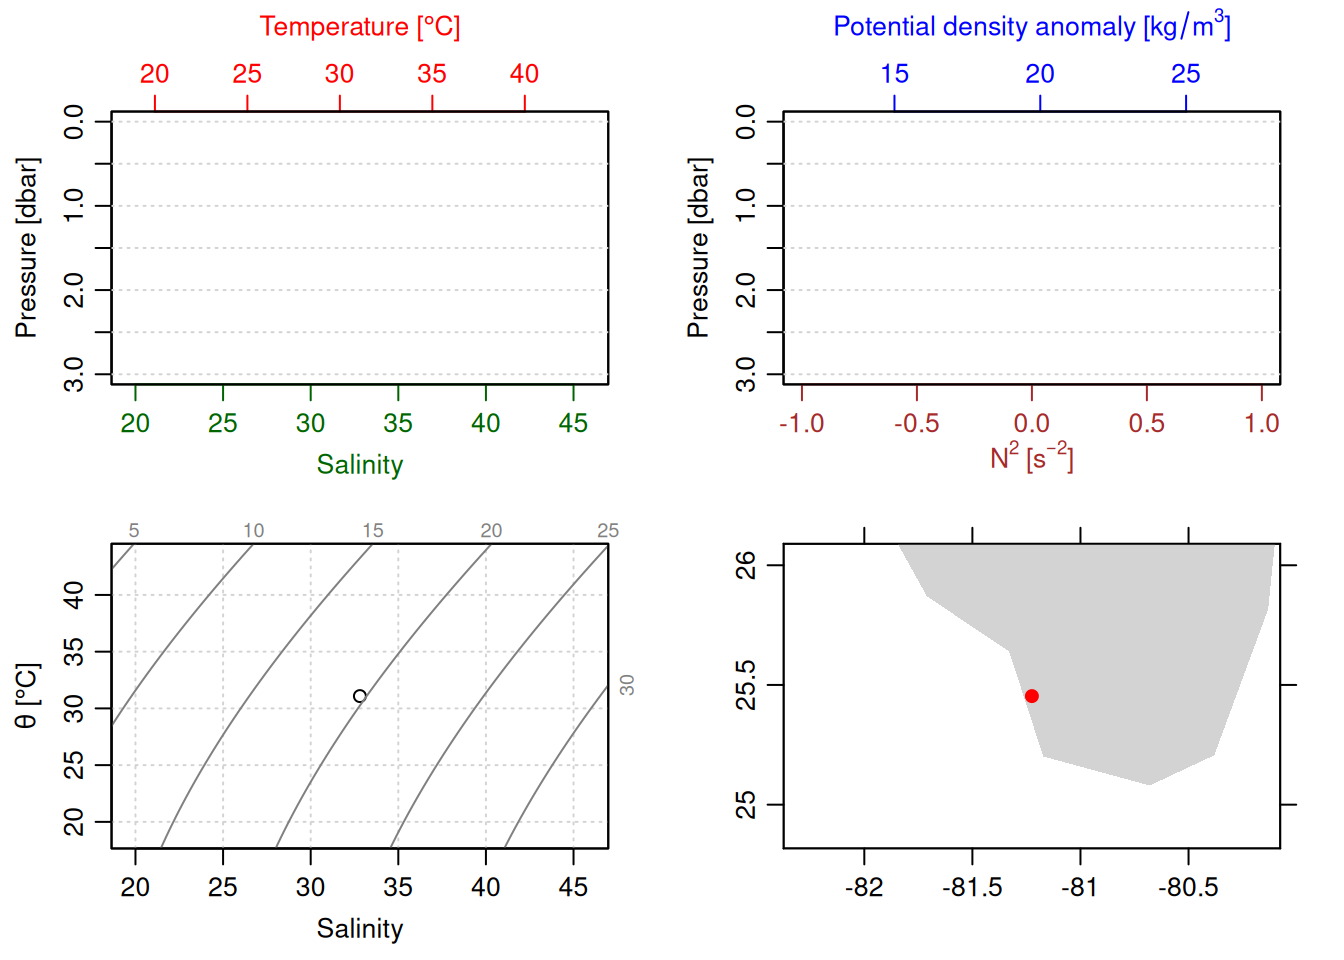
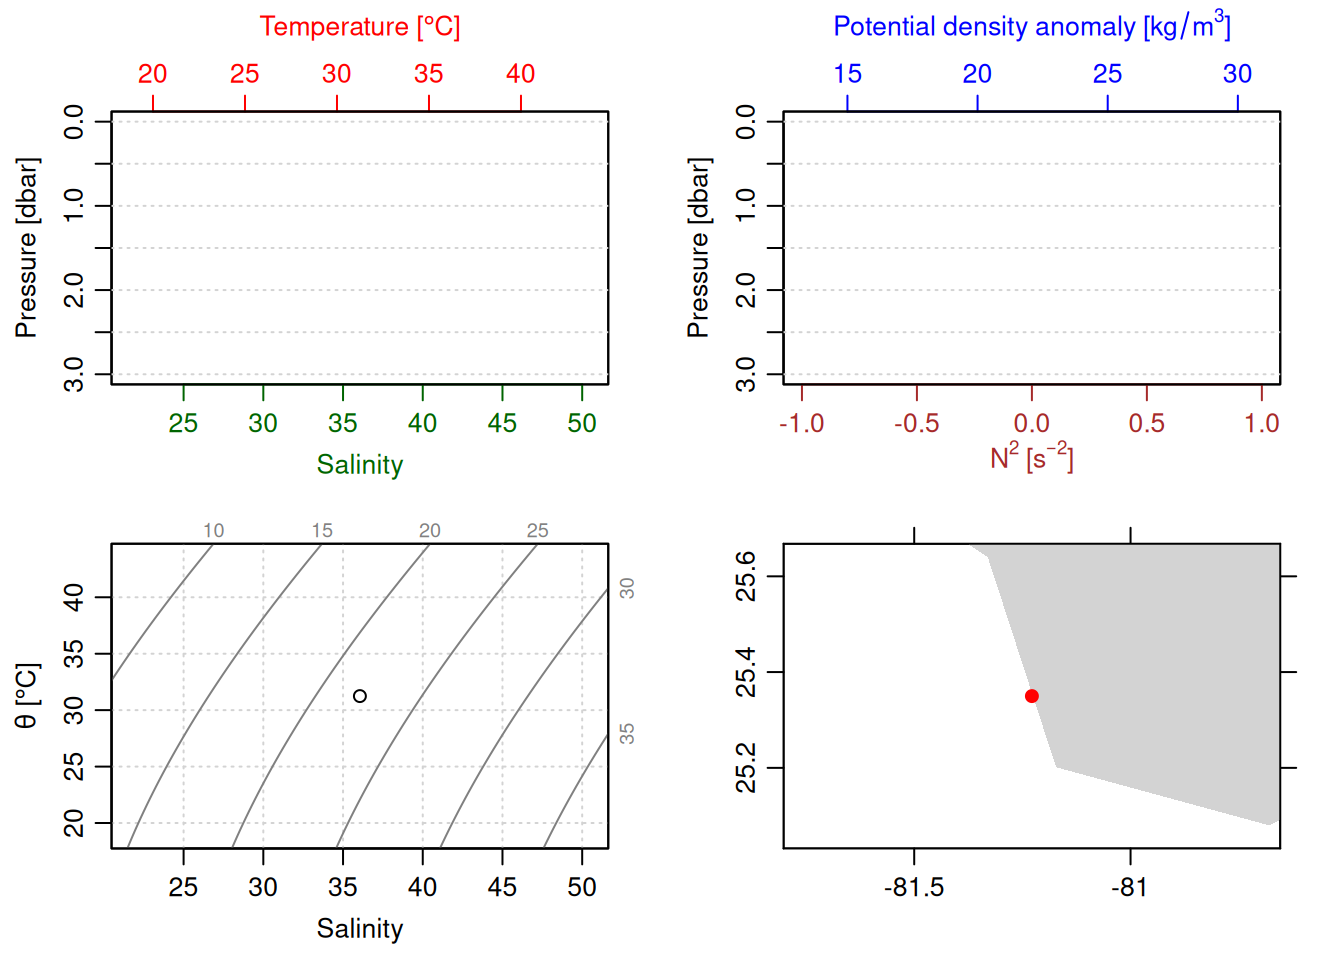
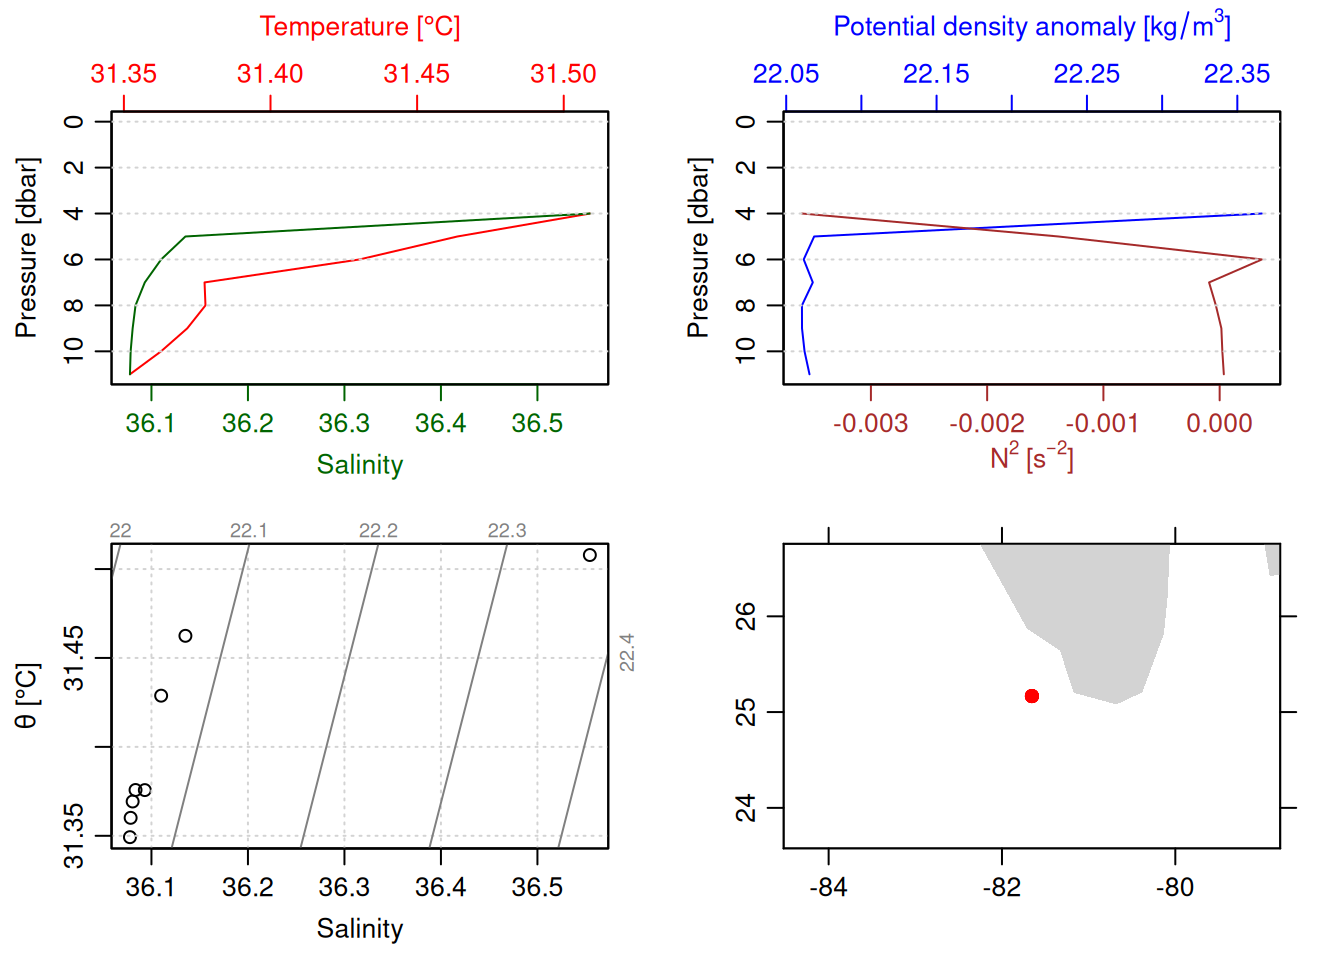
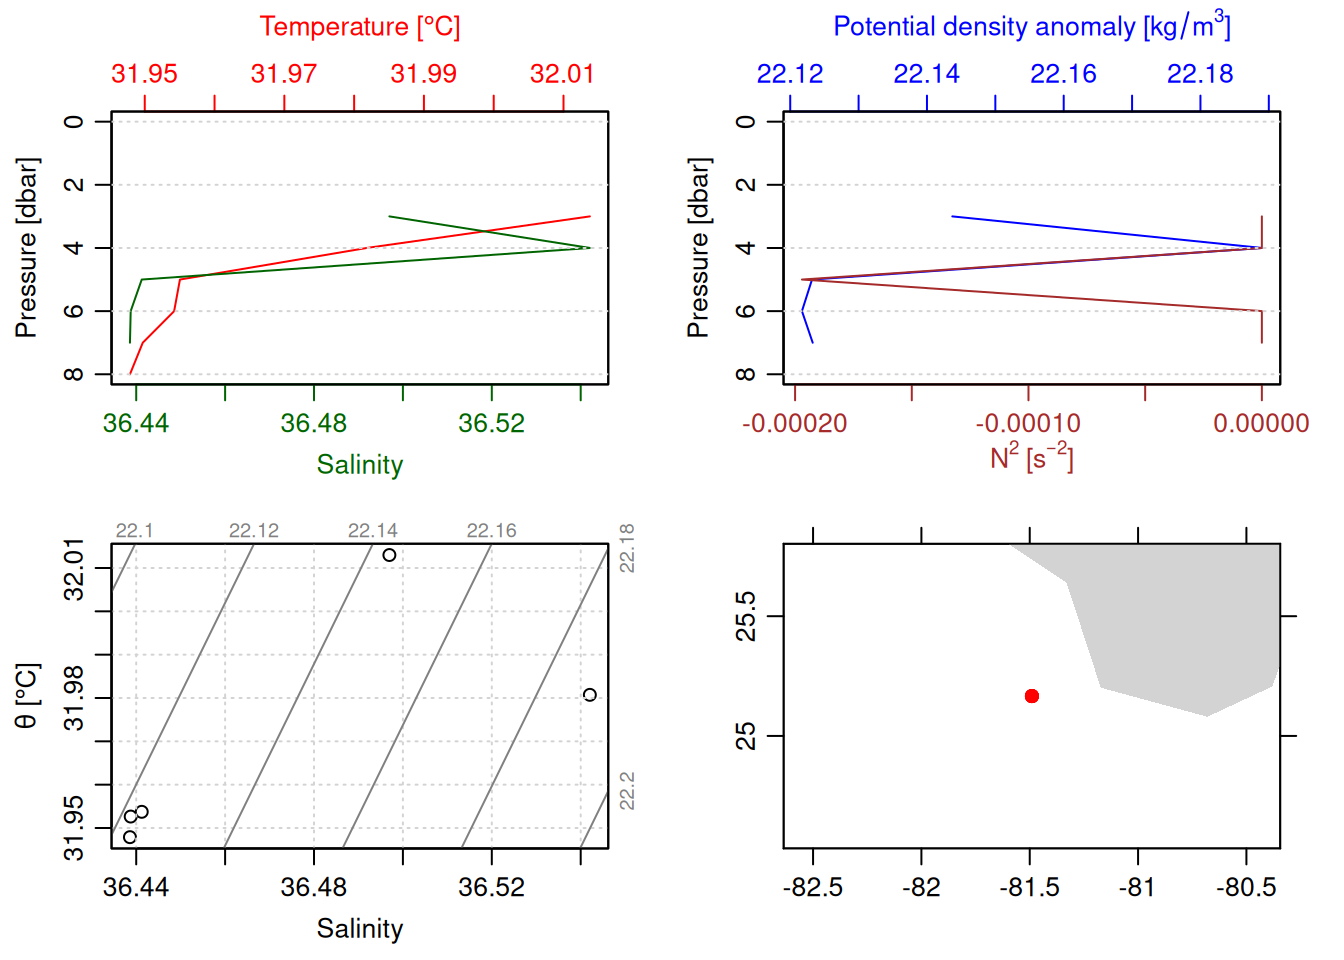
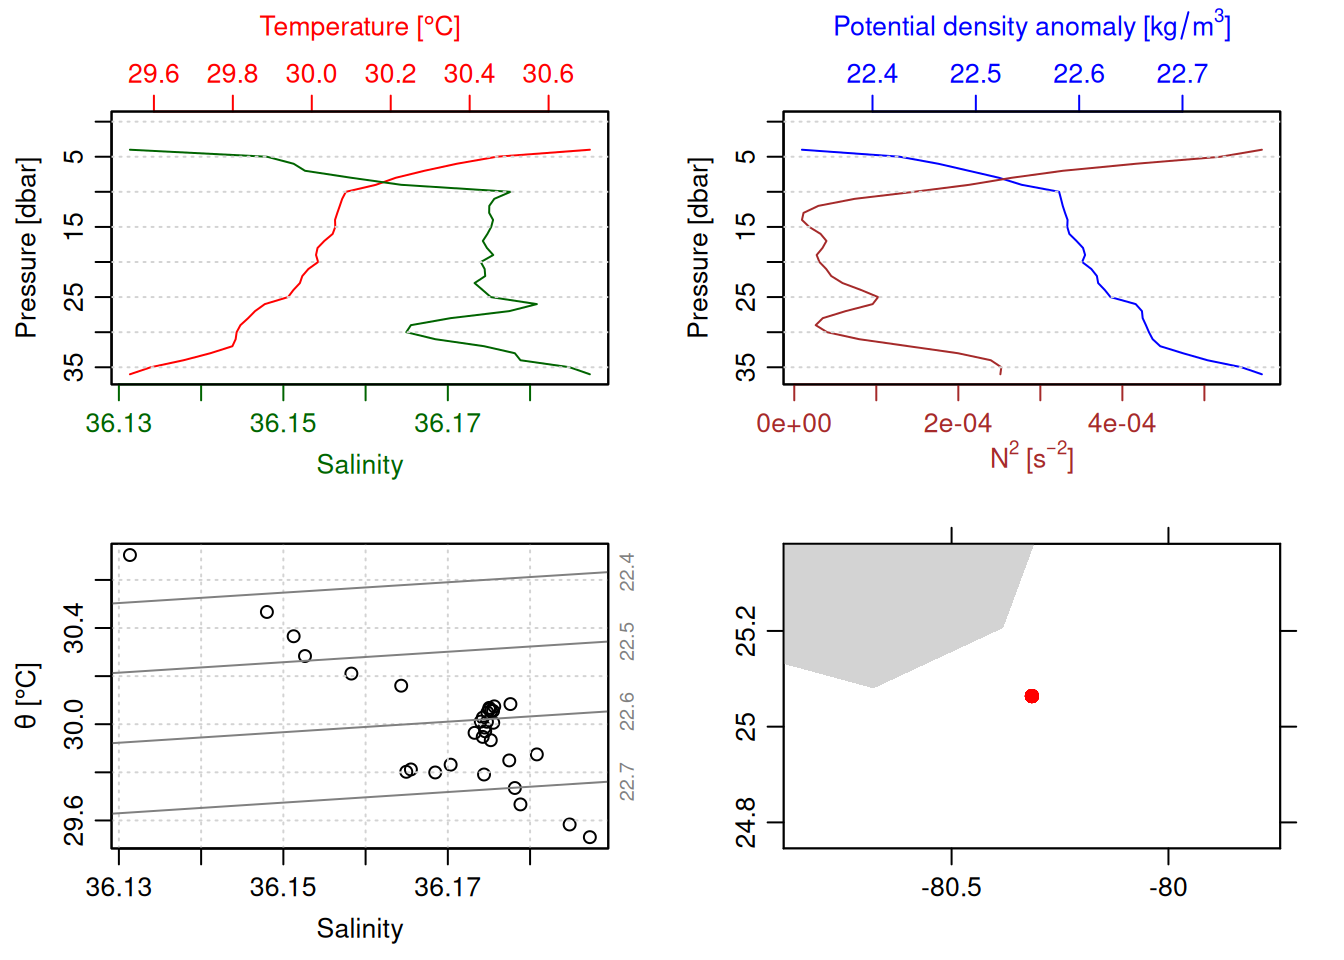
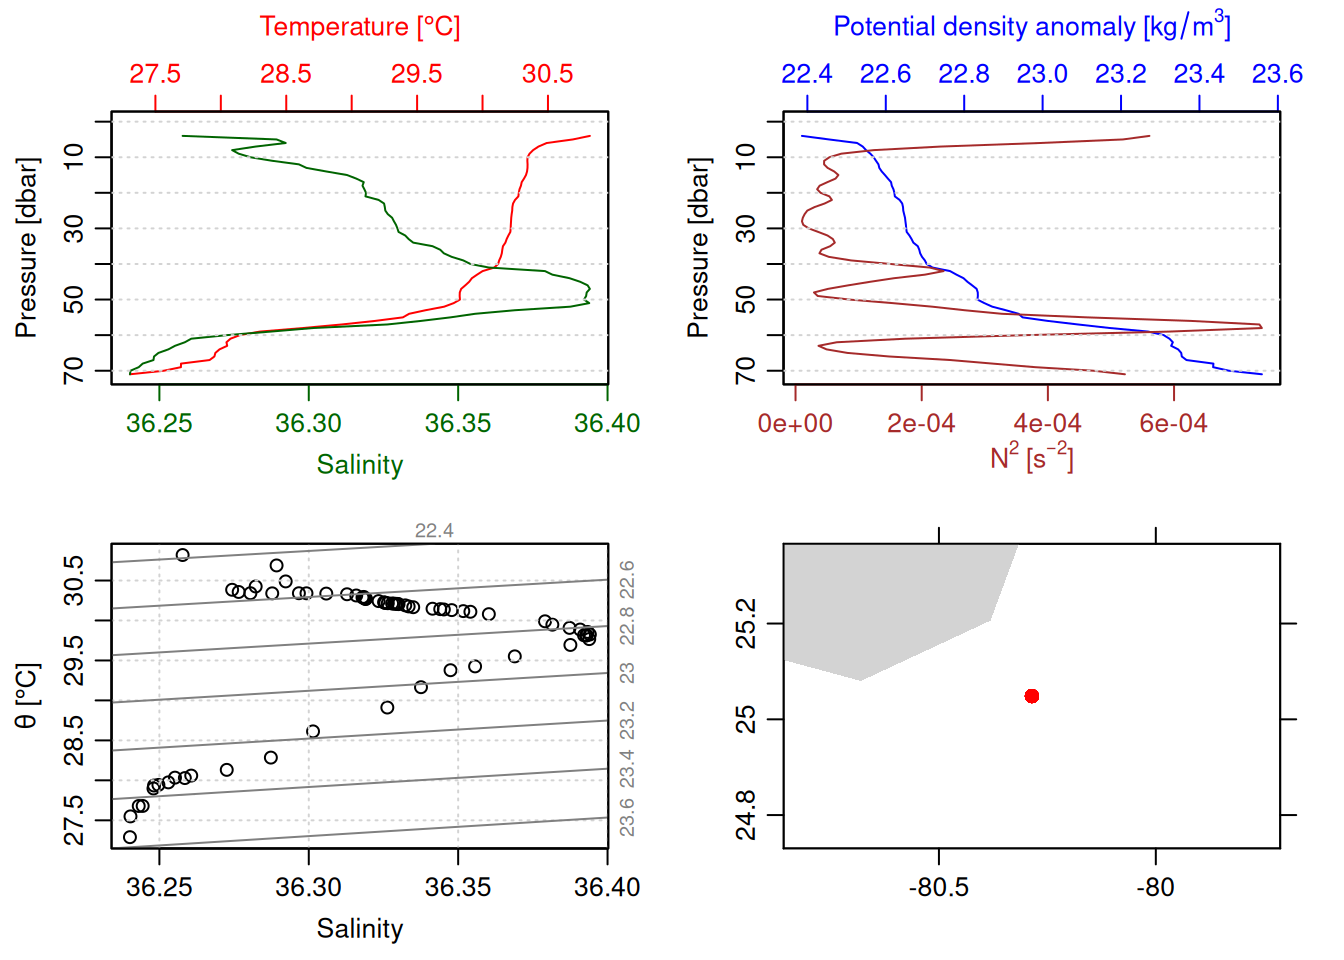
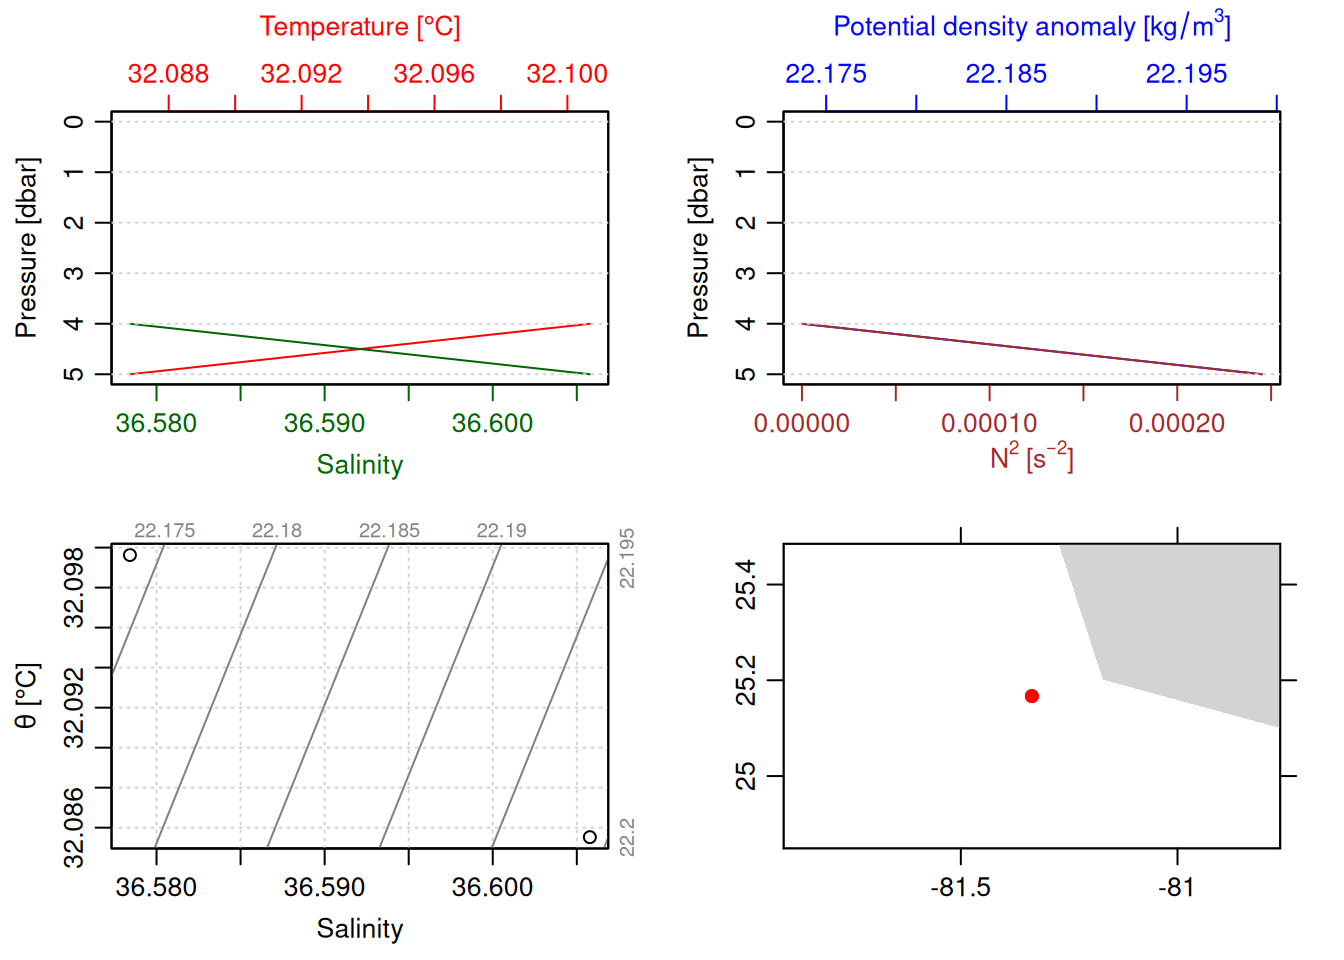
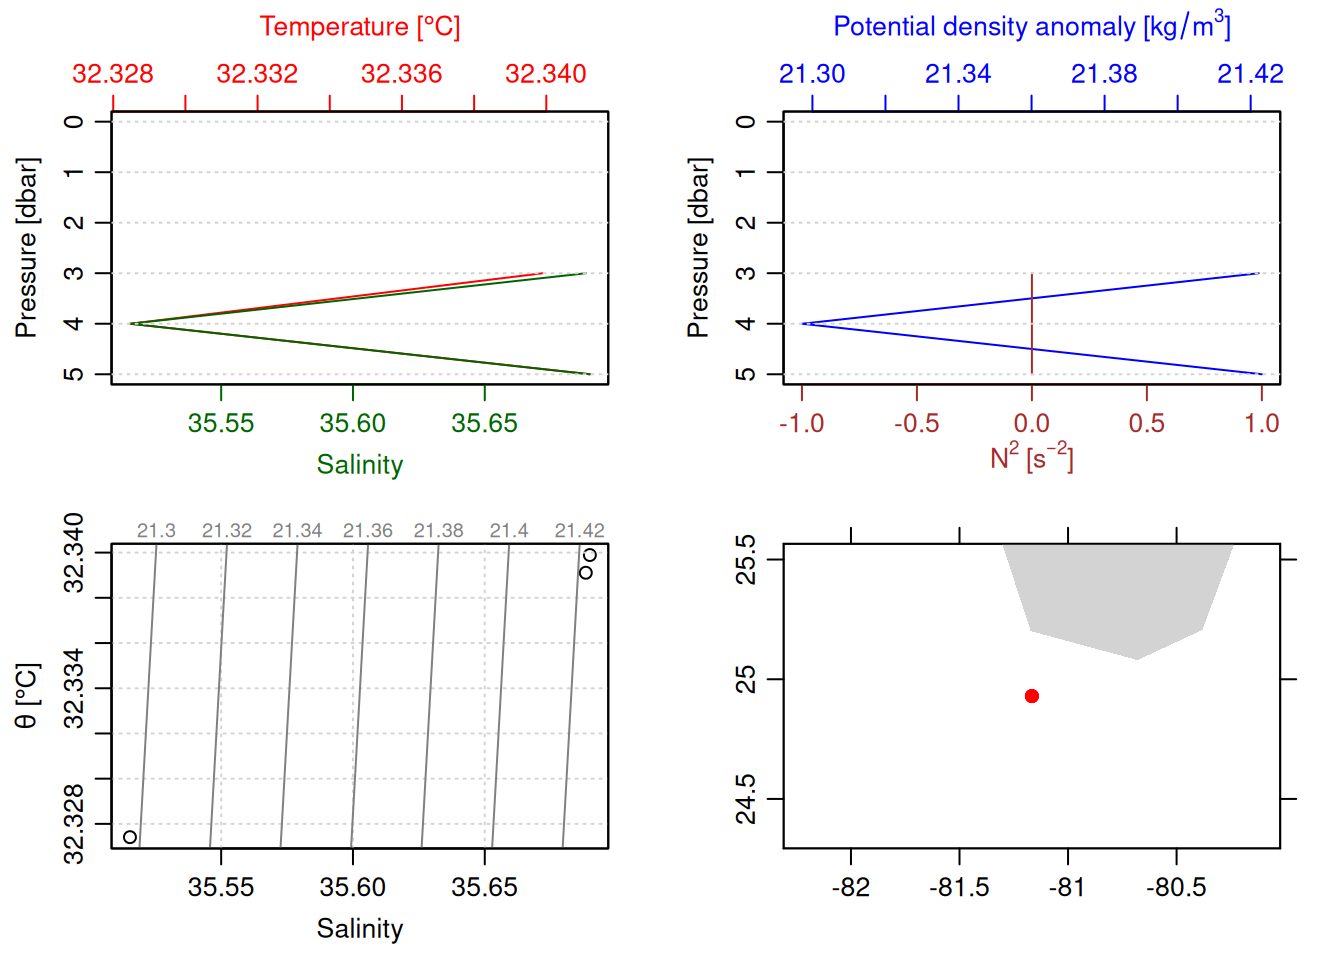
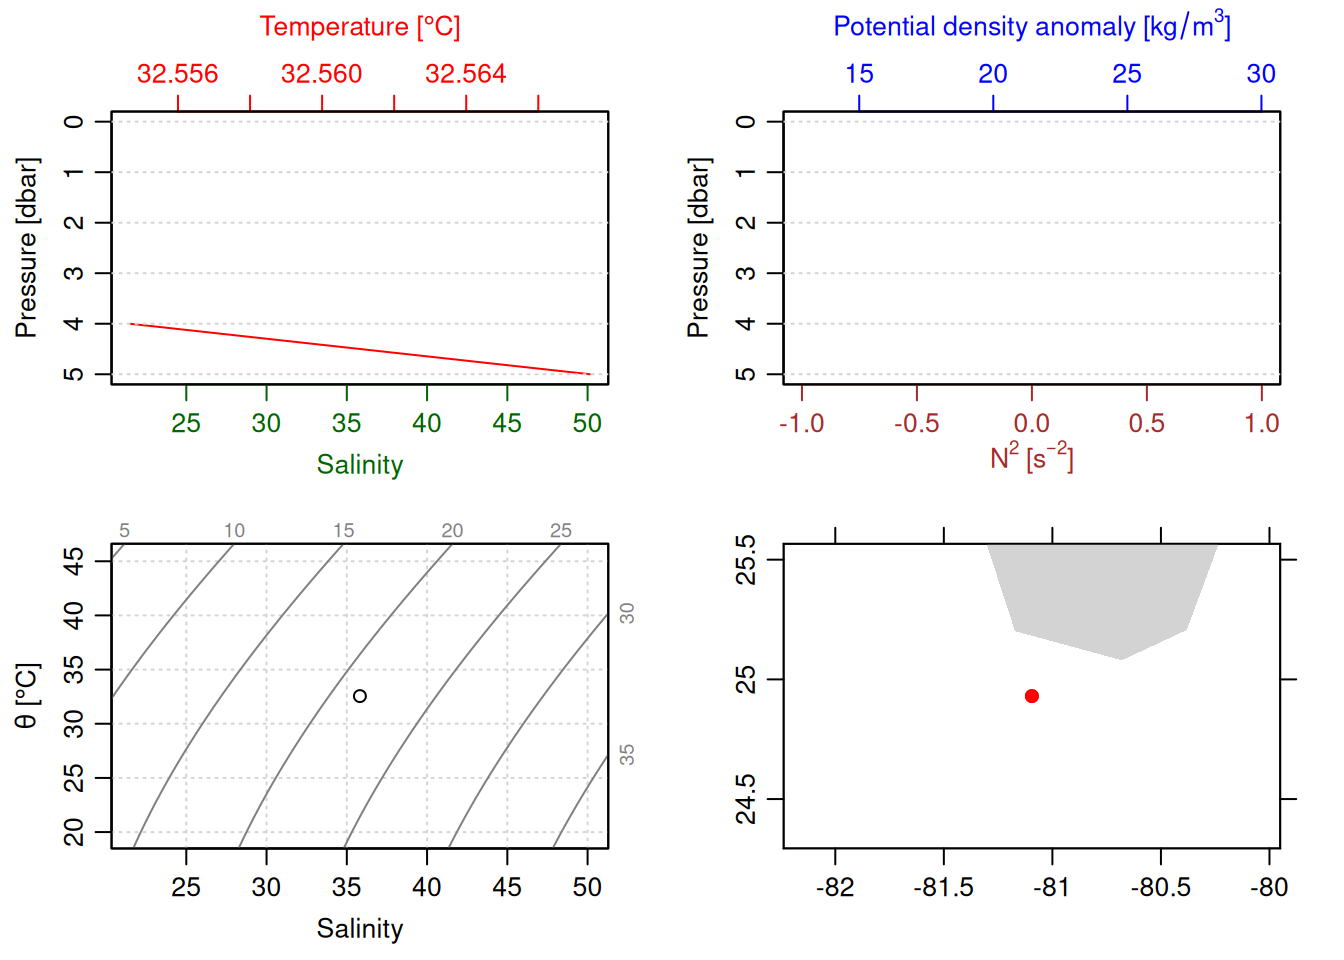
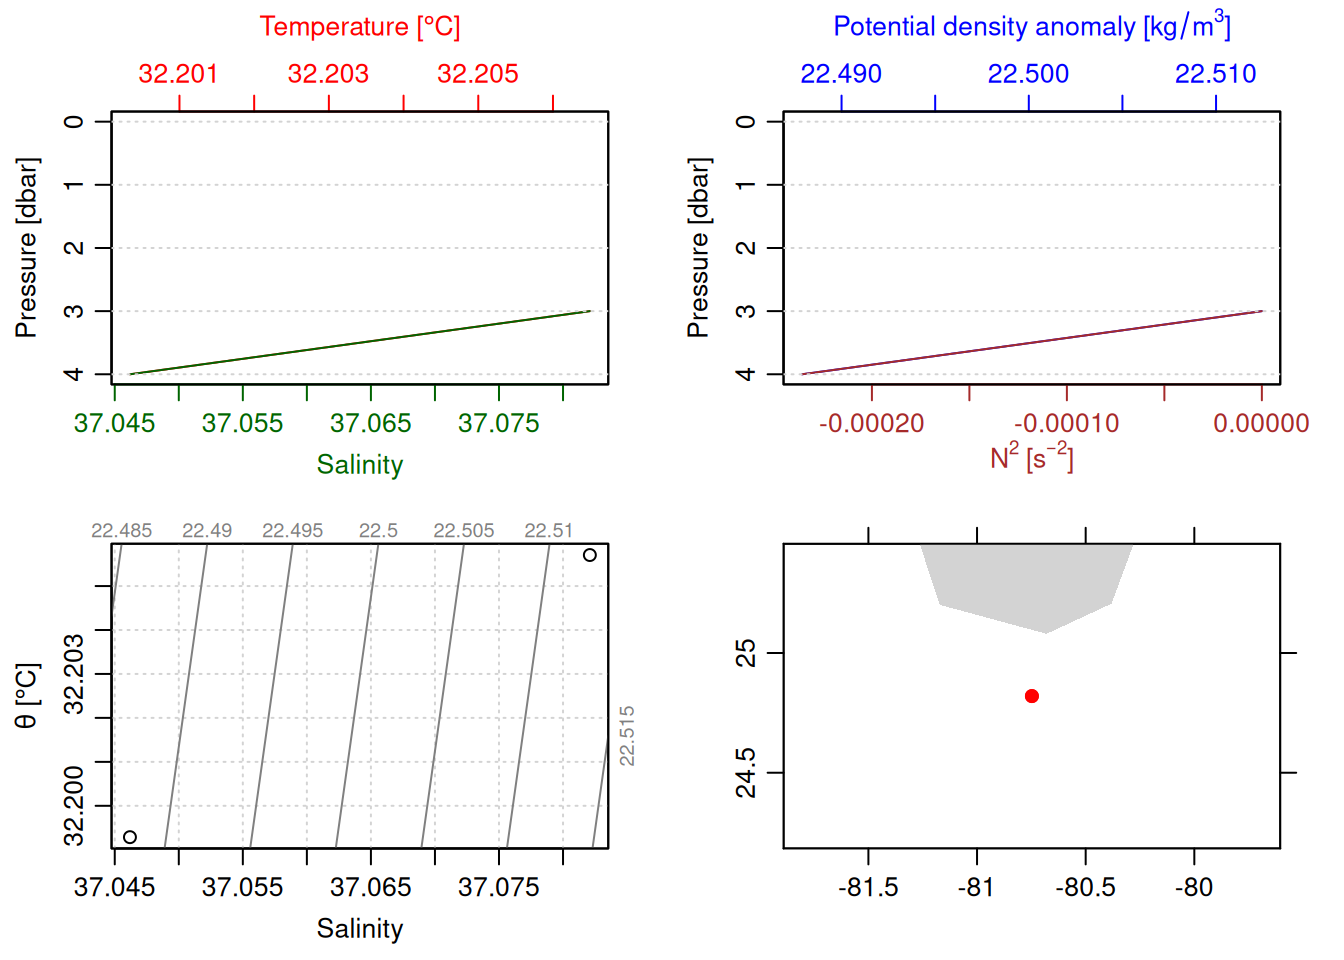
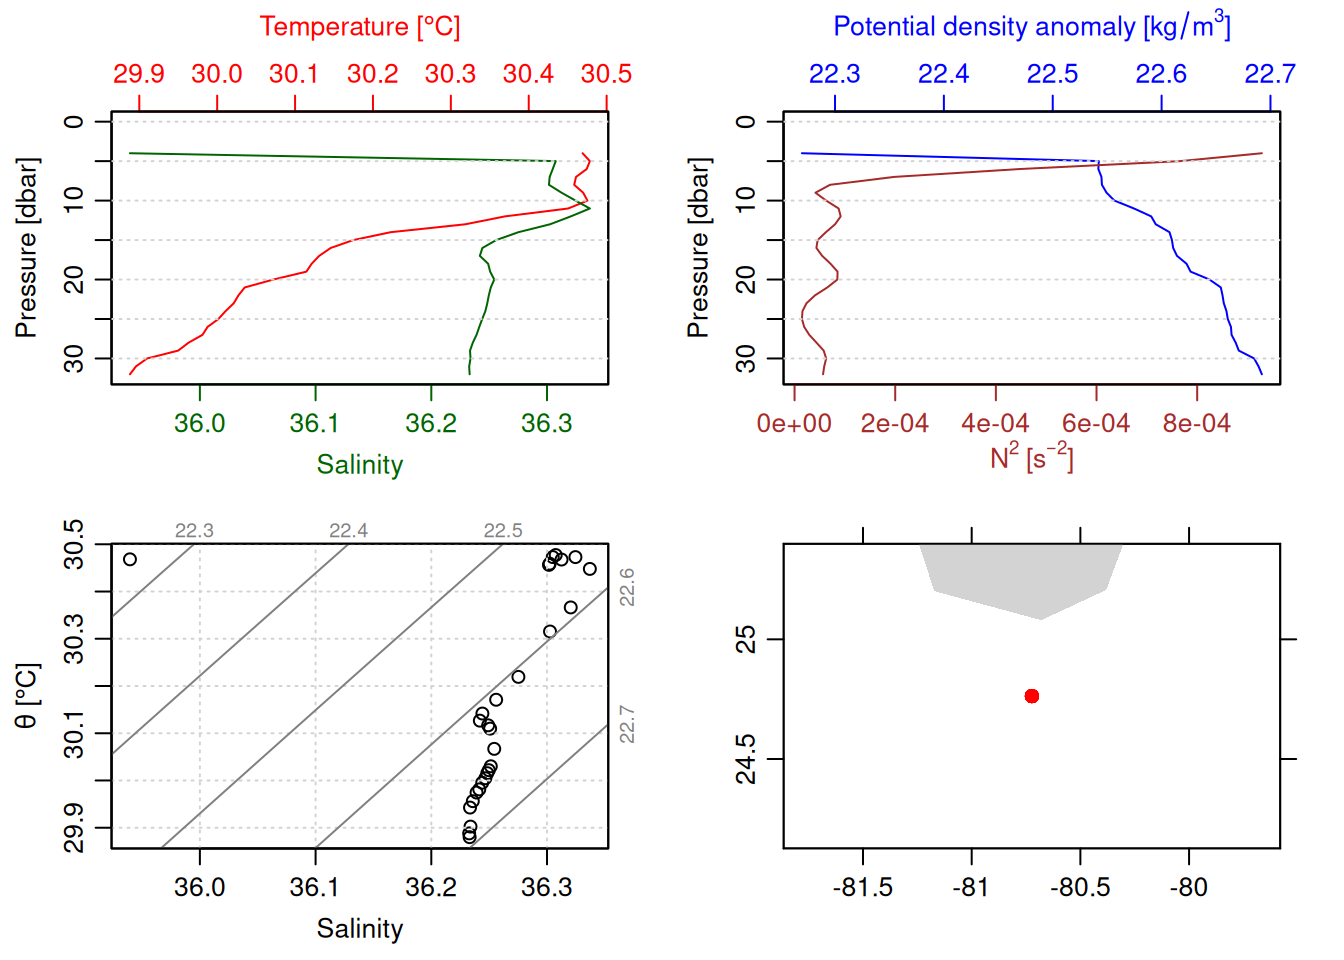
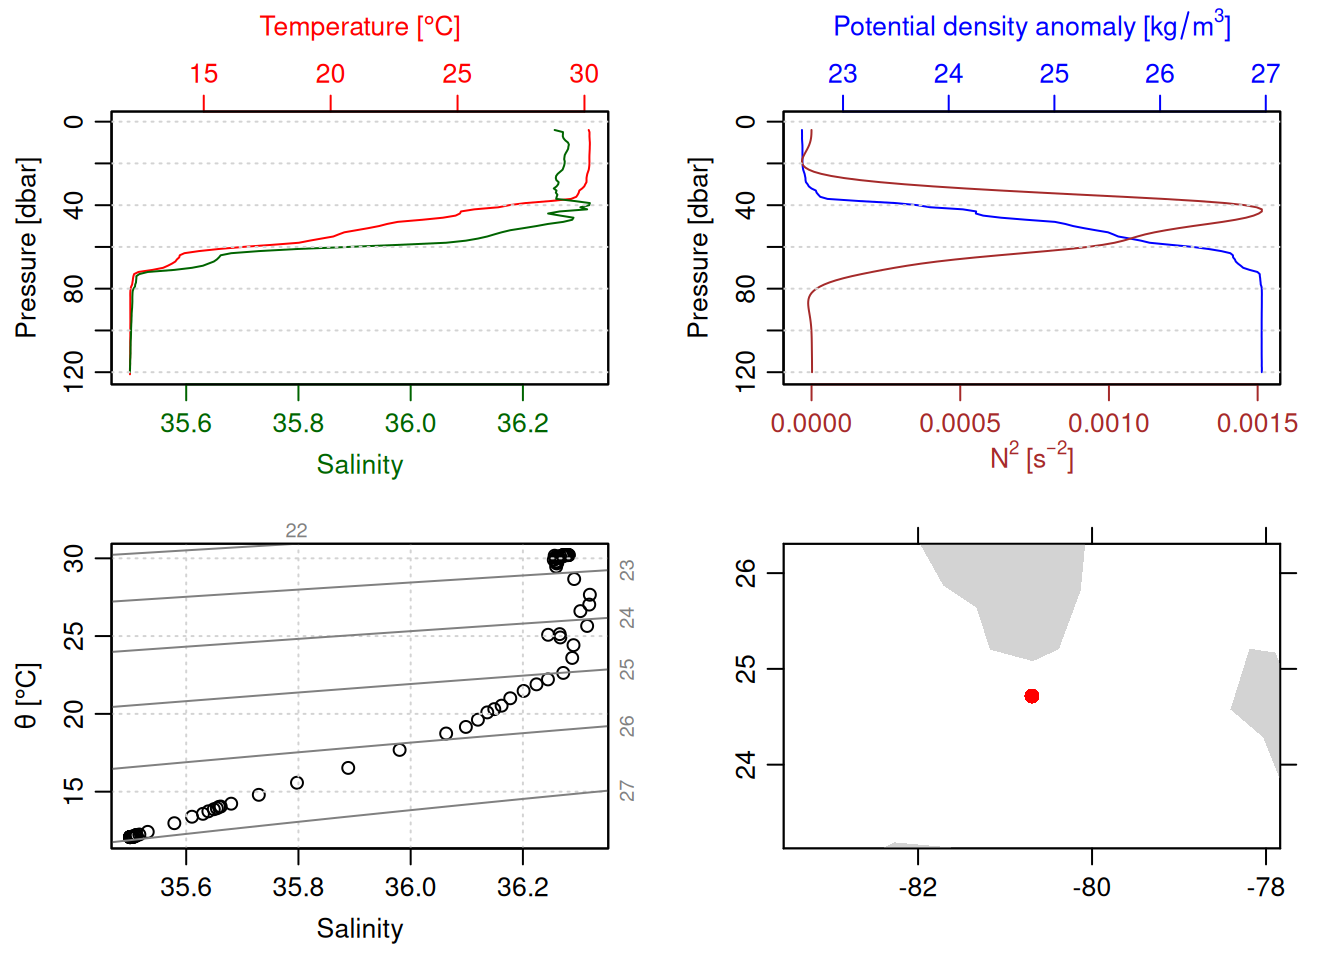
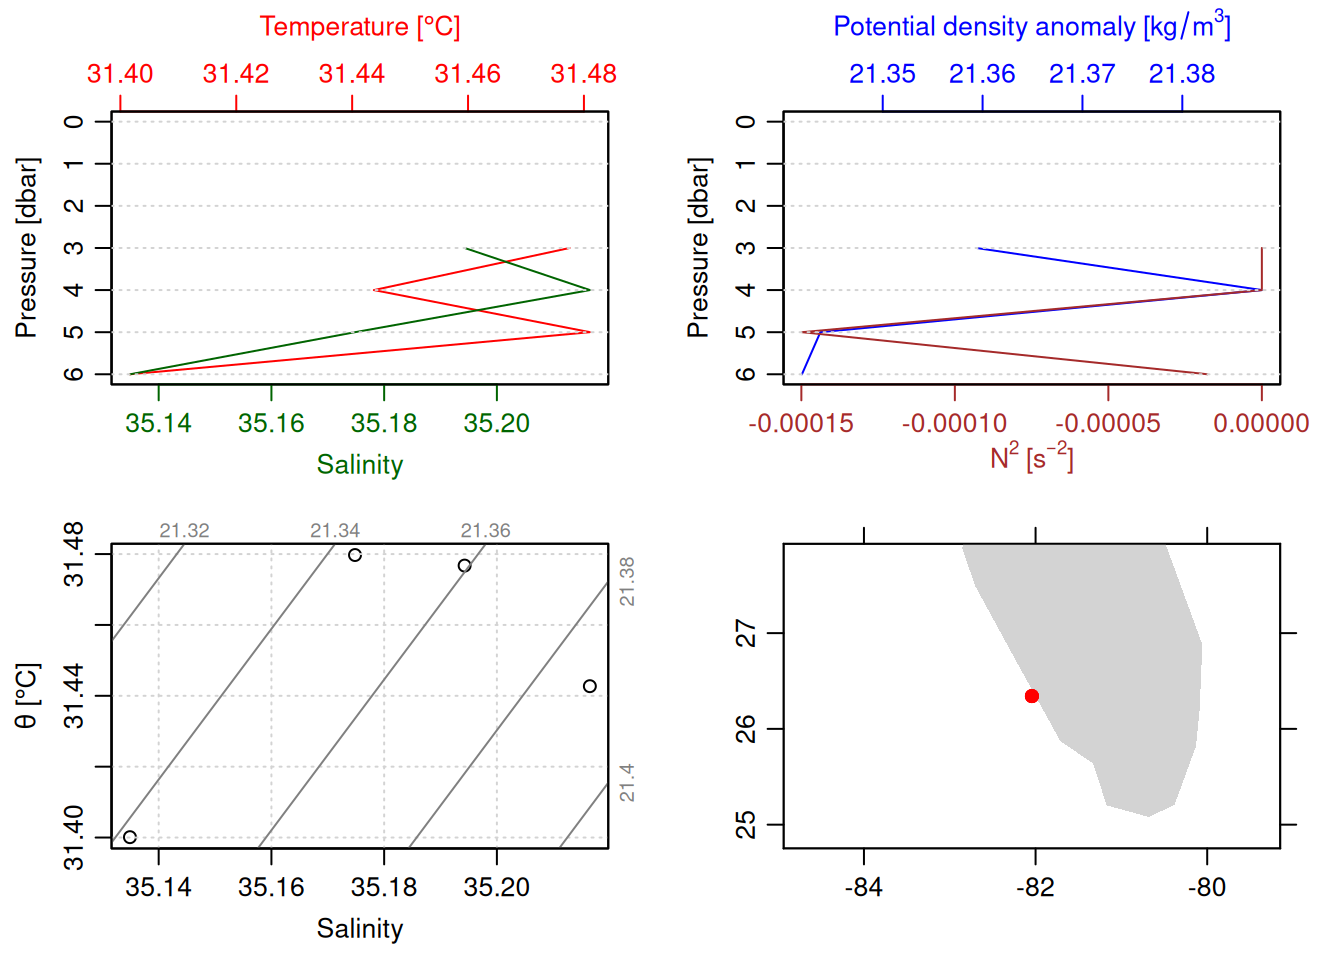
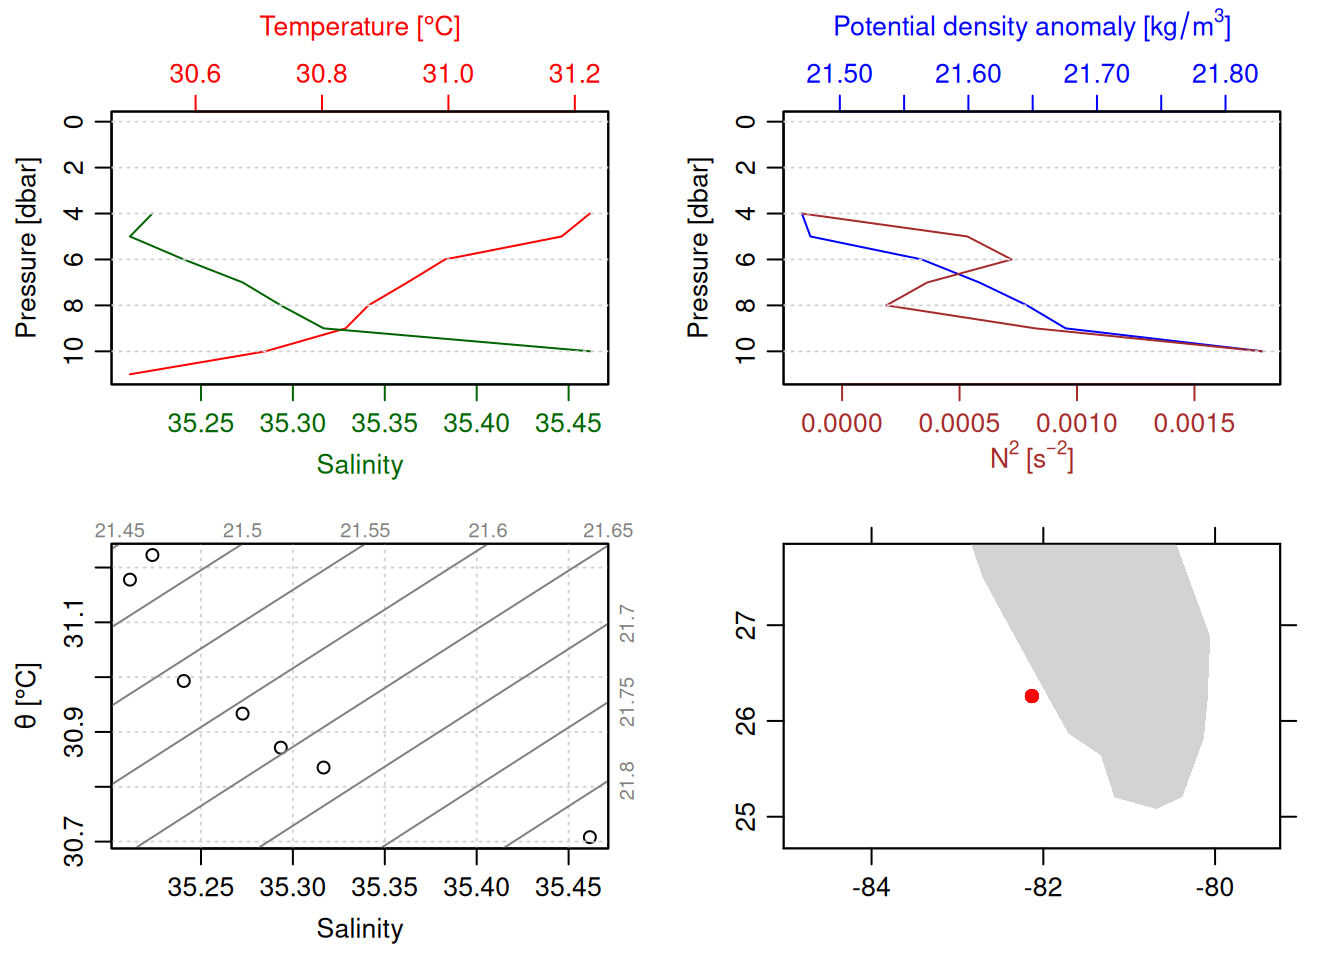
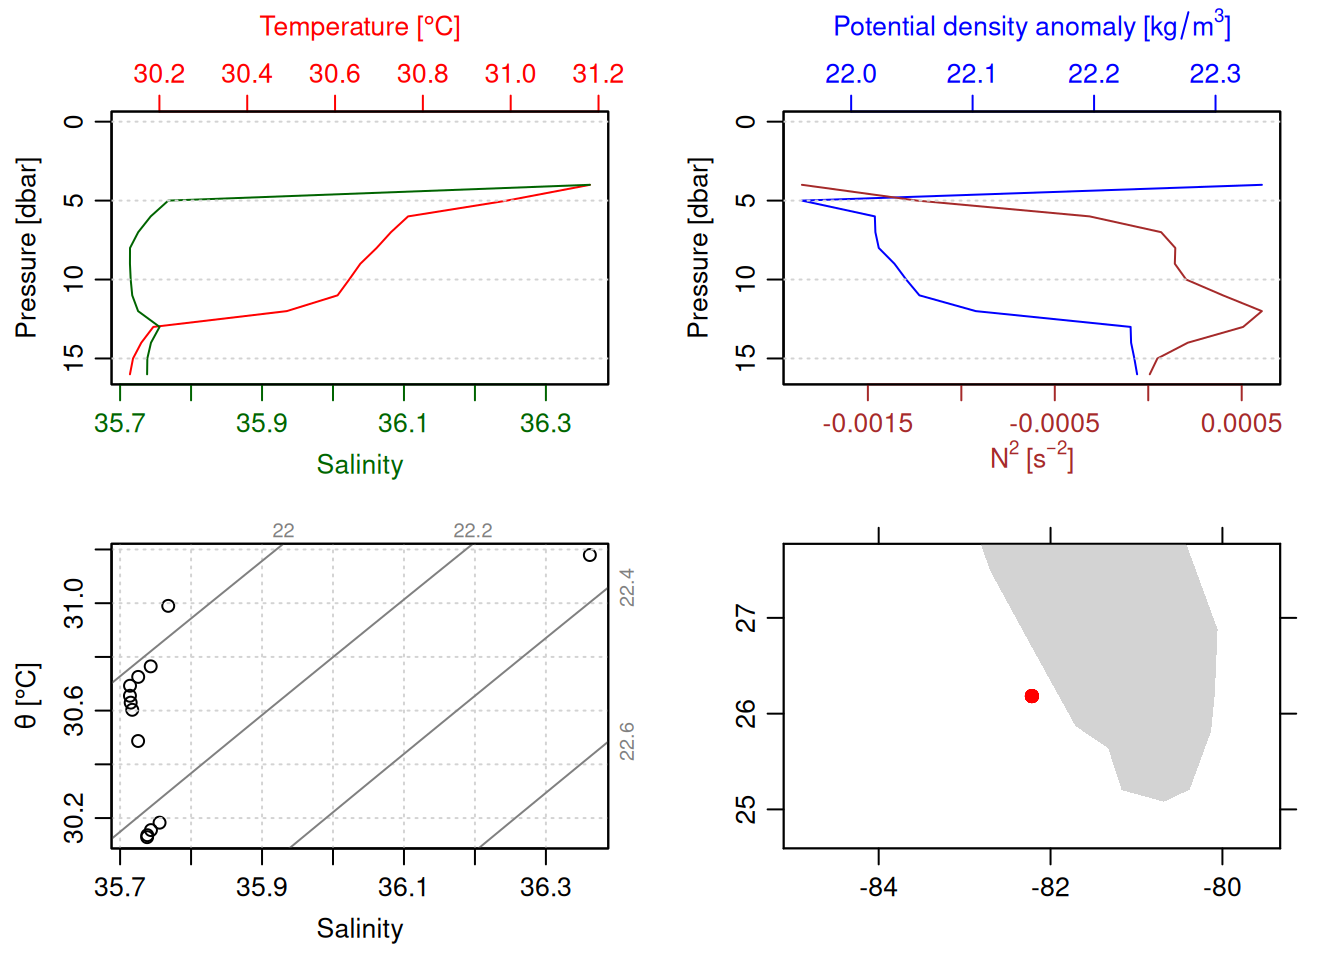
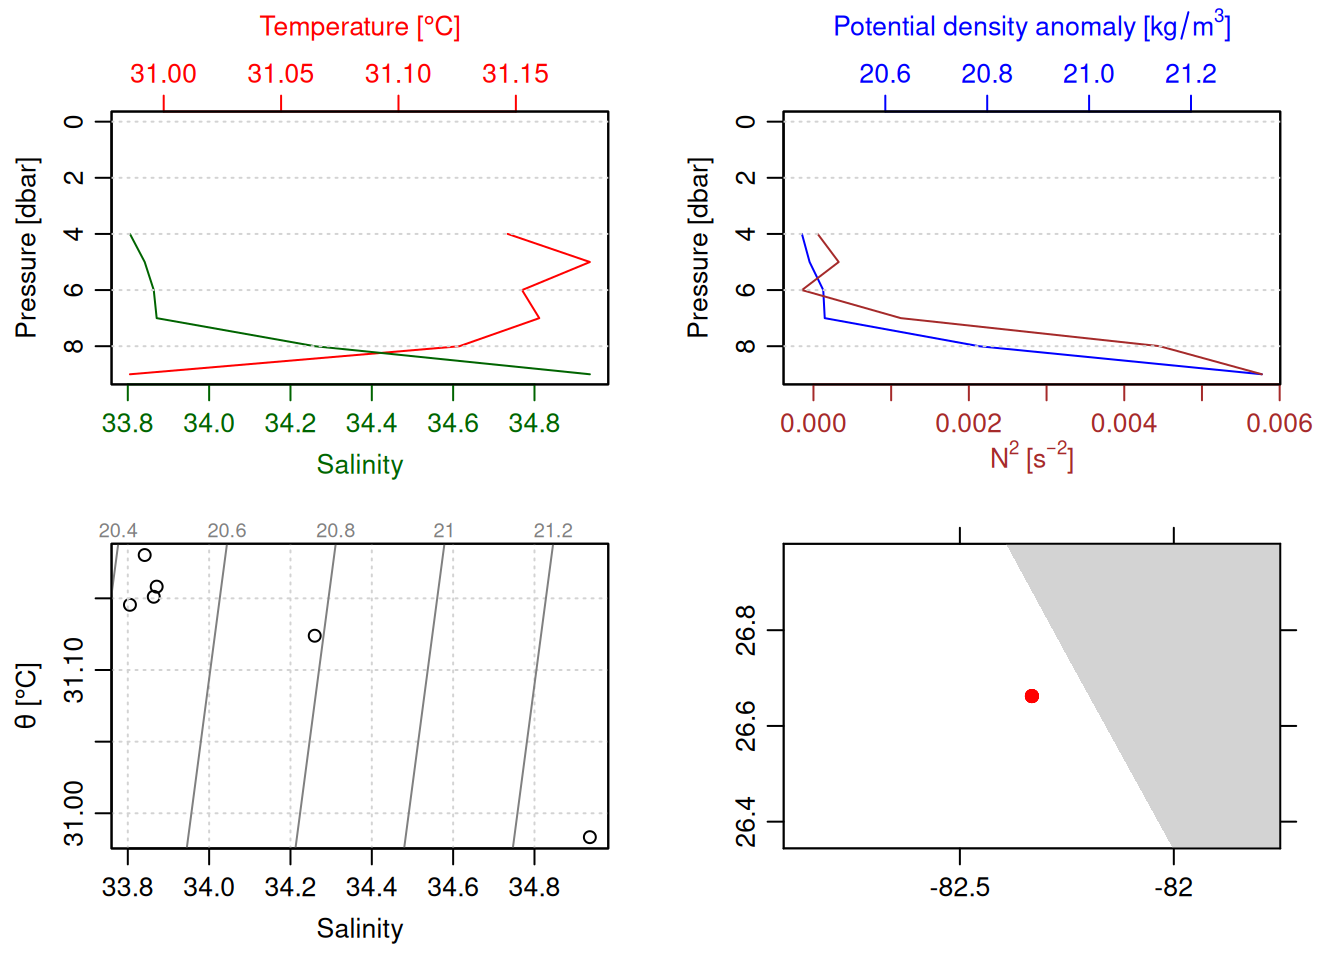
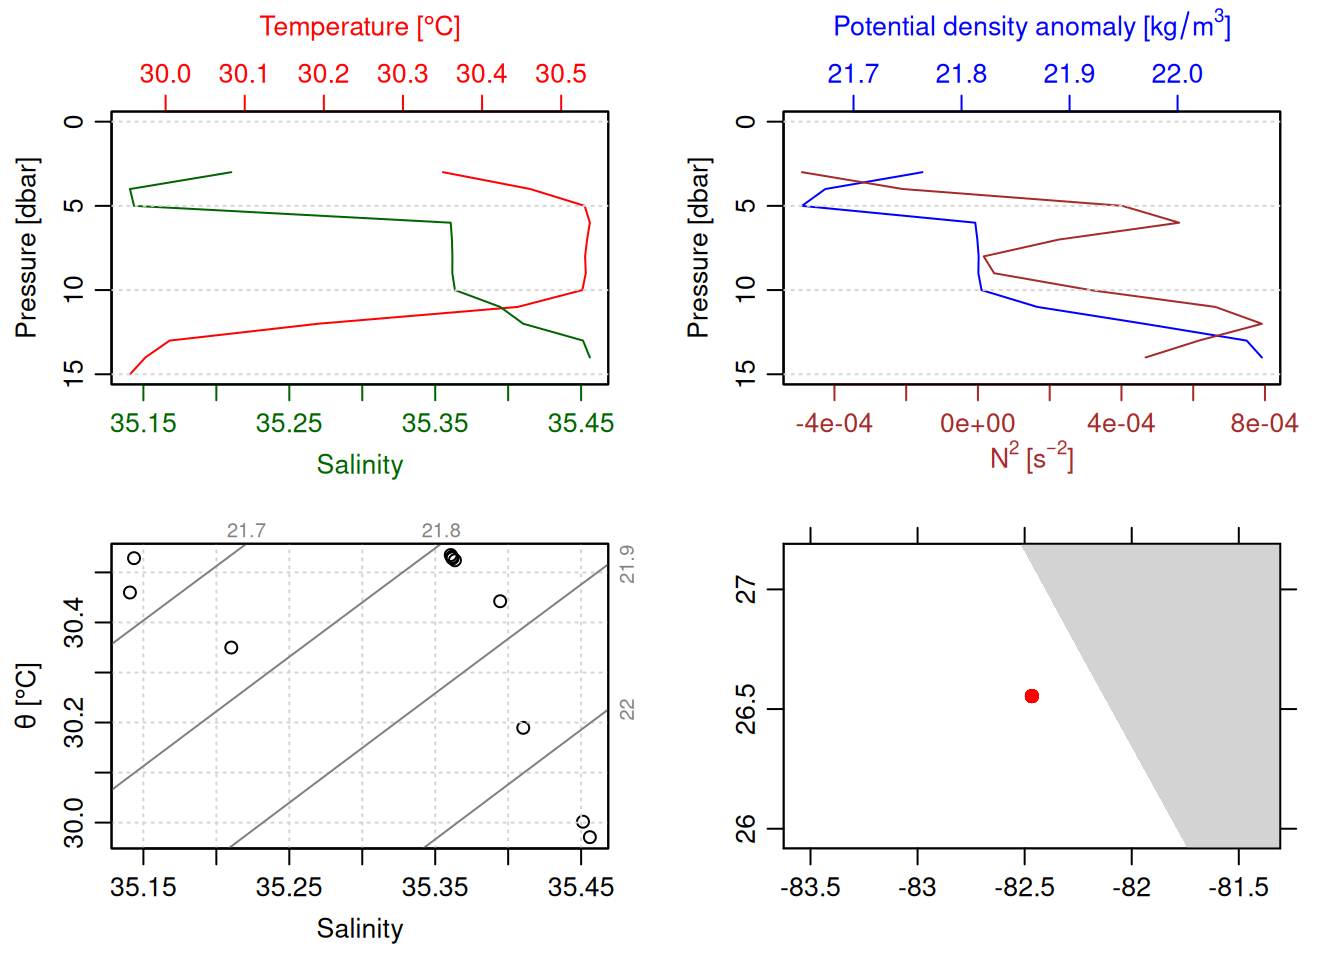
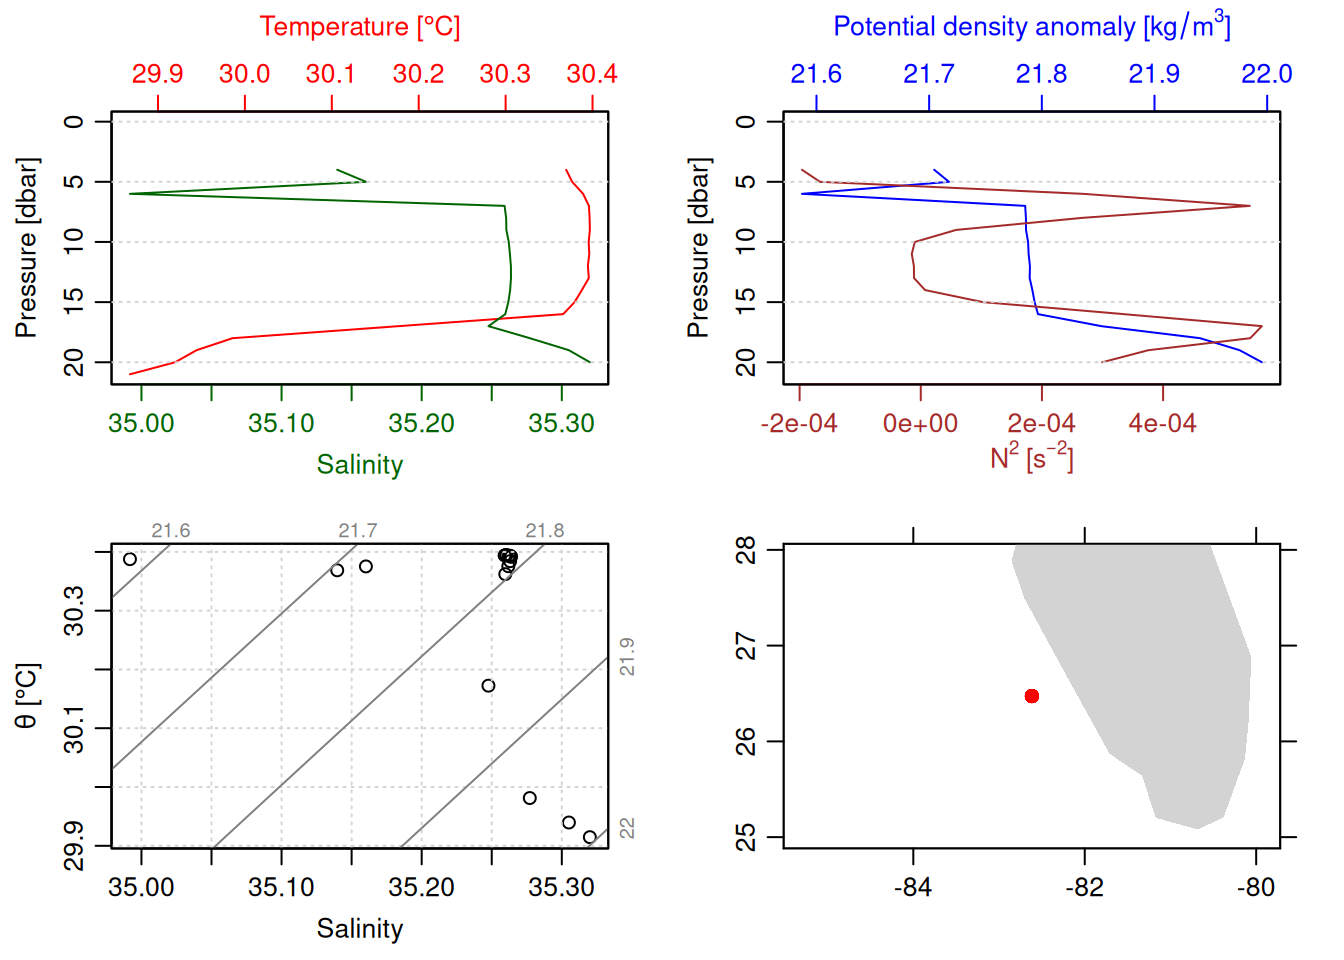
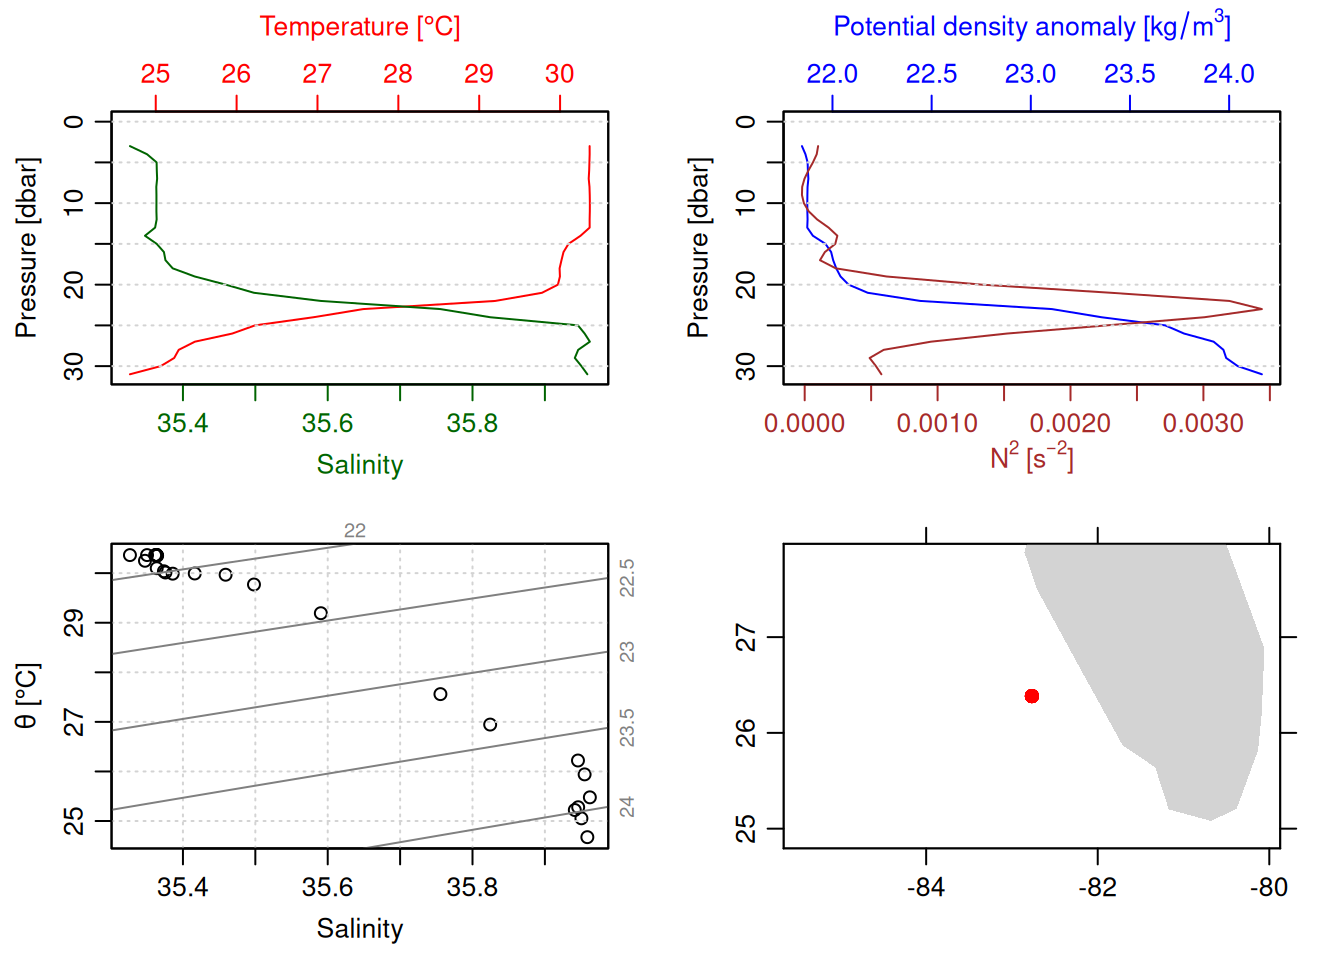
for (i inseq(ctd_FK)){ cast <- ctd_FK[[i]] # 1 is selecting only the first sublisttryCatch({plot(ctdDecimate(ctdTrim(cast))) }, error =function(e){print(e) })}
<simpleError in !is.null(x@metadata$station) && !is.na(x@metadata$station): 'length = 5369' in coercion to 'logical(1)'>
<simpleError in !is.null(x@metadata$station) && !is.na(x@metadata$station): 'length = 1998' in coercion to 'logical(1)'>
<simpleError in !is.null(x@metadata$station) && !is.na(x@metadata$station): 'length = 1886' in coercion to 'logical(1)'>
<simpleError in !is.null(x@metadata$station) && !is.na(x@metadata$station): 'length = 2960' in coercion to 'logical(1)'>
<simpleError in !is.null(x@metadata$station) && !is.na(x@metadata$station): 'length = 1628' in coercion to 'logical(1)'>
<simpleError in !is.null(x@metadata$station) && !is.na(x@metadata$station): 'length = 4617' in coercion to 'logical(1)'>
<simpleError in !is.null(x@metadata$station) && !is.na(x@metadata$station): 'length = 7497' in coercion to 'logical(1)'>
<simpleError in !is.null(x@metadata$station) && !is.na(x@metadata$station): 'length = 2304' in coercion to 'logical(1)'>
<simpleError in !is.null(x@metadata$station) && !is.na(x@metadata$station): 'length = 2897' in coercion to 'logical(1)'>
<simpleError in !is.null(x@metadata$station) && !is.na(x@metadata$station): 'length = 2380' in coercion to 'logical(1)'>
<simpleError in !is.null(x@metadata$station) && !is.na(x@metadata$station): 'length = 31' in coercion to 'logical(1)'>
<simpleError in !is.null(x@metadata$station) && !is.na(x@metadata$station): 'length = 197' in coercion to 'logical(1)'>
<simpleError in !is.null(x@metadata$station) && !is.na(x@metadata$station): 'length = 1116' in coercion to 'logical(1)'>
<simpleError in !is.null(x@metadata$station) && !is.na(x@metadata$station): 'length = 3994' in coercion to 'logical(1)'>
<simpleError in !is.null(x@metadata$station) && !is.na(x@metadata$station): 'length = 6540' in coercion to 'logical(1)'>
<simpleError in !is.null(x@metadata$station) && !is.na(x@metadata$station): 'length = 1917' in coercion to 'logical(1)'>
<simpleError in !is.null(x@metadata$station) && !is.na(x@metadata$station): 'length = 6711' in coercion to 'logical(1)'>
<simpleError in !is.null(x@metadata$station) && !is.na(x@metadata$station): 'length = 797' in coercion to 'logical(1)'>
<simpleError in !is.null(x@metadata$station) && !is.na(x@metadata$station): 'length = 706' in coercion to 'logical(1)'>
<simpleError in !is.null(x@metadata$station) && !is.na(x@metadata$station): 'length = 6512' in coercion to 'logical(1)'>
<simpleError in !is.null(x@metadata$station) && !is.na(x@metadata$station): 'length = 3241' in coercion to 'logical(1)'>
<simpleError in !is.null(x@metadata$station) && !is.na(x@metadata$station): 'length = 2364' in coercion to 'logical(1)'>
<simpleError in !is.null(x@metadata$station) && !is.na(x@metadata$station): 'length = 2374' in coercion to 'logical(1)'>
<simpleError in !is.null(x@metadata$station) && !is.na(x@metadata$station): 'length = 2161' in coercion to 'logical(1)'>
<simpleError in !is.null(x@metadata$station) && !is.na(x@metadata$station): 'length = 37' in coercion to 'logical(1)'>
<simpleError in !is.null(x@metadata$station) && !is.na(x@metadata$station): 'length = 2731' in coercion to 'logical(1)'>
<simpleError in !is.null(x@metadata$station) && !is.na(x@metadata$station): 'length = 2783' in coercion to 'logical(1)'>
<simpleError in !is.null(x@metadata$station) && !is.na(x@metadata$station): 'length = 2915' in coercion to 'logical(1)'>
<simpleError in !is.null(x@metadata$station) && !is.na(x@metadata$station): 'length = 2591' in coercion to 'logical(1)'>
<simpleError in !is.null(x@metadata$station) && !is.na(x@metadata$station): 'length = 918' in coercion to 'logical(1)'>
<simpleError in !is.null(x@metadata$station) && !is.na(x@metadata$station): 'length = 51' in coercion to 'logical(1)'>
<simpleError in !is.null(x@metadata$station) && !is.na(x@metadata$station): 'length = 750' in coercion to 'logical(1)'>
<simpleError in !is.null(x@metadata$station) && !is.na(x@metadata$station): 'length = 431' in coercion to 'logical(1)'>
<simpleError in !is.null(x@metadata$station) && !is.na(x@metadata$station): 'length = 914' in coercion to 'logical(1)'>
<simpleError in !is.null(x@metadata$station) && !is.na(x@metadata$station): 'length = 925' in coercion to 'logical(1)'>
<simpleError in !is.null(x@metadata$station) && !is.na(x@metadata$station): 'length = 3301' in coercion to 'logical(1)'>
<simpleError in !is.null(x@metadata$station) && !is.na(x@metadata$station): 'length = 6410' in coercion to 'logical(1)'>
<simpleError in !is.null(x@metadata$station) && !is.na(x@metadata$station): 'length = 549' in coercion to 'logical(1)'>
<simpleError in !is.null(x@metadata$station) && !is.na(x@metadata$station): 'length = 2590' in coercion to 'logical(1)'>
<simpleError in !is.null(x@metadata$station) && !is.na(x@metadata$station): 'length = 2707' in coercion to 'logical(1)'>
<simpleError in !is.null(x@metadata$station) && !is.na(x@metadata$station): 'length = 2499' in coercion to 'logical(1)'>
<simpleError in !is.null(x@metadata$station) && !is.na(x@metadata$station): 'length = 2763' in coercion to 'logical(1)'>
<simpleError in !is.null(x@metadata$station) && !is.na(x@metadata$station): 'length = 6010' in coercion to 'logical(1)'>
<simpleError in !is.null(x@metadata$station) && !is.na(x@metadata$station): 'length = 105' in coercion to 'logical(1)'>
<simpleError in !is.null(x@metadata$station) && !is.na(x@metadata$station): 'length = 1018' in coercion to 'logical(1)'>
<simpleError in !is.null(x@metadata$station) && !is.na(x@metadata$station): 'length = 2181' in coercion to 'logical(1)'>
<simpleError in !is.null(x@metadata$station) && !is.na(x@metadata$station): 'length = 1614' in coercion to 'logical(1)'>
<simpleError in !is.null(x@metadata$station) && !is.na(x@metadata$station): 'length = 1358' in coercion to 'logical(1)'>
<simpleError in !is.null(x@metadata$station) && !is.na(x@metadata$station): 'length = 1849' in coercion to 'logical(1)'>
<simpleError in !is.null(x@metadata$station) && !is.na(x@metadata$station): 'length = 2109' in coercion to 'logical(1)'>
<simpleError in !is.null(x@metadata$station) && !is.na(x@metadata$station): 'length = 4380' in coercion to 'logical(1)'>
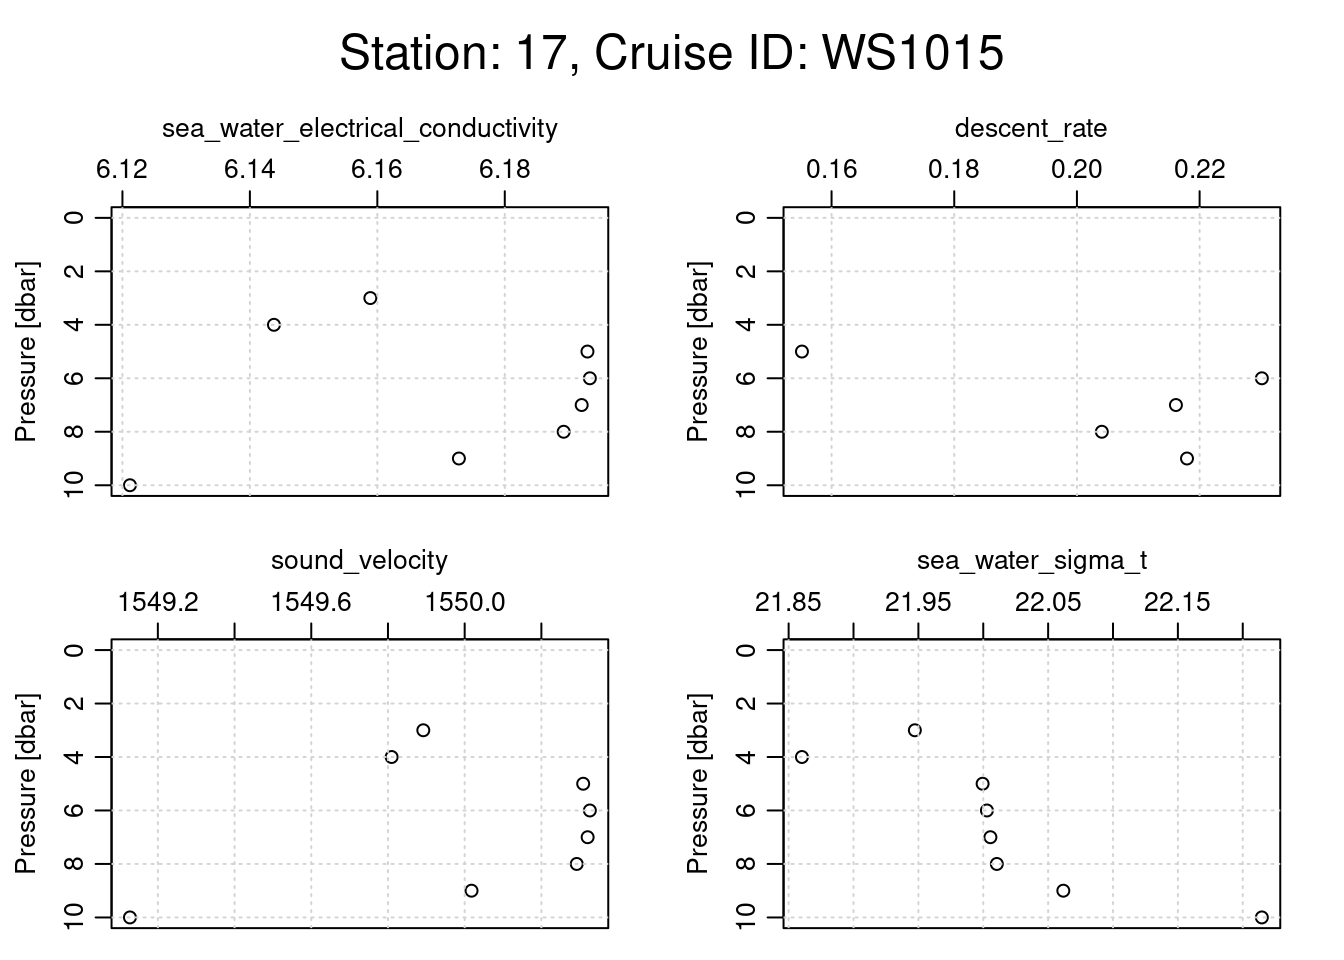
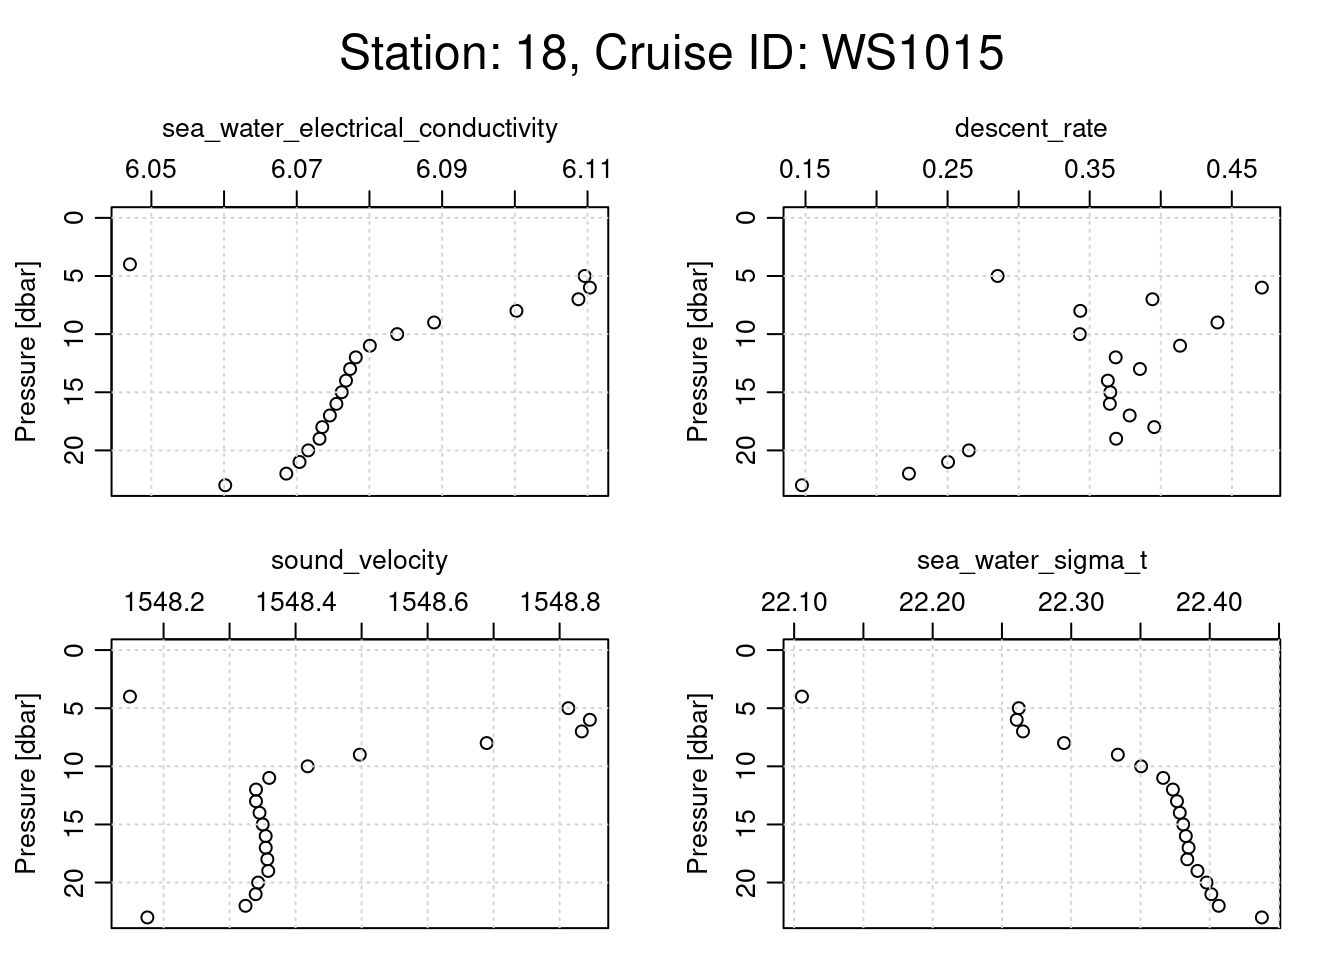
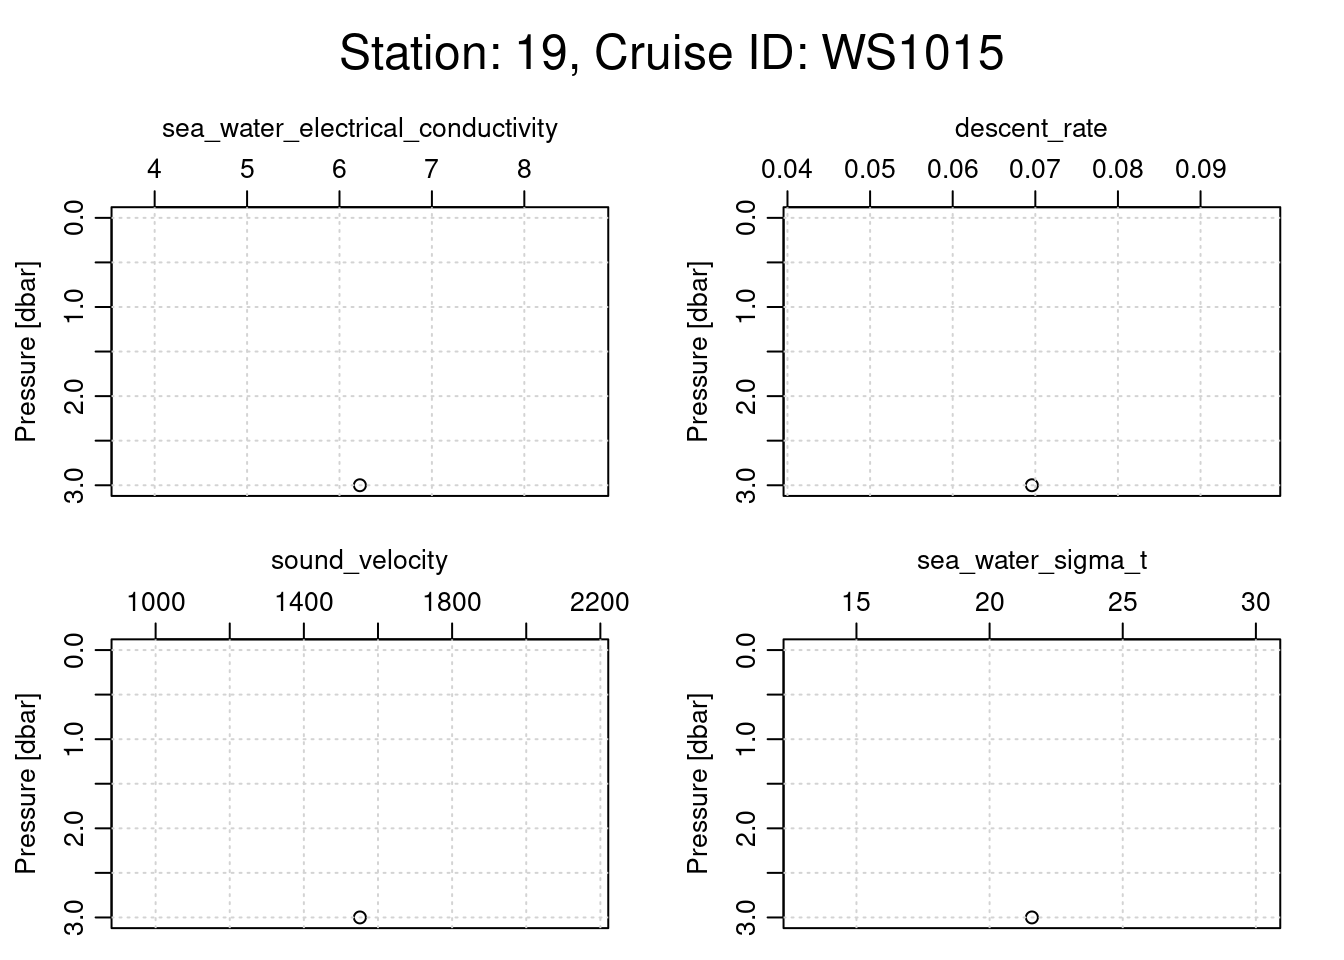
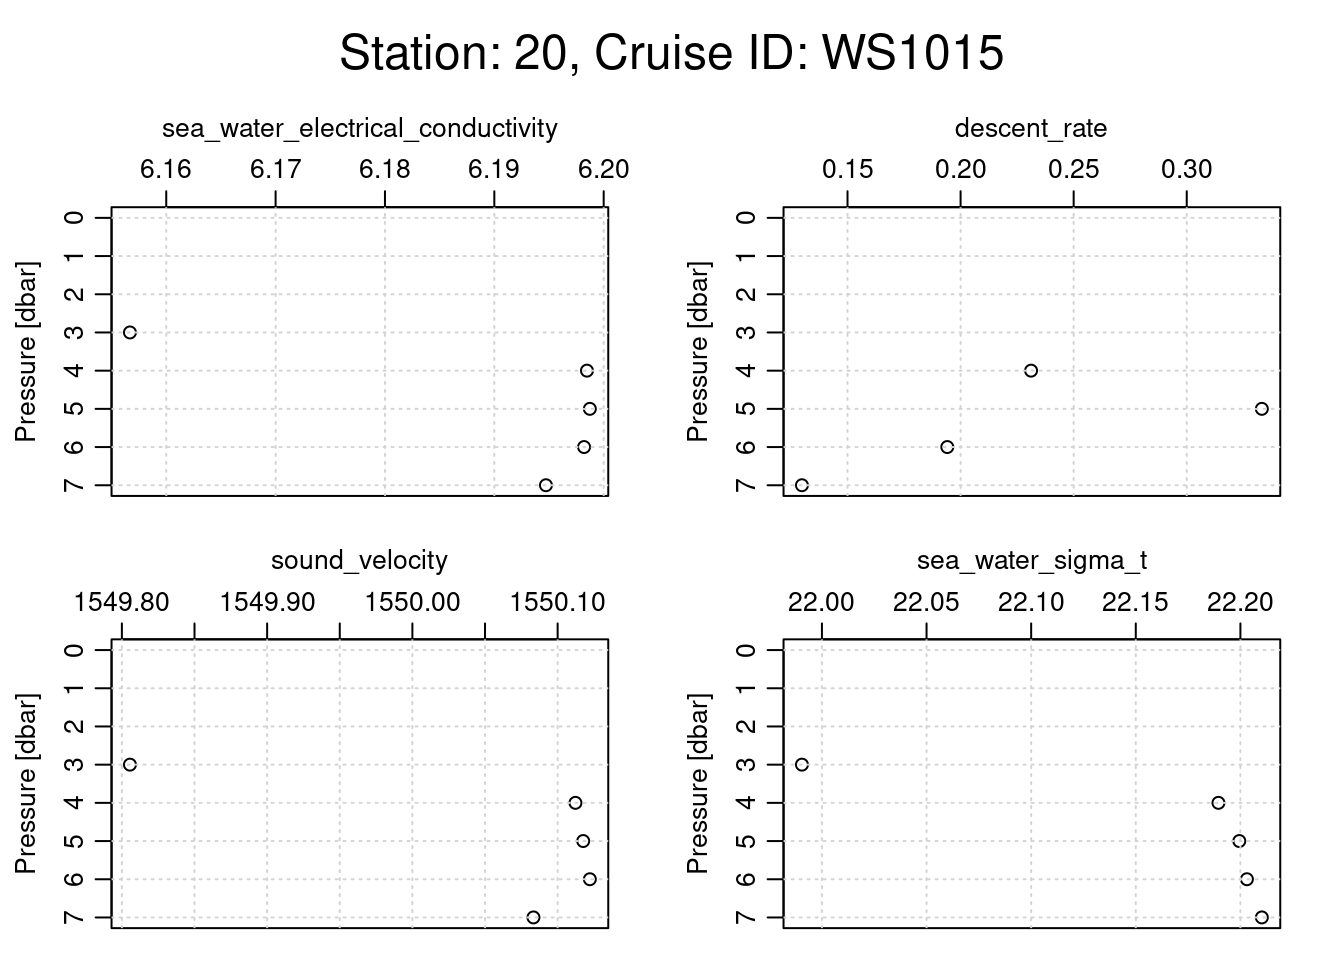
plotting other physical parameters for each cast
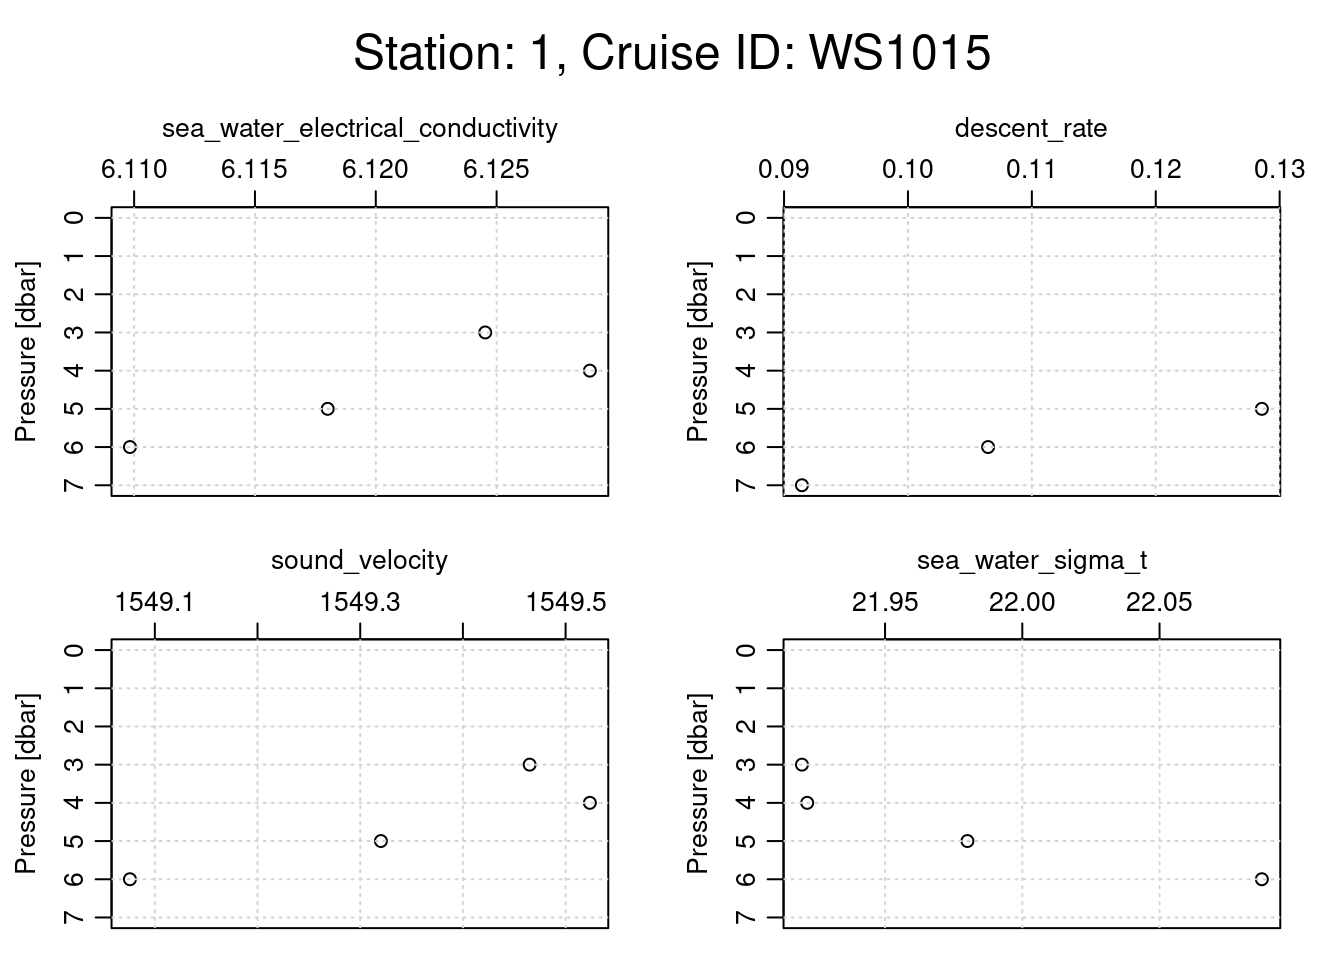
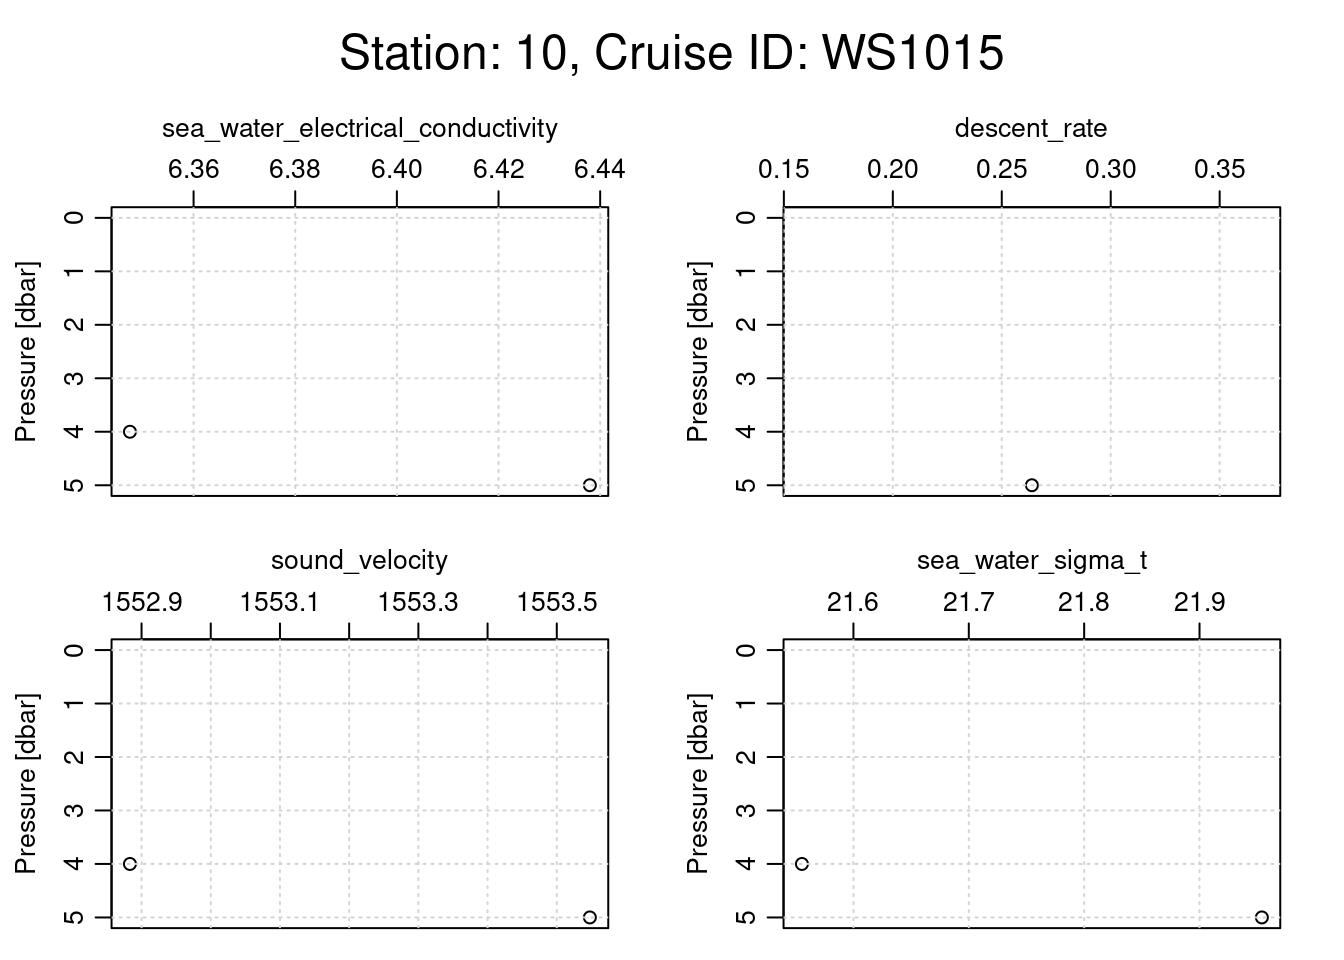
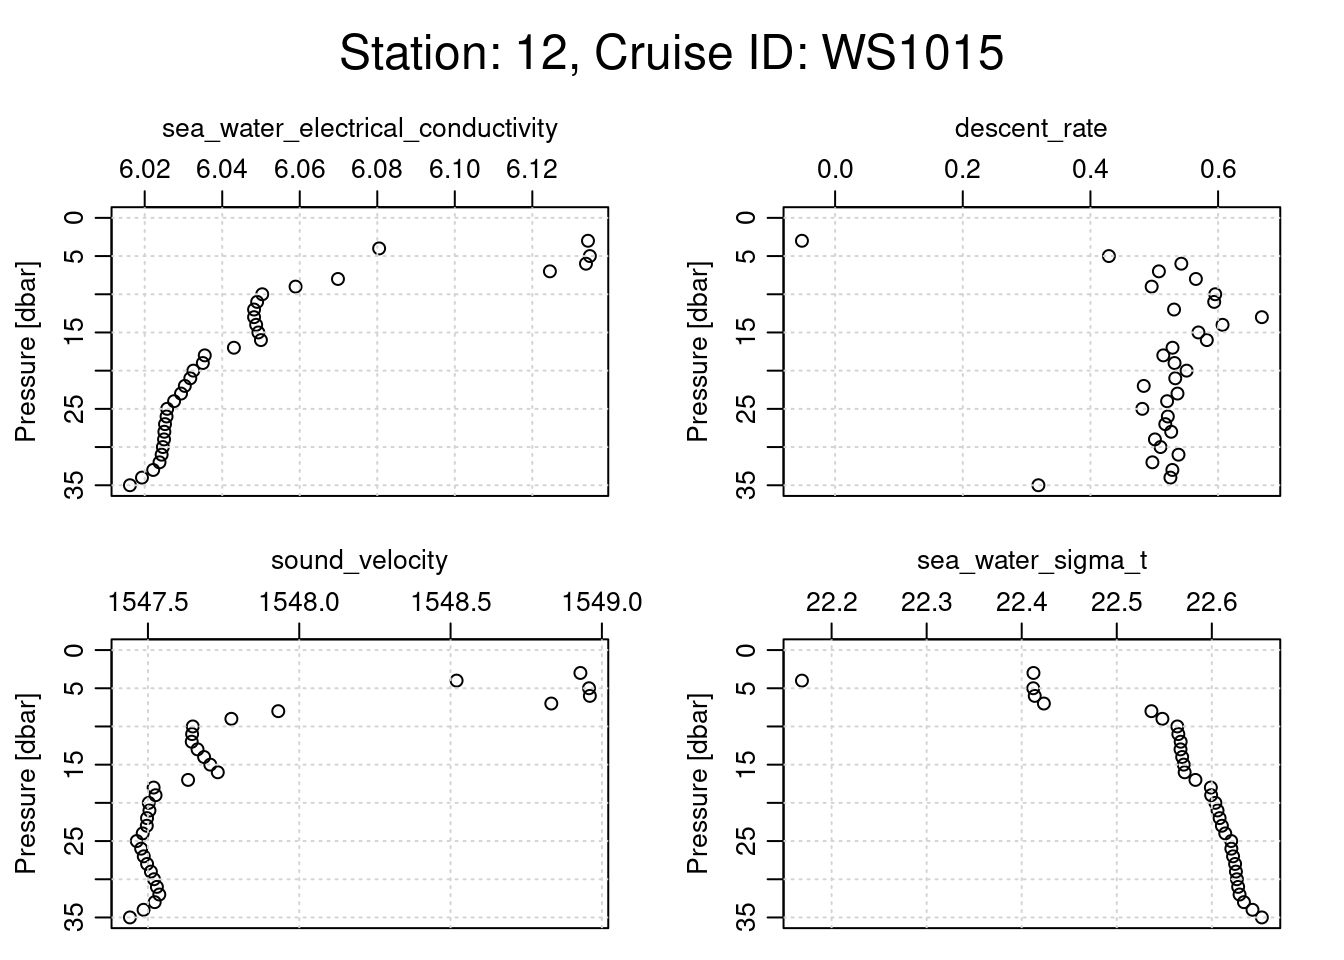
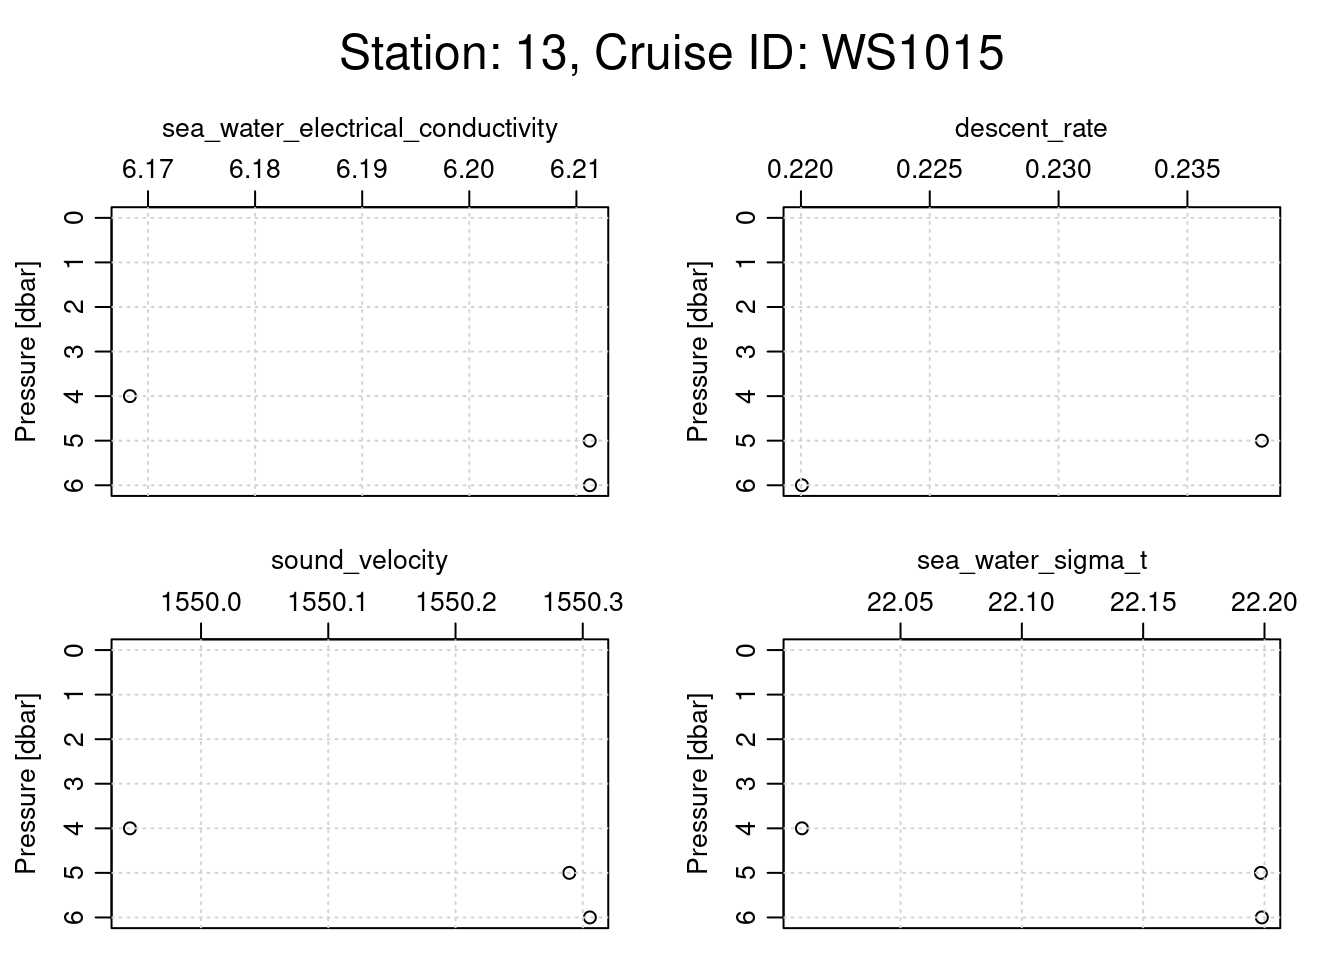
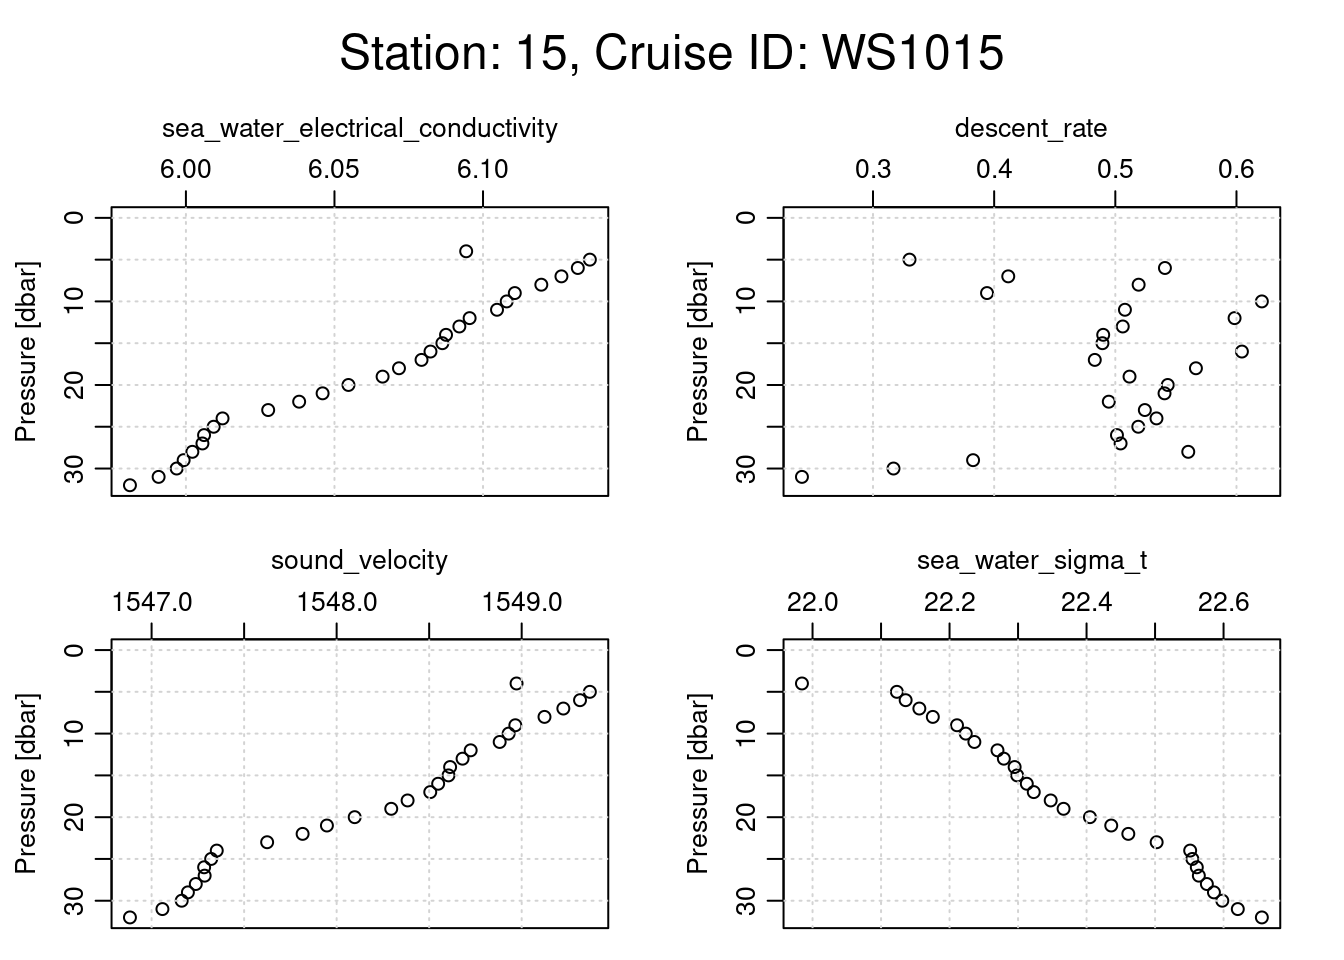
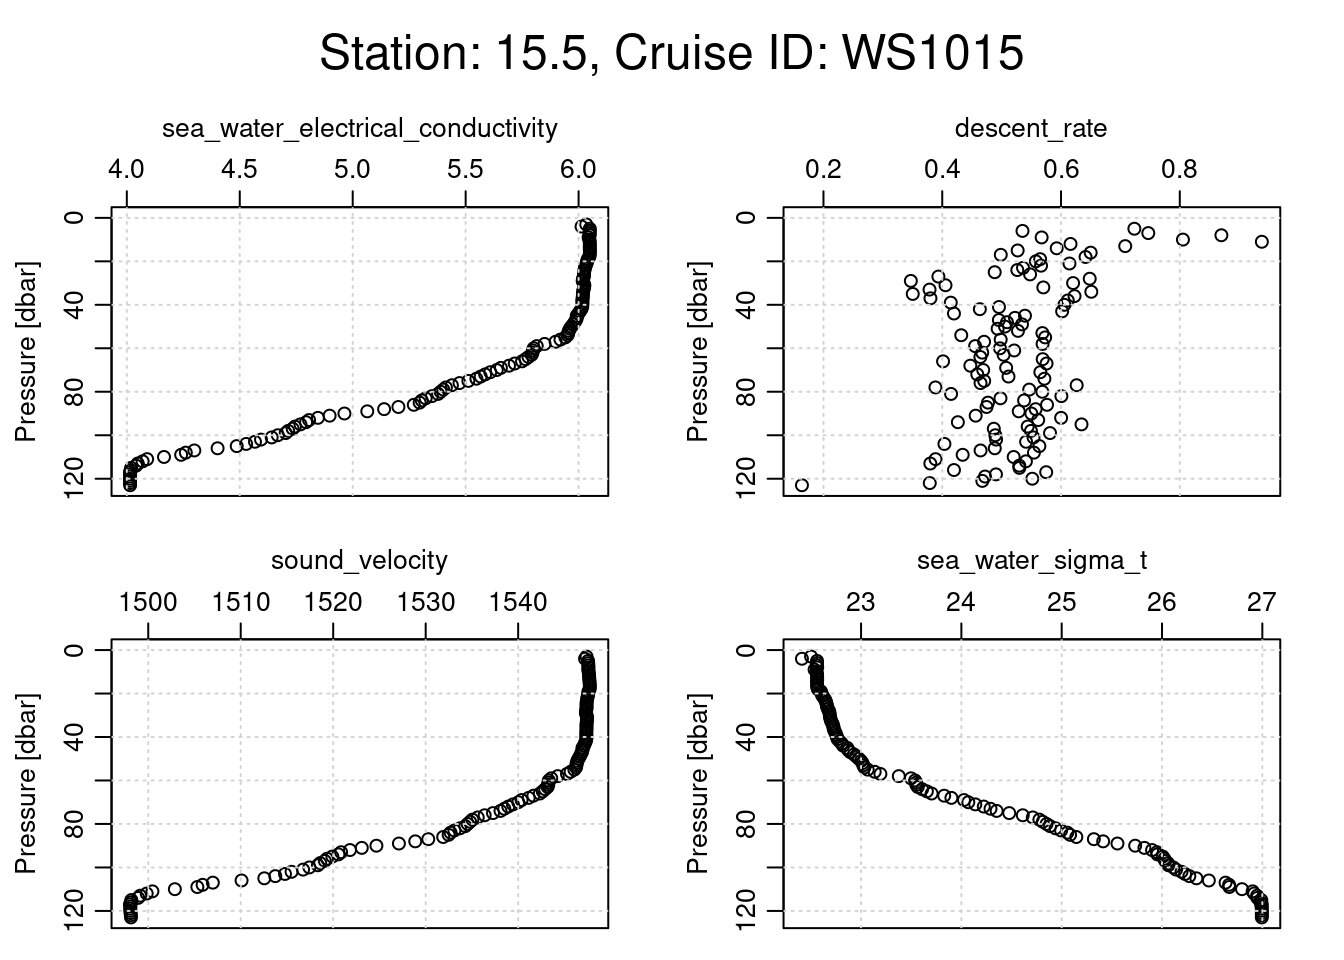
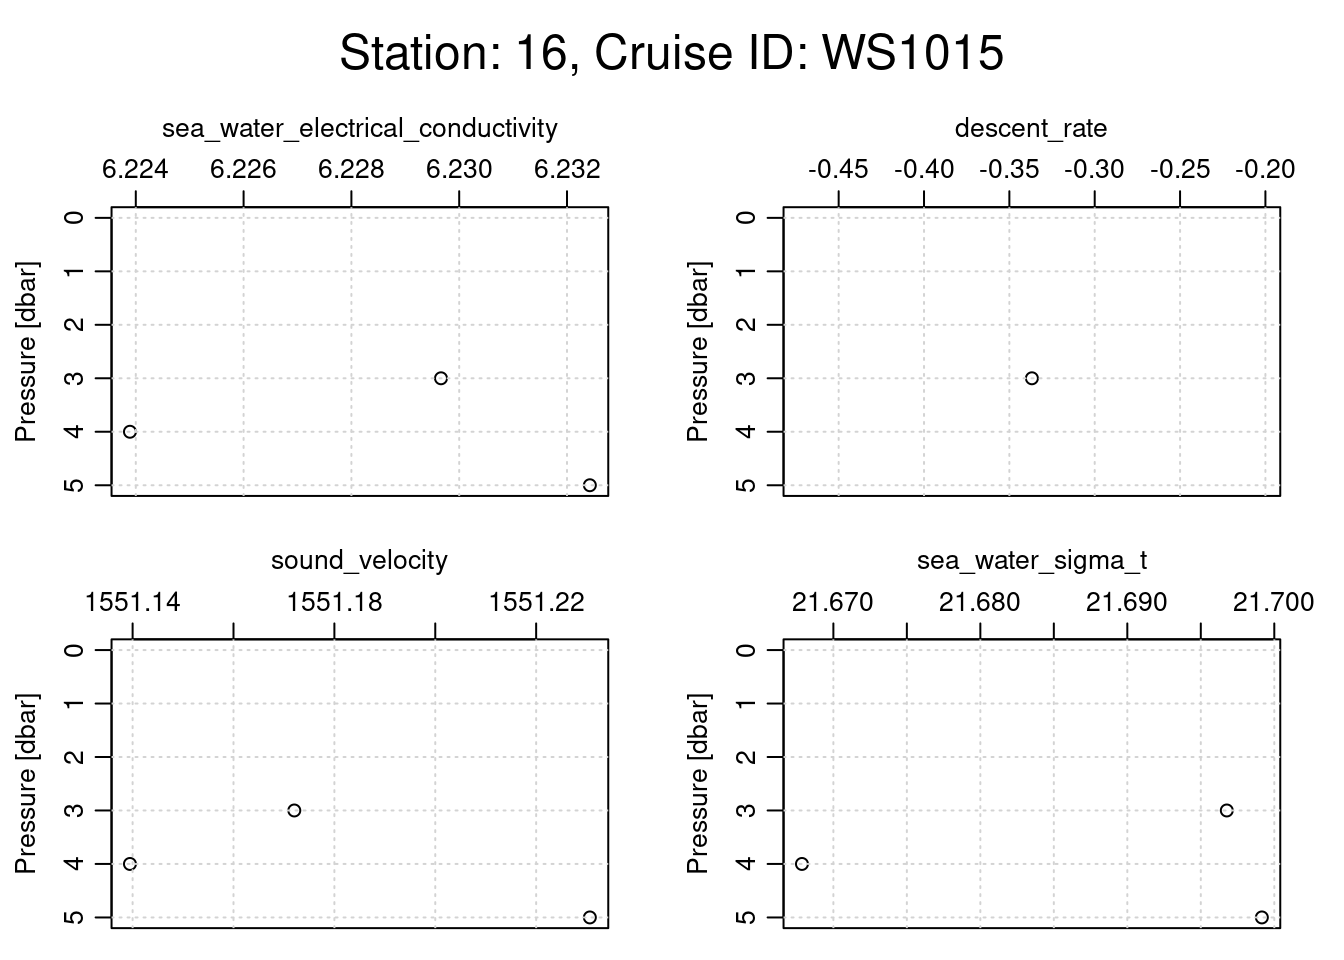
# Loop through each CTD castfor (i inseq(ctd_FK)){ cast <- ctd_FK[[i]] # Assuming each sublist contains only one relevant CTD objecttryCatch({# Extract metadata for station name and cruise ID station_name <- cast@metadata$station[1] cruise_id <- cast@data$cruise_id[1]# Generate a title with station name and cruise ID overall_title <- glue::glue("Station: {station_name}, Cruise ID: {cruise_id}")# Set margins: increase the outer margin for the titlepar(oma =c(0, 0, 3, 0)) # Top outer margin increased for title# Plotting function with specific parameters oce::plot(x =ctdDecimate(ctdTrim(cast)),which =c("sea_water_electrical_conductivity","descent_rate", "sound_velocity","sea_water_sigma_t","altimeter" ),main =""# No main title for individual subplots )# Place a single overall title at the top of the plot framemtext(overall_title, side =3, line =1, outer =TRUE, cex =1.5)# Reset outer margins to defaultpar(oma =c(0, 0, 0, 0)) }, error =function(e) {print(e$message) # Print any errors that occur during plotting })}
[1] "need finite 'xlim' values"
[1] "need finite 'xlim' values"
[1] "need finite 'xlim' values"
[1] "need finite 'xlim' values"
[1] "need finite 'xlim' values"
[1] "need finite 'xlim' values"
plotting other nutrient parameters for each cast
# Loop through each CTD castfor (i inseq(ctd_FK)){ cast <- ctd_FK[[i]] # Assuming each sublist contains only one relevant CTD objecttryCatch({# Extract metadata for station name and cruise ID station_name <- cast@metadata$station[1] cruise_id <- cast@data$cruise_id[1]# Generate a title with station name and cruise ID overall_title <- glue::glue("Station: {station_name}, Cruise ID: {cruise_id}")# Set margins: increase the outer margin for the titlepar(oma =c(0, 0, 3, 0)) # Top outer margin increased for title# Plotting function with specific parameters oce::plot(x =ctdDecimate(ctdTrim(cast)),which =c("CDOM", "dissolved_oxygen","oxygen_saturation","chlorophyll_concentration", "chlorophyll_fluorescence" ),main =""# No main title for individual subplots )# Place a single overall title at the top of the plot framemtext(overall_title, side =3, line =1, outer =TRUE, cex =1.5)# Reset outer margins to defaultpar(oma =c(0, 0, 0, 0)) }, error =function(e) {print(e$message) # Print any errors that occur during plotting })}
[1] "In plot,ctd-method() : which=\"CDOMdissolved_oxygenoxygen_saturationchlorophyll_concentrationchlorophyll_fluorescence\" cannot be handled"
[1] "In plot,ctd-method() : which=\"CDOMdissolved_oxygenoxygen_saturationchlorophyll_concentrationchlorophyll_fluorescence\" cannot be handled"
[1] "In plot,ctd-method() : which=\"CDOMdissolved_oxygenoxygen_saturationchlorophyll_concentrationchlorophyll_fluorescence\" cannot be handled"
[1] "In plot,ctd-method() : which=\"CDOMdissolved_oxygenoxygen_saturationchlorophyll_concentrationchlorophyll_fluorescence\" cannot be handled"
[1] "In plot,ctd-method() : which=\"CDOMdissolved_oxygenoxygen_saturationchlorophyll_concentrationchlorophyll_fluorescence\" cannot be handled"
[1] "In plot,ctd-method() : which=\"CDOMdissolved_oxygenoxygen_saturationchlorophyll_concentrationchlorophyll_fluorescence\" cannot be handled"
[1] "In plot,ctd-method() : which=\"CDOMdissolved_oxygenoxygen_saturationchlorophyll_concentrationchlorophyll_fluorescence\" cannot be handled"
[1] "In plot,ctd-method() : which=\"CDOMdissolved_oxygenoxygen_saturationchlorophyll_concentrationchlorophyll_fluorescence\" cannot be handled"
[1] "In plot,ctd-method() : which=\"CDOMdissolved_oxygenoxygen_saturationchlorophyll_concentrationchlorophyll_fluorescence\" cannot be handled"
[1] "In plot,ctd-method() : which=\"CDOMdissolved_oxygenoxygen_saturationchlorophyll_concentrationchlorophyll_fluorescence\" cannot be handled"
[1] "In plot,ctd-method() : which=\"CDOMdissolved_oxygenoxygen_saturationchlorophyll_concentrationchlorophyll_fluorescence\" cannot be handled"
[1] "In plot,ctd-method() : which=\"CDOMdissolved_oxygenoxygen_saturationchlorophyll_concentrationchlorophyll_fluorescence\" cannot be handled"
[1] "In plot,ctd-method() : which=\"CDOMdissolved_oxygenoxygen_saturationchlorophyll_concentrationchlorophyll_fluorescence\" cannot be handled"
[1] "In plot,ctd-method() : which=\"CDOMdissolved_oxygenoxygen_saturationchlorophyll_concentrationchlorophyll_fluorescence\" cannot be handled"
[1] "In plot,ctd-method() : which=\"CDOMdissolved_oxygenoxygen_saturationchlorophyll_concentrationchlorophyll_fluorescence\" cannot be handled"
[1] "In plot,ctd-method() : which=\"CDOMdissolved_oxygenoxygen_saturationchlorophyll_concentrationchlorophyll_fluorescence\" cannot be handled"
[1] "In plot,ctd-method() : which=\"CDOMdissolved_oxygenoxygen_saturationchlorophyll_concentrationchlorophyll_fluorescence\" cannot be handled"
[1] "In plot,ctd-method() : which=\"CDOMdissolved_oxygenoxygen_saturationchlorophyll_concentrationchlorophyll_fluorescence\" cannot be handled"
[1] "In plot,ctd-method() : which=\"CDOMdissolved_oxygenoxygen_saturationchlorophyll_concentrationchlorophyll_fluorescence\" cannot be handled"
[1] "In plot,ctd-method() : which=\"CDOMdissolved_oxygenoxygen_saturationchlorophyll_concentrationchlorophyll_fluorescence\" cannot be handled"
[1] "In plot,ctd-method() : which=\"CDOMdissolved_oxygenoxygen_saturationchlorophyll_concentrationchlorophyll_fluorescence\" cannot be handled"
[1] "In plot,ctd-method() : which=\"CDOMdissolved_oxygenoxygen_saturationchlorophyll_concentrationchlorophyll_fluorescence\" cannot be handled"
[1] "In plot,ctd-method() : which=\"CDOMdissolved_oxygenoxygen_saturationchlorophyll_concentrationchlorophyll_fluorescence\" cannot be handled"
[1] "In plot,ctd-method() : which=\"CDOMdissolved_oxygenoxygen_saturationchlorophyll_concentrationchlorophyll_fluorescence\" cannot be handled"
[1] "In plot,ctd-method() : which=\"CDOMdissolved_oxygenoxygen_saturationchlorophyll_concentrationchlorophyll_fluorescence\" cannot be handled"
[1] "In plot,ctd-method() : which=\"CDOMdissolved_oxygenoxygen_saturationchlorophyll_concentrationchlorophyll_fluorescence\" cannot be handled"
[1] "In plot,ctd-method() : which=\"CDOMdissolved_oxygenoxygen_saturationchlorophyll_concentrationchlorophyll_fluorescence\" cannot be handled"
[1] "In plot,ctd-method() : which=\"CDOMdissolved_oxygenoxygen_saturationchlorophyll_concentrationchlorophyll_fluorescence\" cannot be handled"
[1] "In plot,ctd-method() : which=\"CDOMdissolved_oxygenoxygen_saturationchlorophyll_concentrationchlorophyll_fluorescence\" cannot be handled"
[1] "In plot,ctd-method() : which=\"CDOMdissolved_oxygenoxygen_saturationchlorophyll_concentrationchlorophyll_fluorescence\" cannot be handled"
[1] "In plot,ctd-method() : which=\"CDOMdissolved_oxygenoxygen_saturationchlorophyll_concentrationchlorophyll_fluorescence\" cannot be handled"
[1] "In plot,ctd-method() : which=\"CDOMdissolved_oxygenoxygen_saturationchlorophyll_concentrationchlorophyll_fluorescence\" cannot be handled"
[1] "In plot,ctd-method() : which=\"CDOMdissolved_oxygenoxygen_saturationchlorophyll_concentrationchlorophyll_fluorescence\" cannot be handled"
[1] "In plot,ctd-method() : which=\"CDOMdissolved_oxygenoxygen_saturationchlorophyll_concentrationchlorophyll_fluorescence\" cannot be handled"
[1] "In plot,ctd-method() : which=\"CDOMdissolved_oxygenoxygen_saturationchlorophyll_concentrationchlorophyll_fluorescence\" cannot be handled"
[1] "In plot,ctd-method() : which=\"CDOMdissolved_oxygenoxygen_saturationchlorophyll_concentrationchlorophyll_fluorescence\" cannot be handled"
[1] "In plot,ctd-method() : which=\"CDOMdissolved_oxygenoxygen_saturationchlorophyll_concentrationchlorophyll_fluorescence\" cannot be handled"
[1] "In plot,ctd-method() : which=\"CDOMdissolved_oxygenoxygen_saturationchlorophyll_concentrationchlorophyll_fluorescence\" cannot be handled"
[1] "In plot,ctd-method() : which=\"CDOMdissolved_oxygenoxygen_saturationchlorophyll_concentrationchlorophyll_fluorescence\" cannot be handled"
[1] "In plot,ctd-method() : which=\"CDOMdissolved_oxygenoxygen_saturationchlorophyll_concentrationchlorophyll_fluorescence\" cannot be handled"
[1] "In plot,ctd-method() : which=\"CDOMdissolved_oxygenoxygen_saturationchlorophyll_concentrationchlorophyll_fluorescence\" cannot be handled"
[1] "In plot,ctd-method() : which=\"CDOMdissolved_oxygenoxygen_saturationchlorophyll_concentrationchlorophyll_fluorescence\" cannot be handled"
[1] "In plot,ctd-method() : which=\"CDOMdissolved_oxygenoxygen_saturationchlorophyll_concentrationchlorophyll_fluorescence\" cannot be handled"
[1] "In plot,ctd-method() : which=\"CDOMdissolved_oxygenoxygen_saturationchlorophyll_concentrationchlorophyll_fluorescence\" cannot be handled"
[1] "In plot,ctd-method() : which=\"CDOMdissolved_oxygenoxygen_saturationchlorophyll_concentrationchlorophyll_fluorescence\" cannot be handled"
[1] "In plot,ctd-method() : which=\"CDOMdissolved_oxygenoxygen_saturationchlorophyll_concentrationchlorophyll_fluorescence\" cannot be handled"
[1] "In plot,ctd-method() : which=\"CDOMdissolved_oxygenoxygen_saturationchlorophyll_concentrationchlorophyll_fluorescence\" cannot be handled"
[1] "In plot,ctd-method() : which=\"CDOMdissolved_oxygenoxygen_saturationchlorophyll_concentrationchlorophyll_fluorescence\" cannot be handled"
[1] "In plot,ctd-method() : which=\"CDOMdissolved_oxygenoxygen_saturationchlorophyll_concentrationchlorophyll_fluorescence\" cannot be handled"
[1] "In plot,ctd-method() : which=\"CDOMdissolved_oxygenoxygen_saturationchlorophyll_concentrationchlorophyll_fluorescence\" cannot be handled"
[1] "In plot,ctd-method() : which=\"CDOMdissolved_oxygenoxygen_saturationchlorophyll_concentrationchlorophyll_fluorescence\" cannot be handled"
[1] "In plot,ctd-method() : which=\"CDOMdissolved_oxygenoxygen_saturationchlorophyll_concentrationchlorophyll_fluorescence\" cannot be handled"
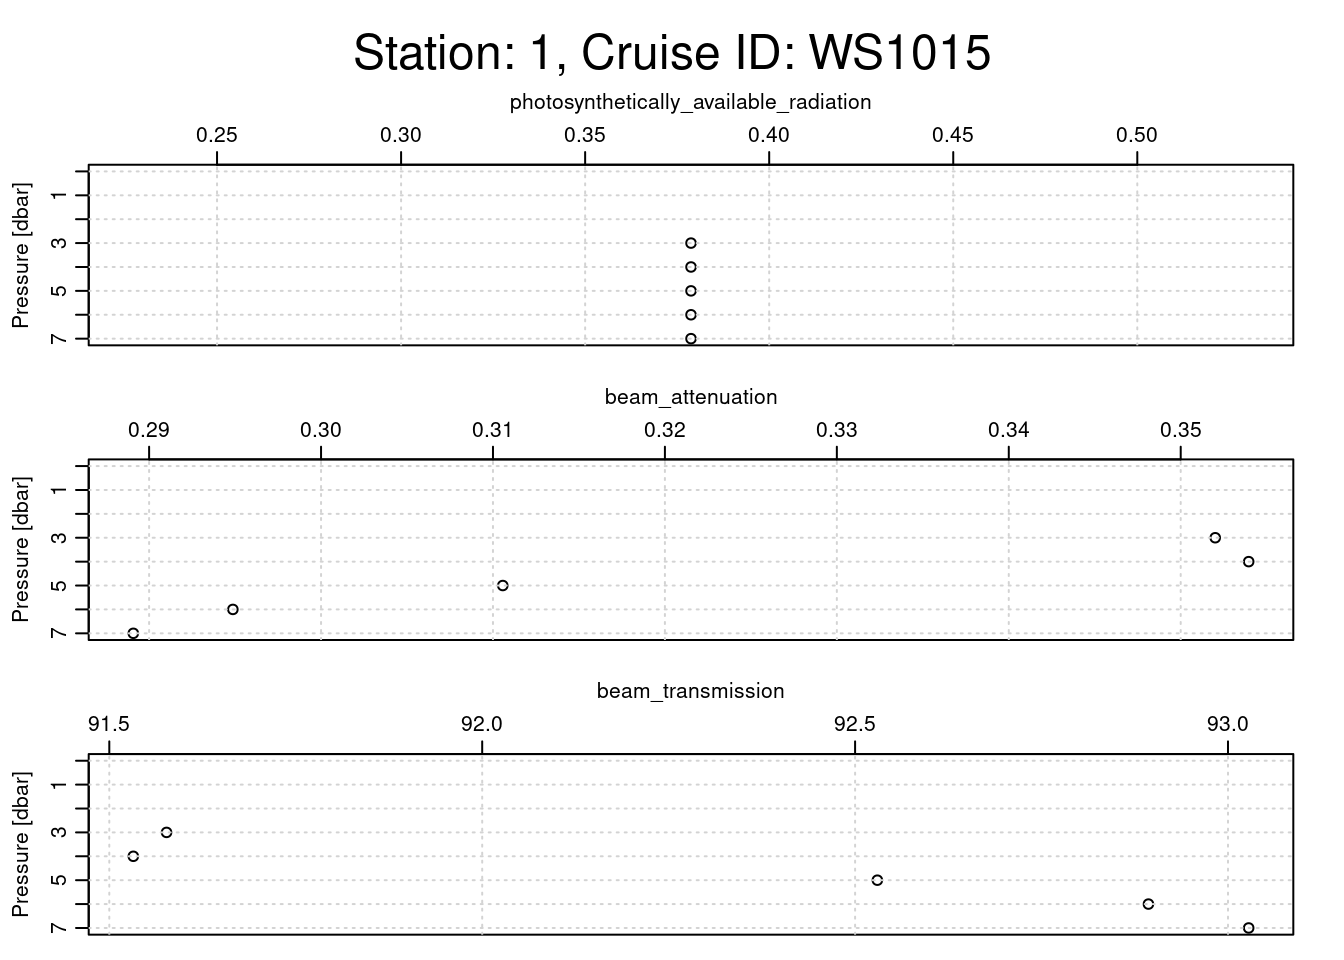
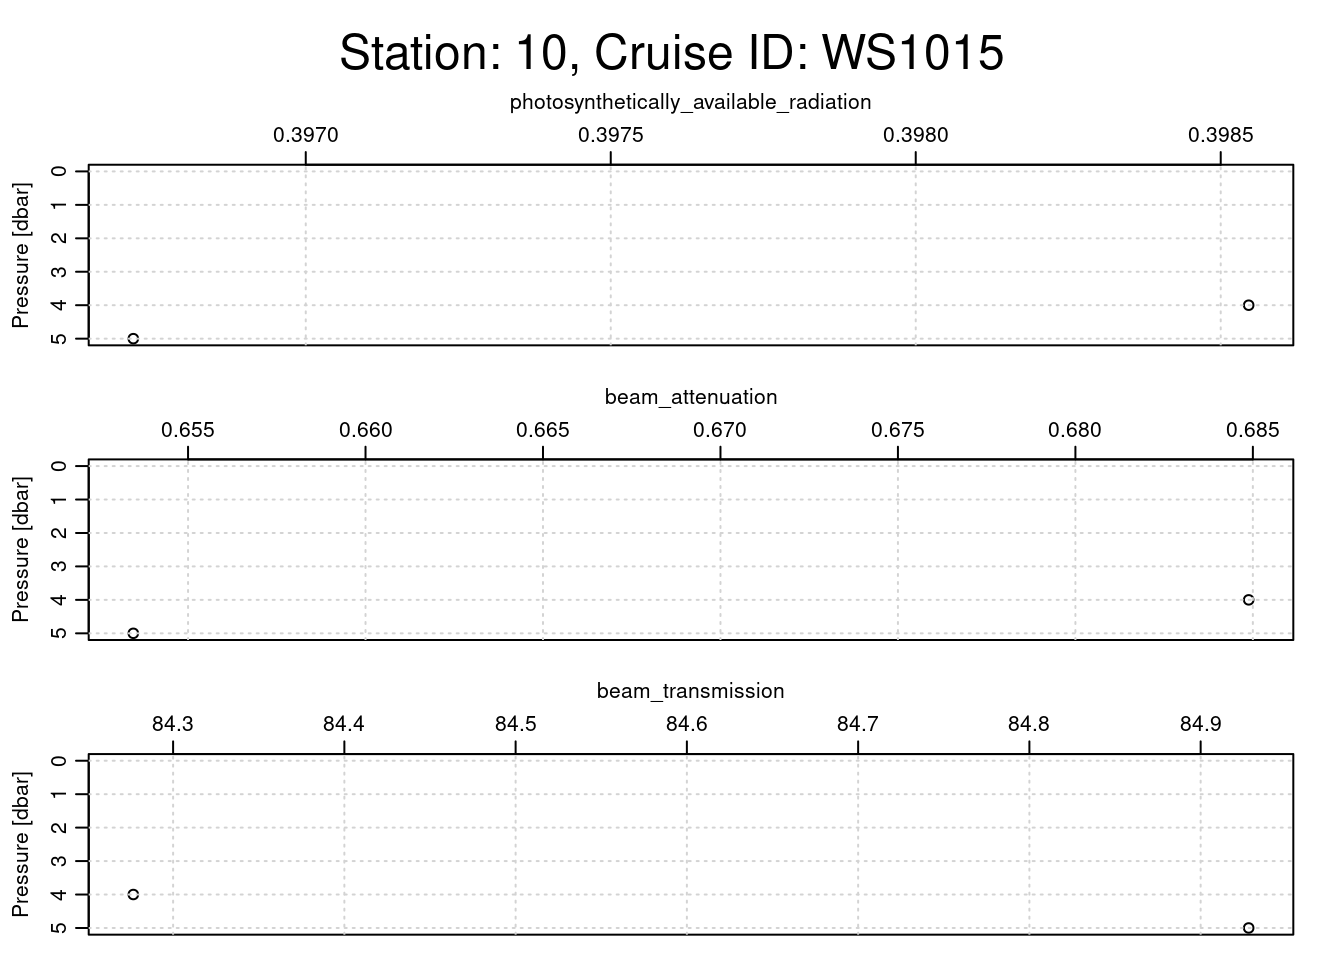
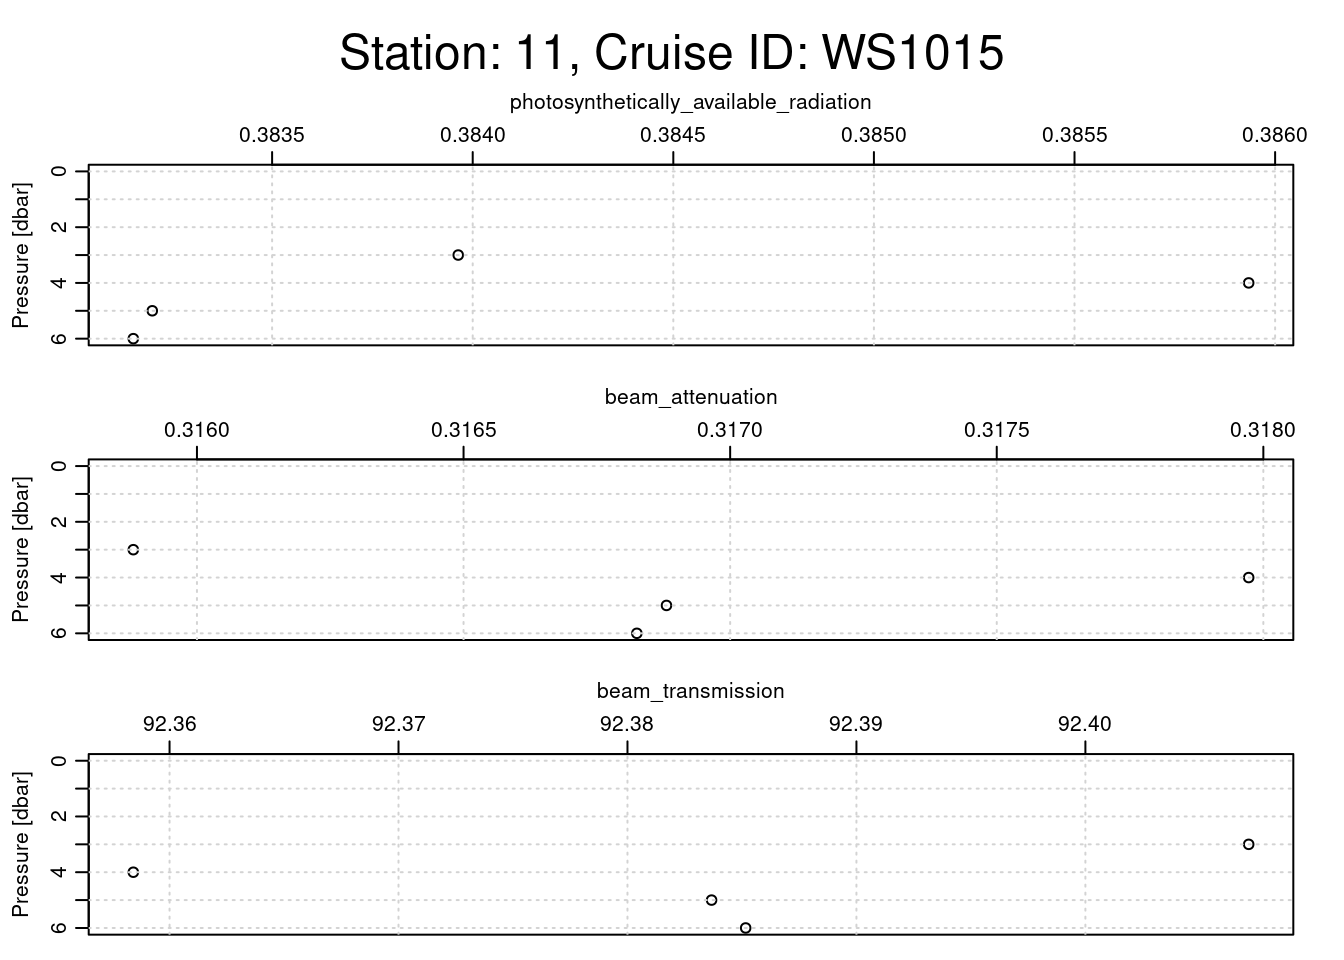
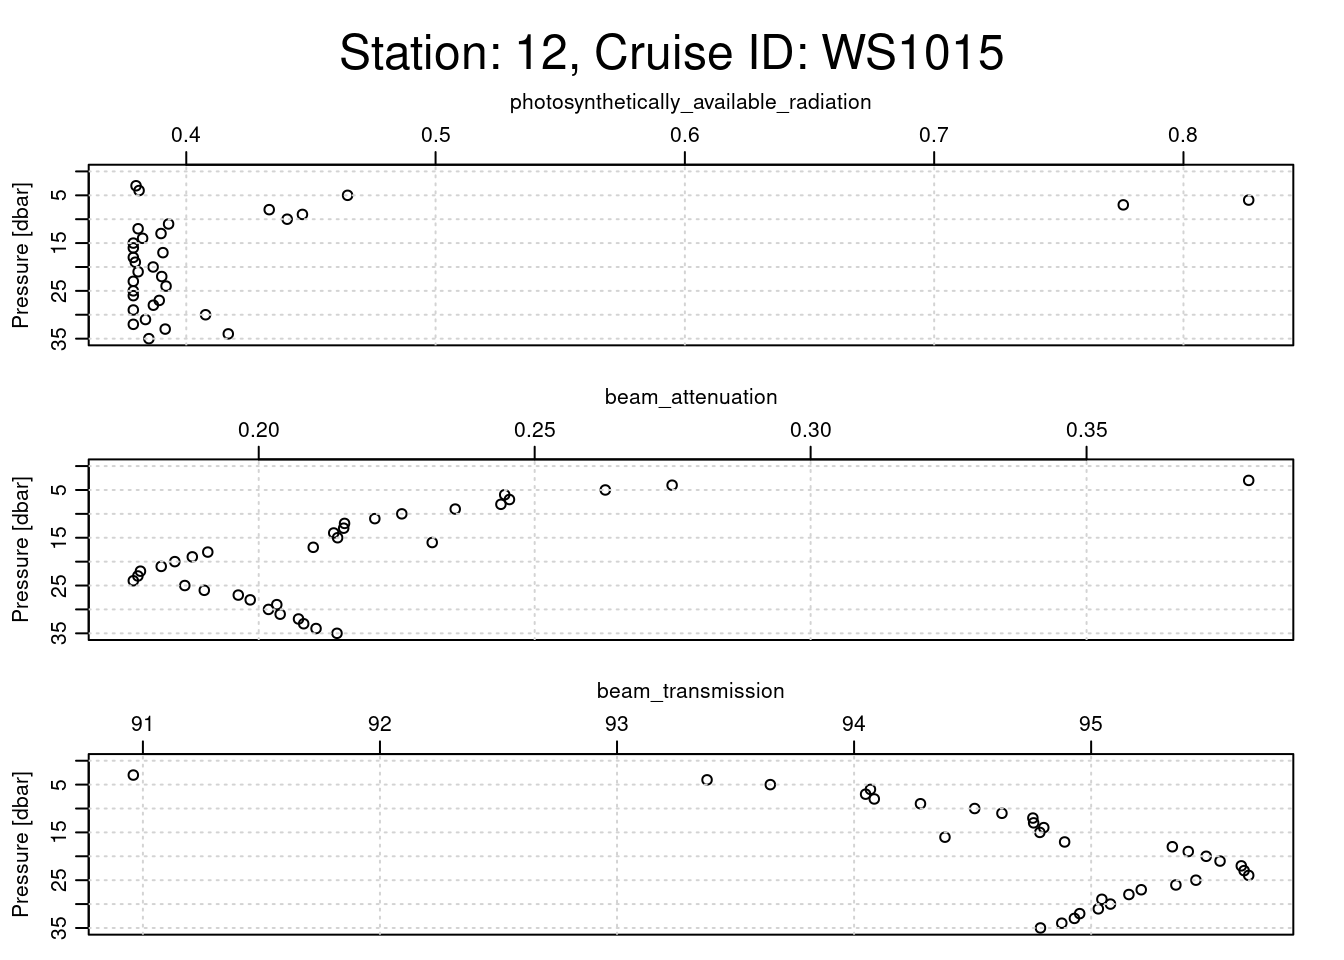
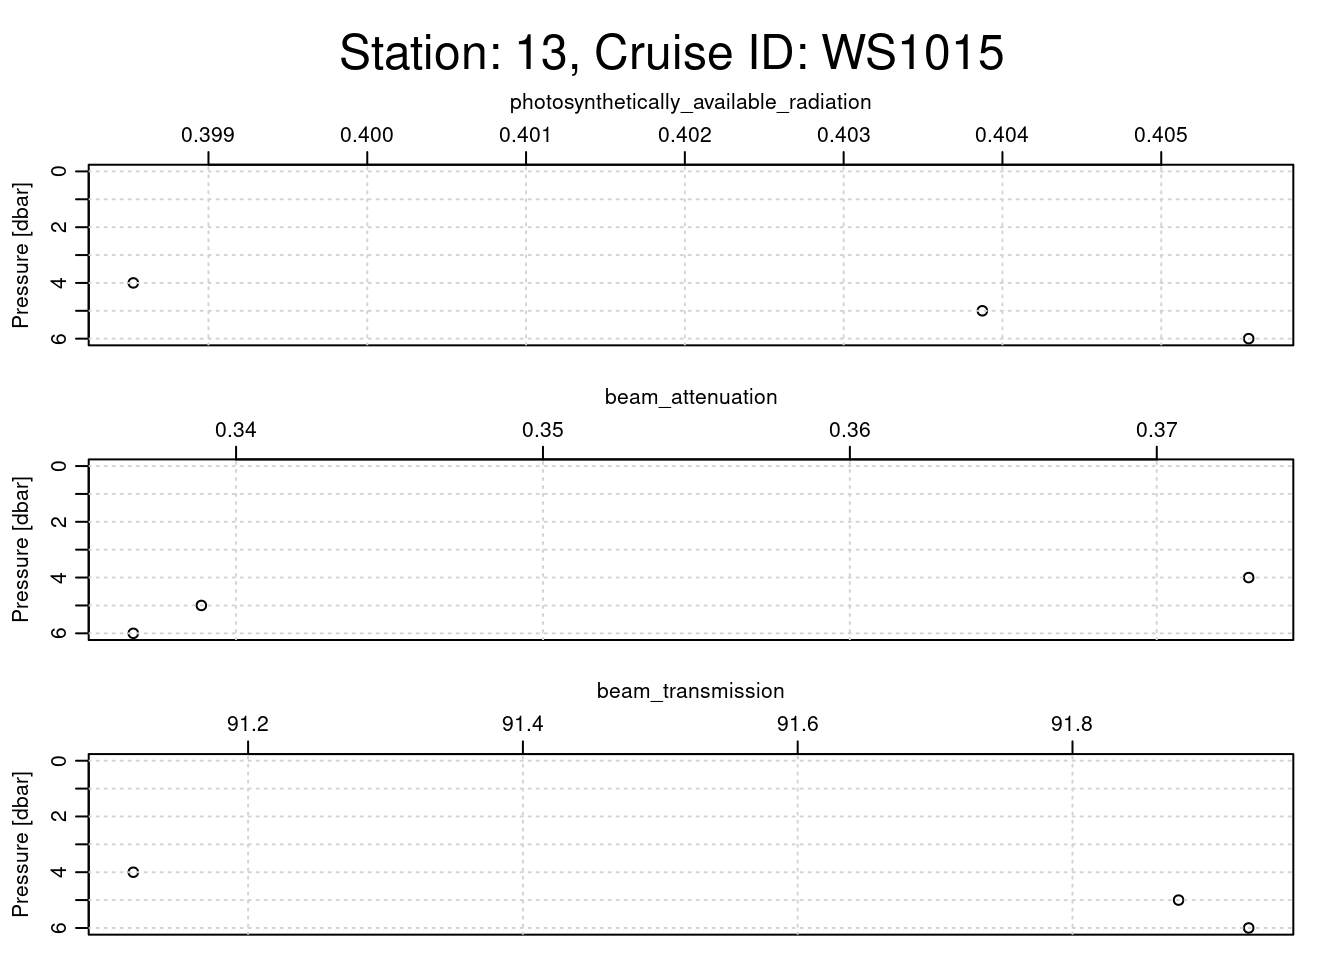
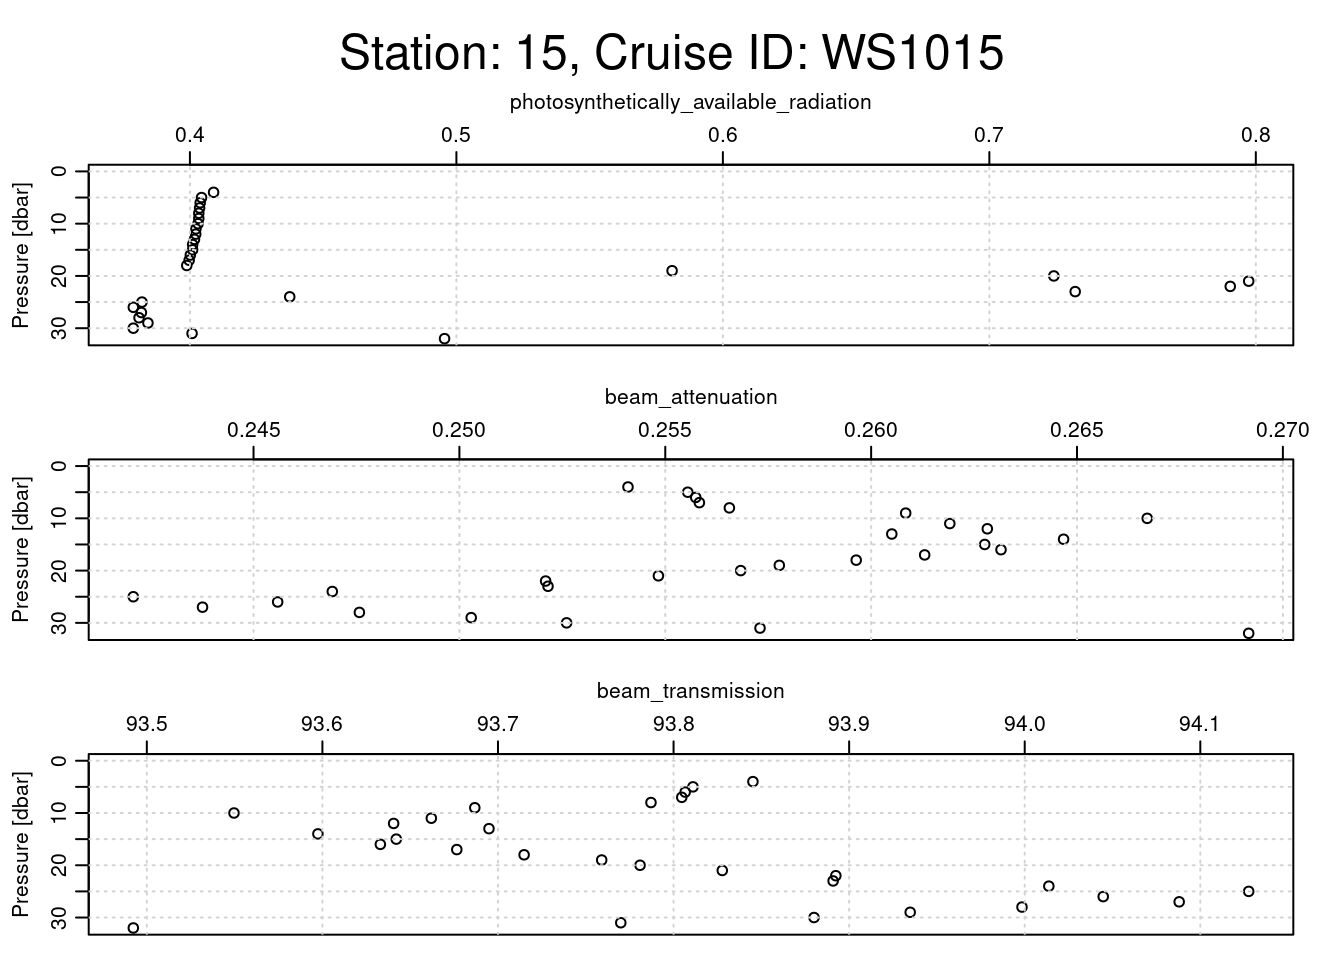
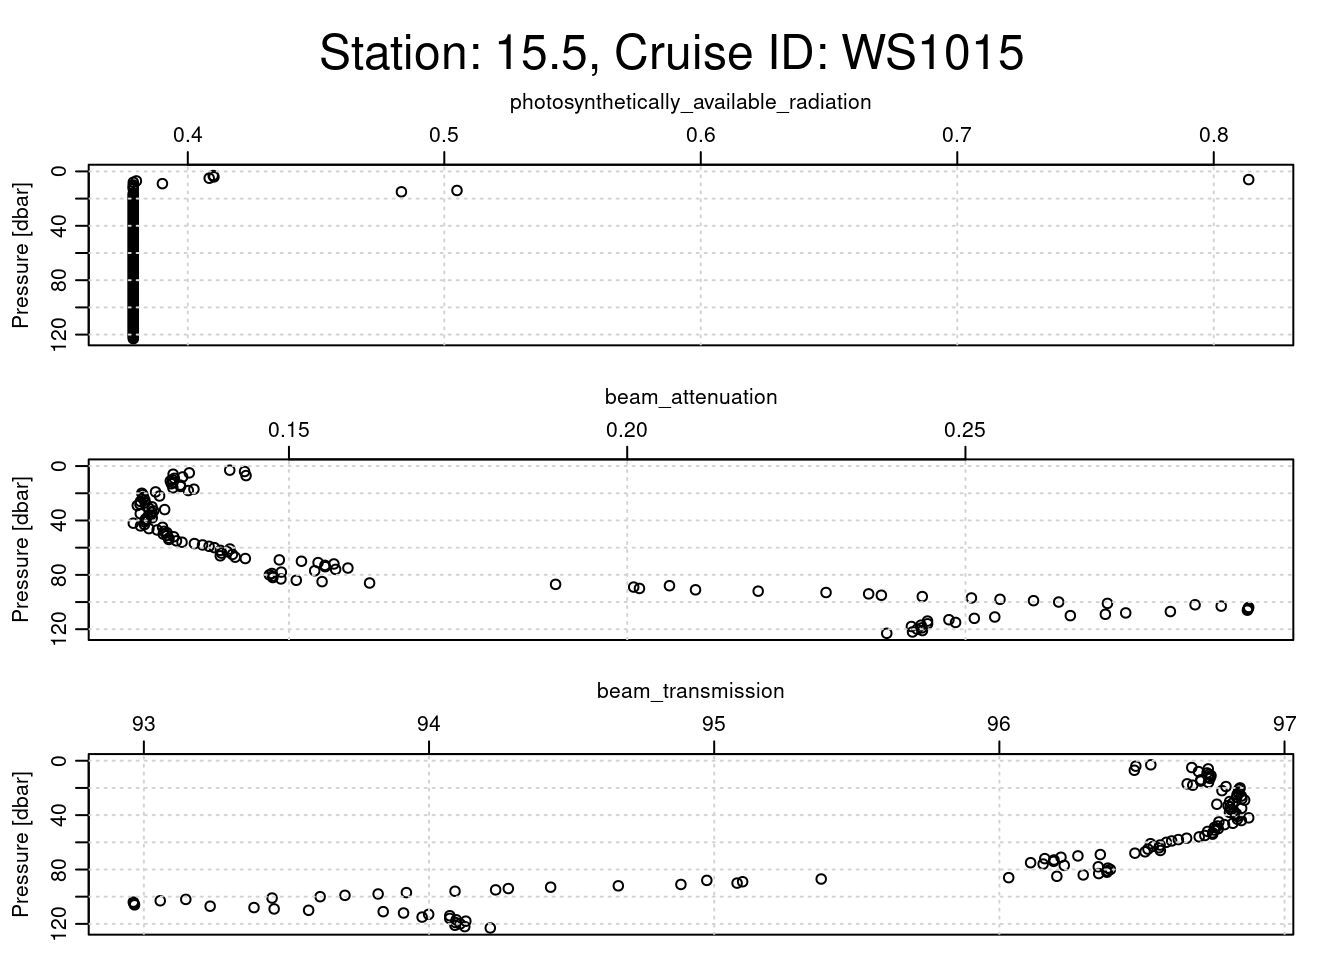
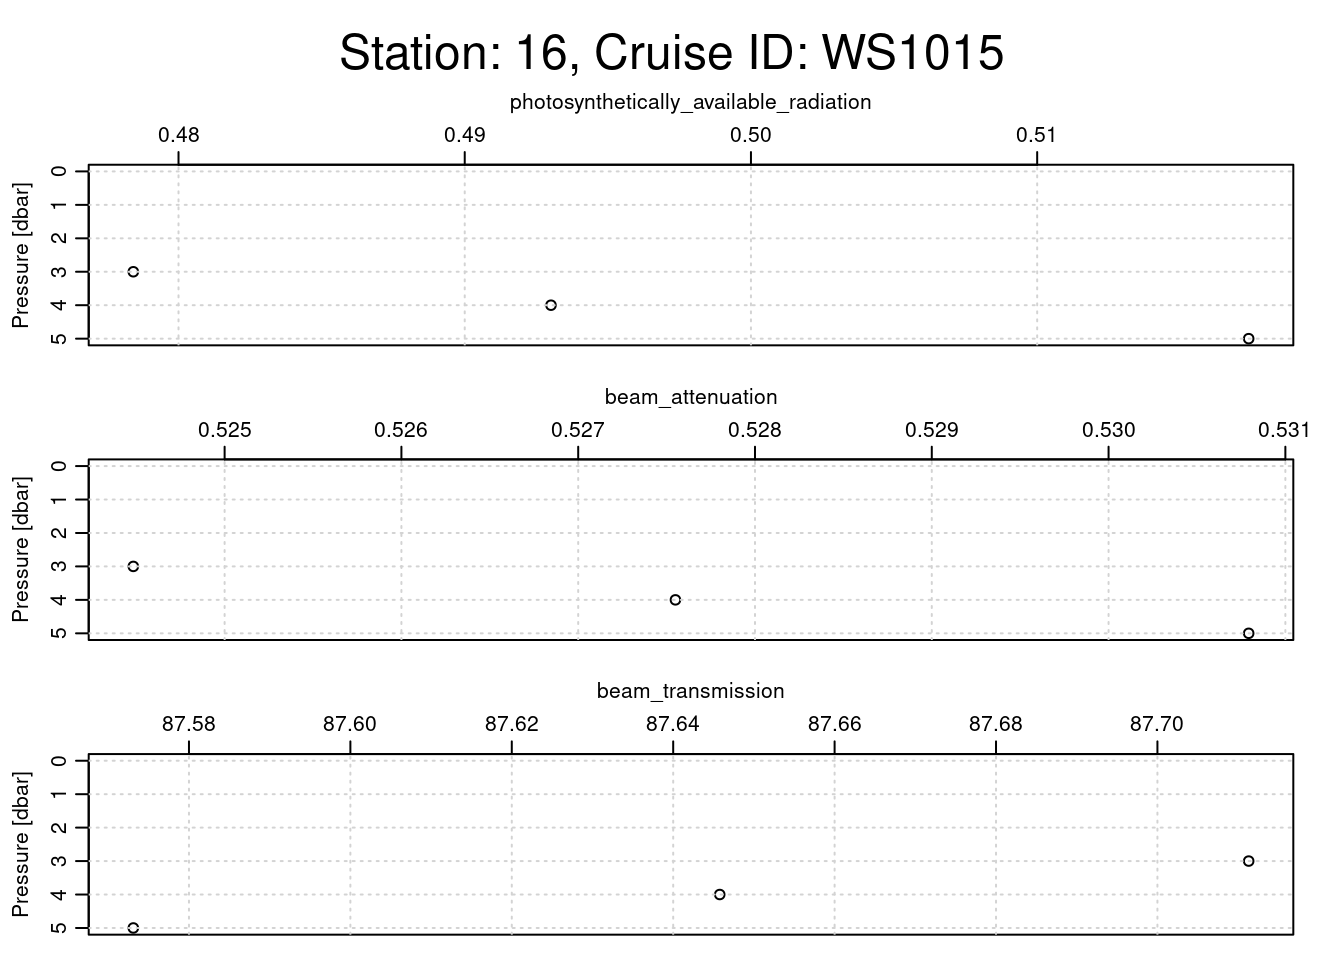
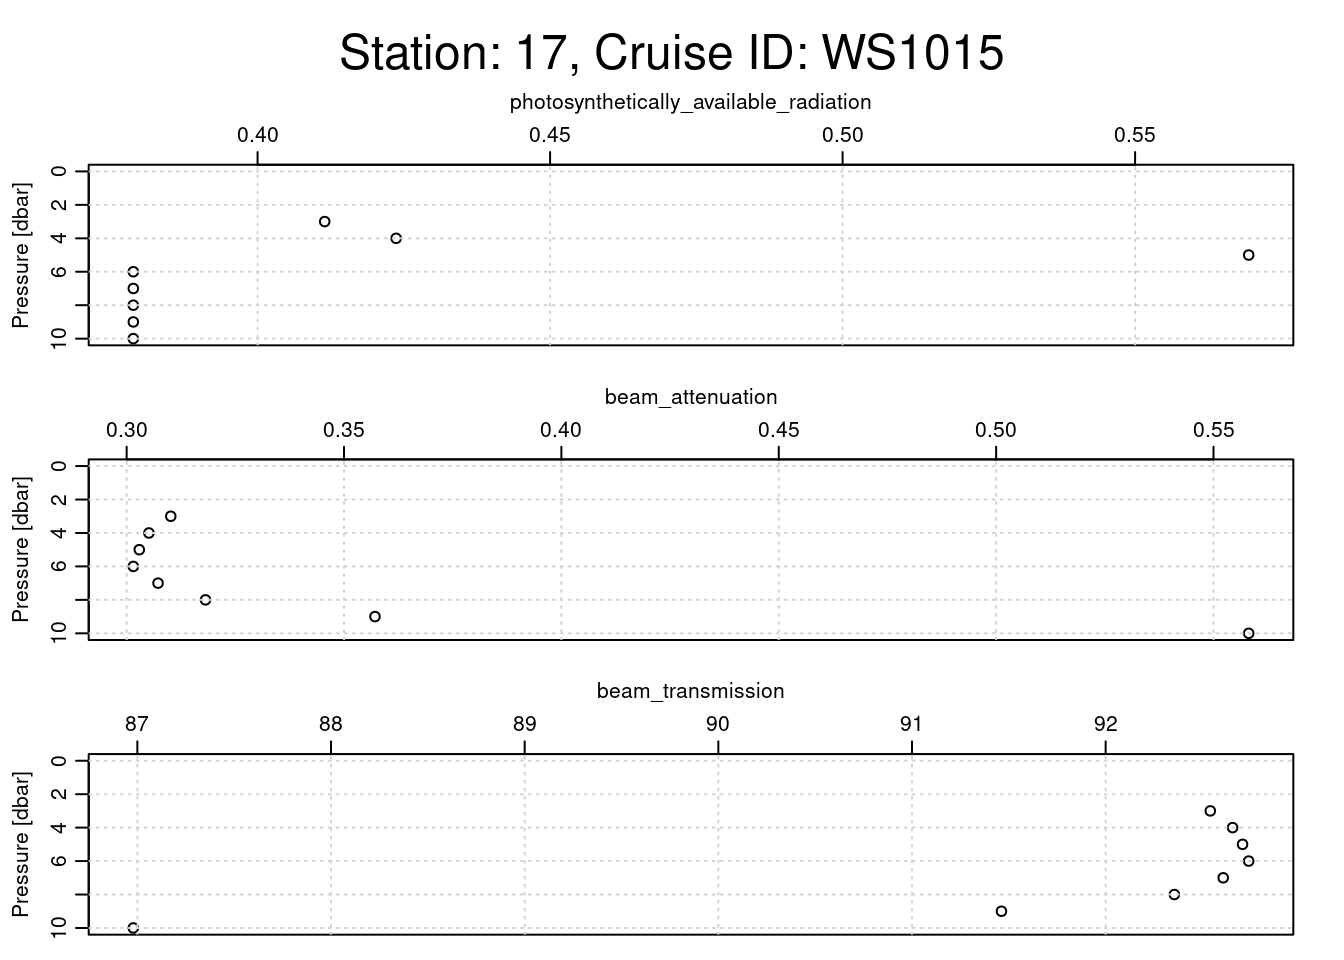
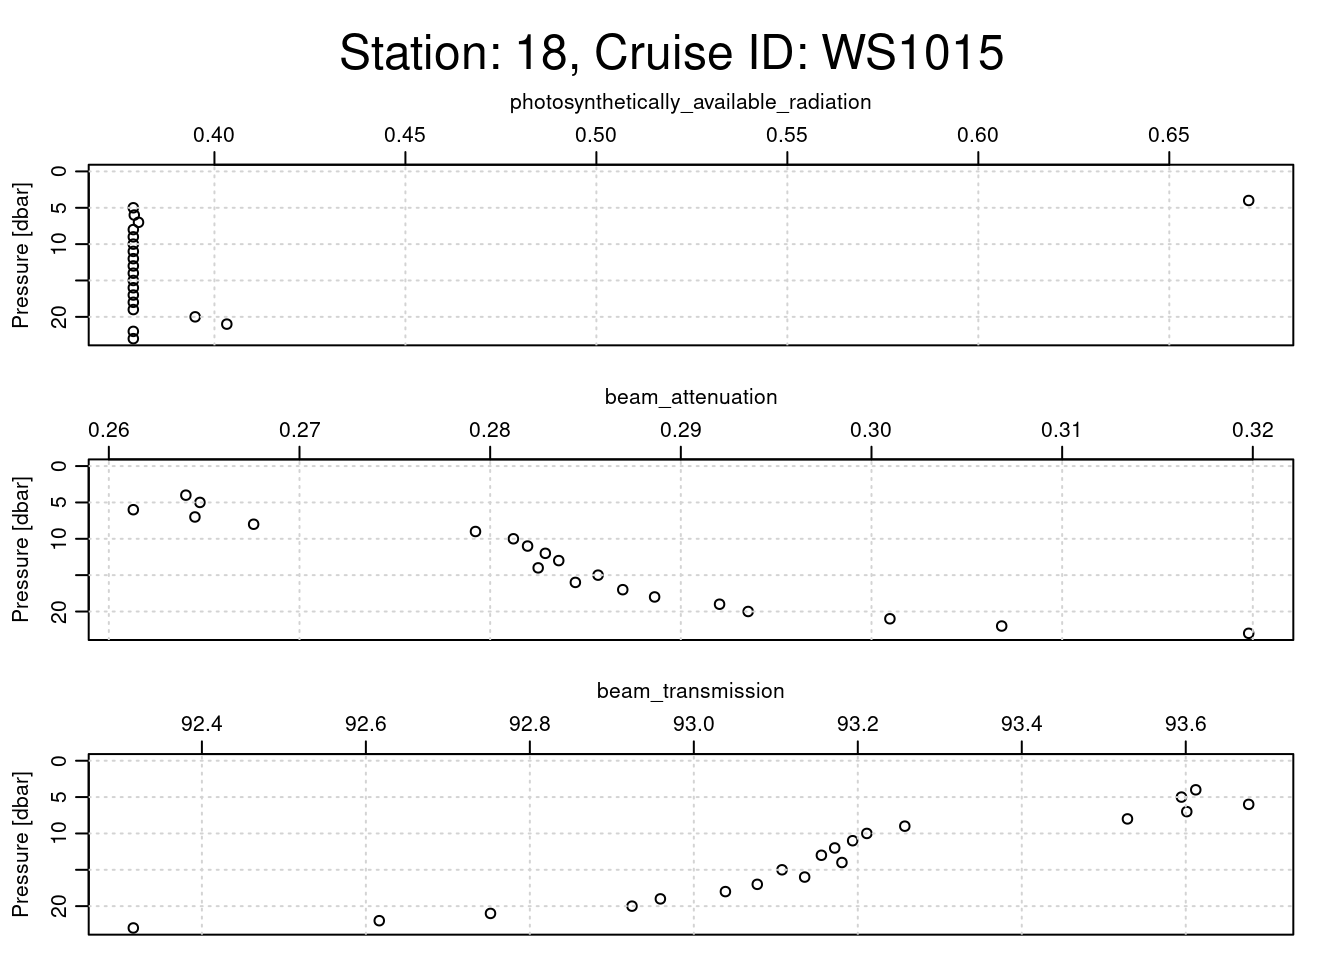
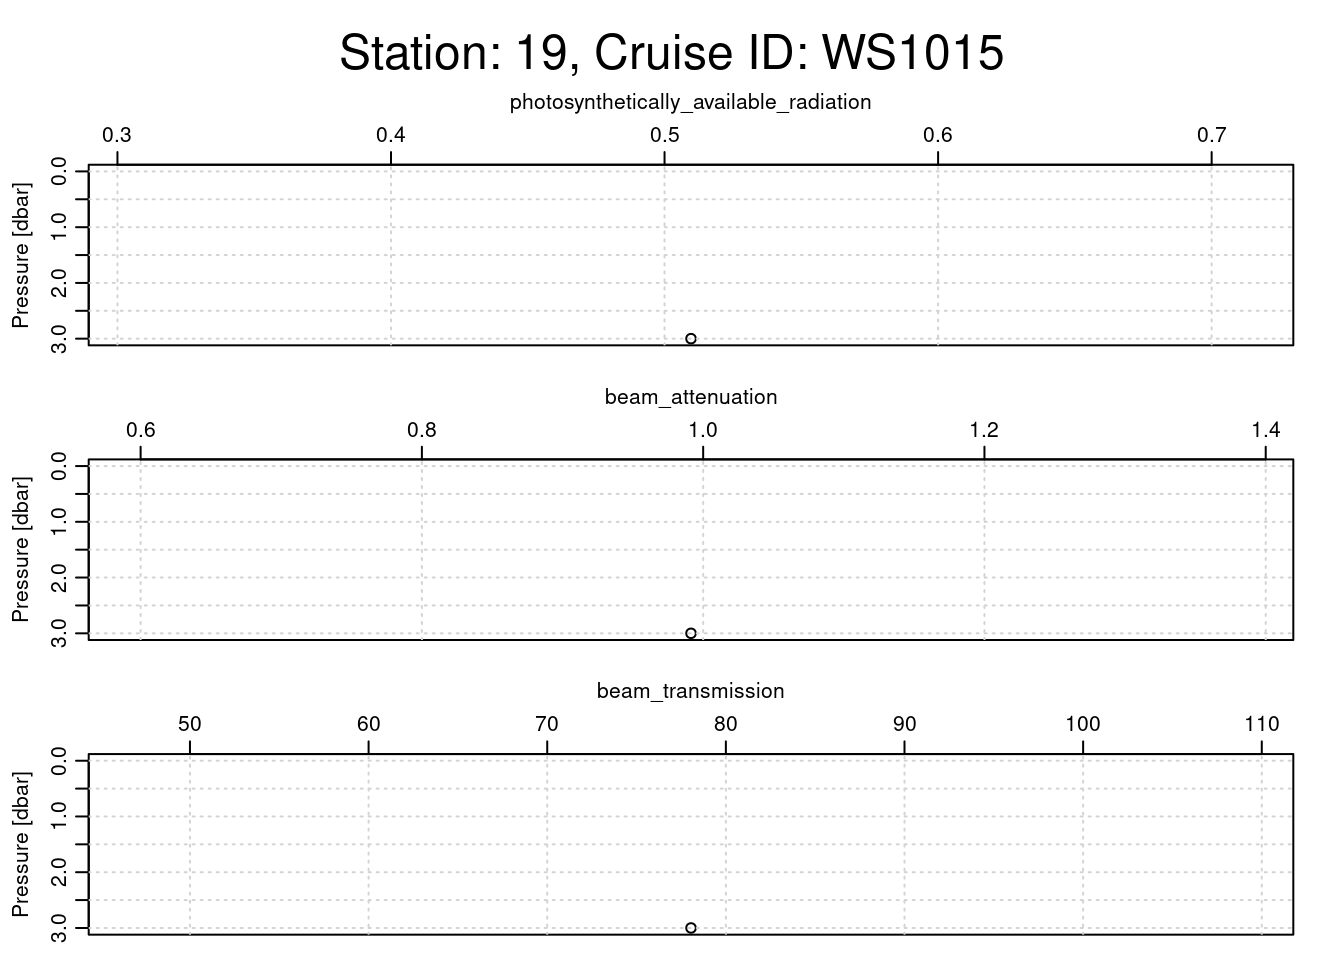
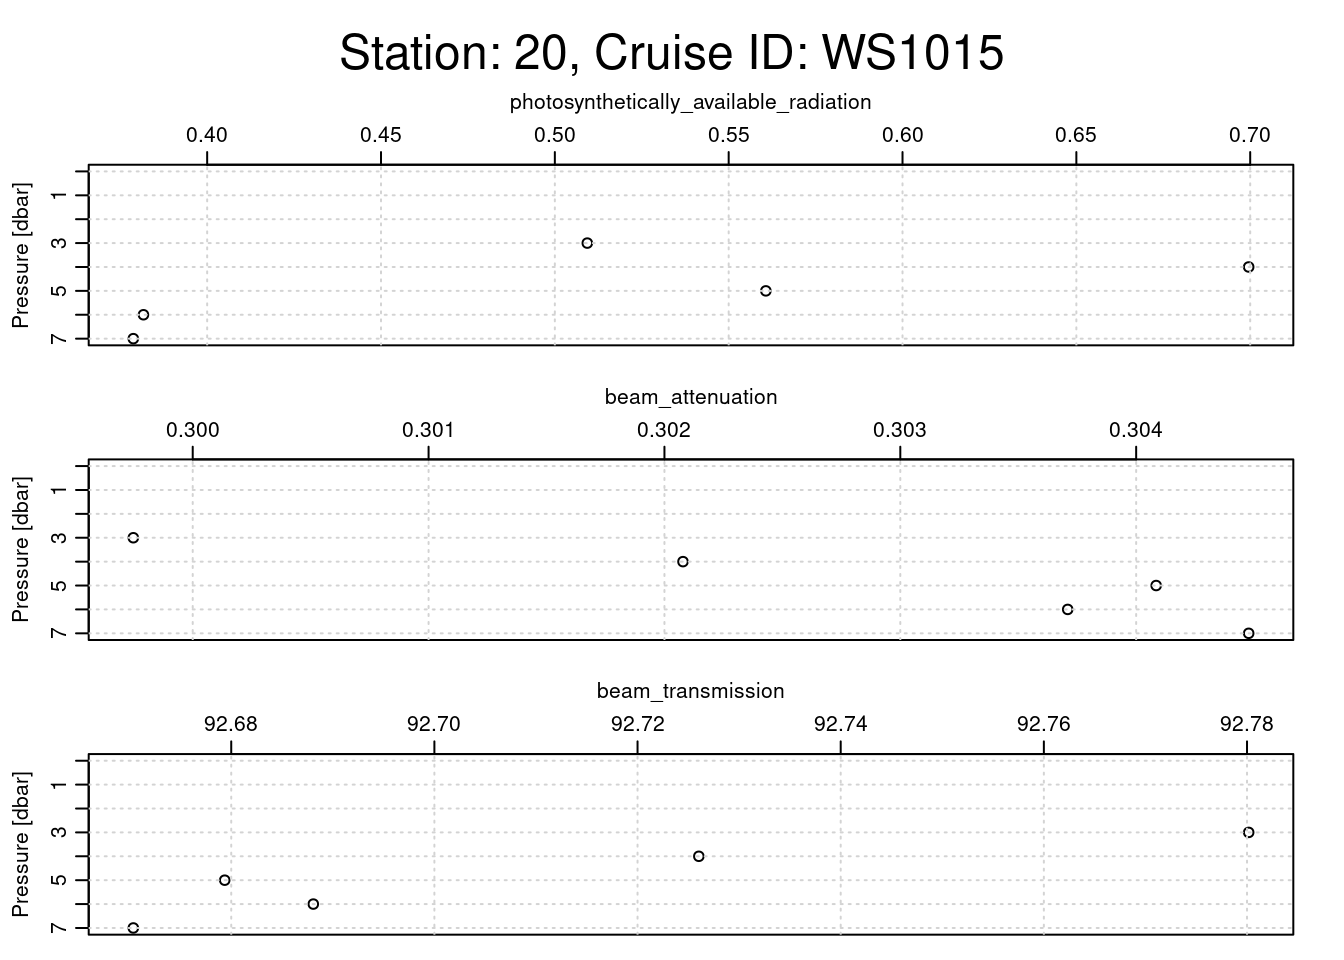
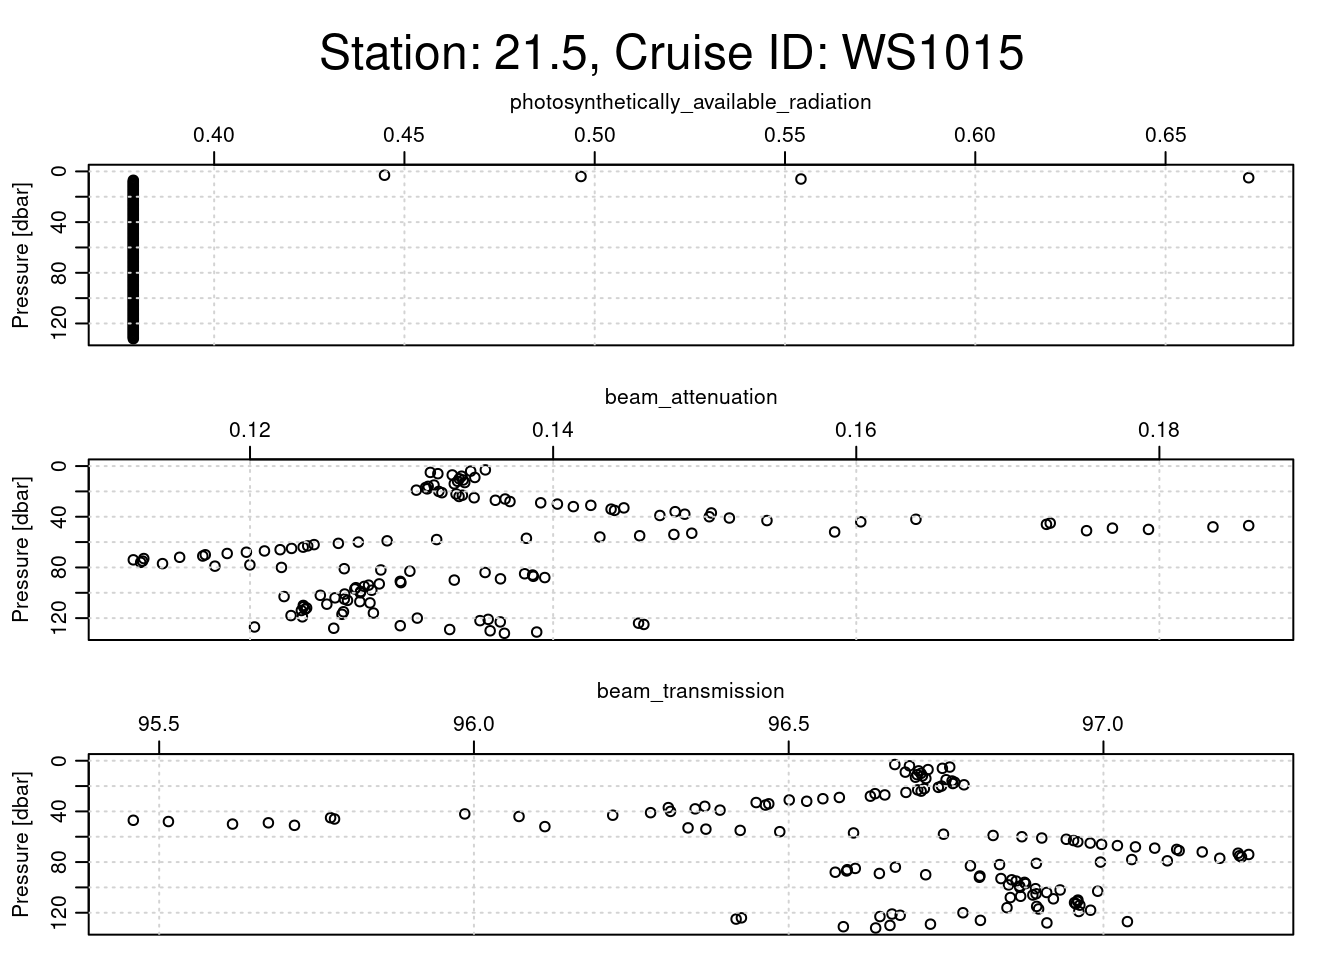
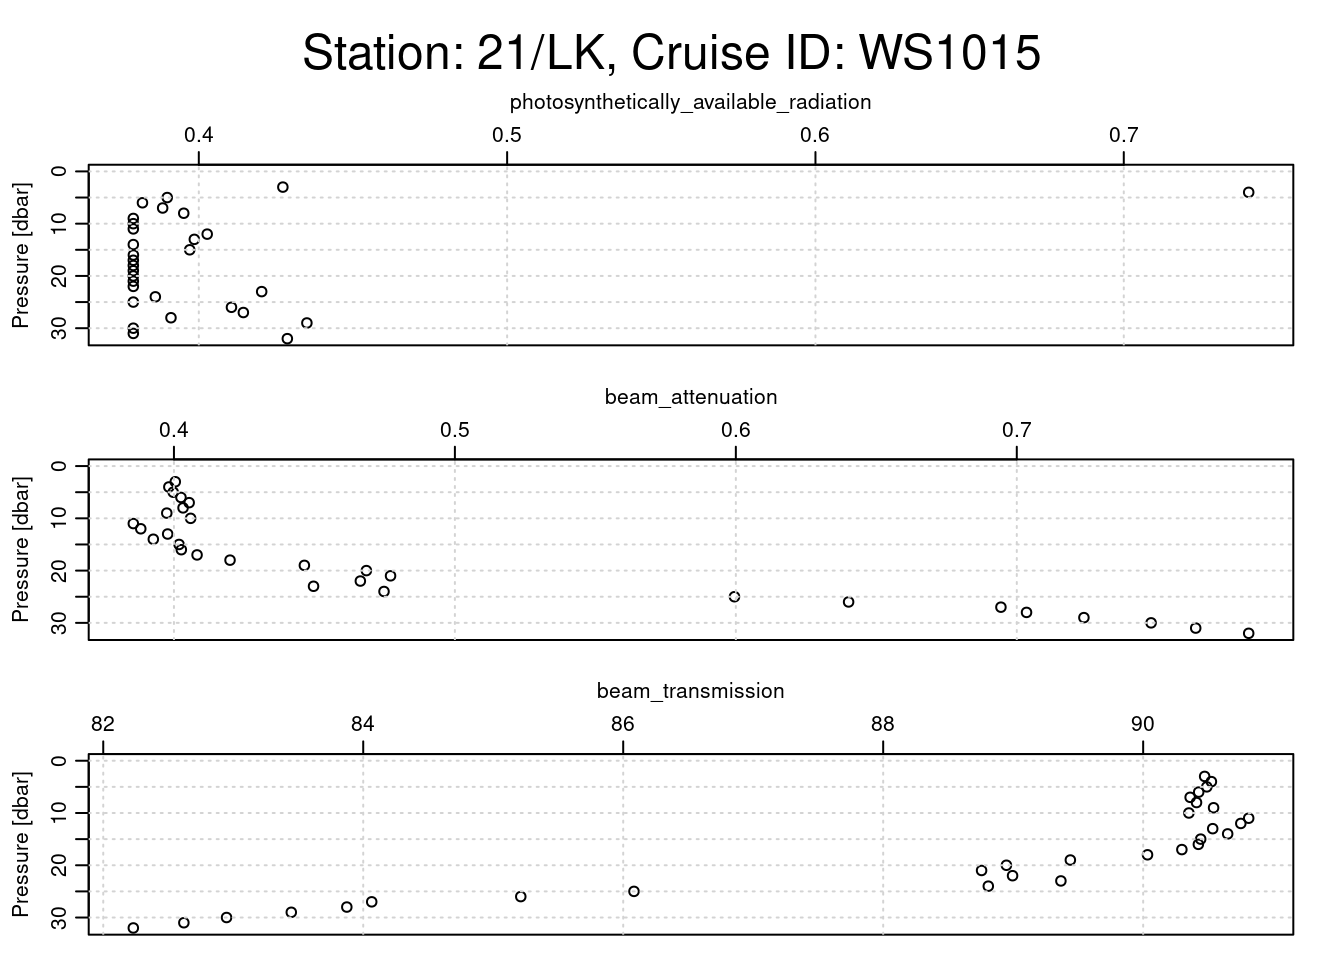
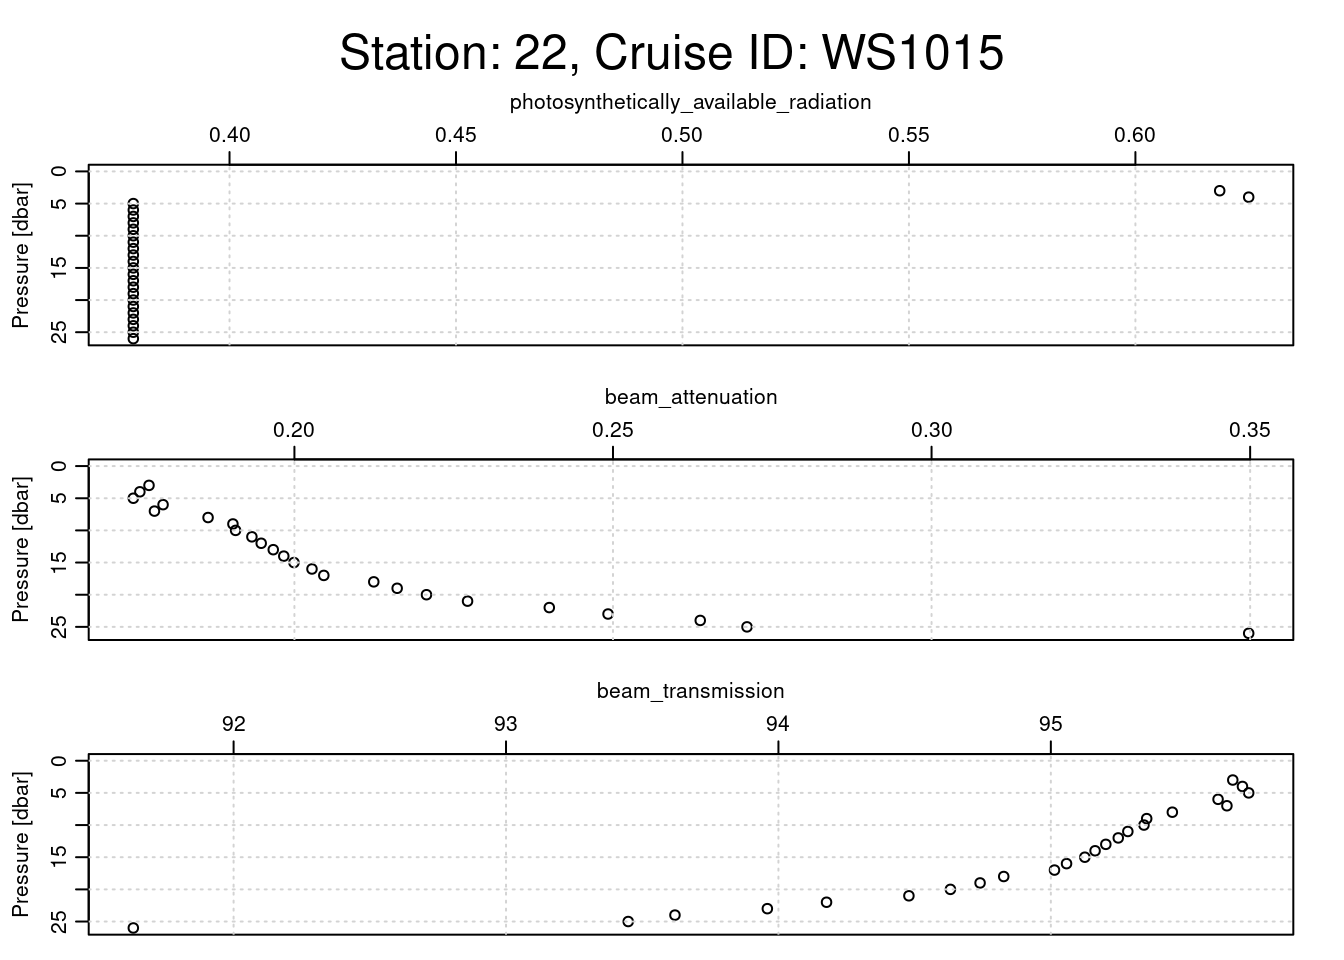
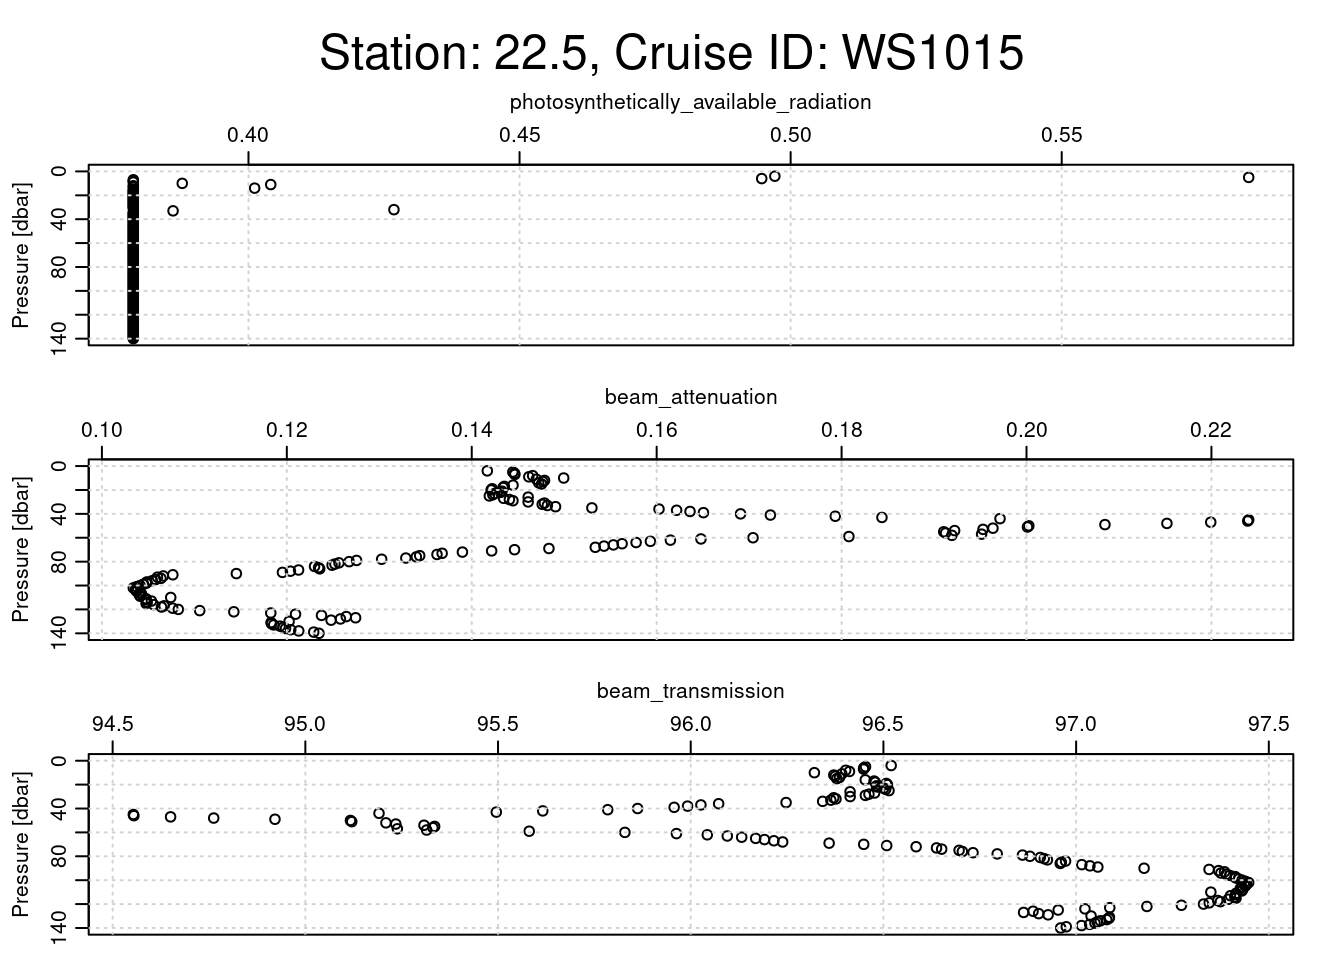
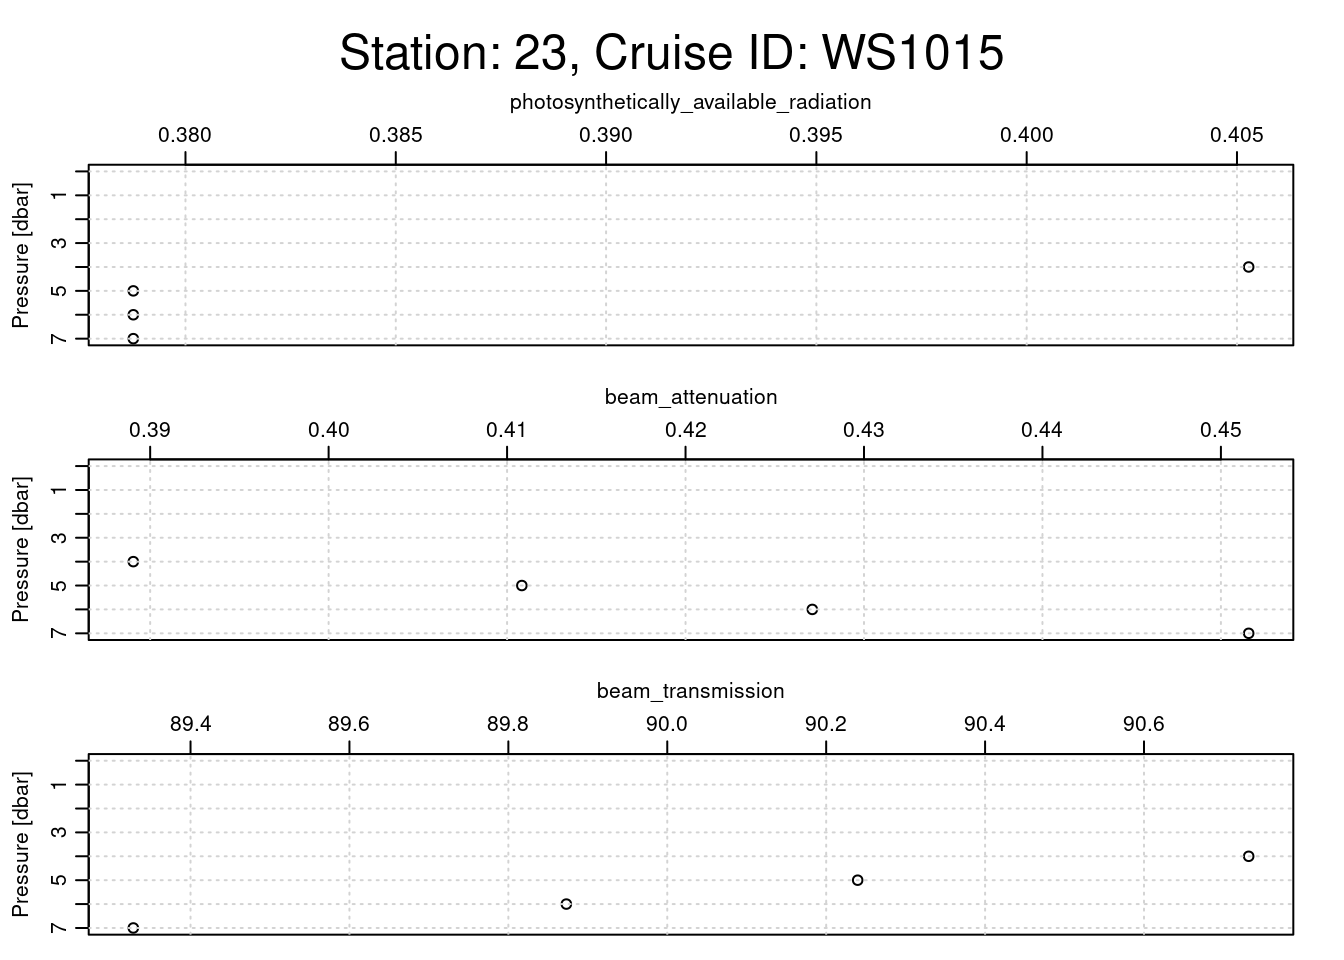
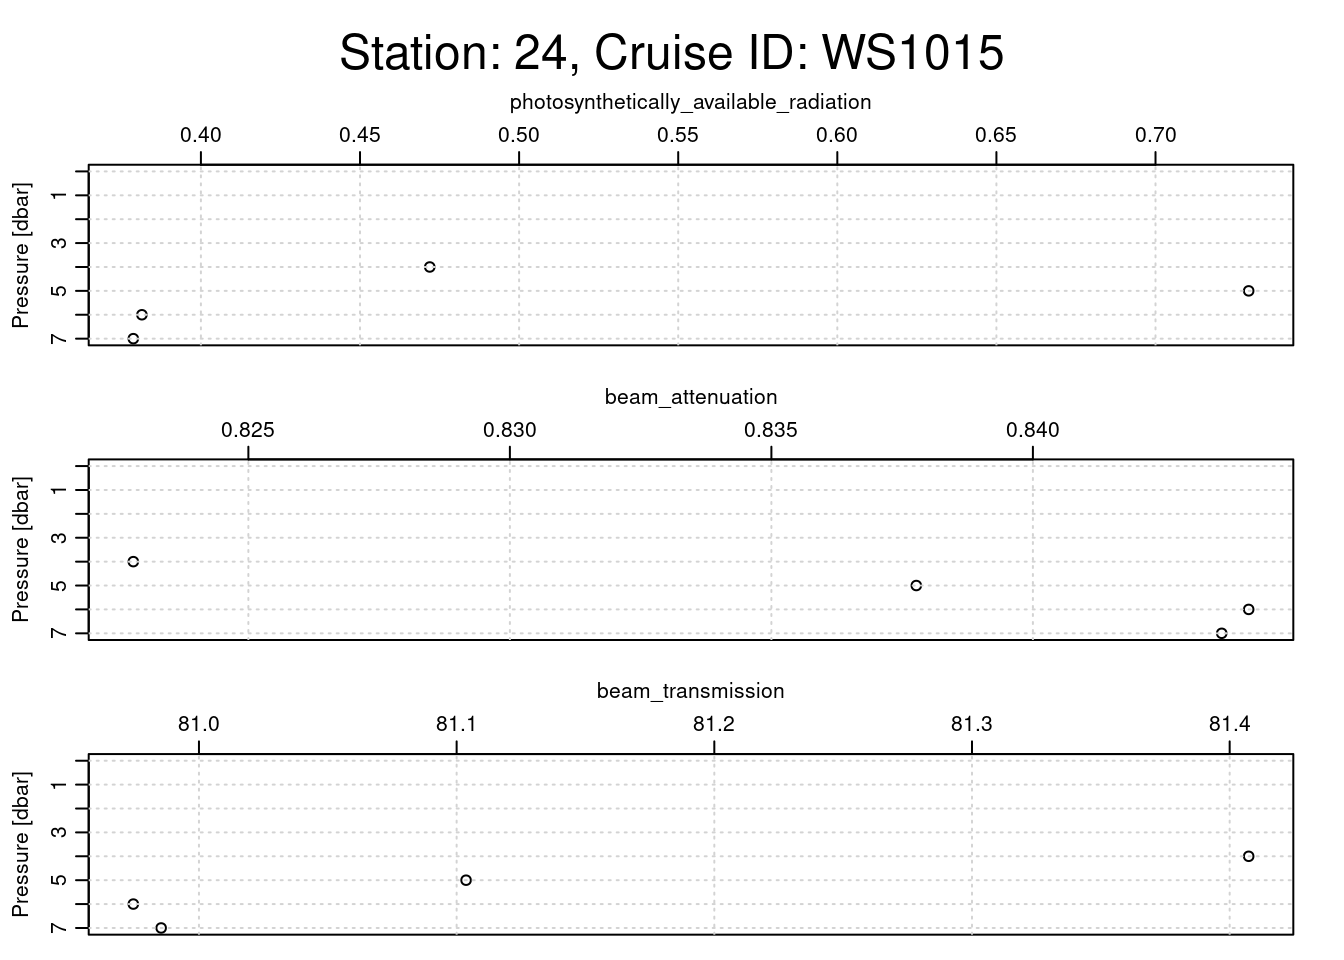
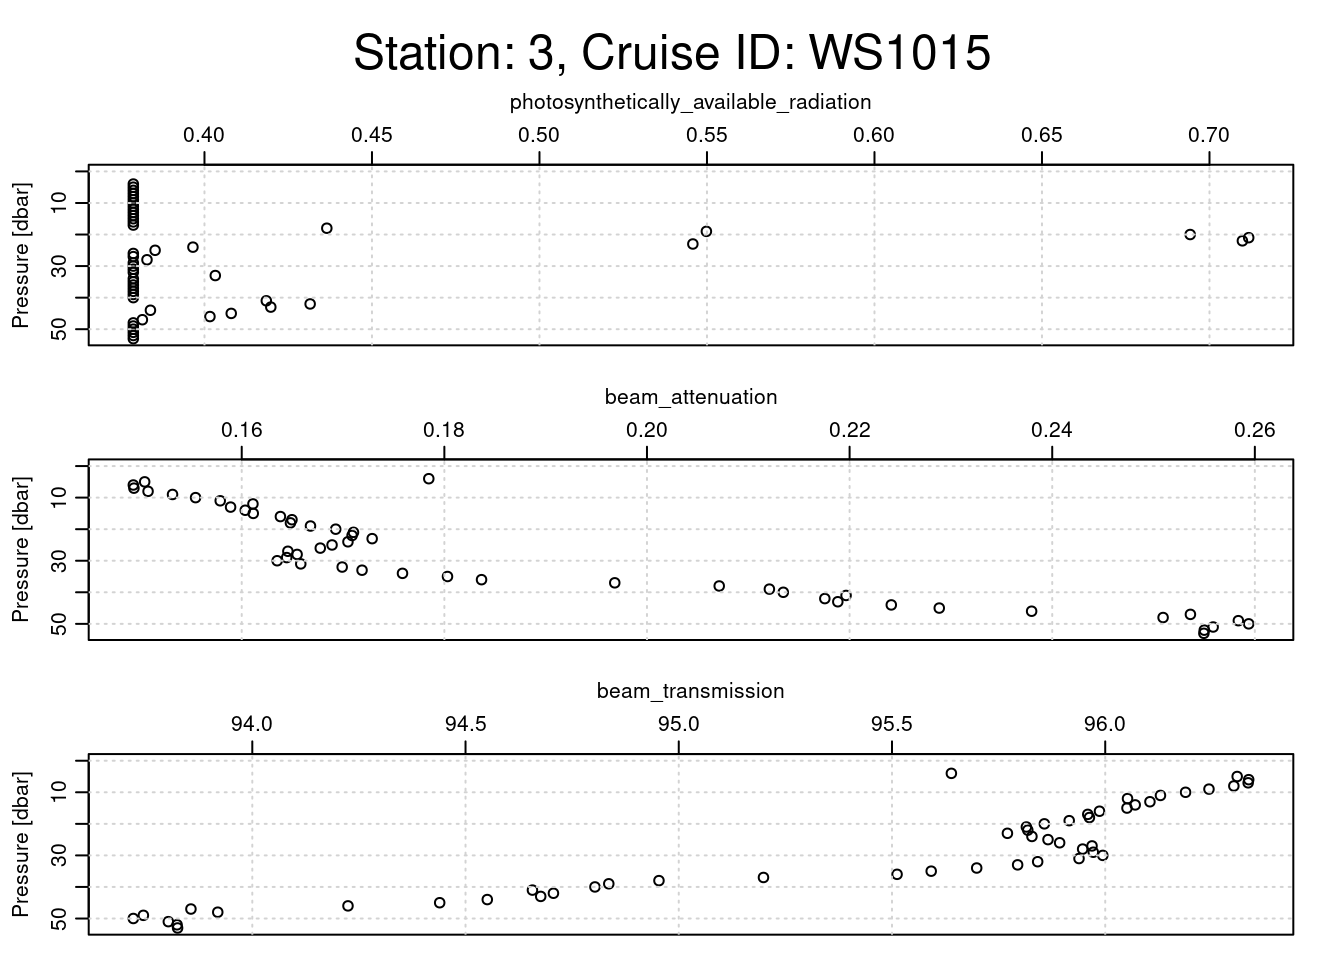
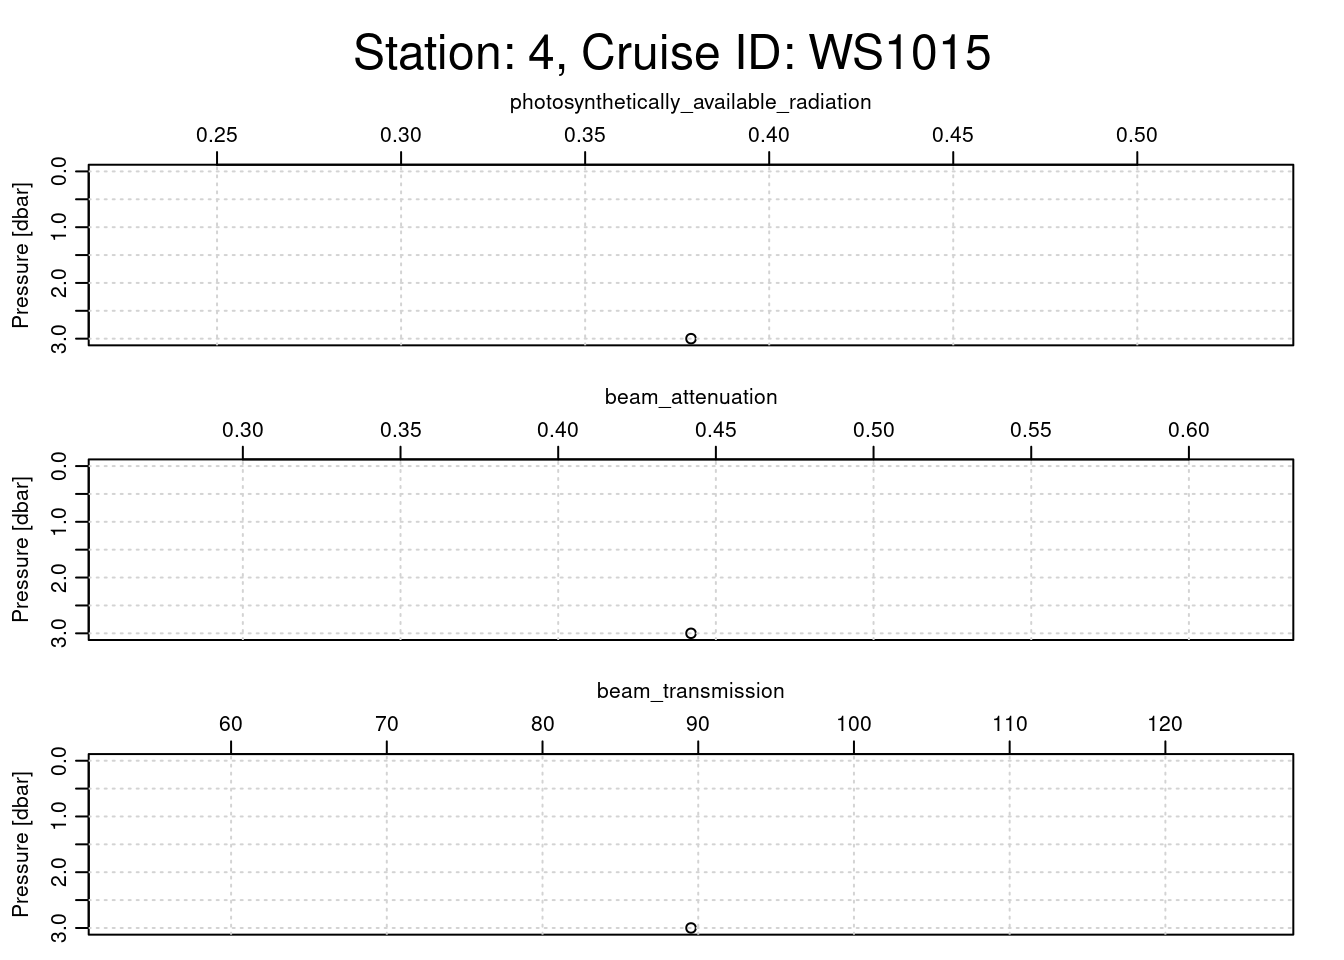
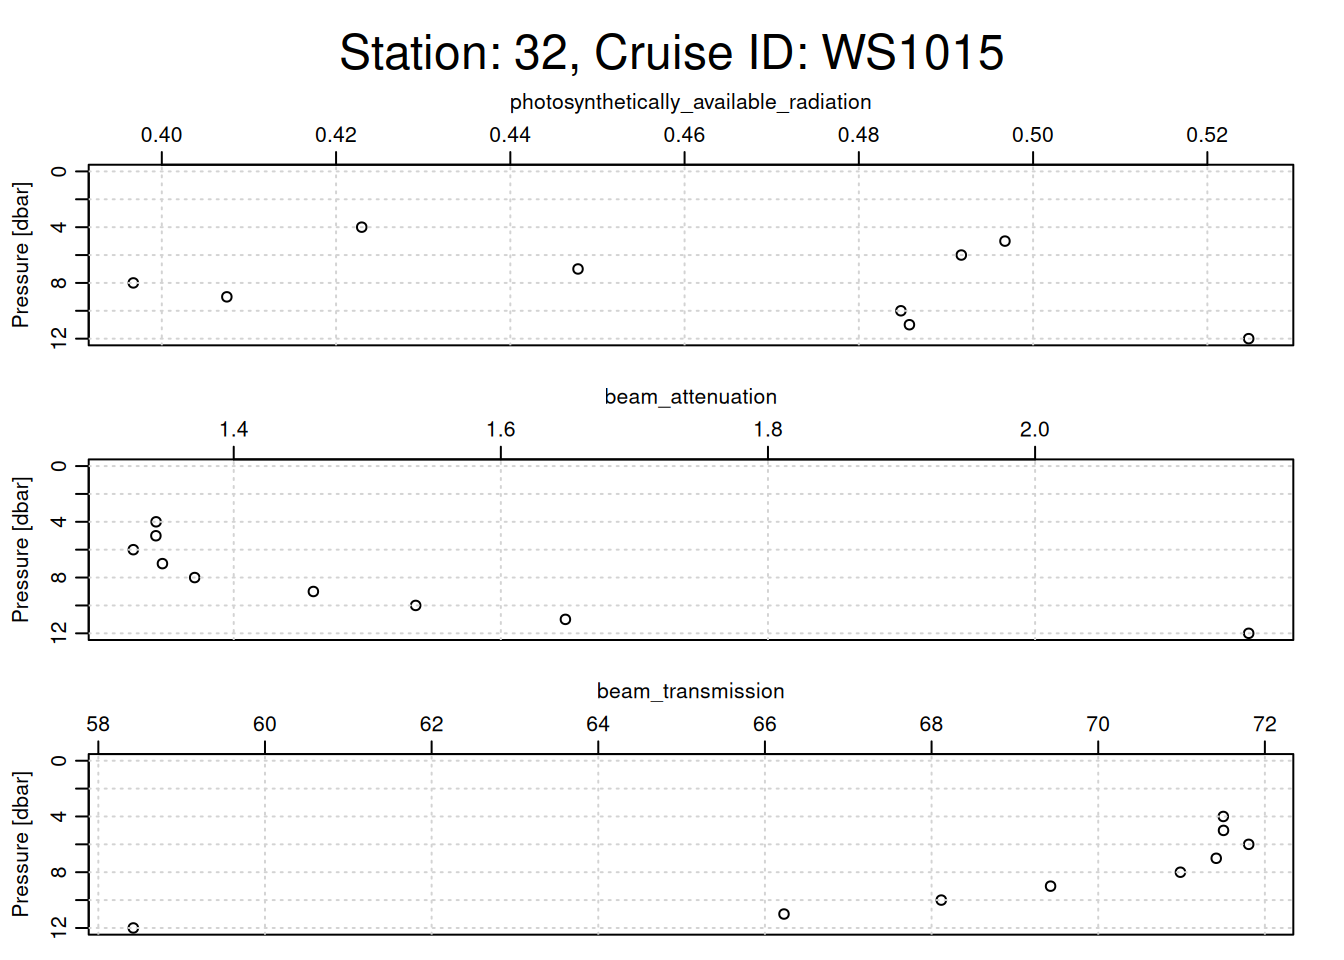
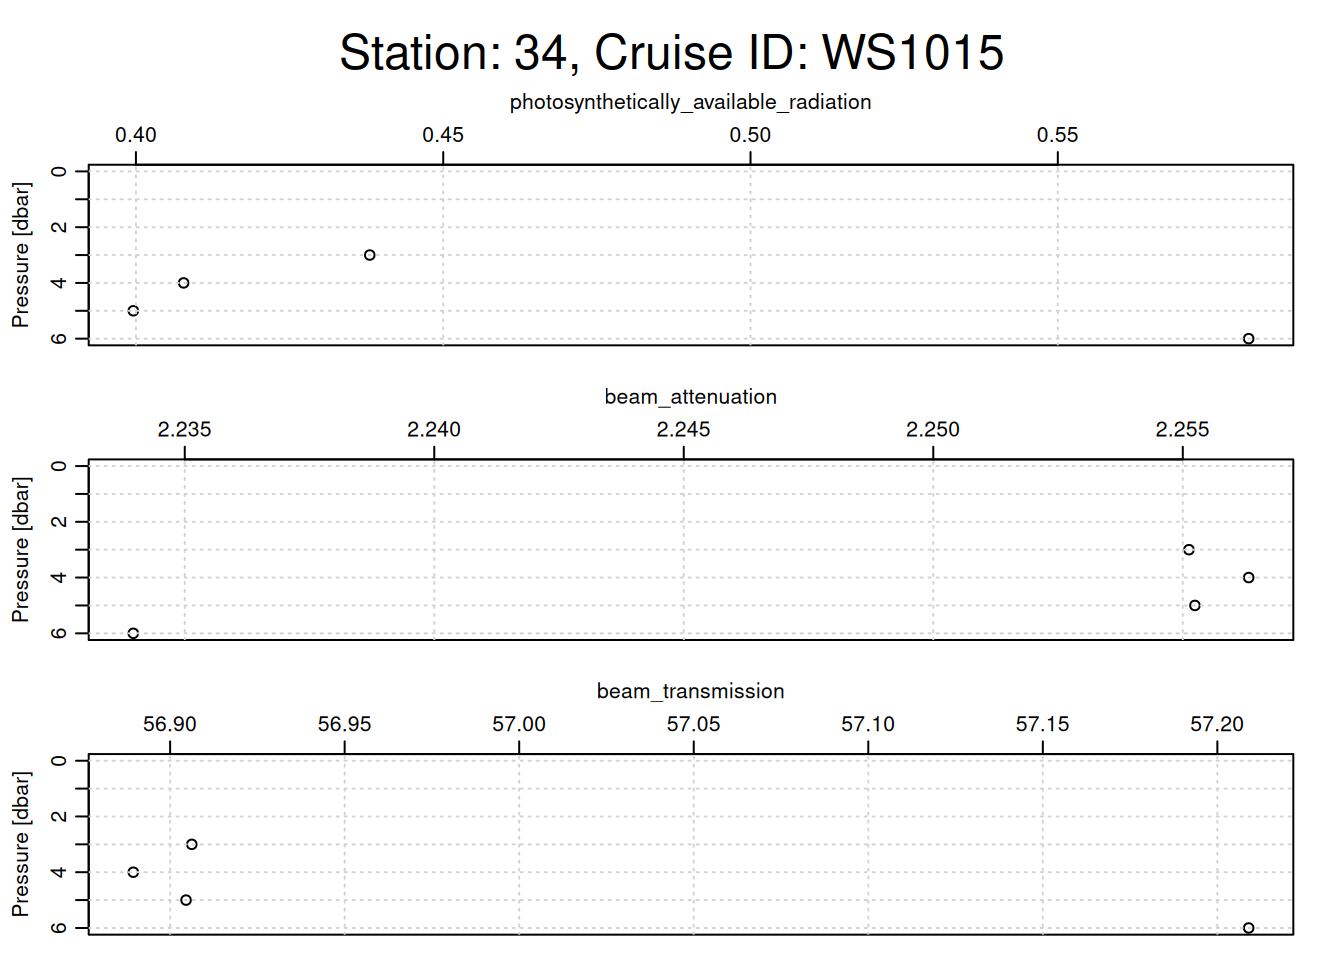
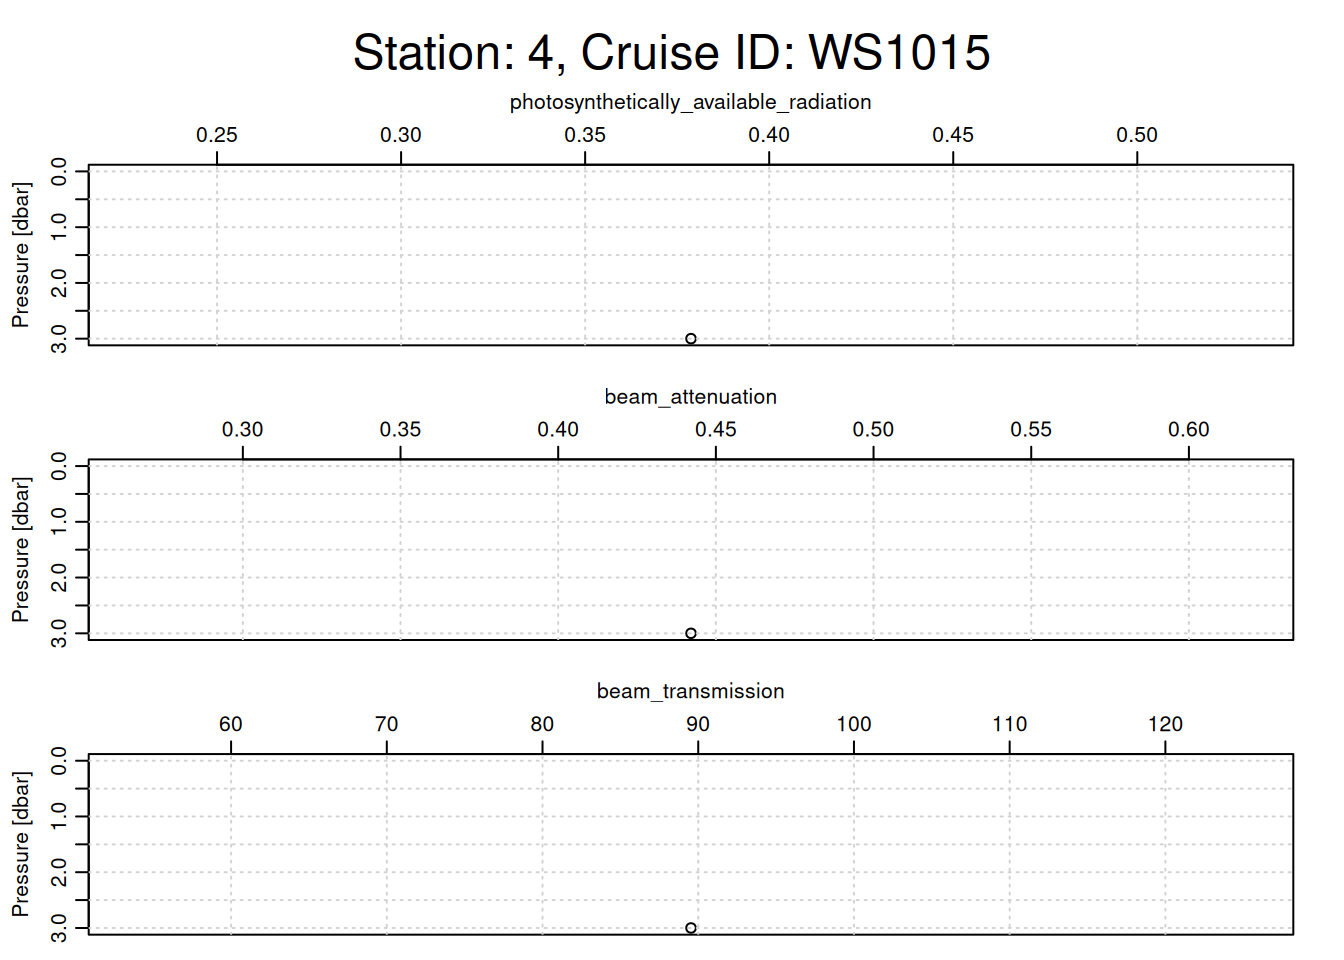
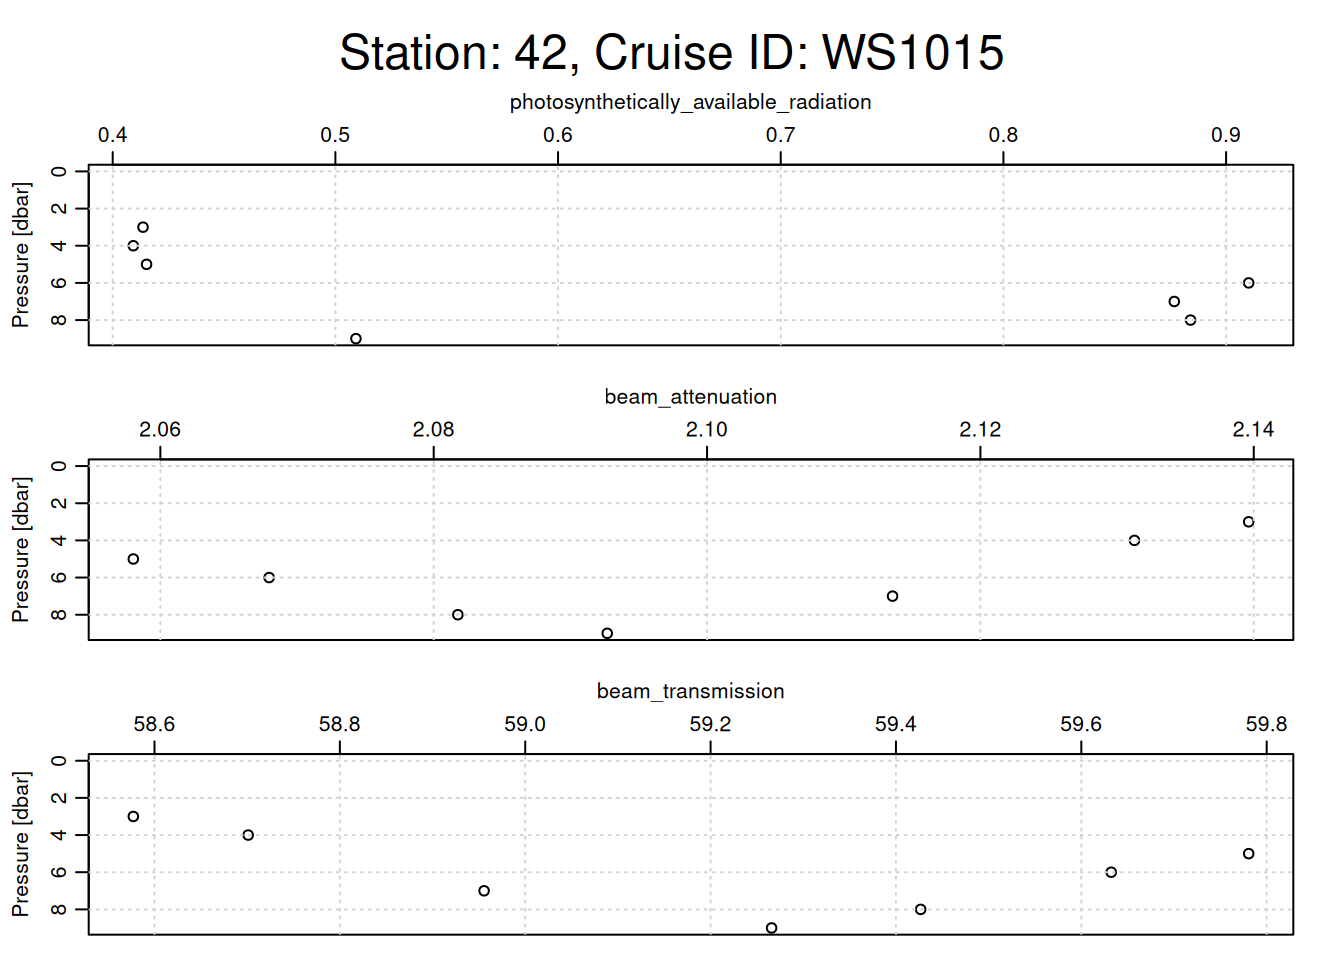
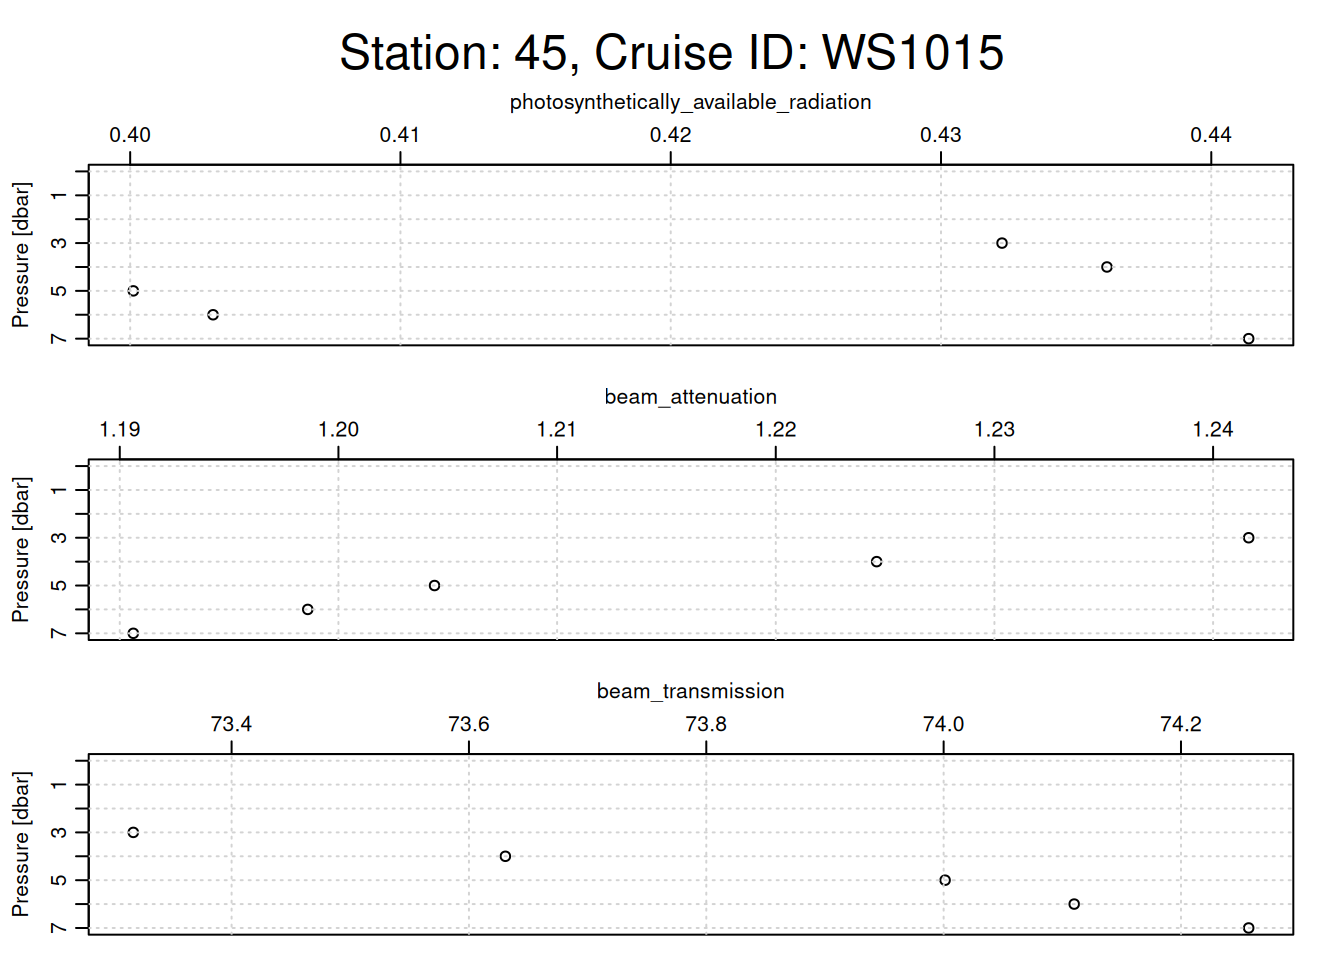
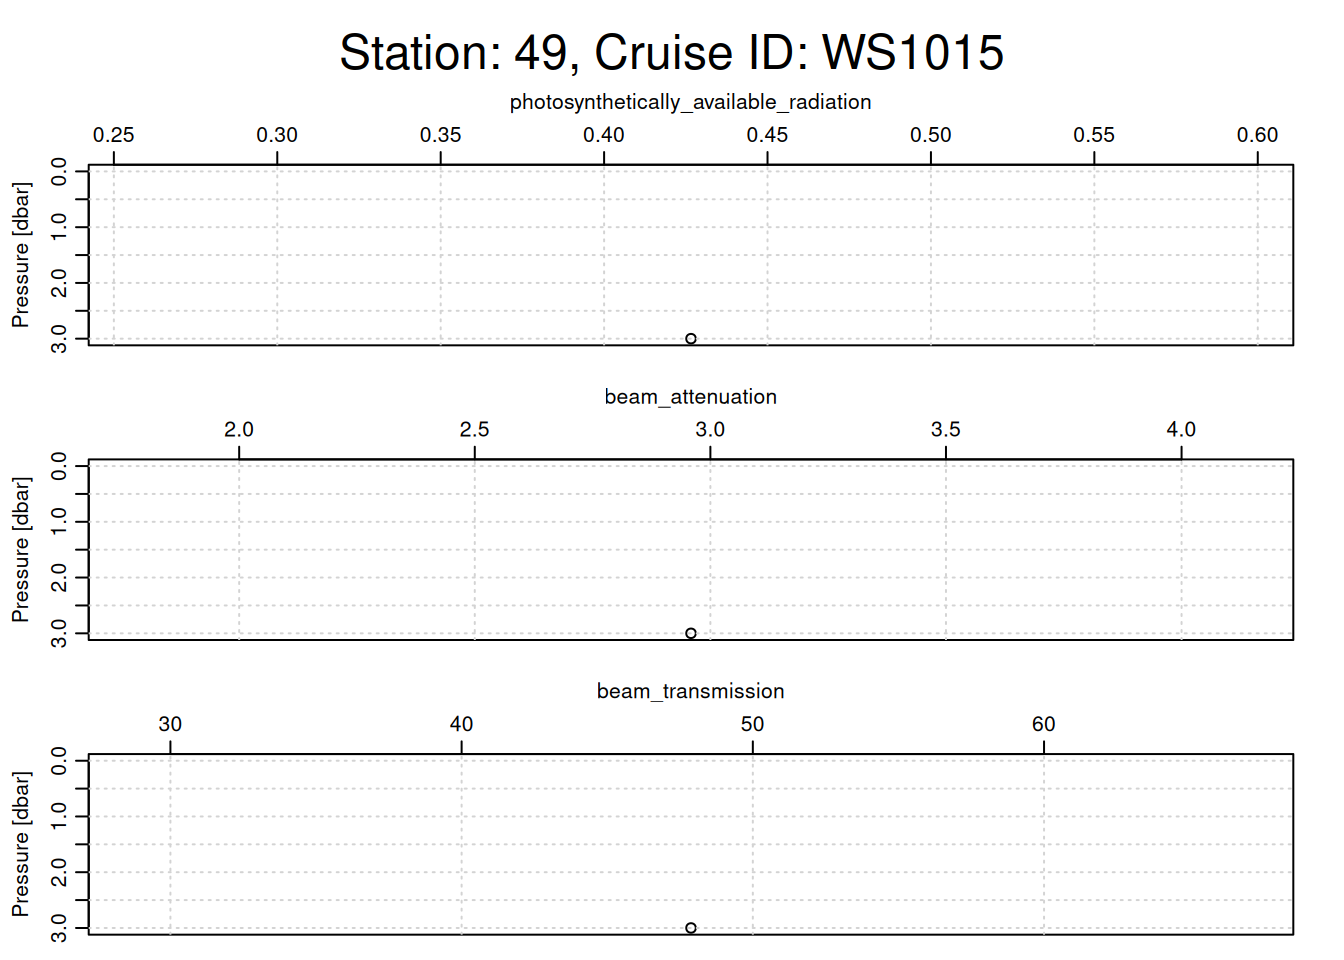
plotting other optical parameters for each cast
# Loop through each CTD castfor (i inseq(ctd_FK)){ cast <- ctd_FK[[i]] # Assuming each sublist contains only one relevant CTD objecttryCatch({# Extract metadata for station name and cruise ID station_name <- cast@metadata$station[1] cruise_id <- cast@data$cruise_id[1]# Generate a title with station name and cruise ID overall_title <- glue::glue("Station: {station_name}, Cruise ID: {cruise_id}")# Set margins: increase the outer margin for the titlepar(oma =c(0, 0, 3, 0)) # Top outer margin increased for title# Plotting function with specific parameters oce::plot(x =ctdDecimate(ctdTrim(cast)),which =c("photosynthetically_available_radiation","beam_attenuation","beam_transmission" ),main =""# No main title for individual subplots )# Place a single overall title at the top of the plot framemtext(overall_title, side =3, line =1, outer =TRUE, cex =1.5)# Reset outer margins to defaultpar(oma =c(0, 0, 0, 0)) }, error =function(e) {print(e$message) # Print any errors that occur during plotting })}
[1] "need finite 'xlim' values"
loop through every cast, clean, & save
combined_df <-data.frame()for (i inseq(ctd_FK)){tryCatch({ cast <- ctd_FK[[i]] # 1 is selecting only the first sublist# print(class(cast))# clean cast trimmed_cast <-ctdTrim(cast) decimated_cast <-ctdDecimate(trimmed_cast, p =0.5) # binned to 0.5 m# convert to df cast_df <-as.data.frame(decimated_cast@data)# Add metadata# assumes station ID and cruise ID the same for all & just uses 1st one cast_df <-mutate( cast_df,station = cast@data$station[1],cruise_id = cast@data$cruise_id[1] )# drop NA rows left by cleaning cast_df <-subset(cast_df, !is.na(scan))# Append the data to the combined dataframe combined_df <-rbind(combined_df, cast_df) }, error =function(e){print(glue("error in cast {cast@metadata$station[1]}"))print(e) })}# Save to CSVfile_path <-here(glue("data/cleaned/{cruise_id}.csv"))write.csv(combined_df, file_path, row.names =FALSE)