tryCatch({ plots <-list()for (station_name inunique(cruise_df$station)) { subset_df <-filter(cruise_df, station == station_name) plots[[station_name]] <-ggplot(subset_df, aes(x = time_elapsed)) +geom_point(aes(y = depth), color ="blue") +# Plot depth in bluegeom_line(aes(y = sea_water_pressure), color ="red") +# Plot sea water pressure in redggtitle(glue("{station_name}")) +theme(axis.title.x =element_blank(),axis.title.y =element_blank(),axis.text.x =element_blank(),axis.text.y =element_blank(),axis.ticks.x =element_blank(),axis.ticks.y =element_blank() ) # Remove individual axis titles and text }# drop nulls plots <- purrr::compact(plots)# Combine all plots into a grid combined_plot <-wrap_plots(plots) +plot_layout(ncol =4) +# Adjust ncol to set number of columns in the gridplot_annotation(title ="Depth (blue) and Pressure (red)",subtitle ="Each panel represents a different station",caption ="Time Elapsed (x-axis) vs Depth & Pressure (y-axis)" ) +theme(plot.tag =element_text(size =12, face ="bold"),plot.tag.position ="topleft",axis.title.x =element_text(margin =margin(t =10)),axis.title.y =element_text(margin =margin(r =10)) )print(combined_plot)}, error =function(er){print(er)});
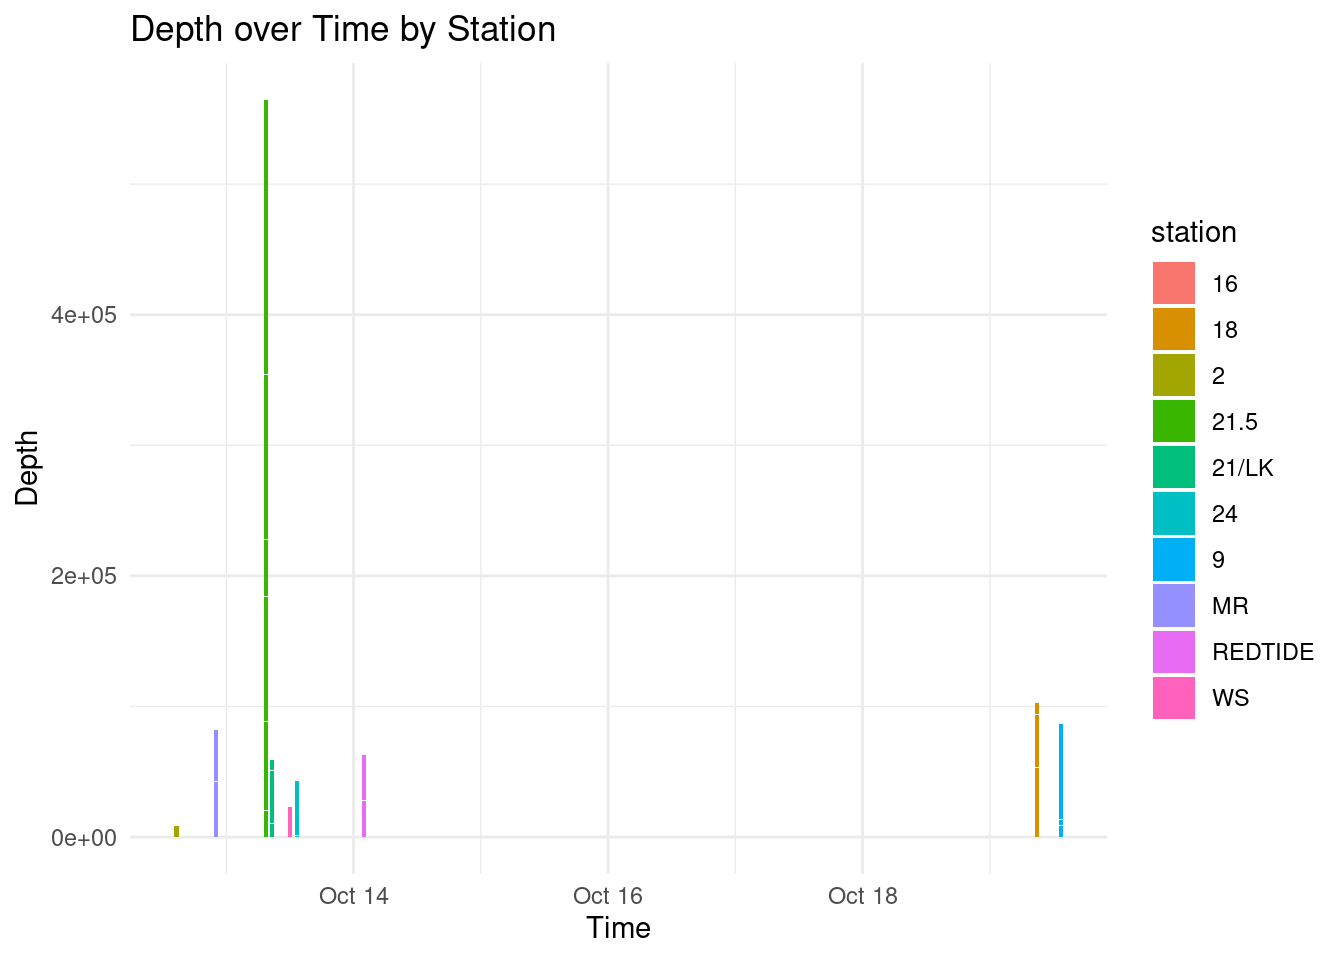
p <-ggplot(cruise_df, aes(x = time, y = depth, fill = station)) +geom_col() +# This creates the bars# geom_text(aes(label = station), vjust = -0.3) + # This adds labels to each bar, adjust vjust for positionlabs(x ="Time", y ="Depth", title ="Depth over Time by Station") +# Set labels and titletheme_minimal() # Use a minimal themeprint(p)
create oce.ctd objects from dataframes
ctd_load <-function(data, other_params =NULL) {# create csv into ctd object test_ctd <-as.ctd(salinity = data$sea_water_salinity,temperature = data$sea_water_temperature,pressure = data$sea_water_pressure,station = data$station )# add additional columns to ctd objectif (!is.null(other_params)) {for (param_name in other_params) { test_ctd <-oceSetData(object = test_ctd,name = param_name,value = data[[param_name]] ) } }print(glue("{data$station[1]}:\t{length(test_ctd@data$scan)} scans"))return(test_ctd)}# Define other parameters to addother_params <-c("cruise_id", "station", "time", "time_elapsed", "latitude", "longitude", "sea_water_electrical_conductivity", "CDOM", "dissolved_oxygen","oxygen_saturation", "chlorophyll_concentration", "chlorophyll_fluorescence", "photosynthetically_available_radiation", "beam_attenuation","beam_transmission", "depth", "sea_water_sigma_t","descent_rate", "sound_velocity","altimeter")# Split data by station and create data listctd_FK <- cruise_df %>%split(.$station) %>%map(~ctd_load(.x, other_params = other_params)) # ~ is a lambda(x)
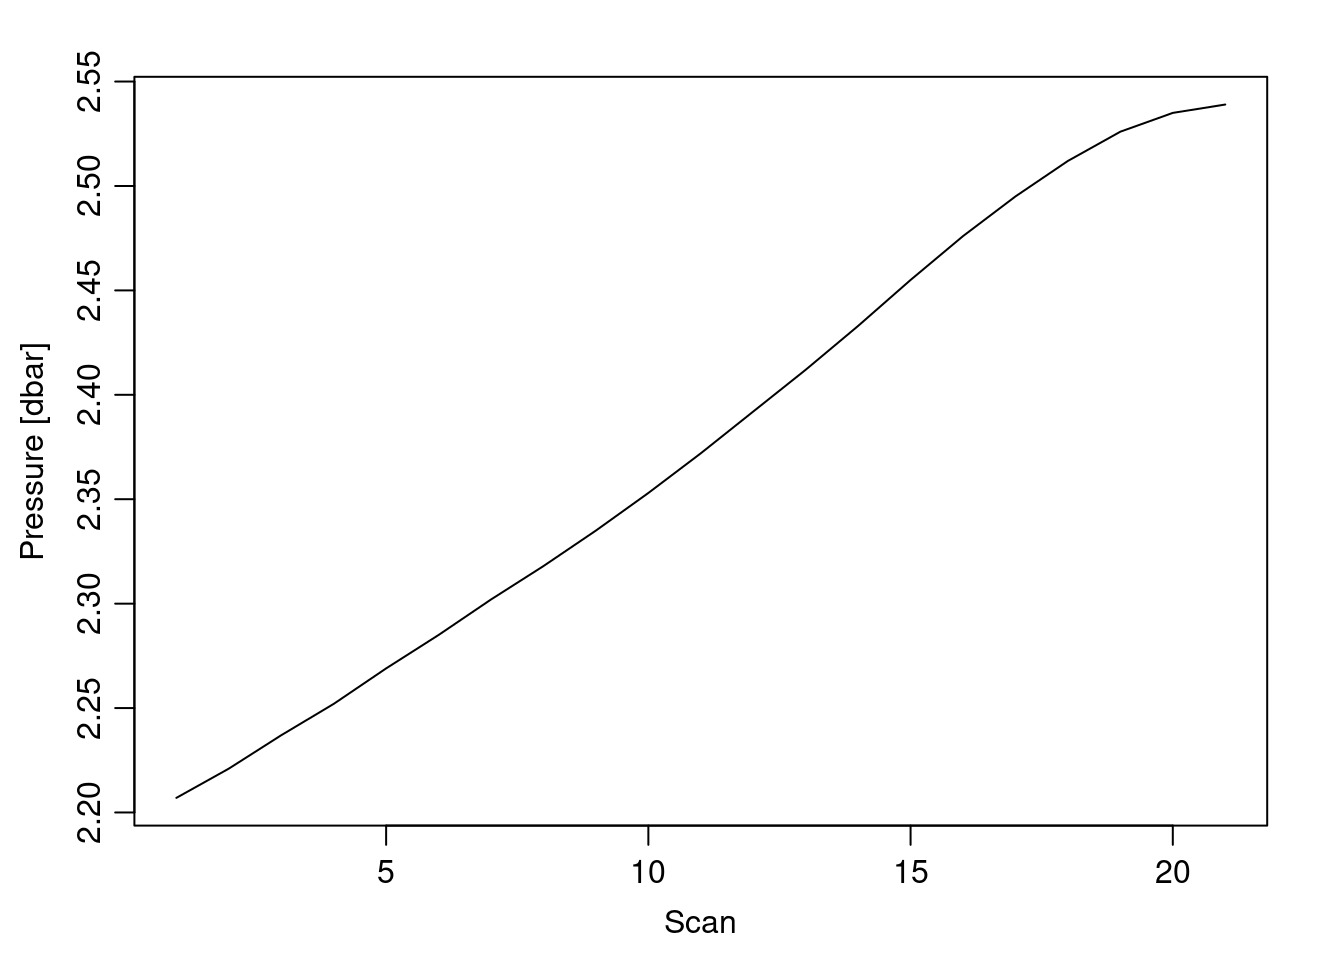
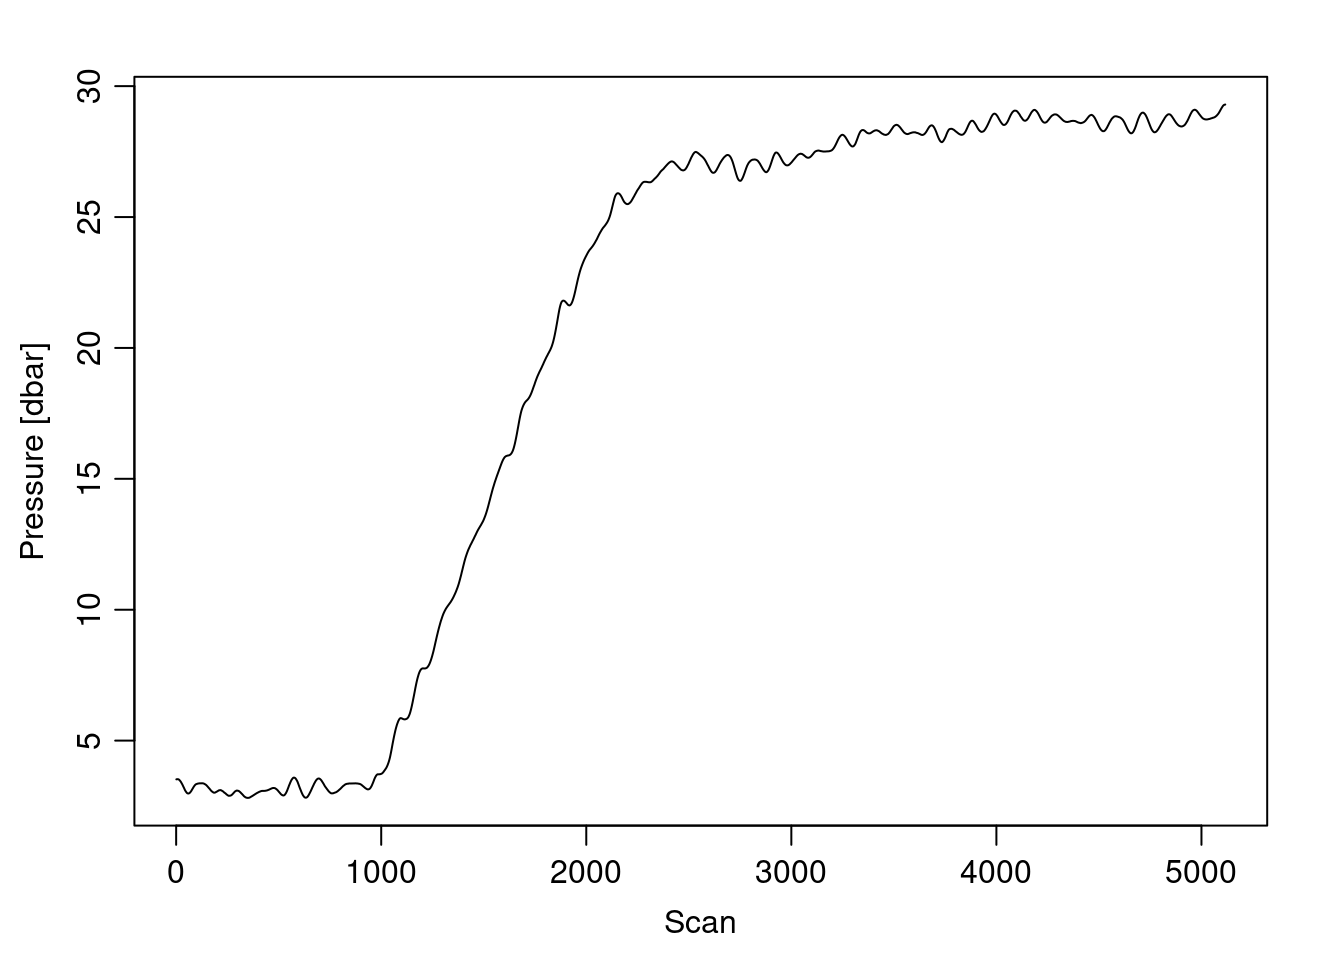
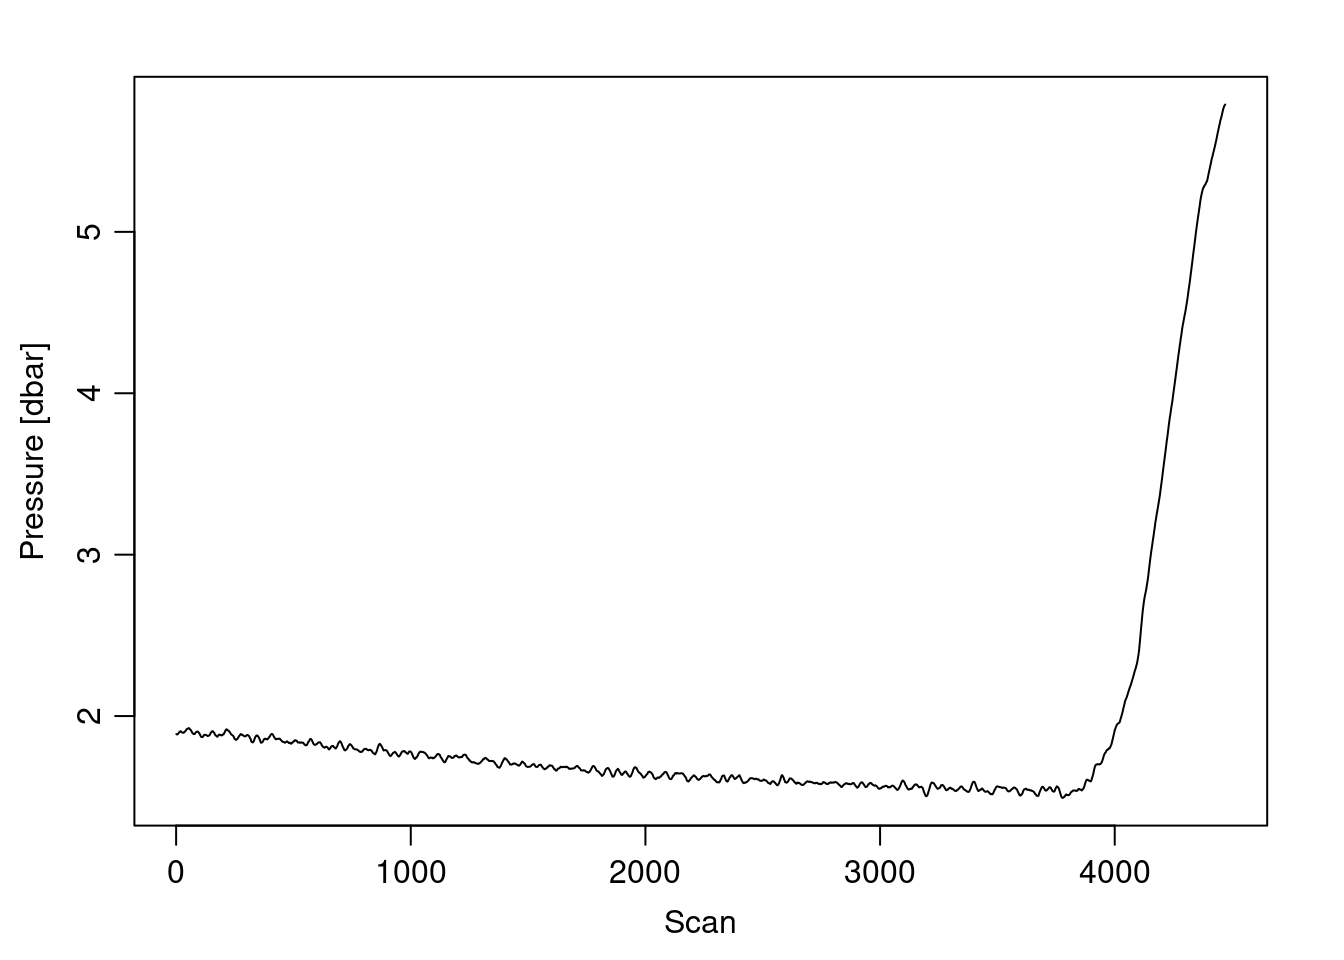
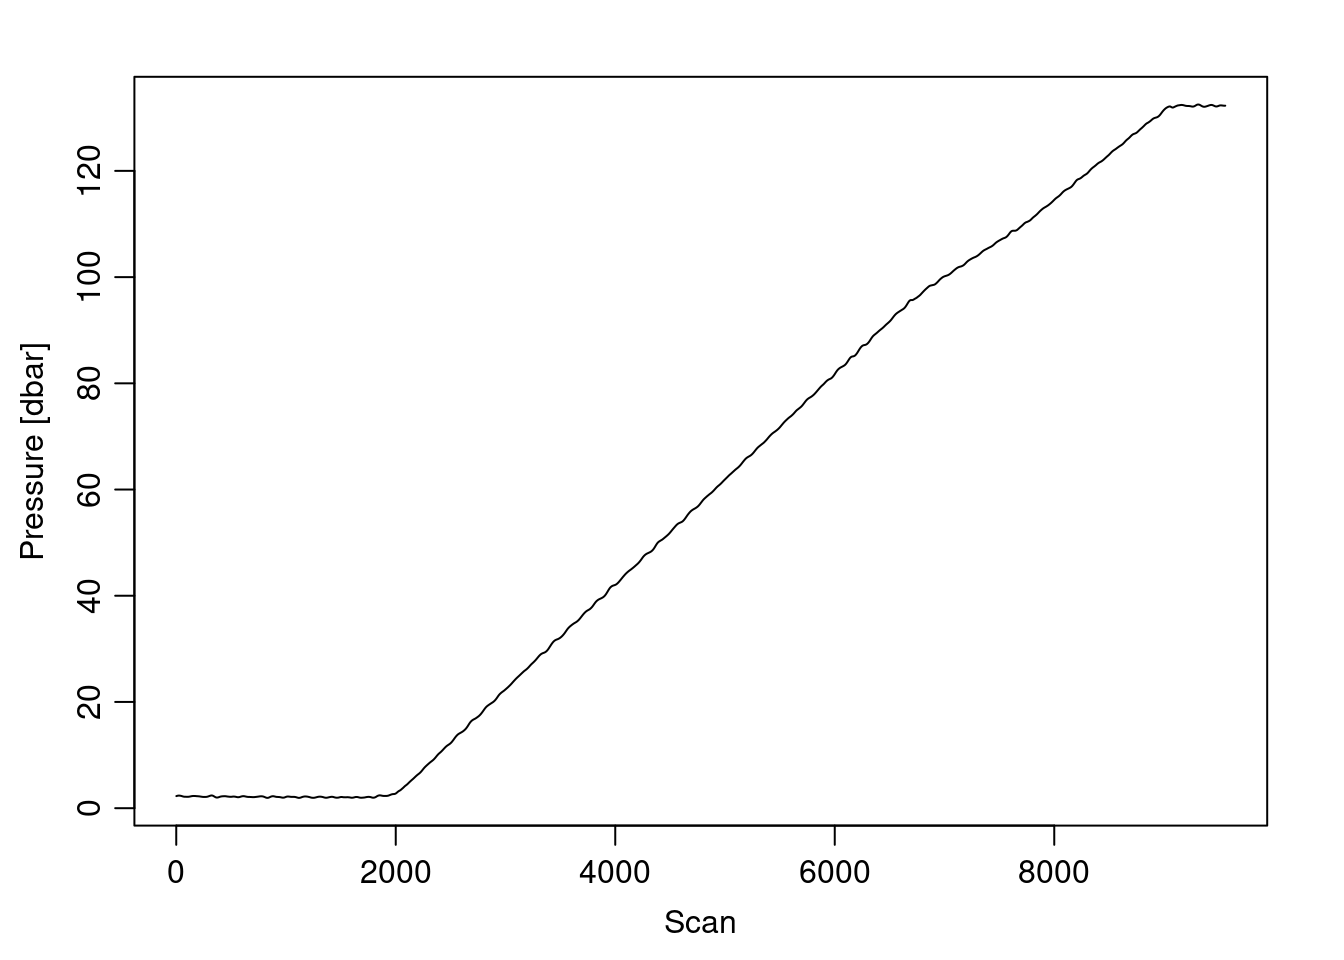
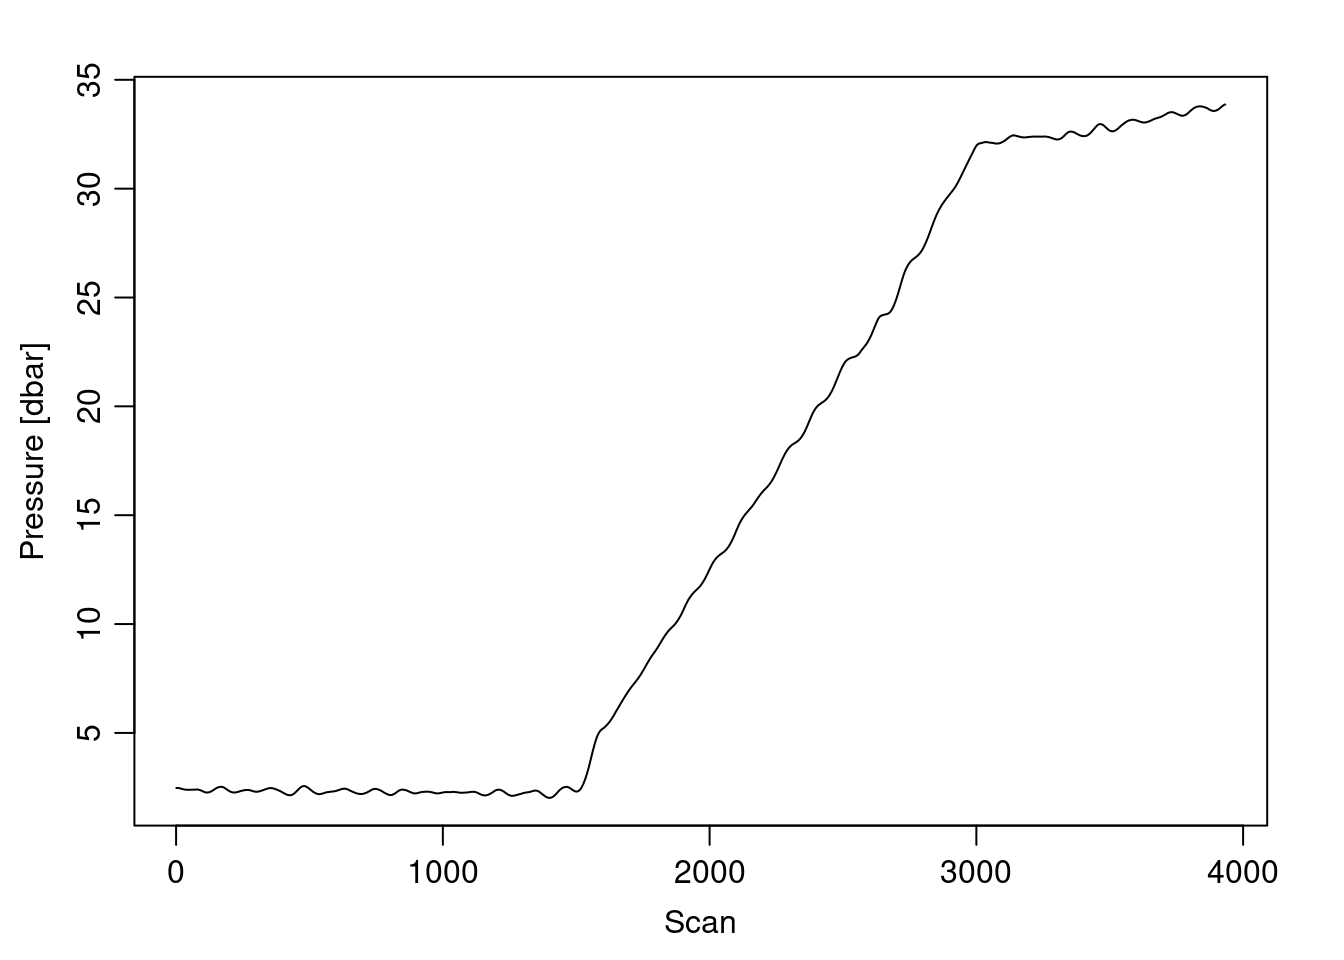
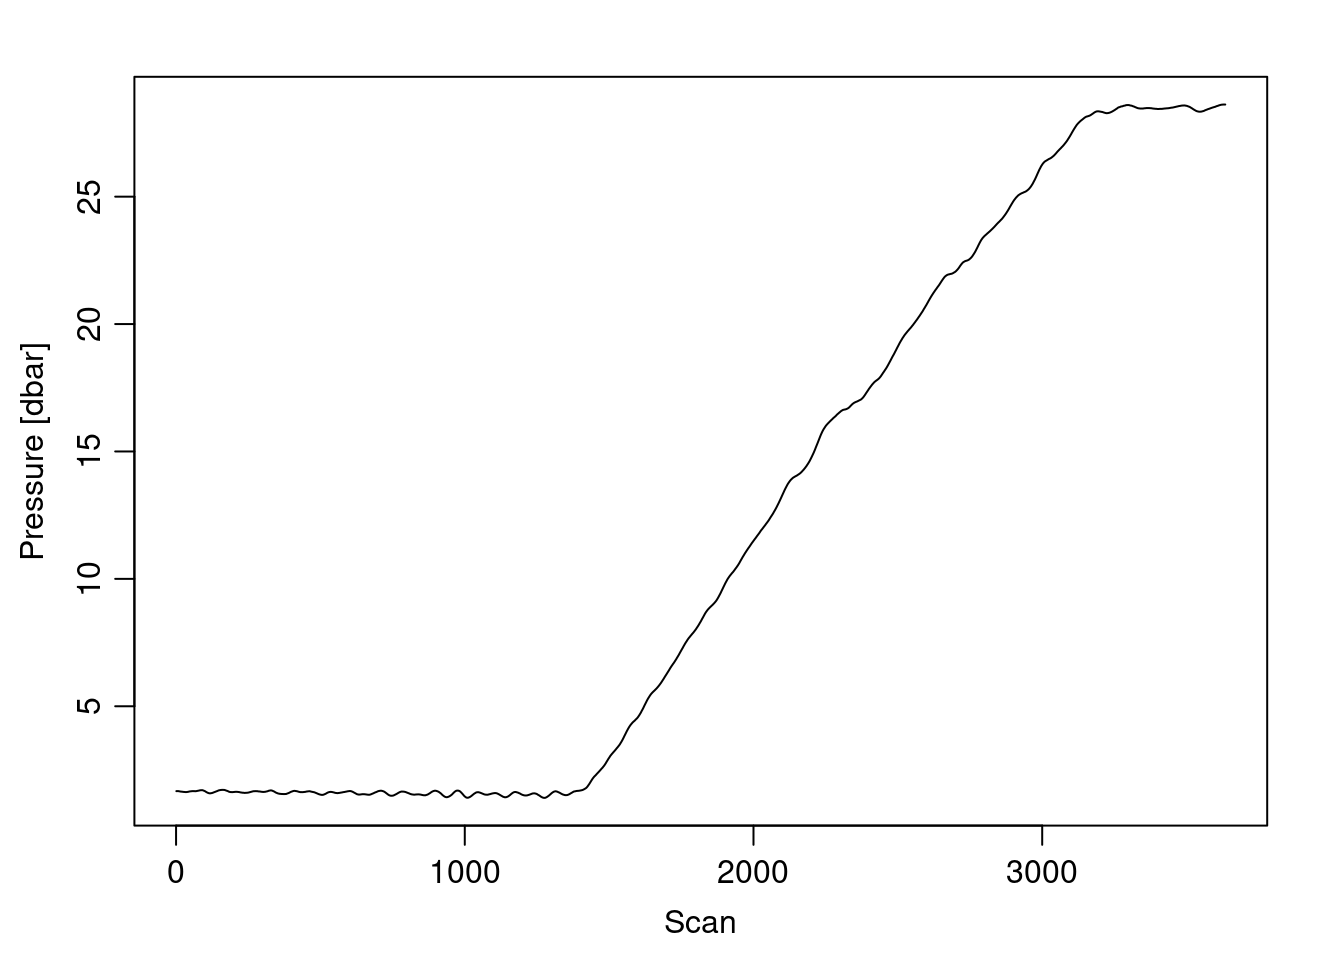
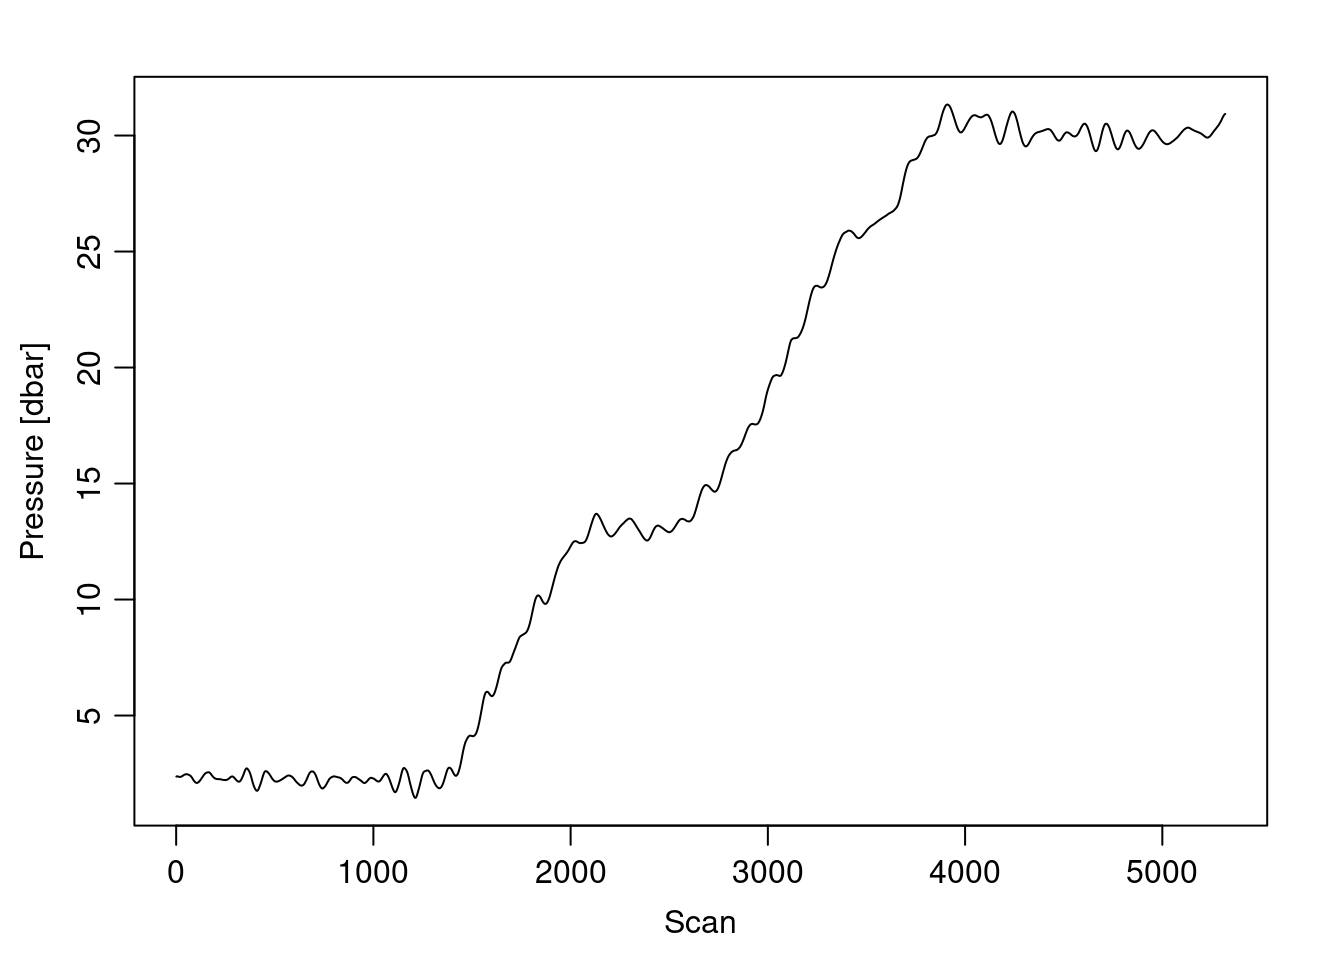
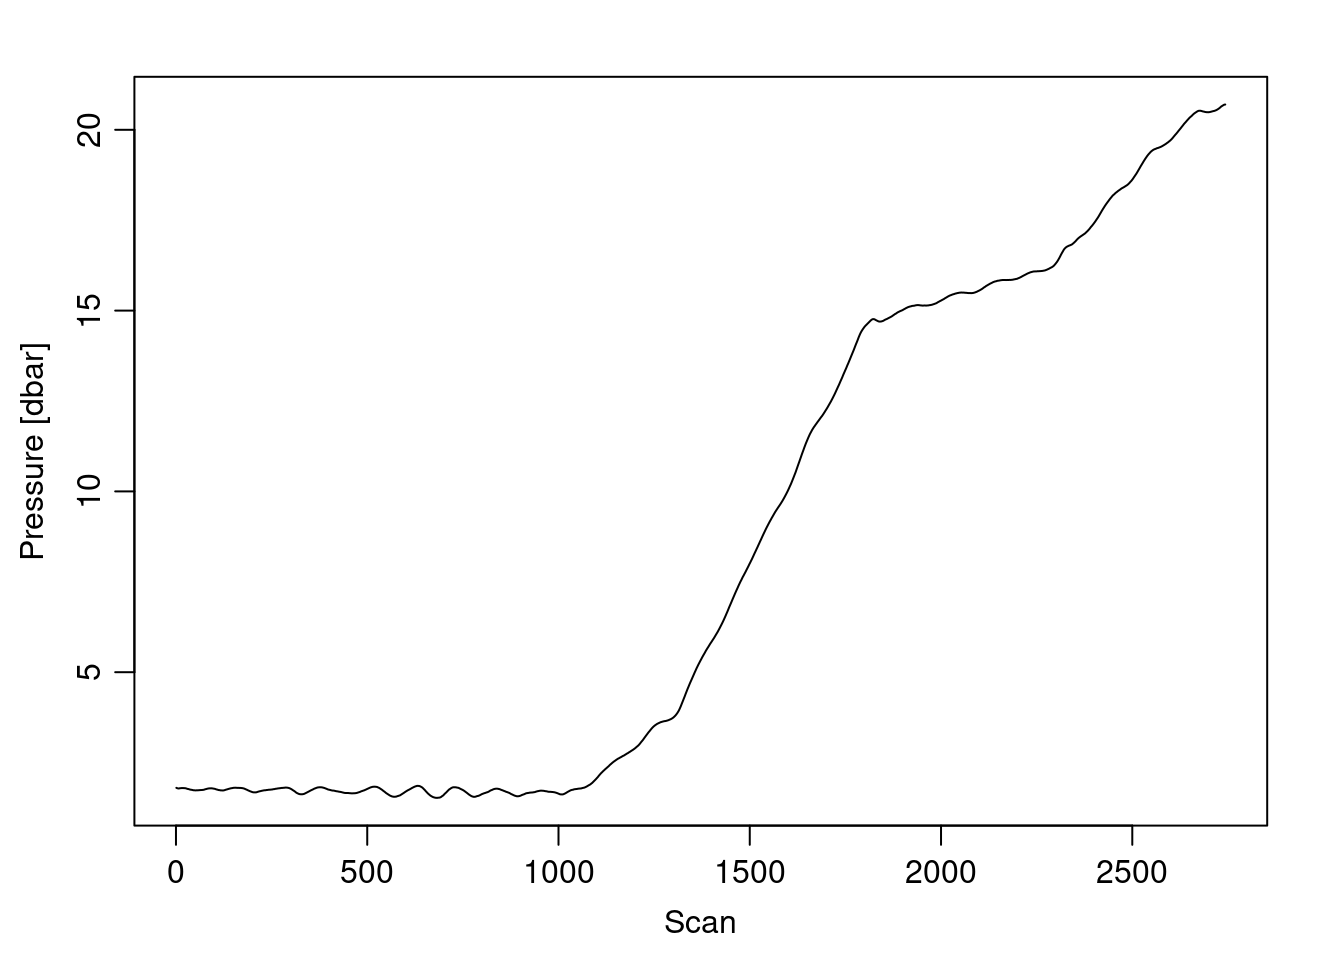
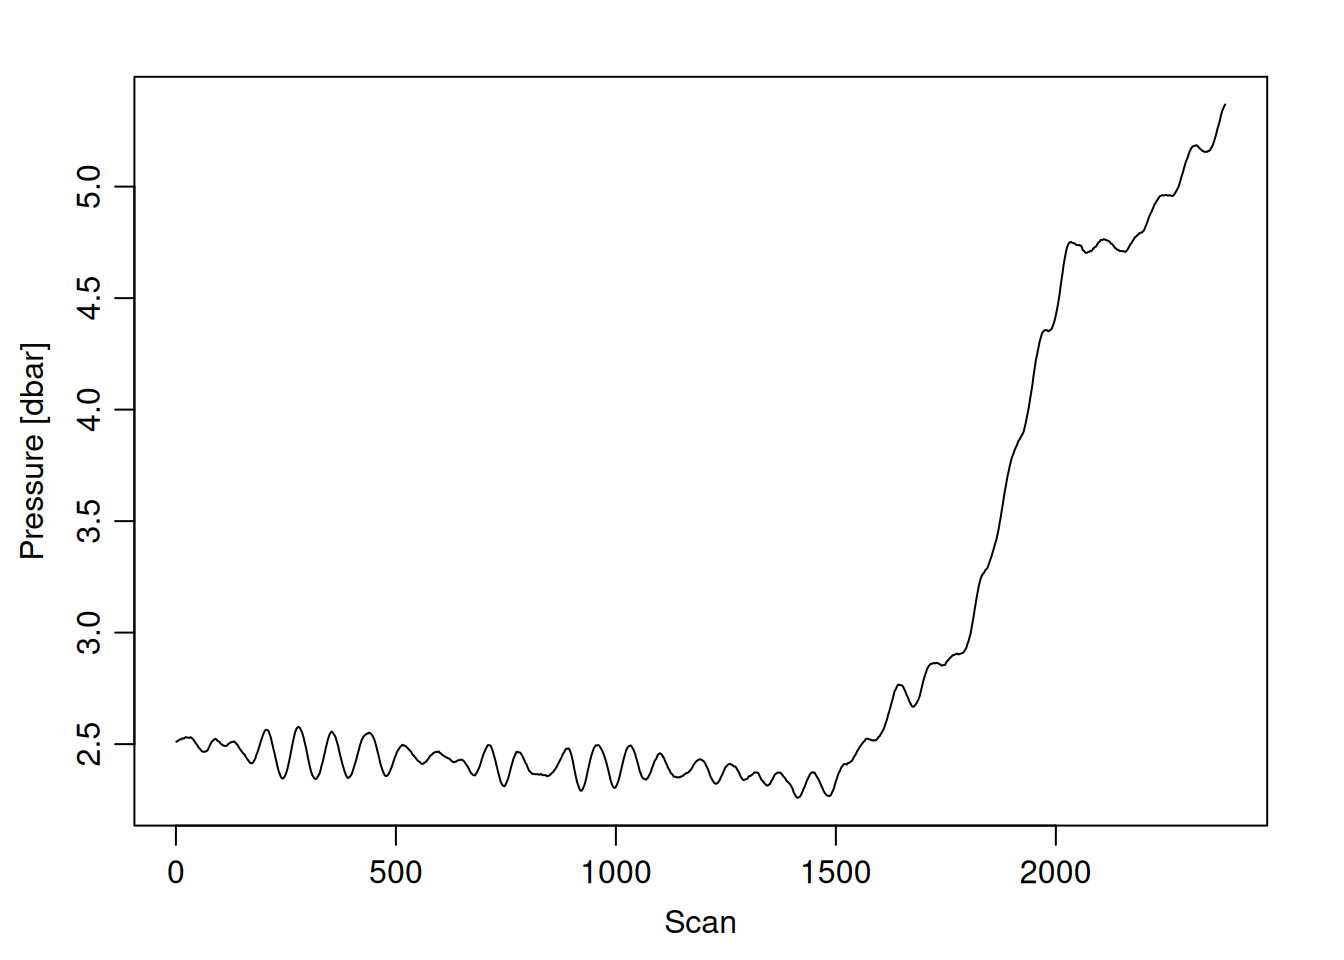
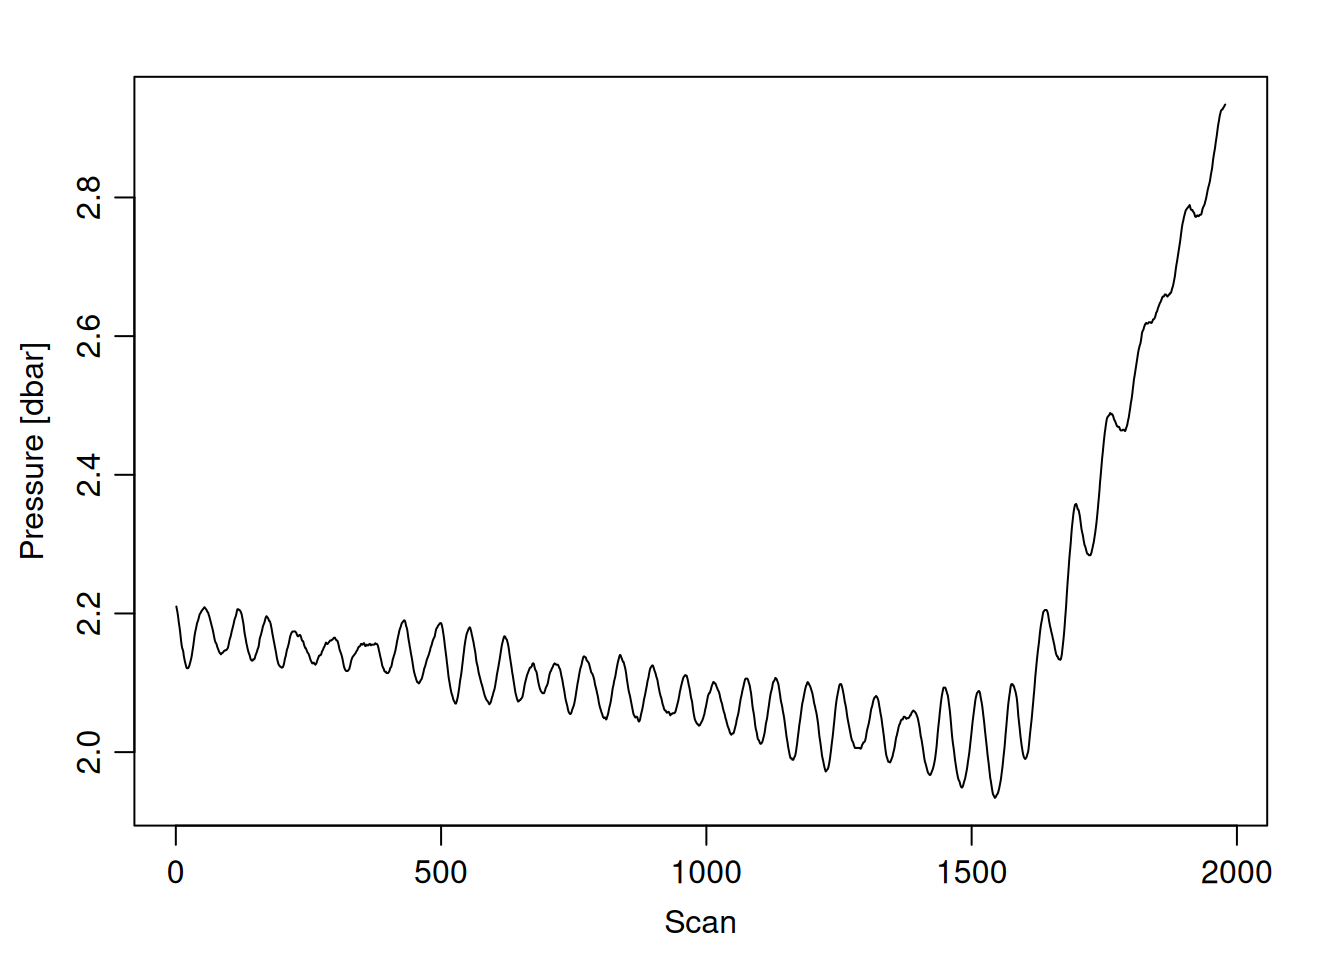
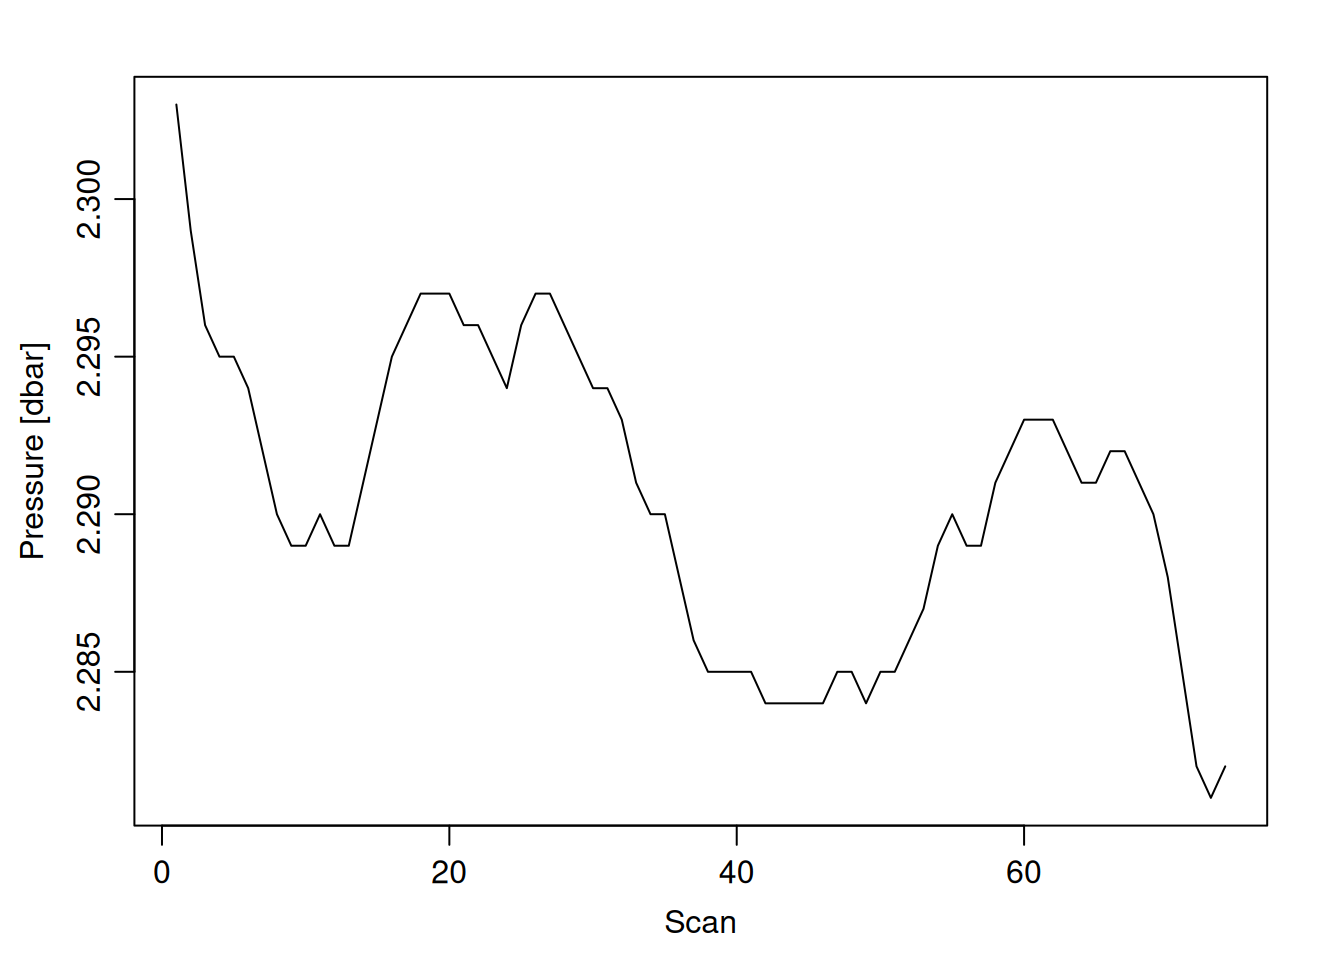
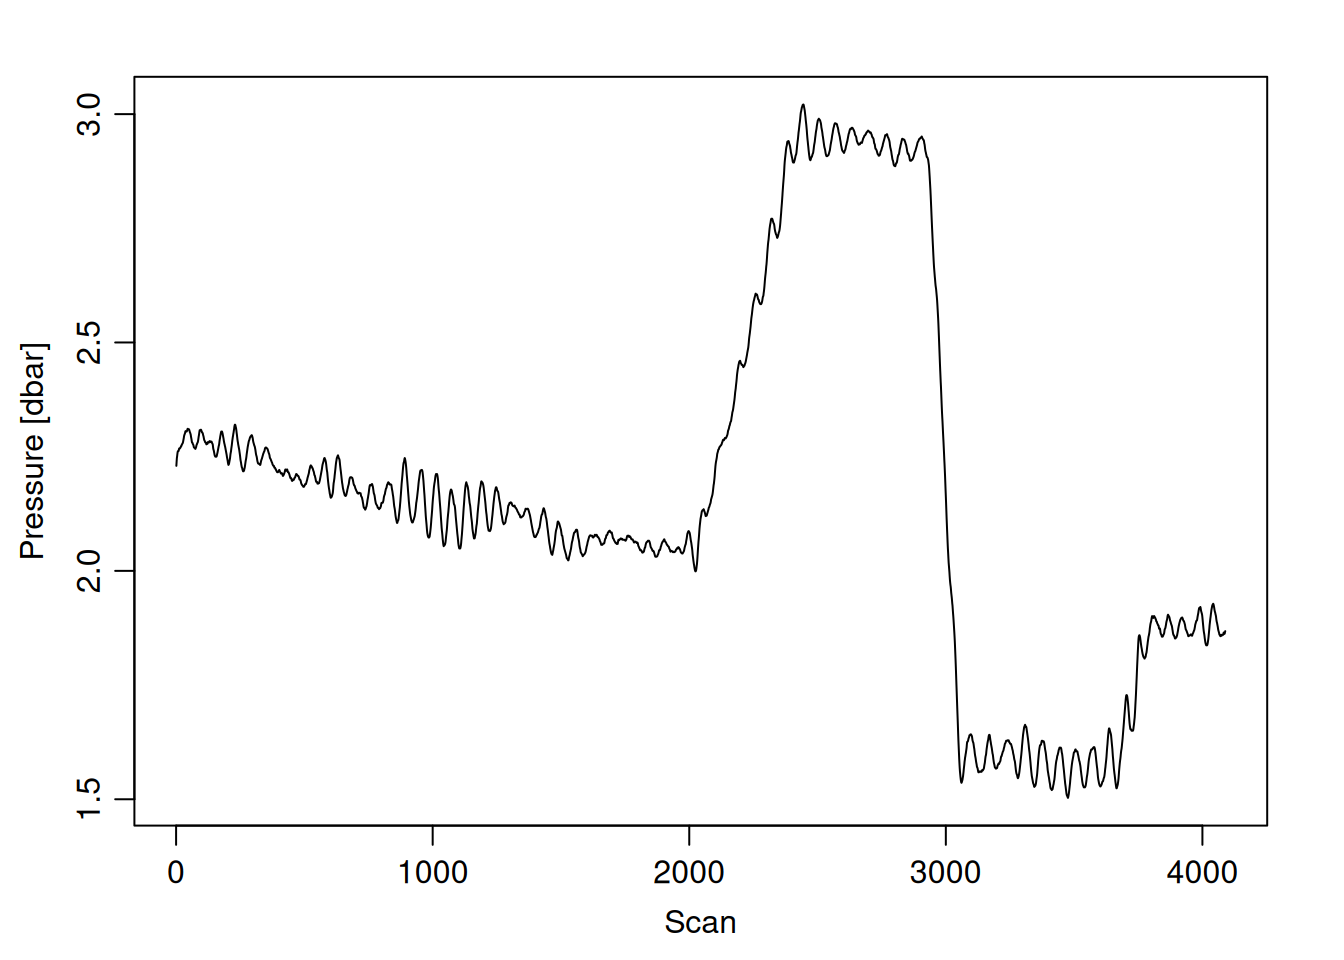
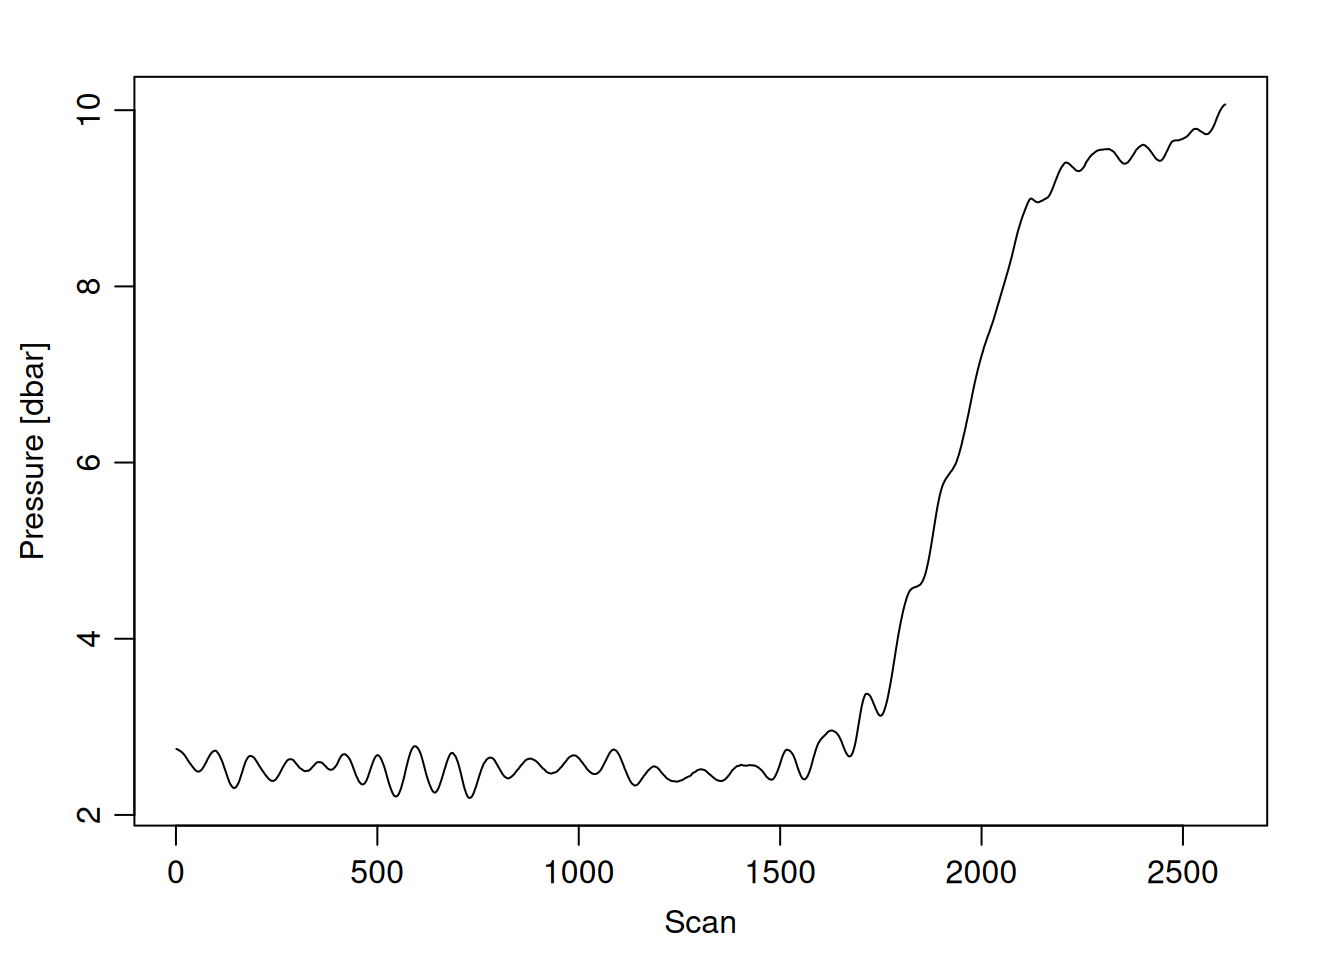
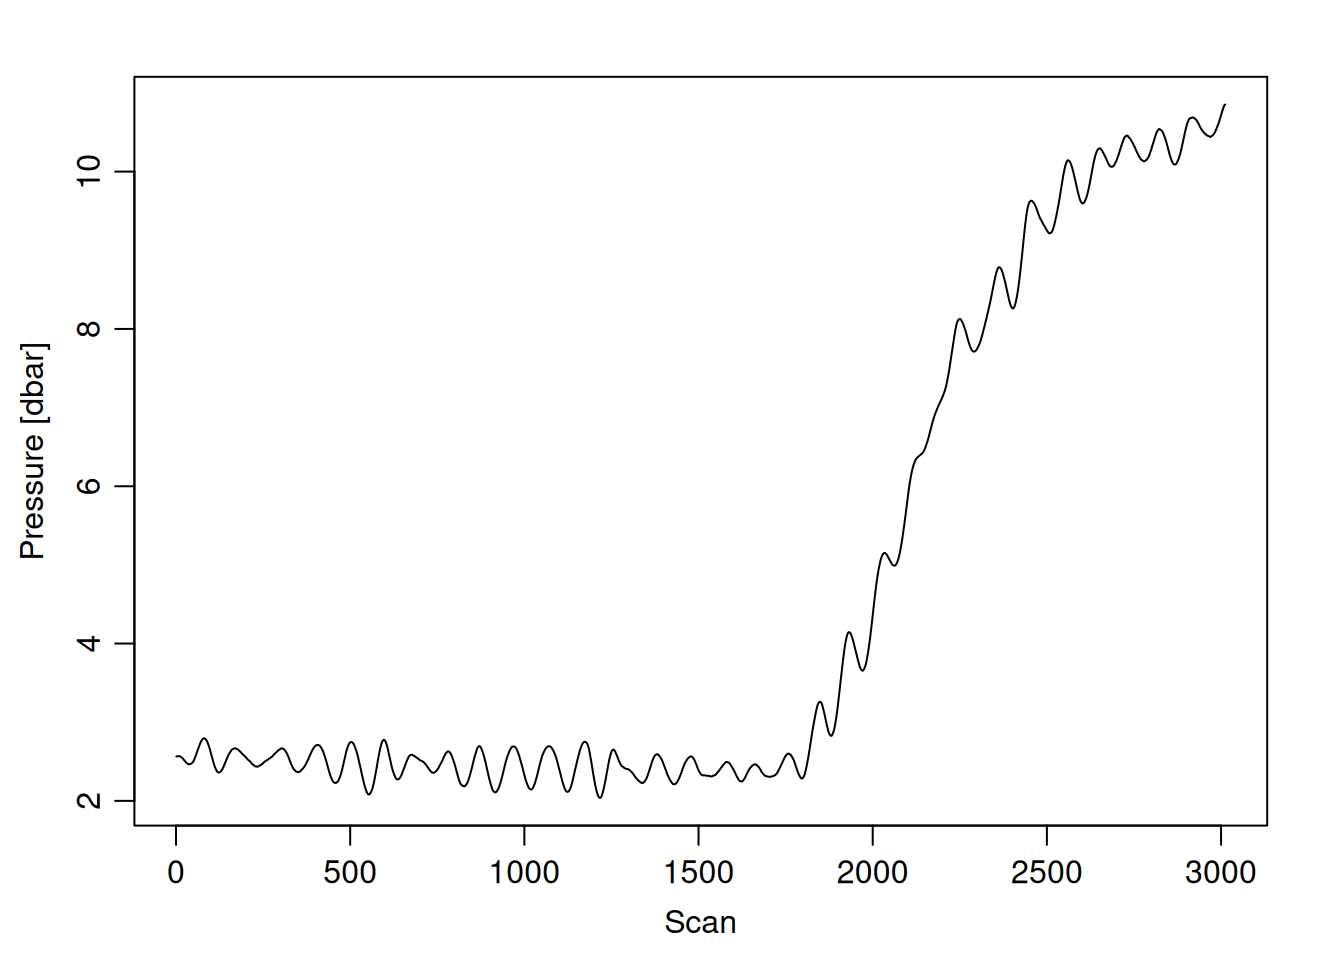
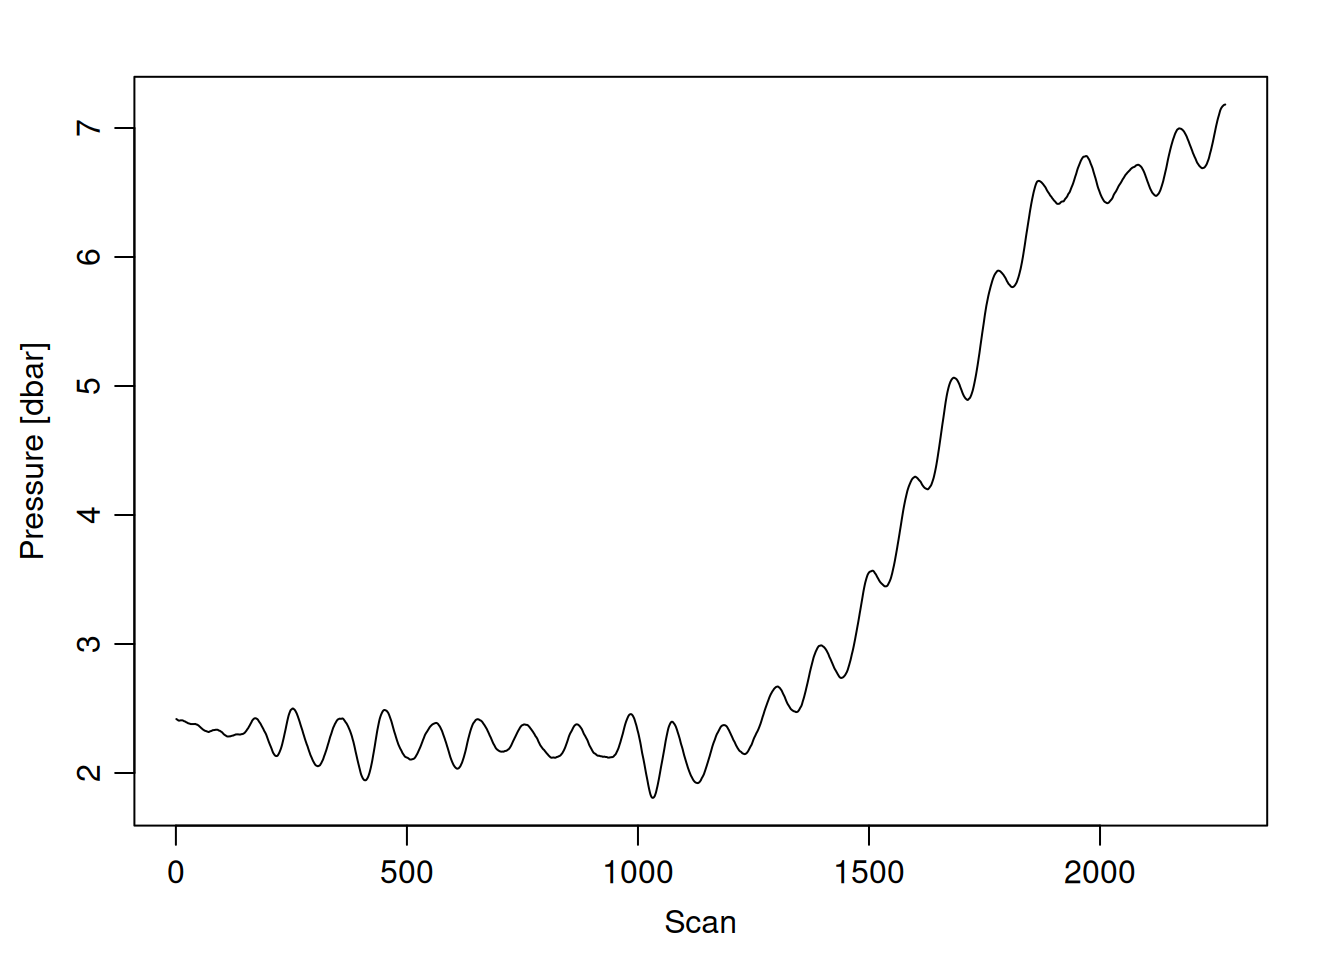
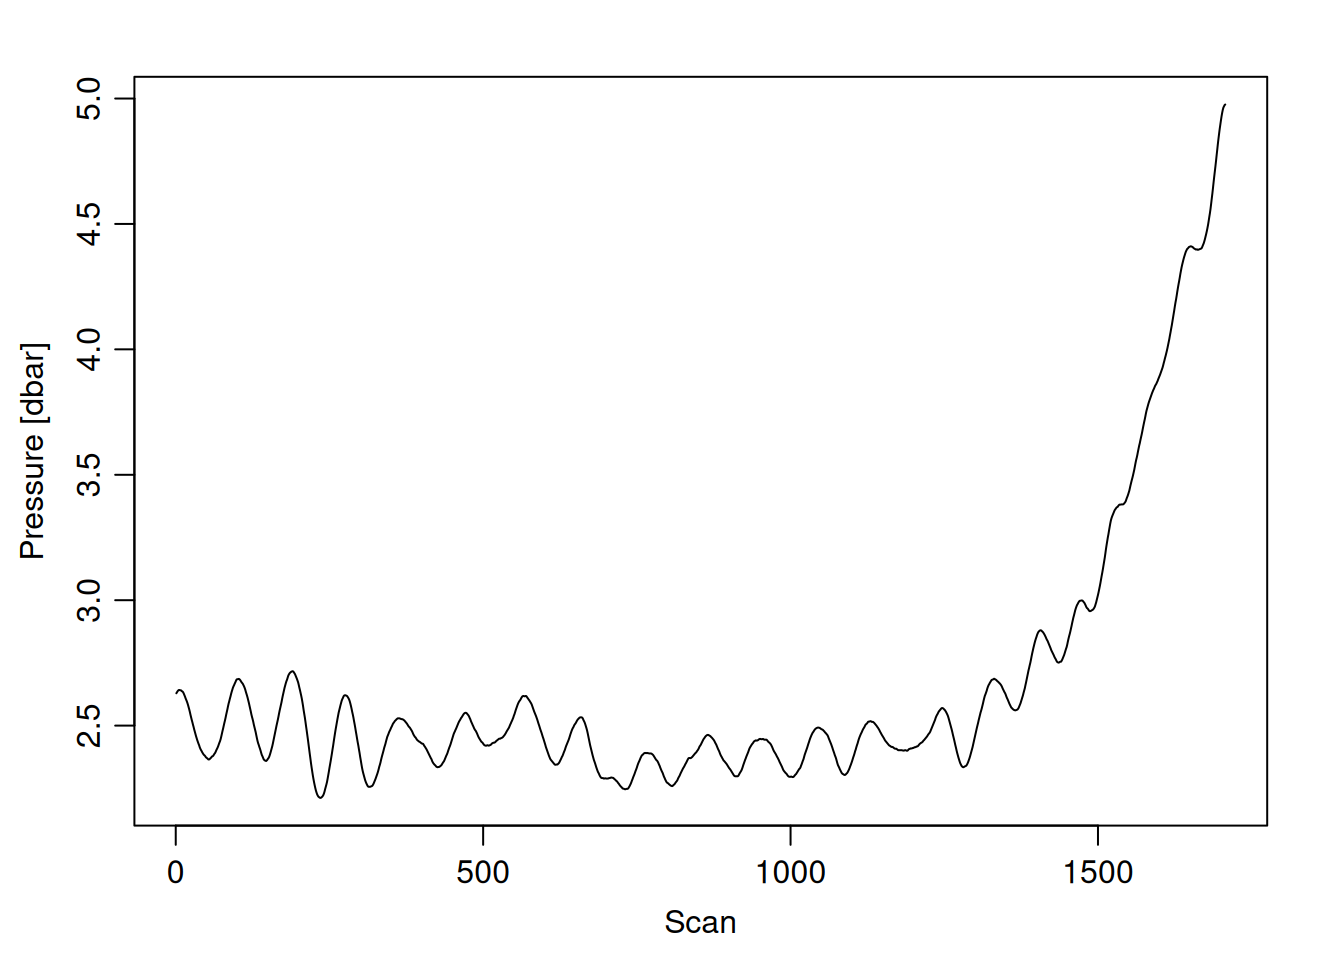
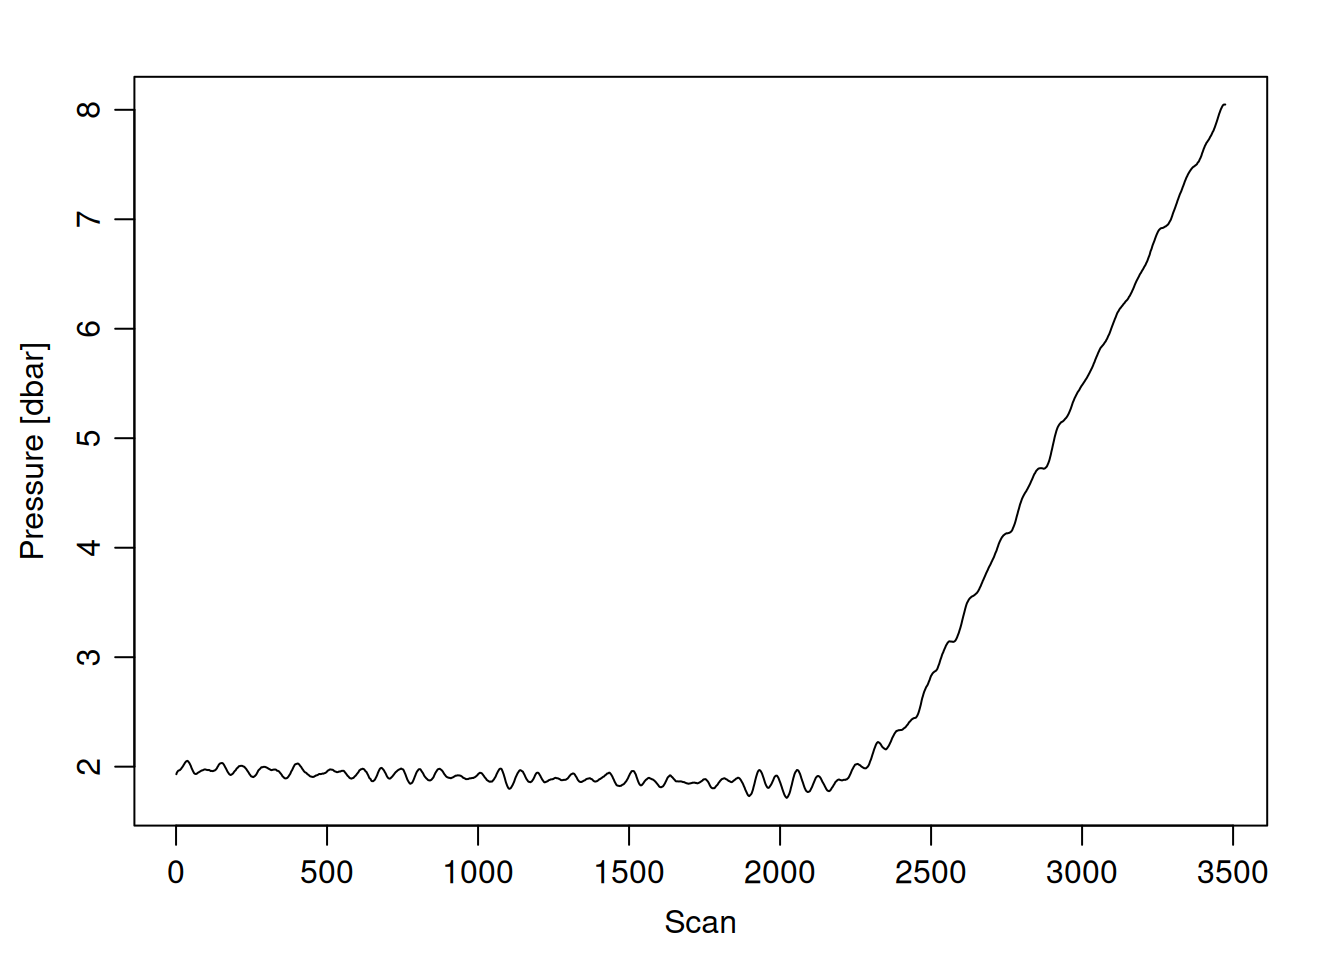
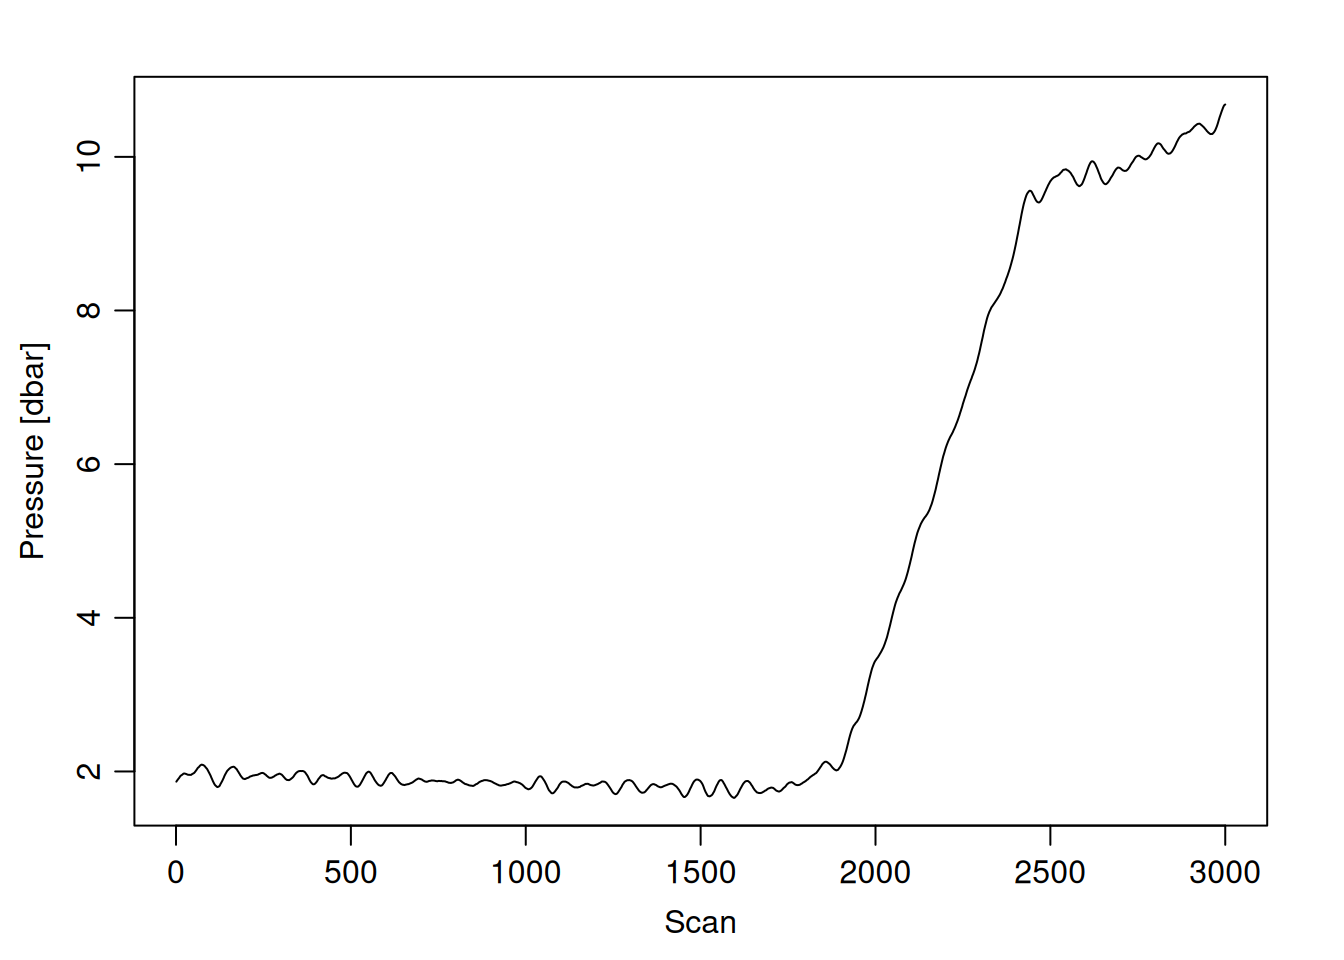
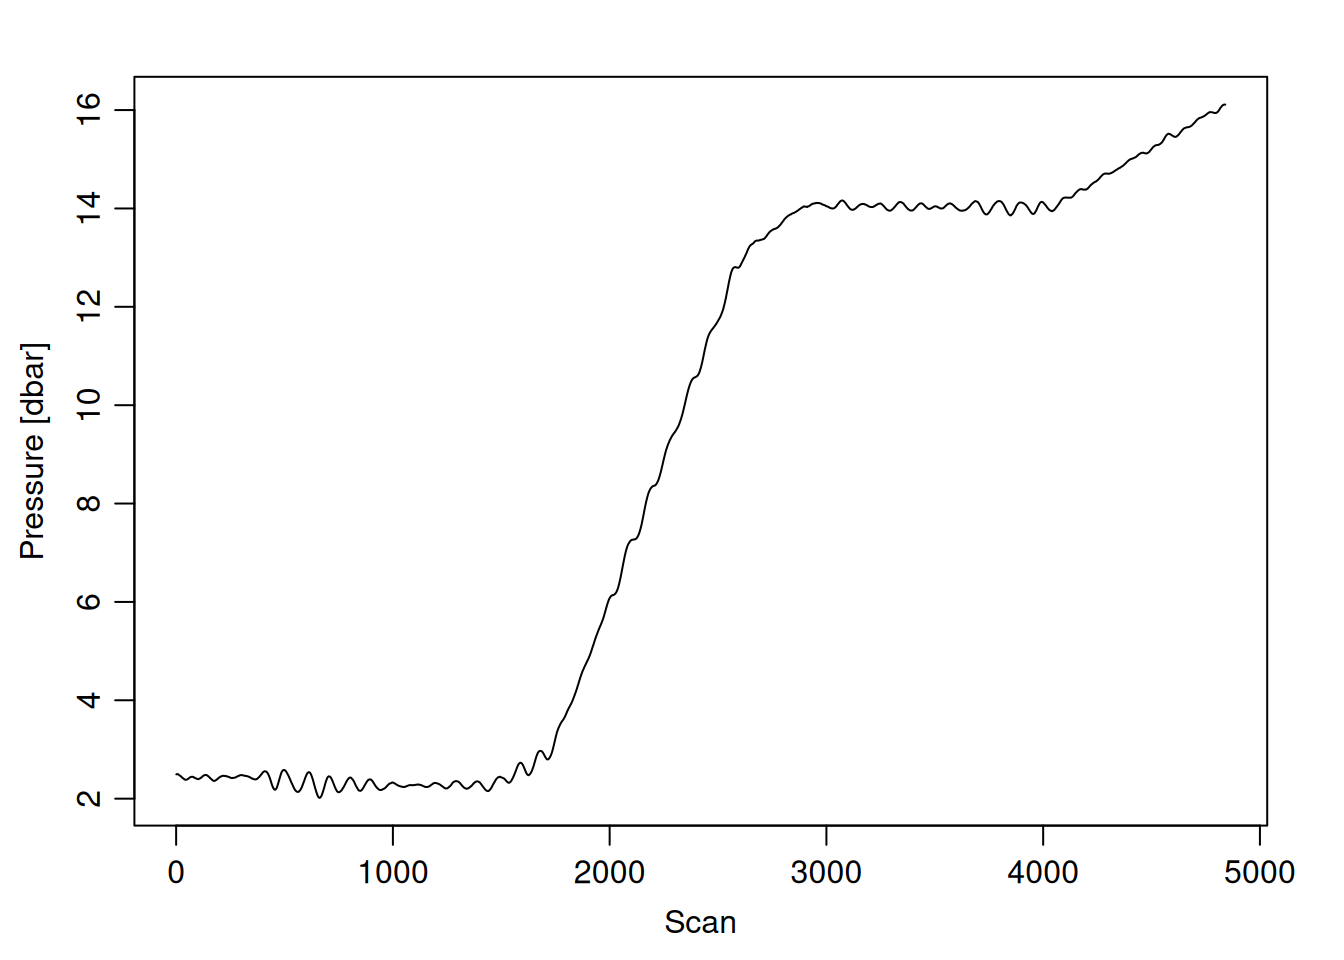
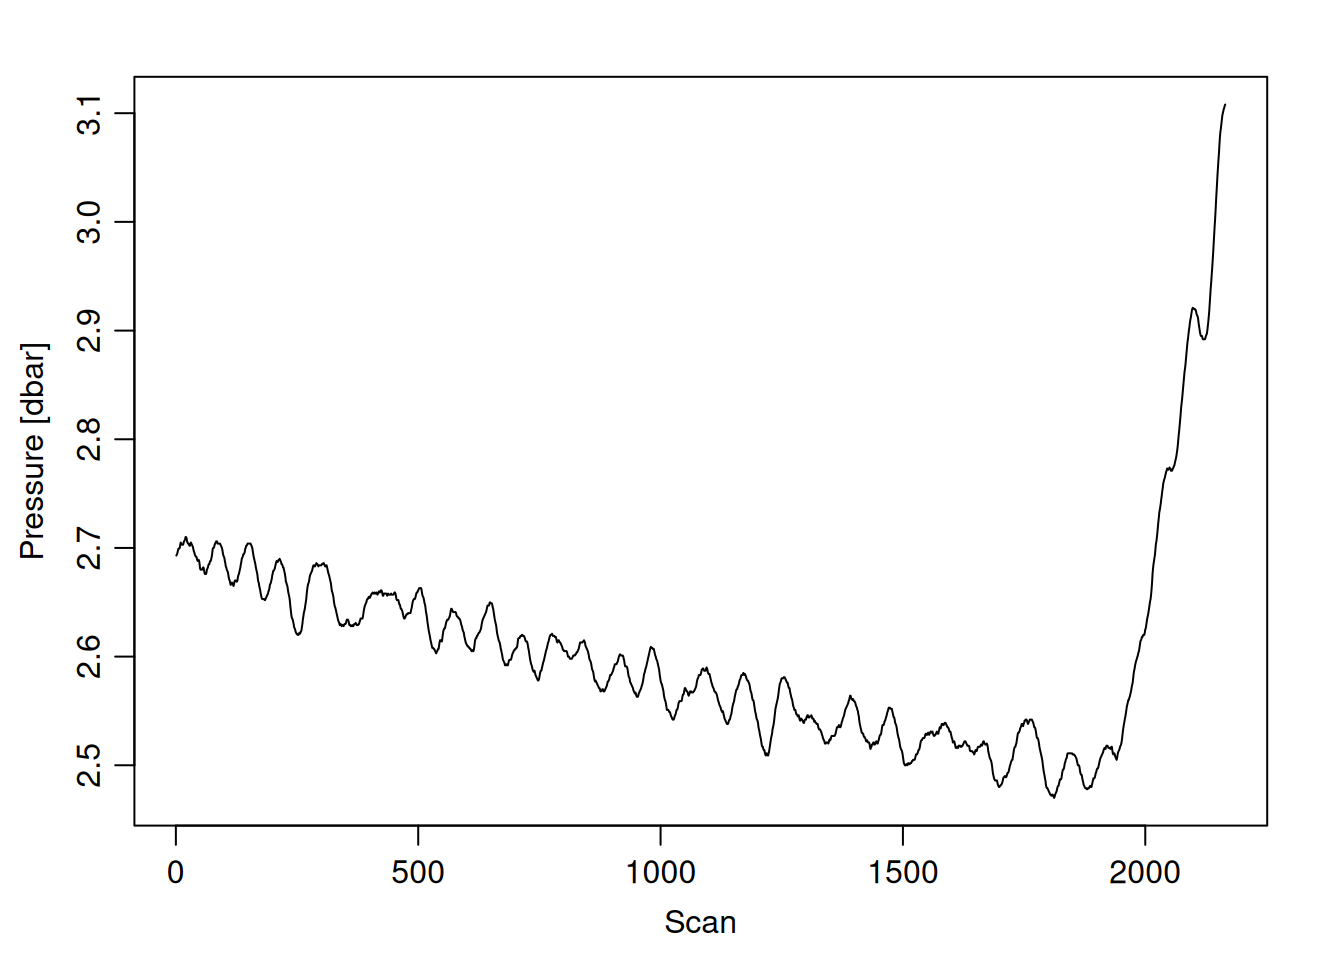
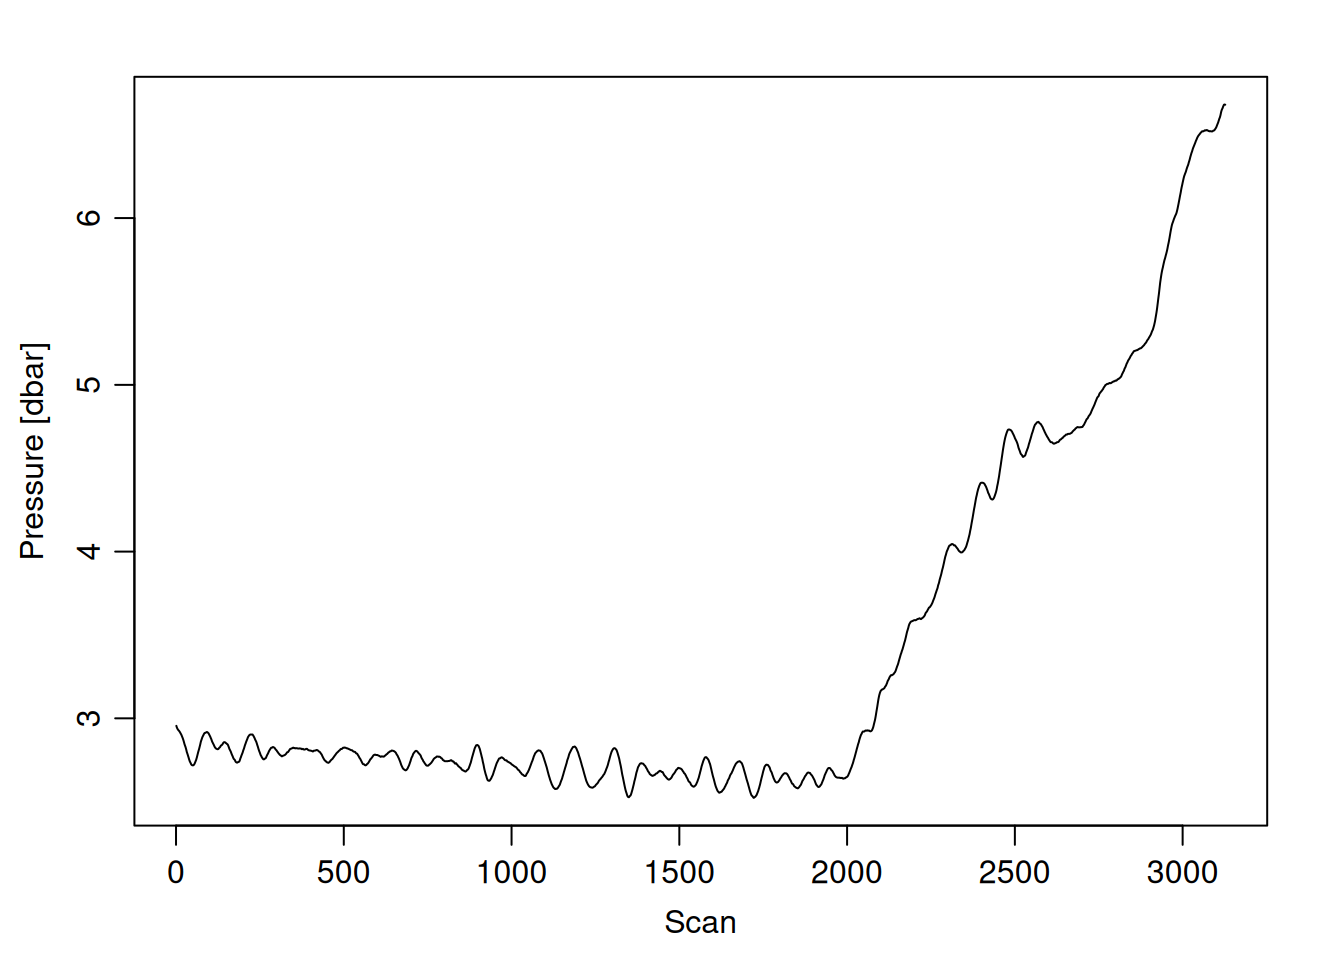
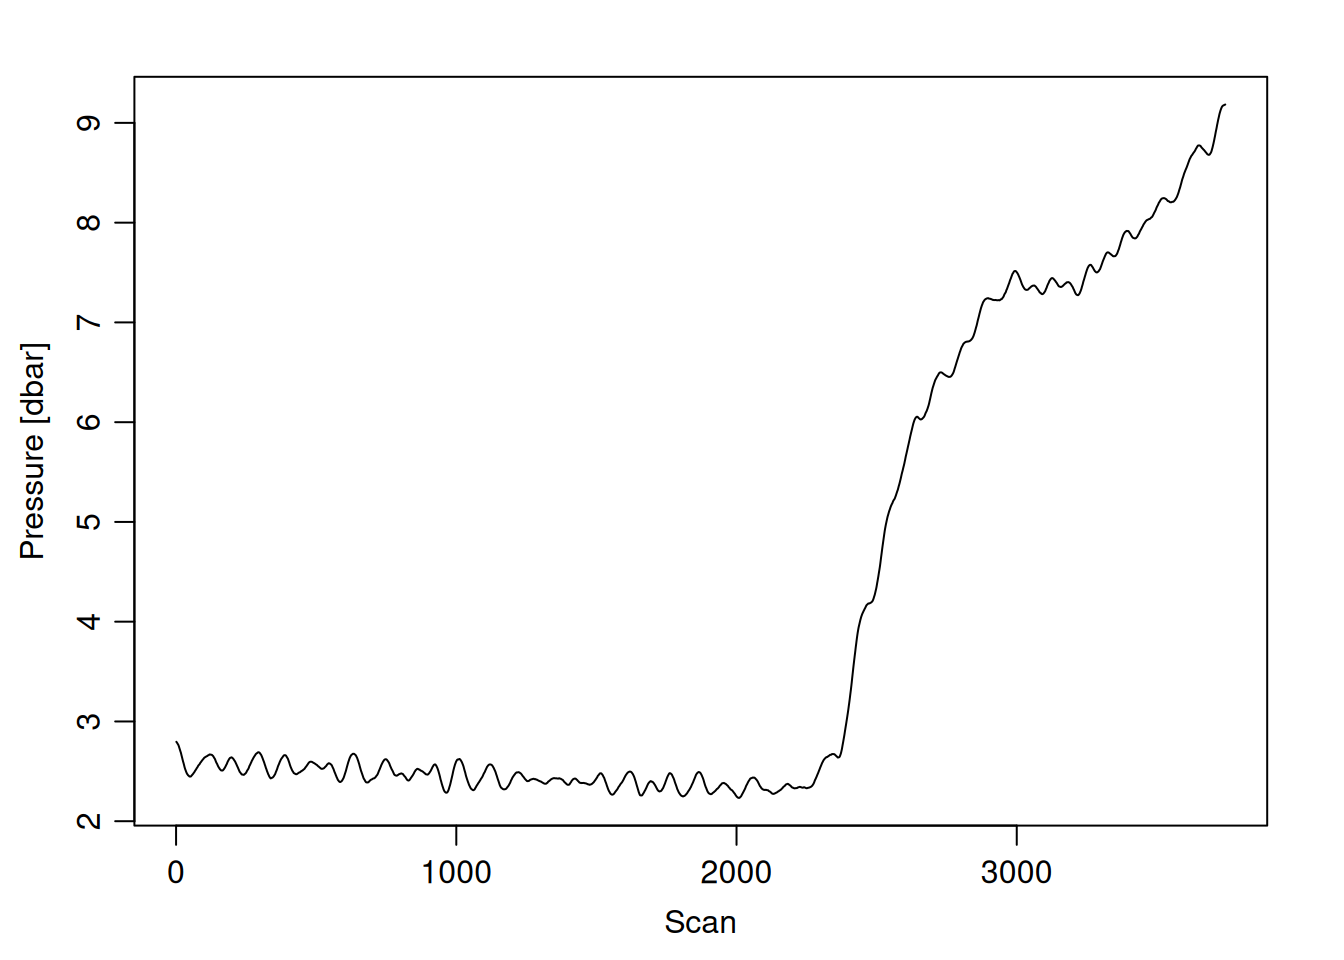
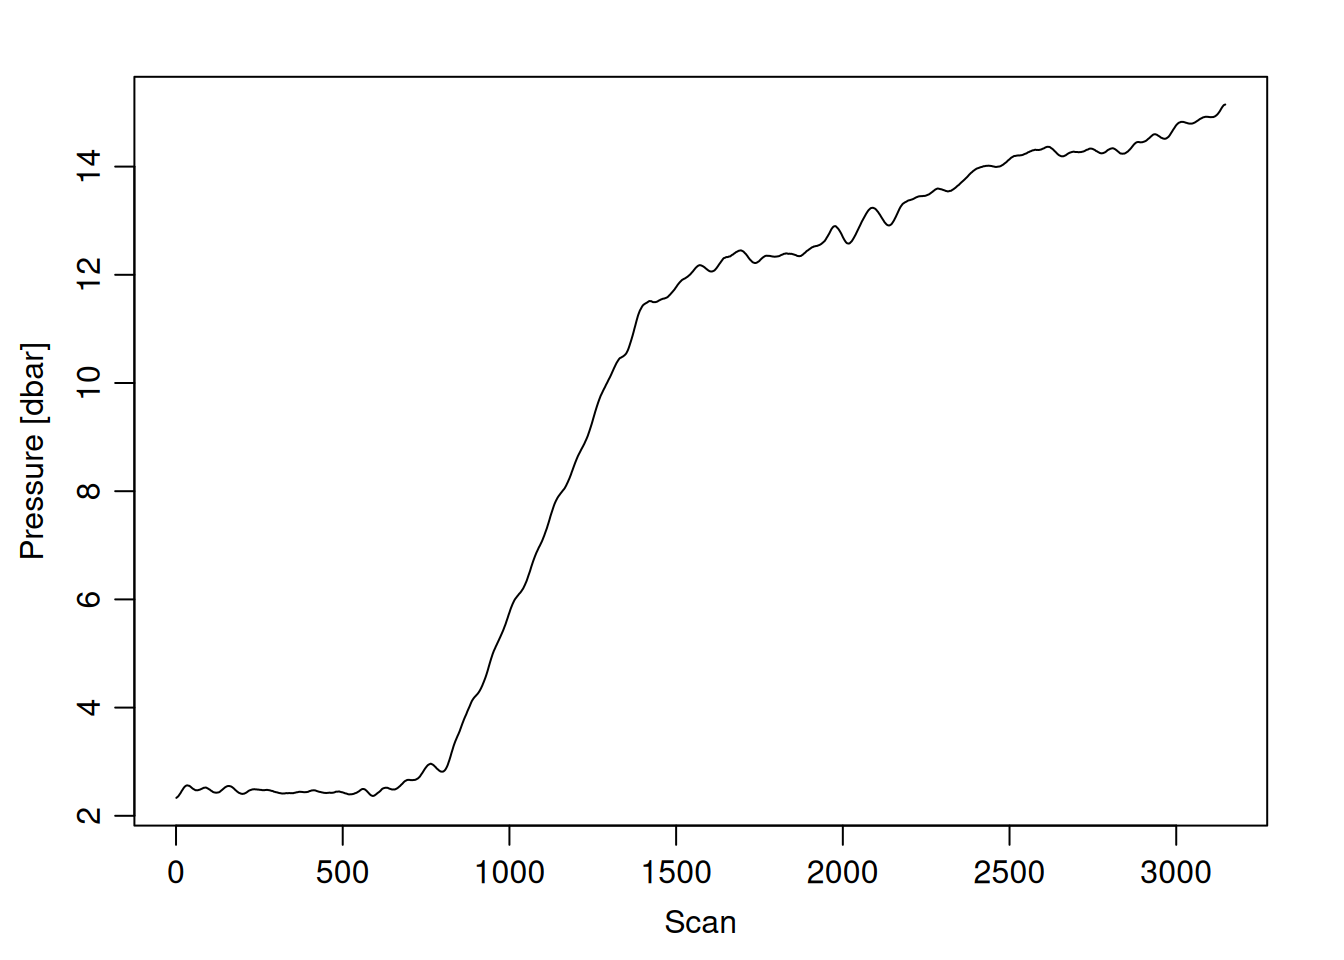
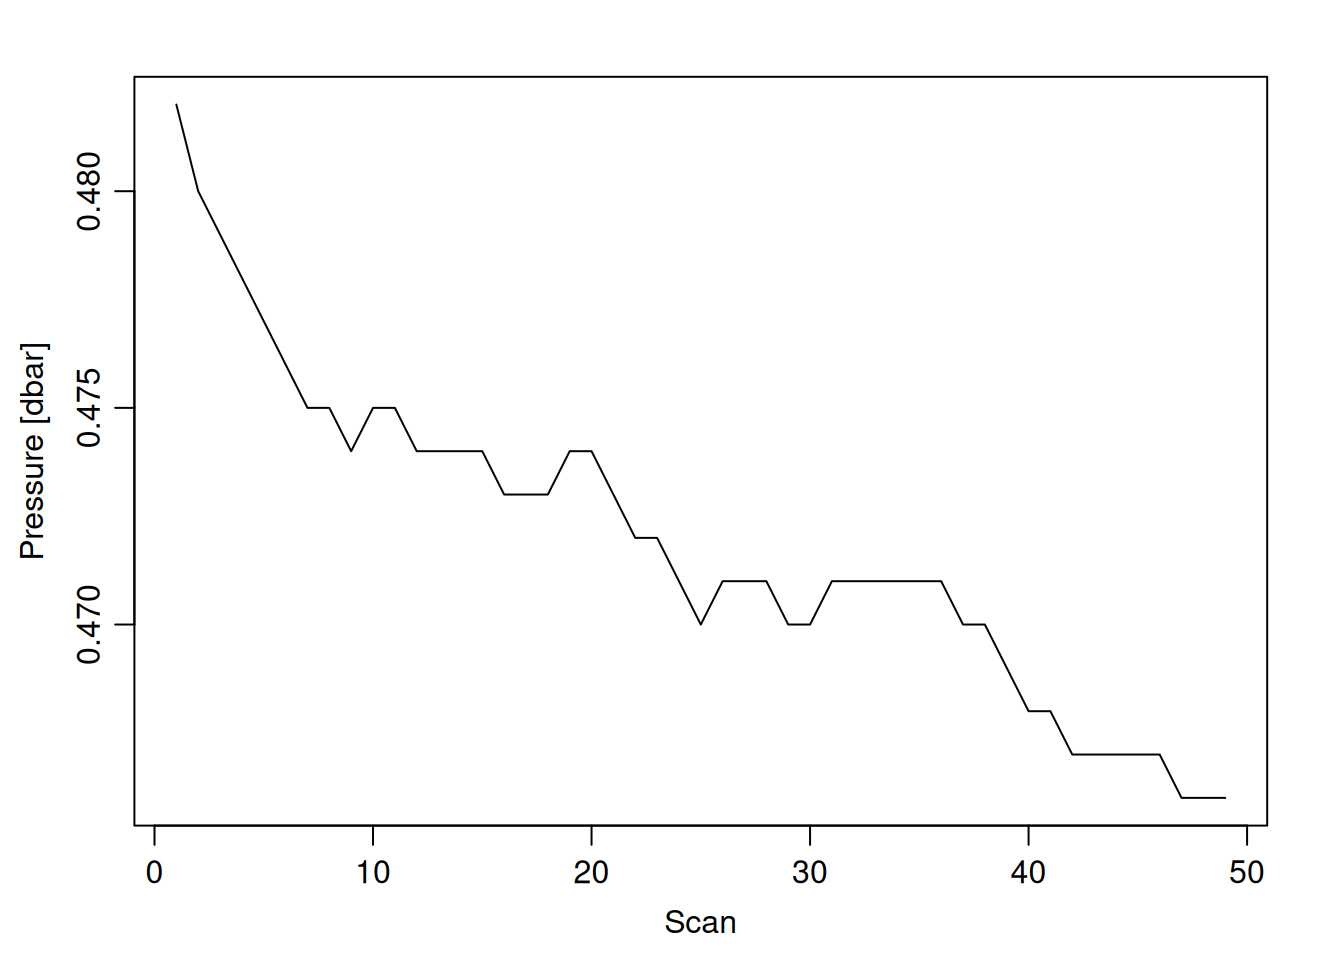
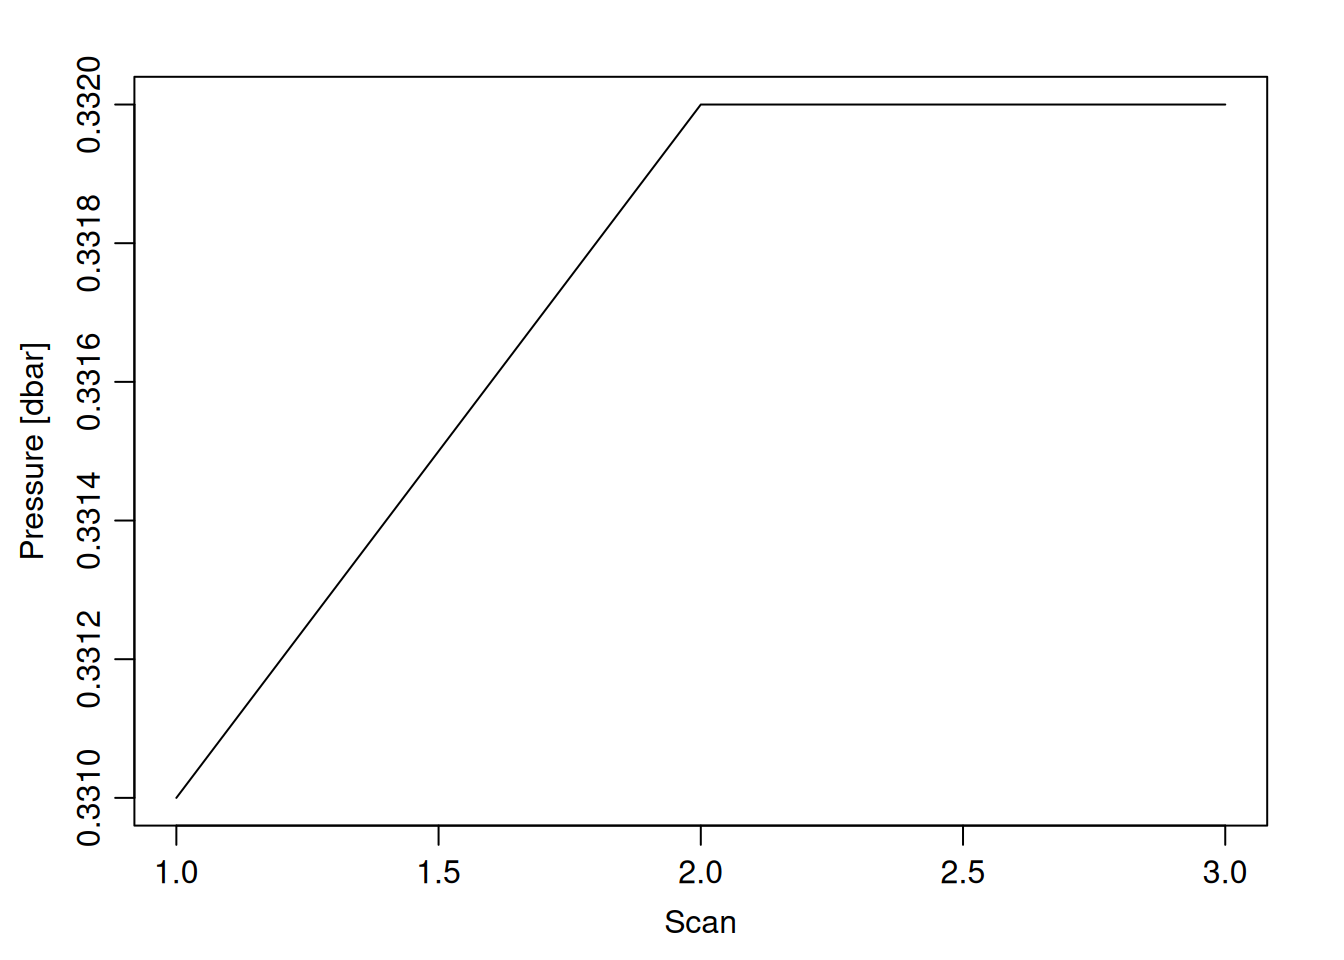
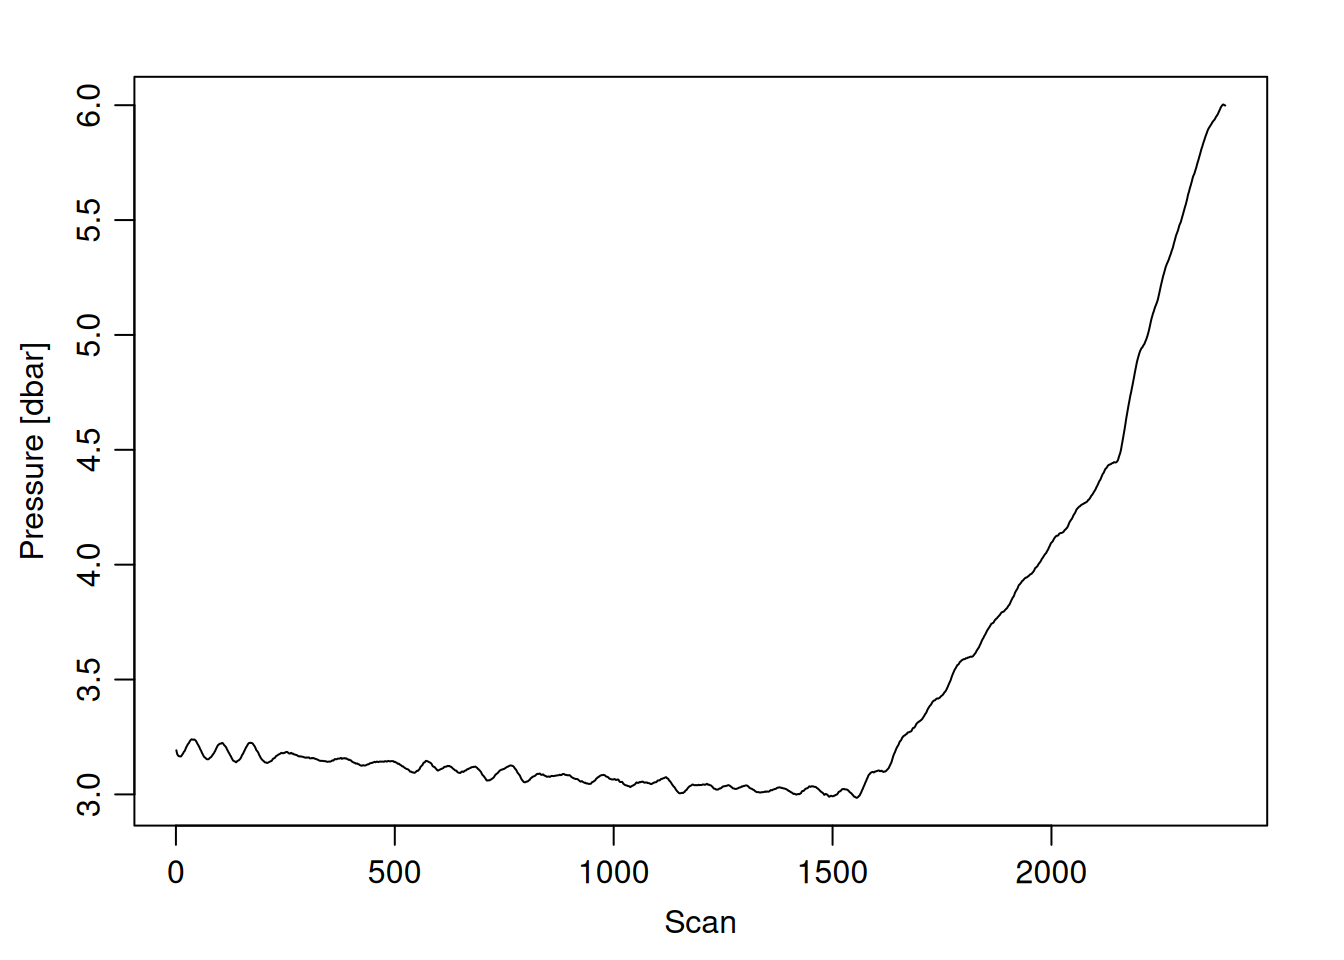
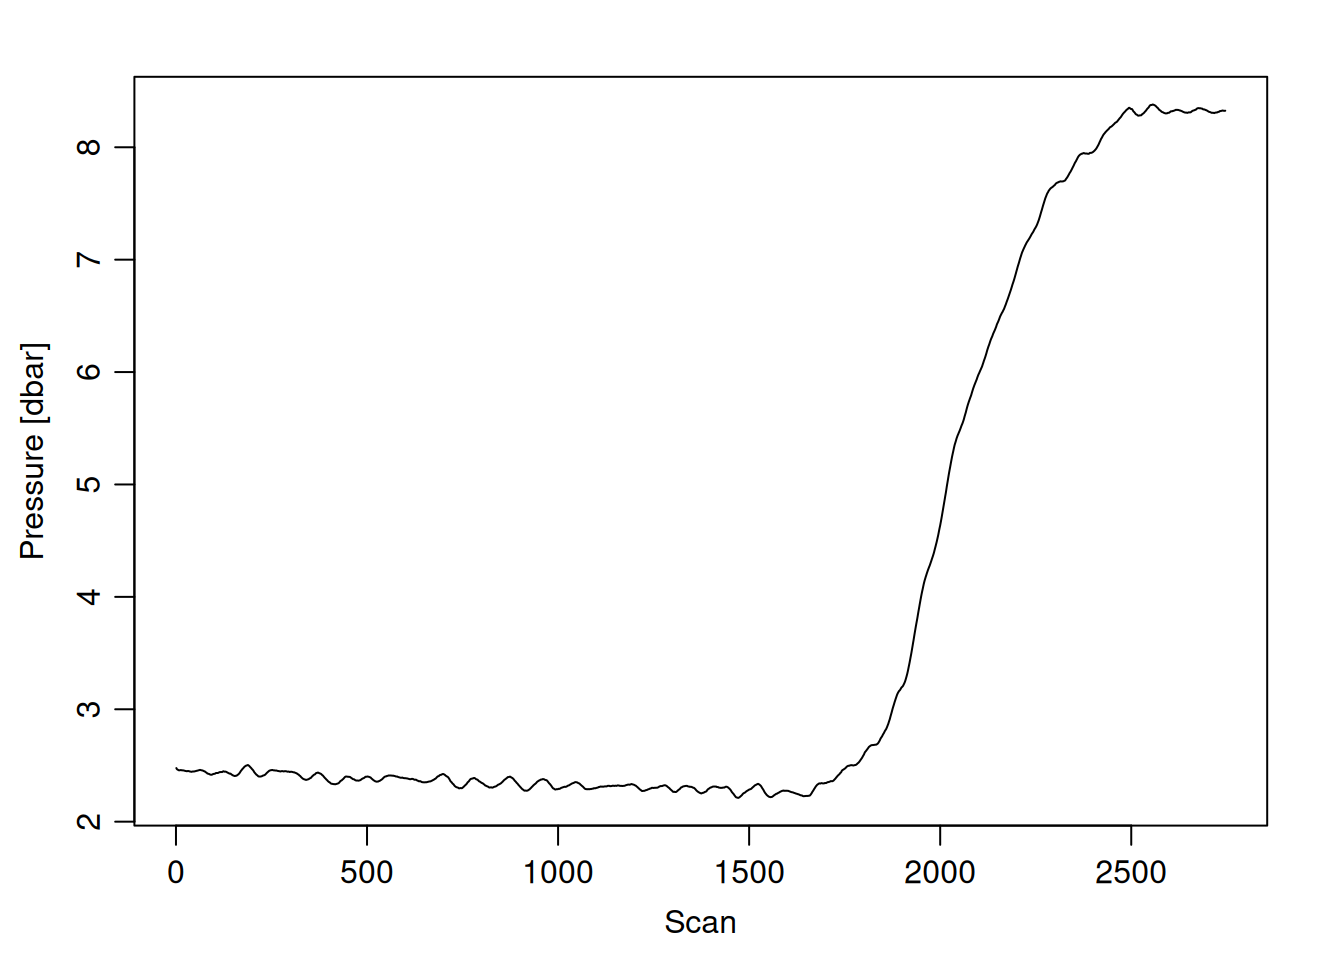
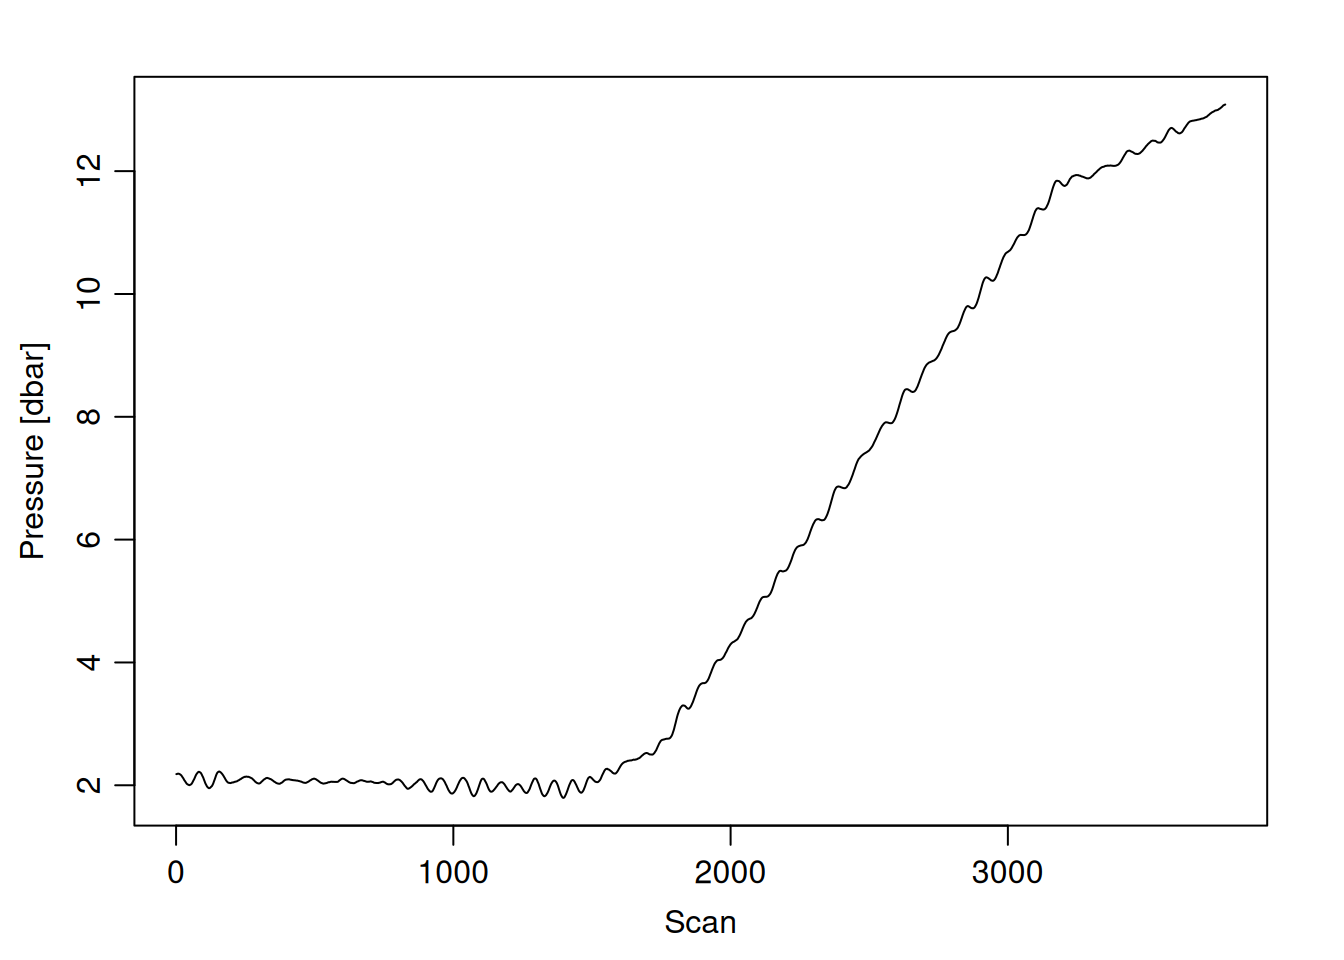
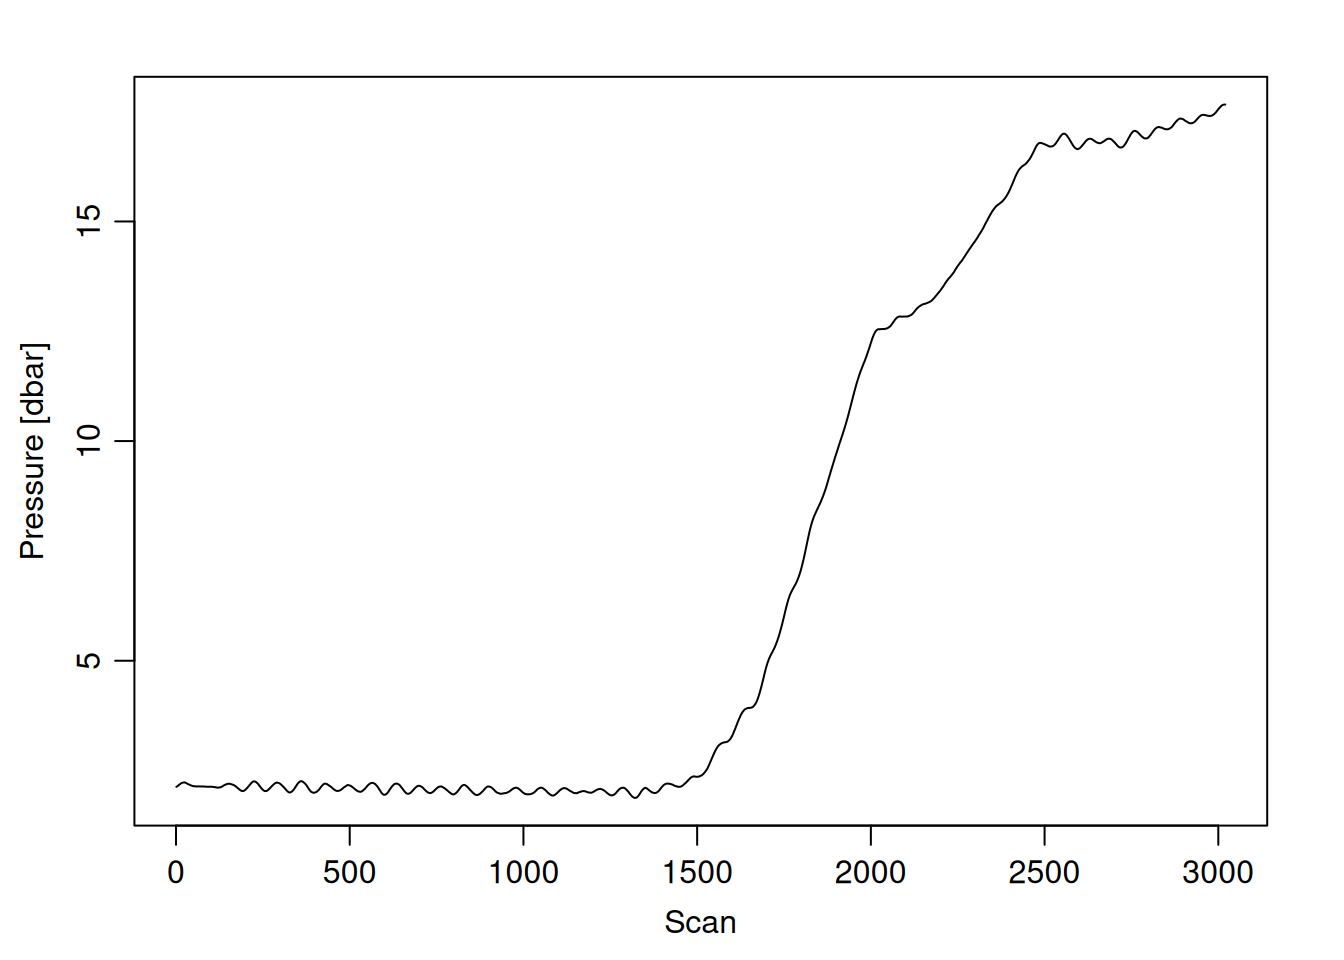
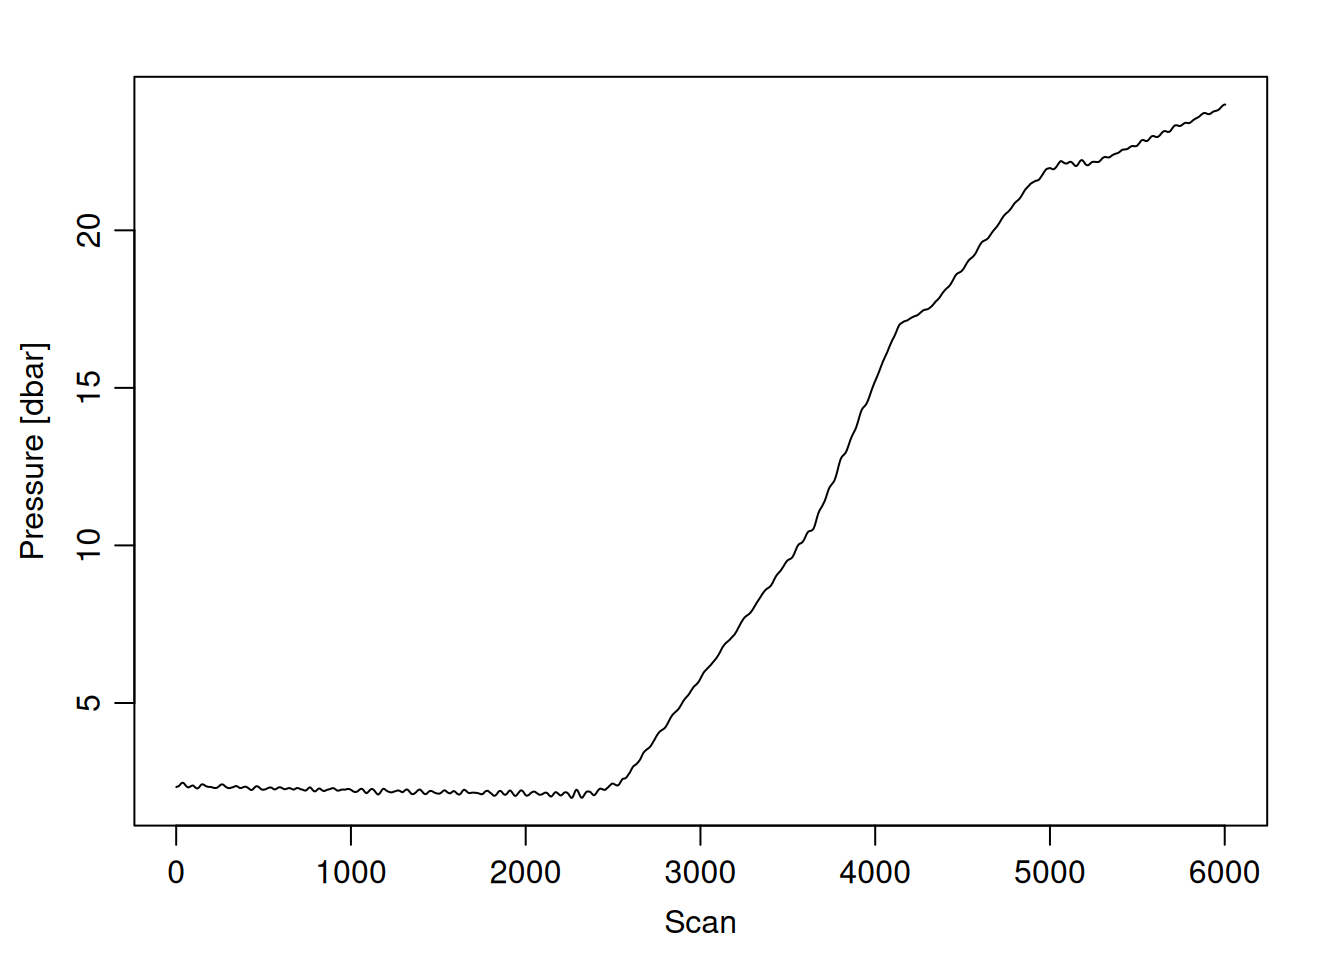
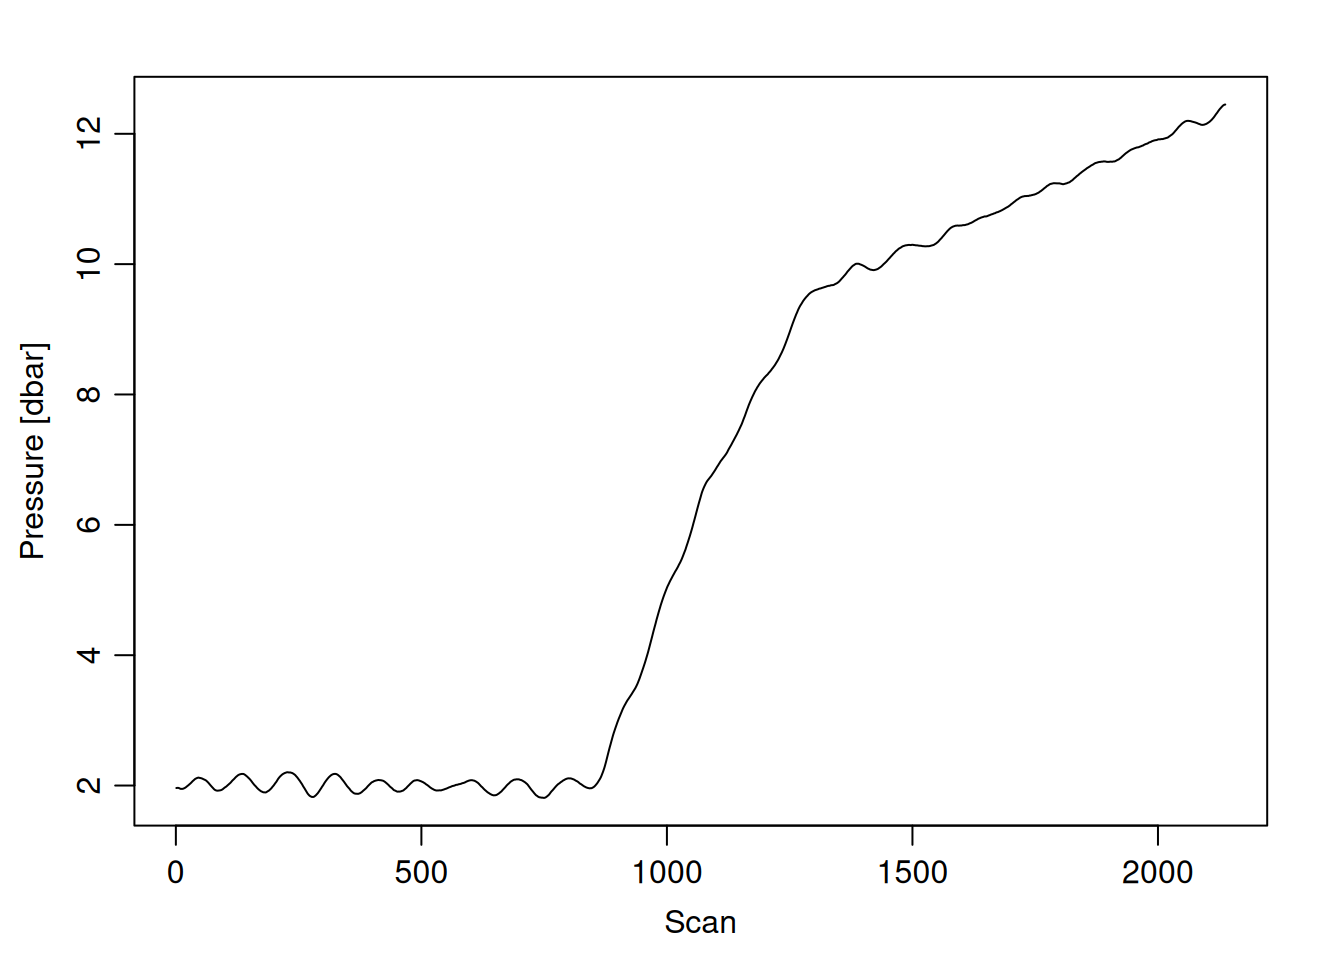
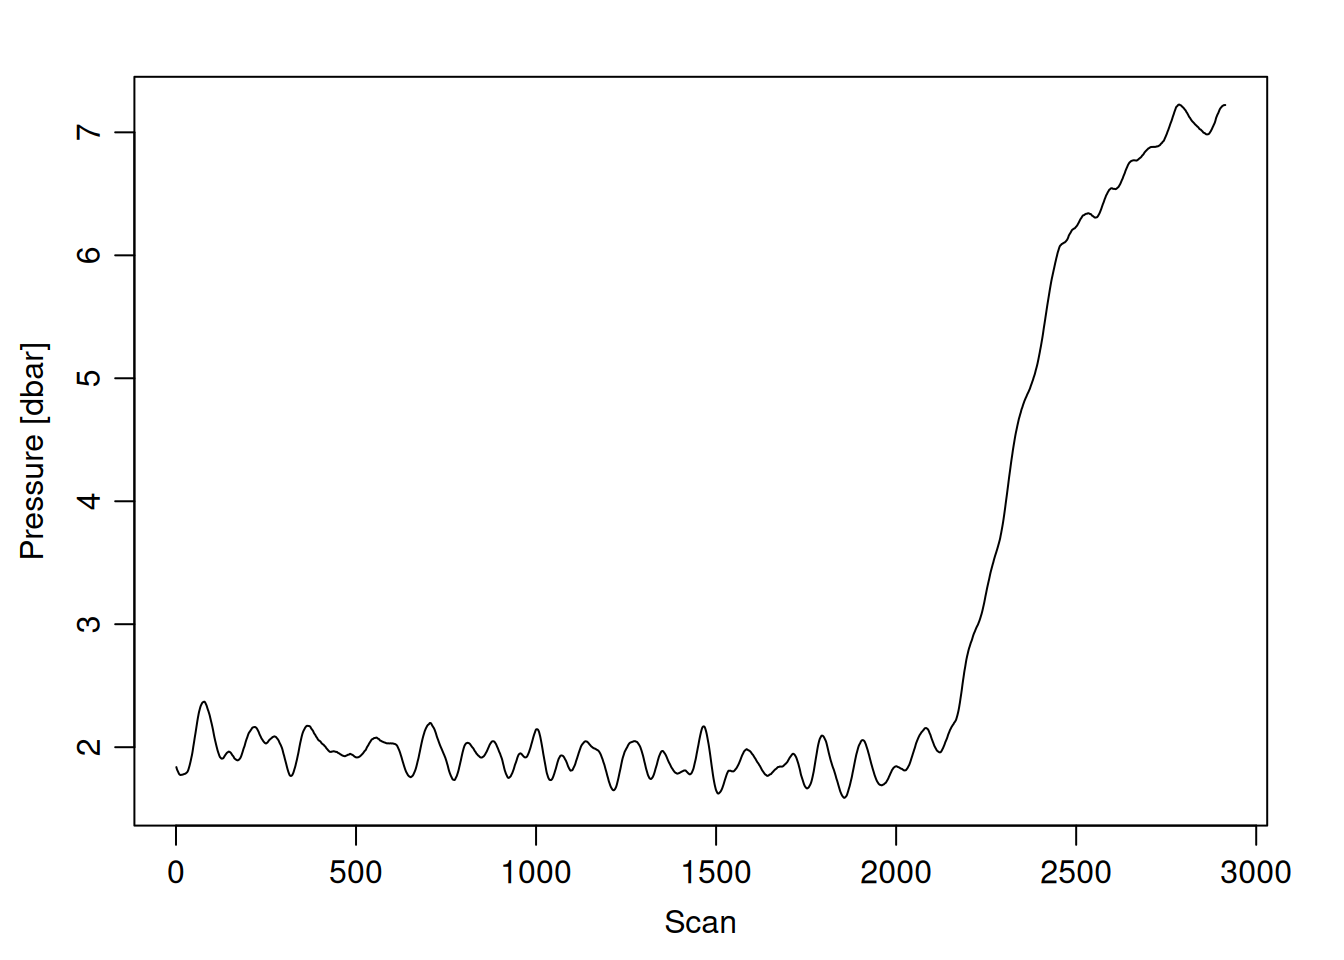
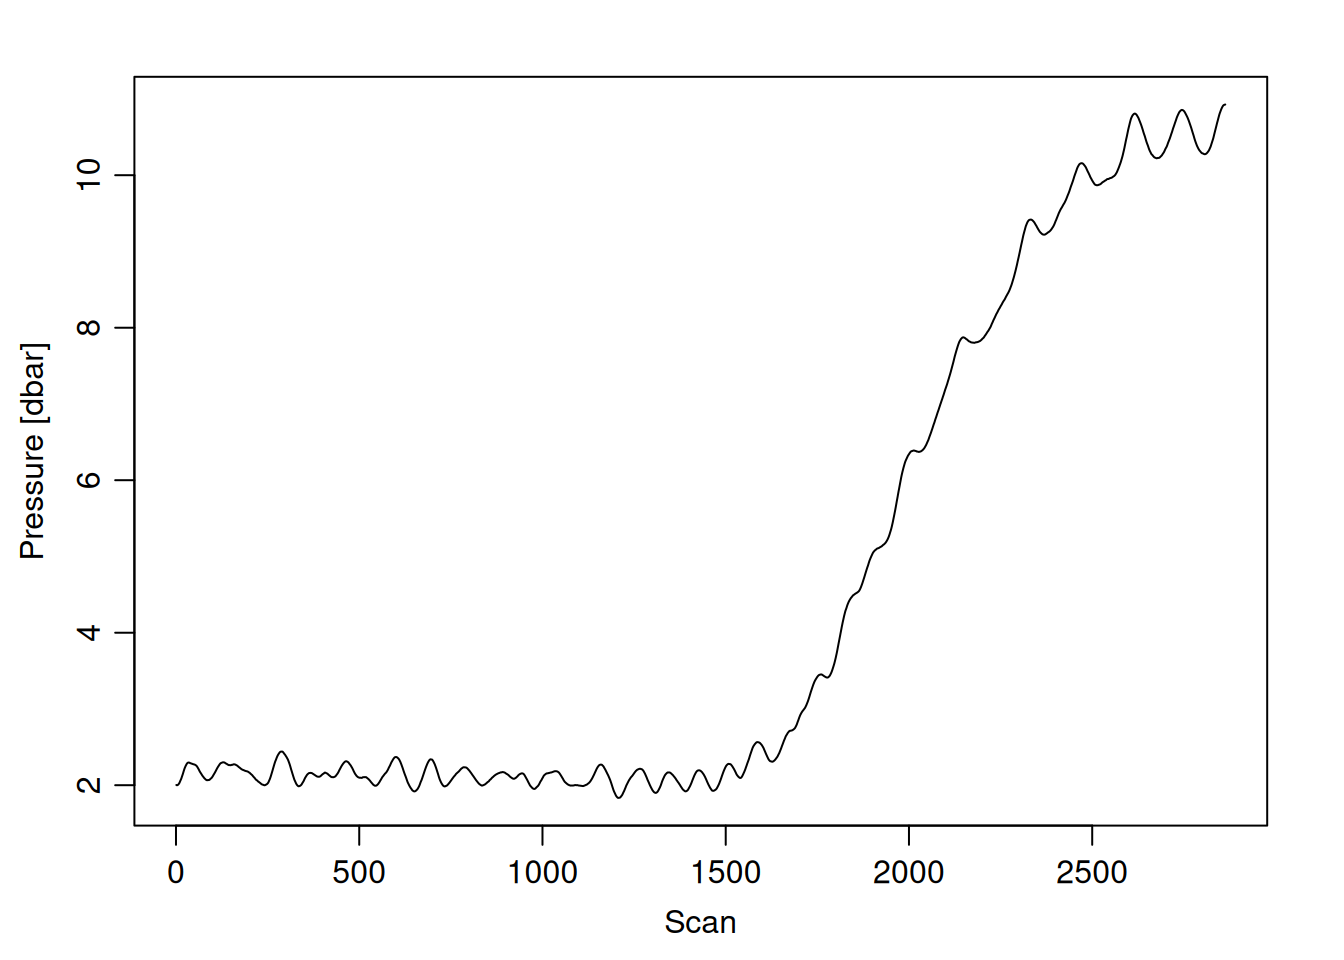
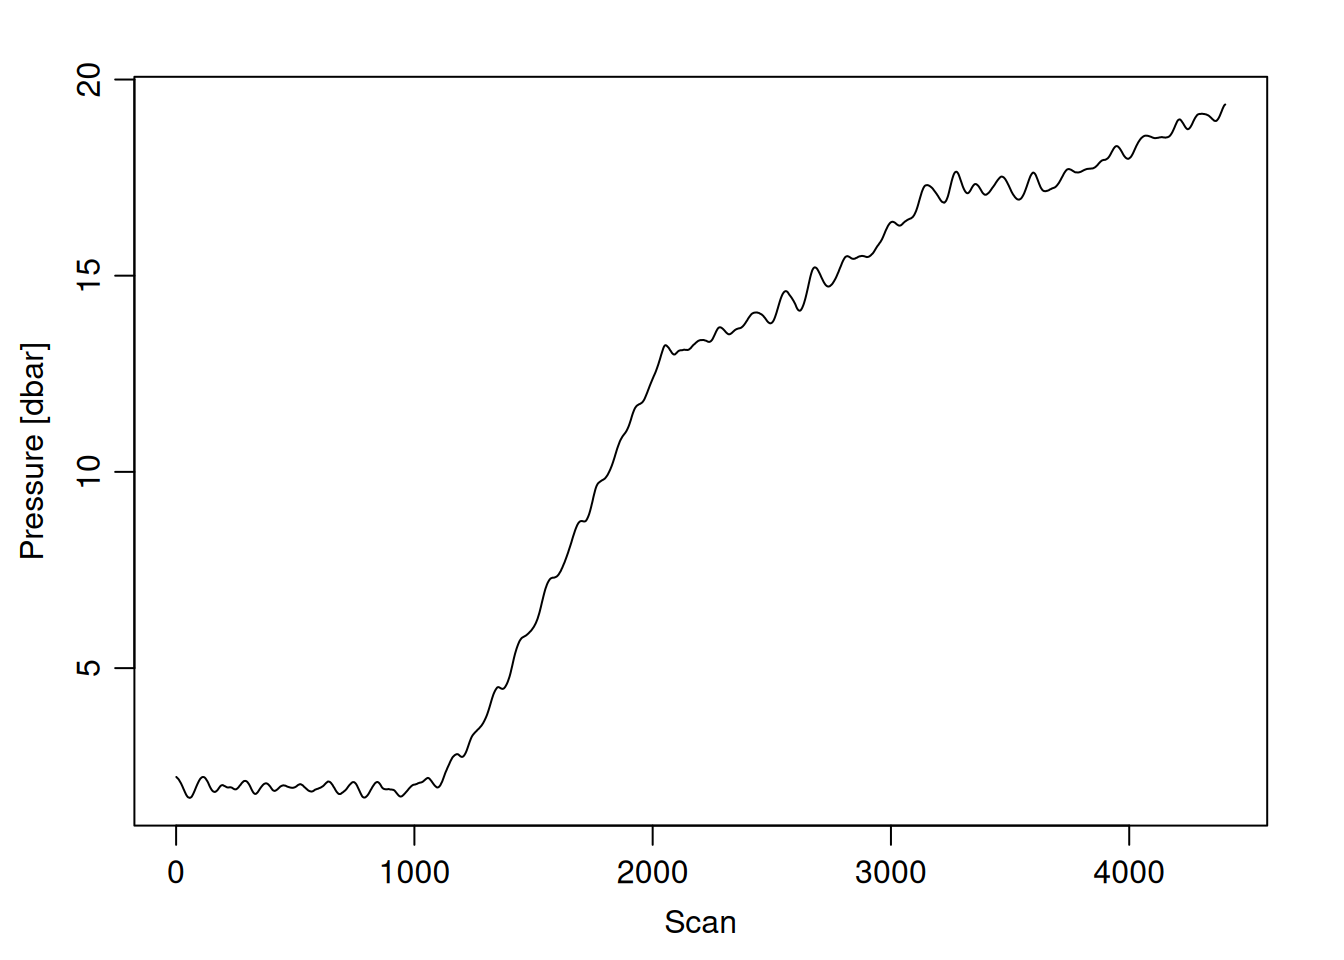
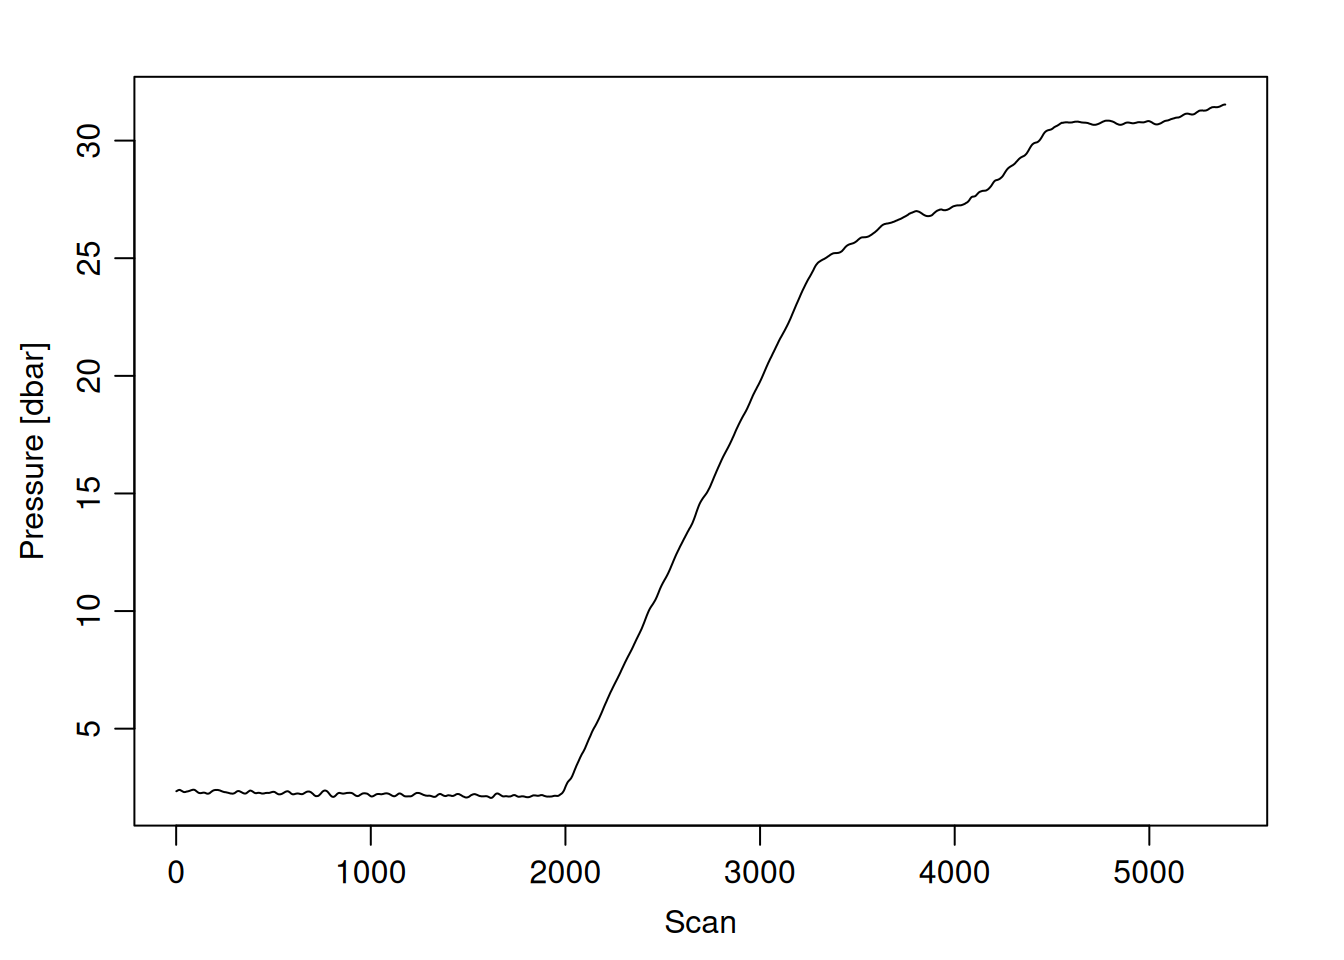
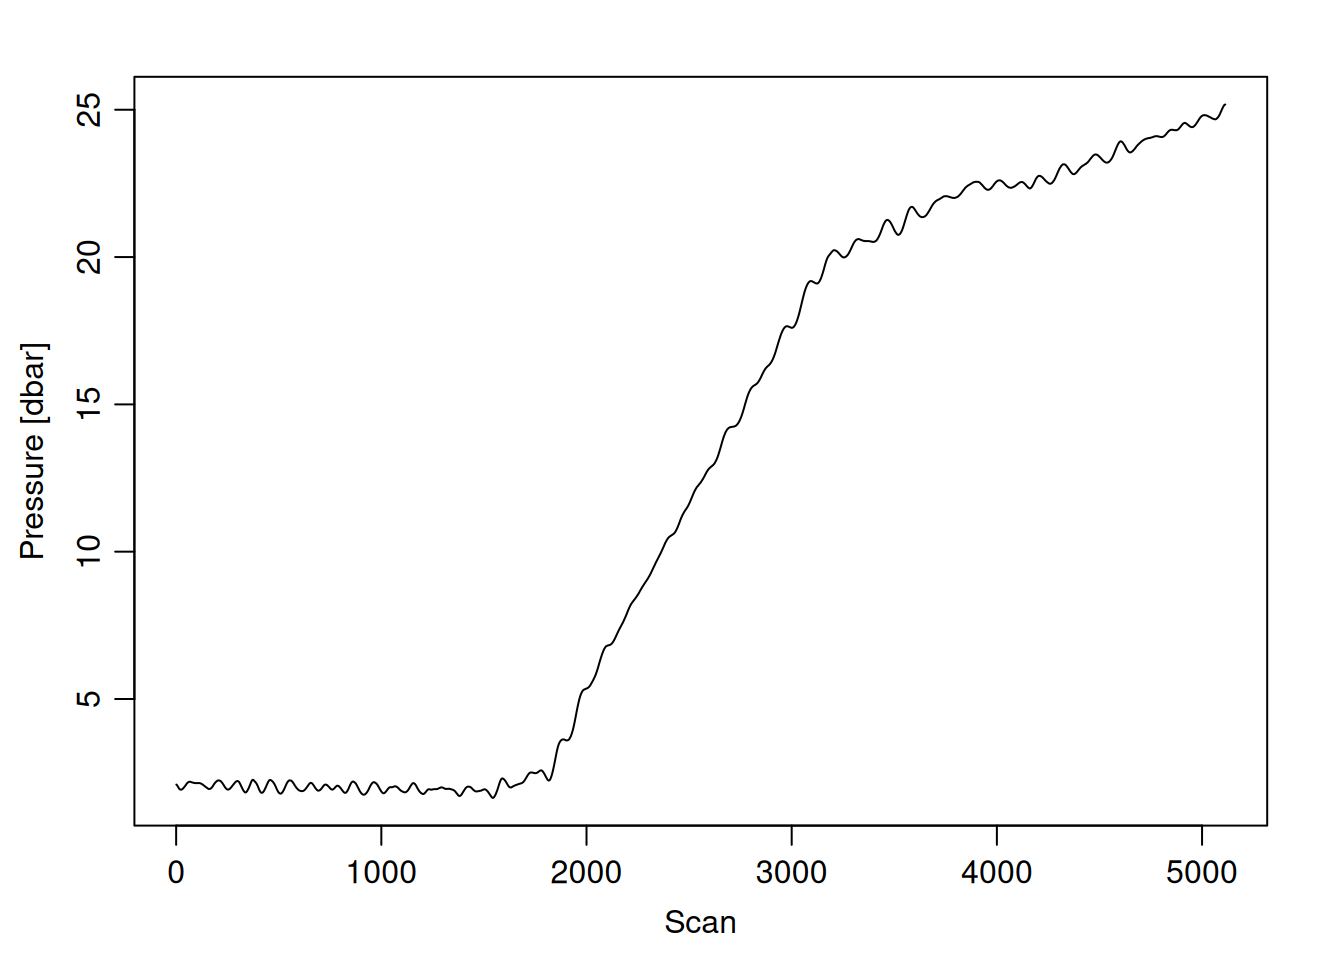
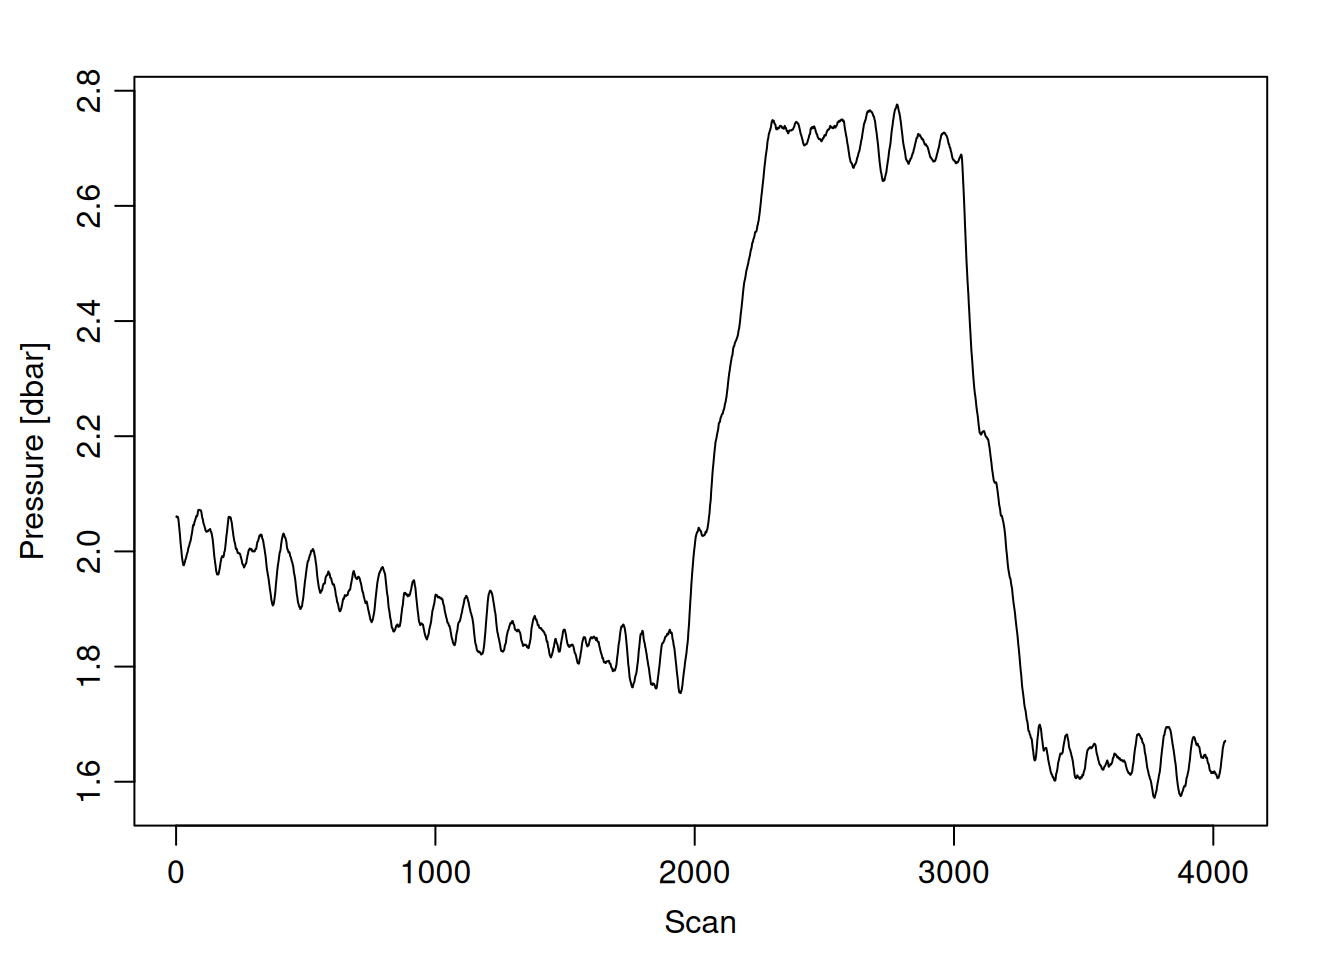
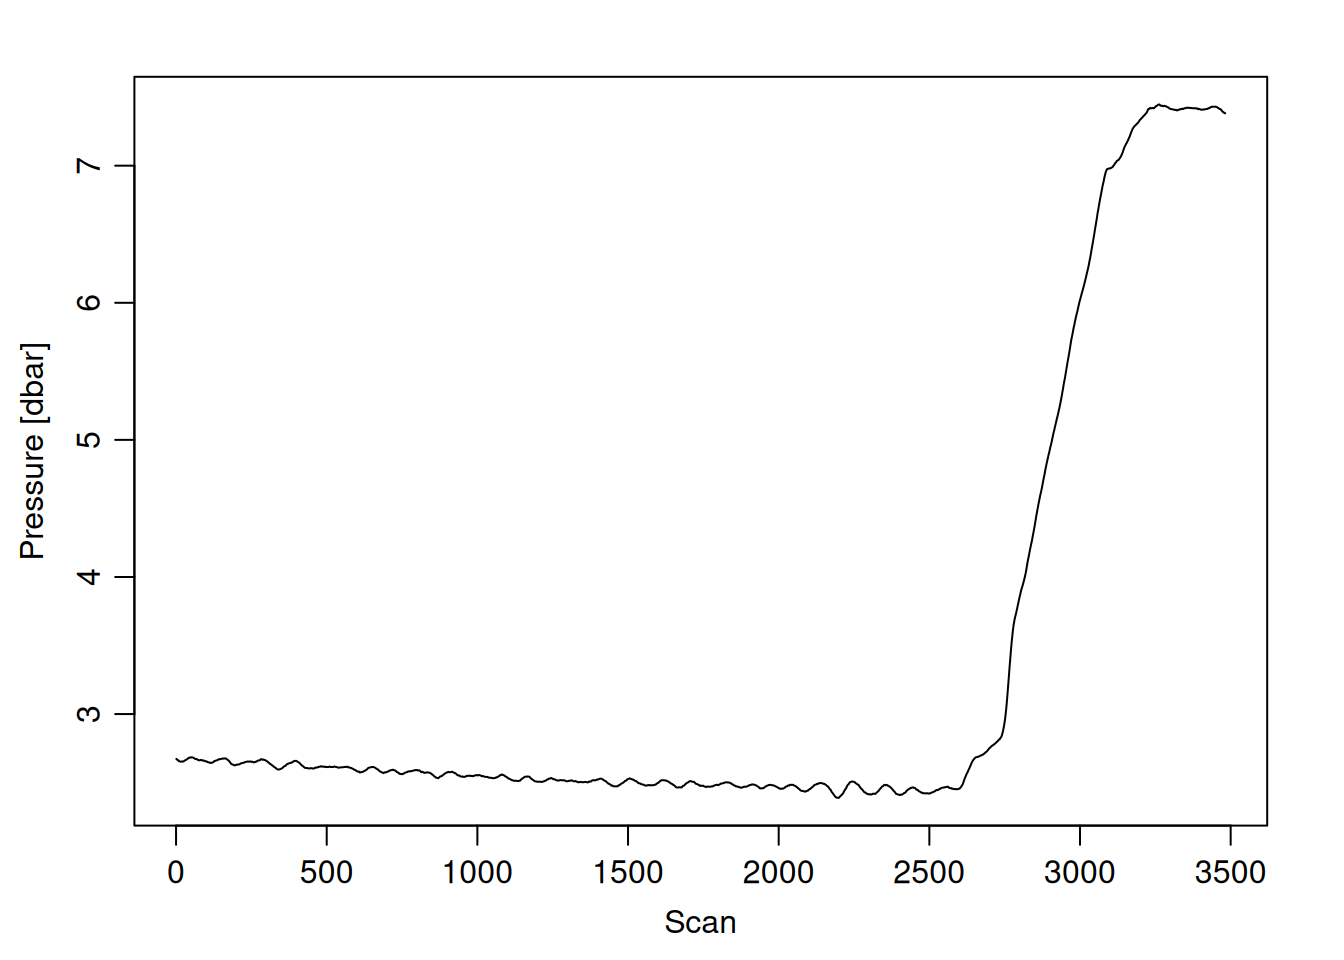
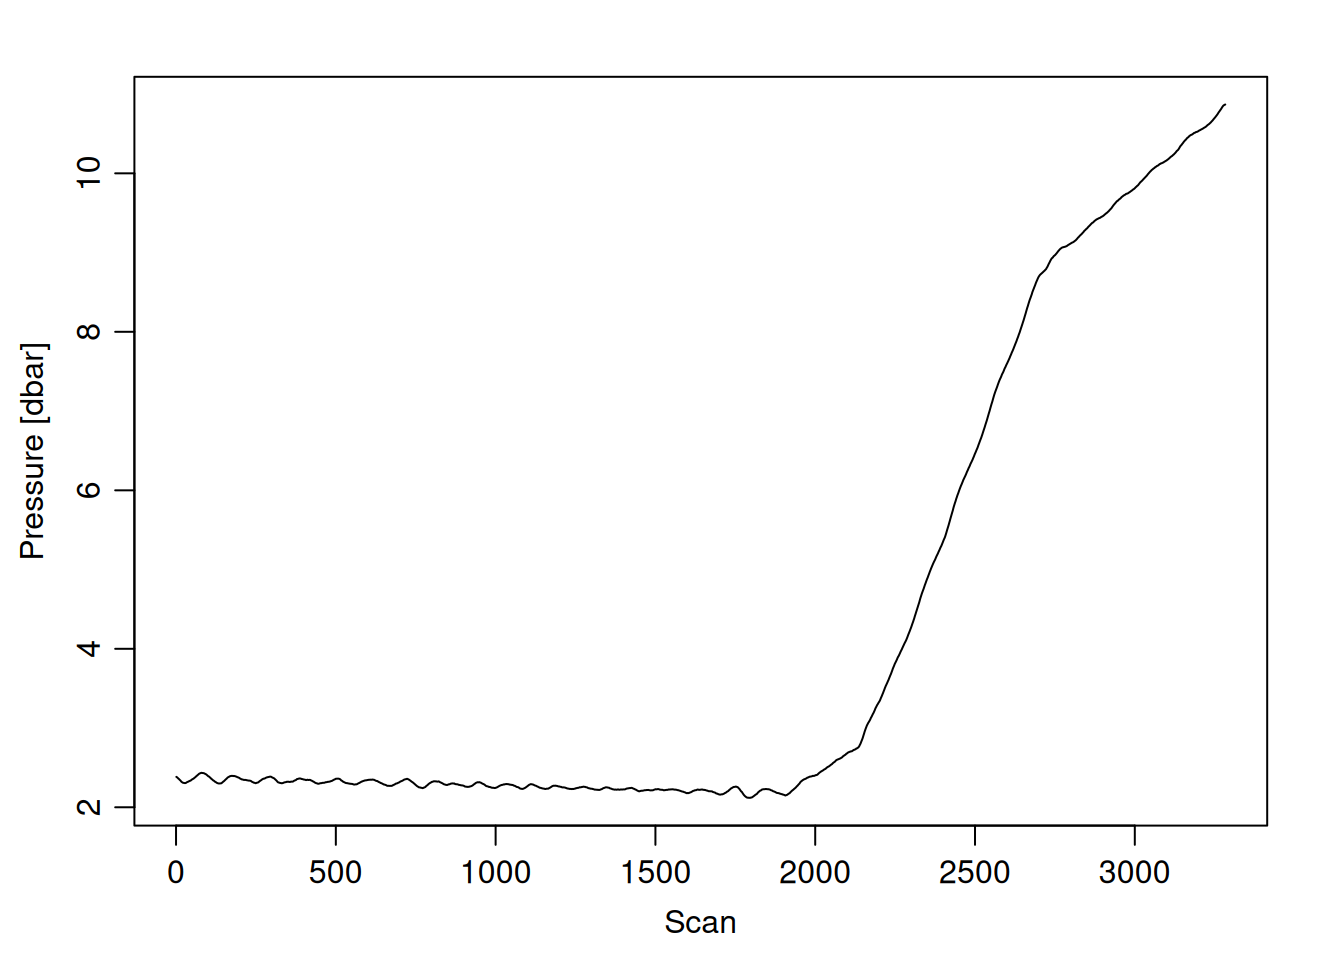
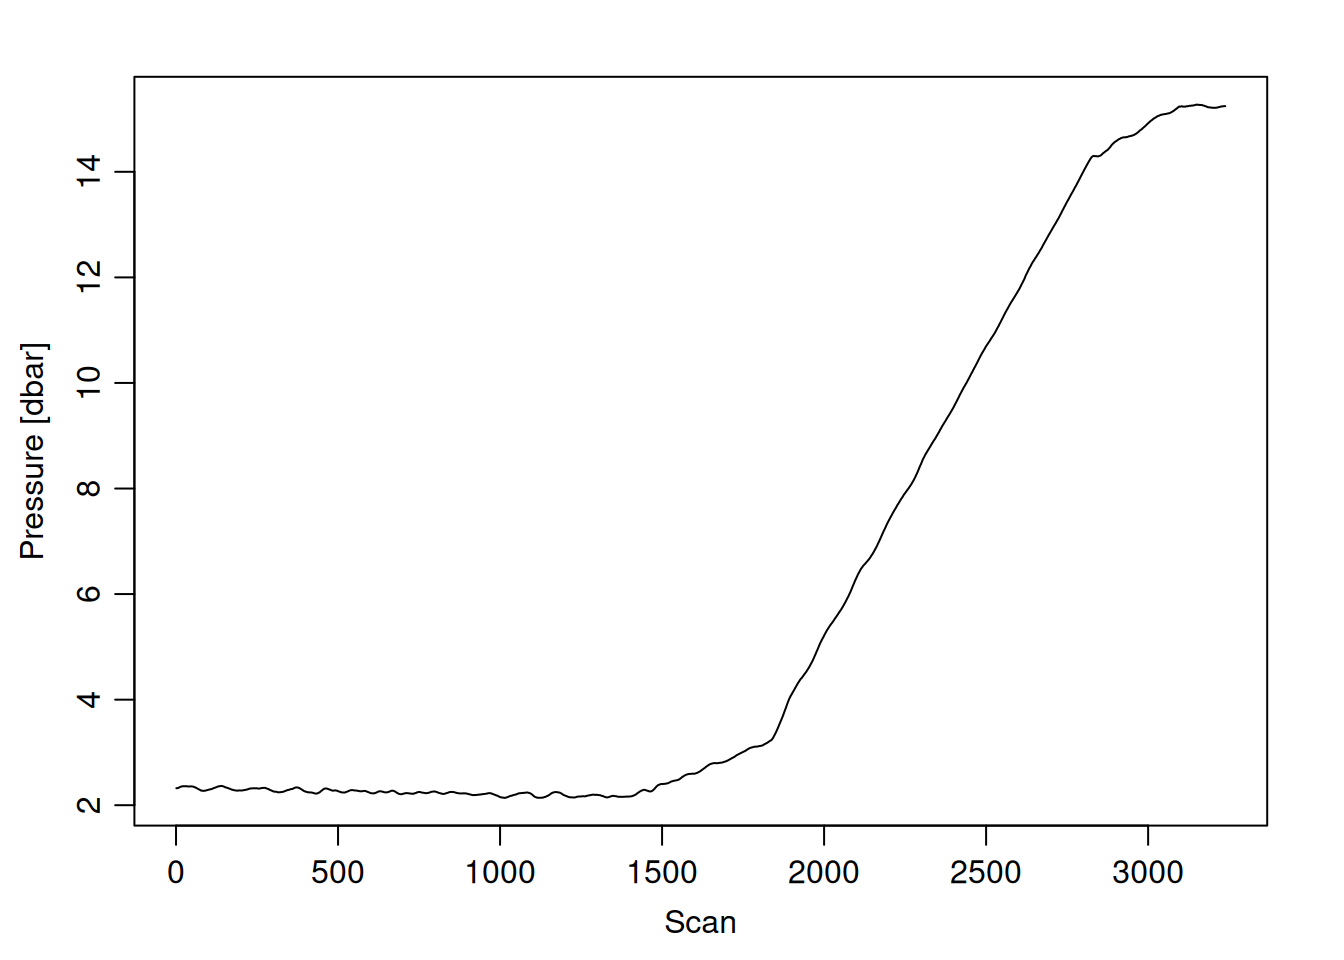
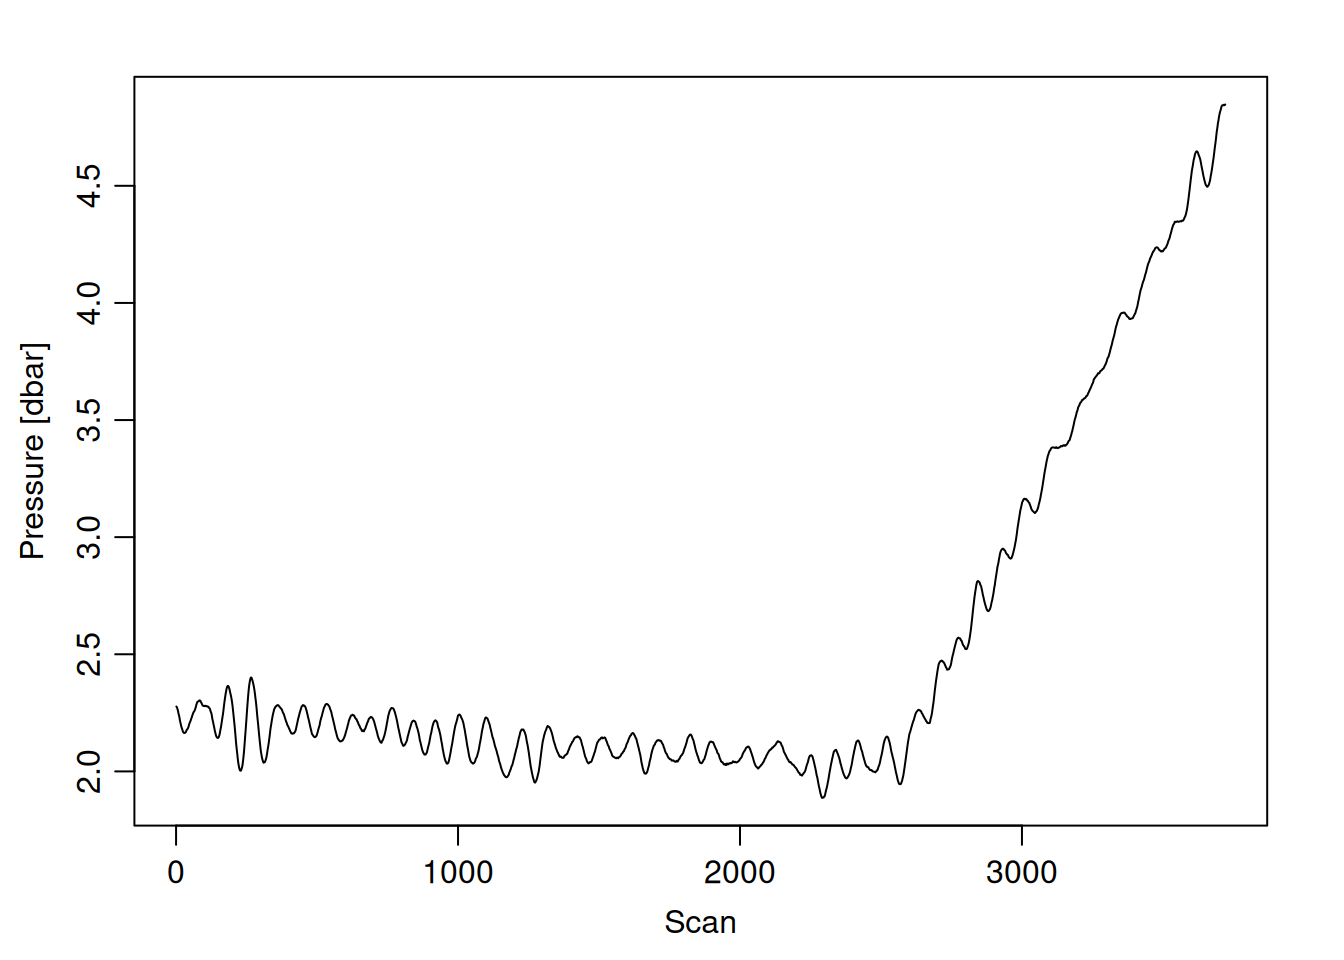
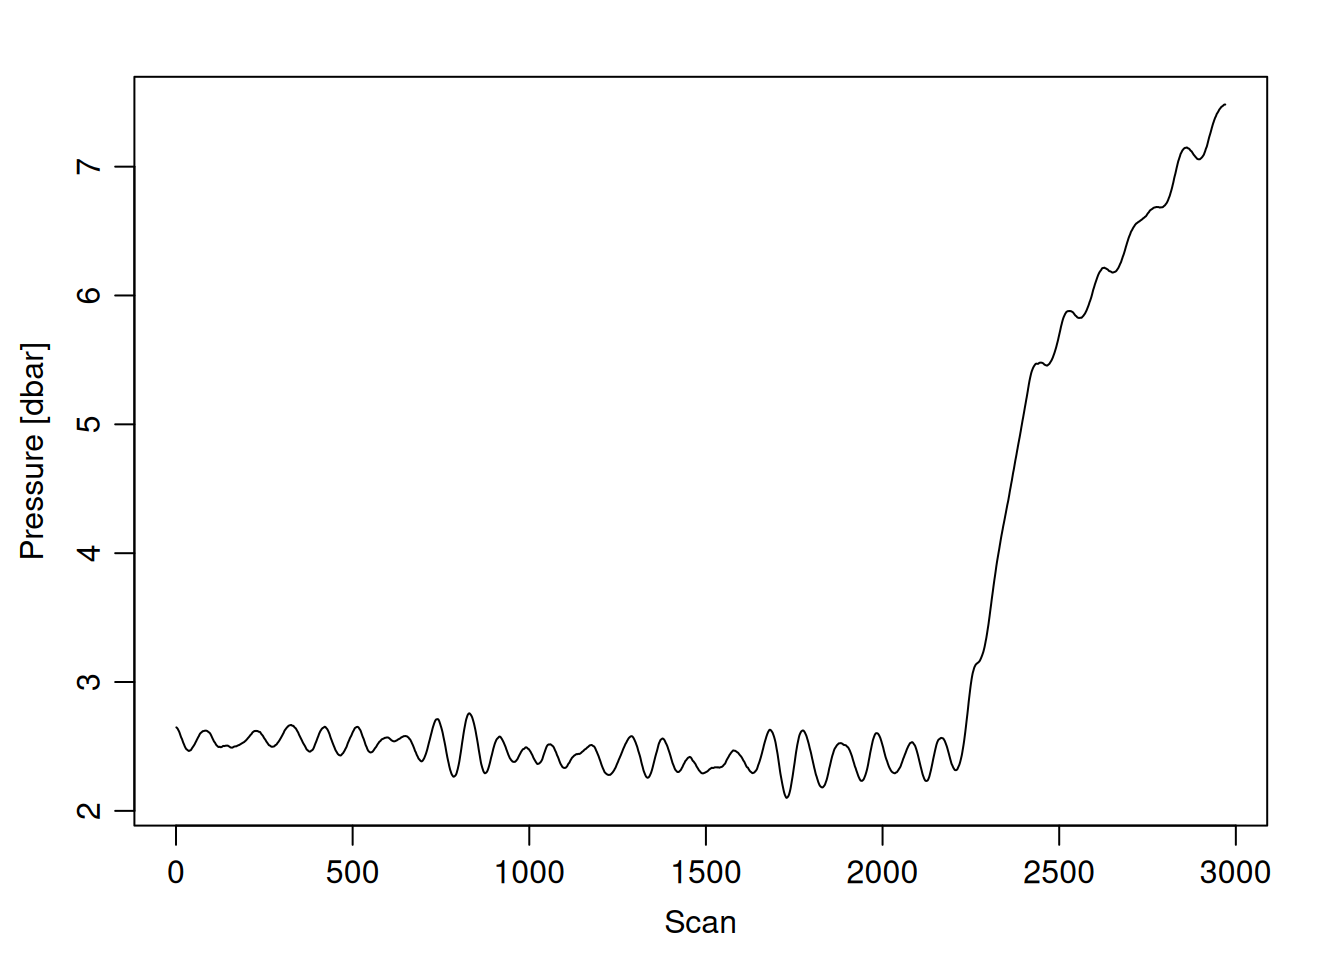
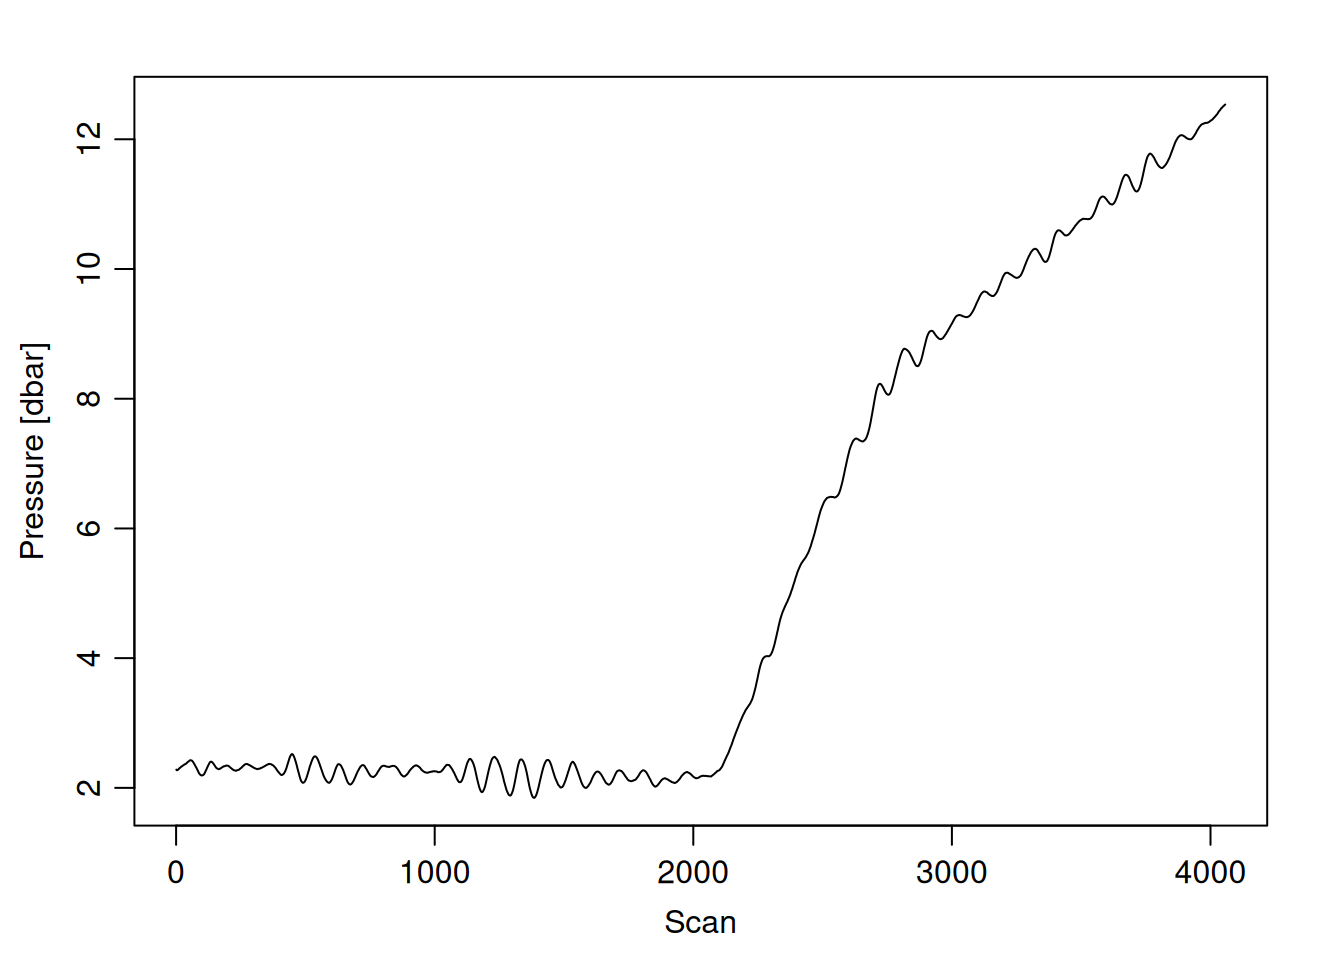
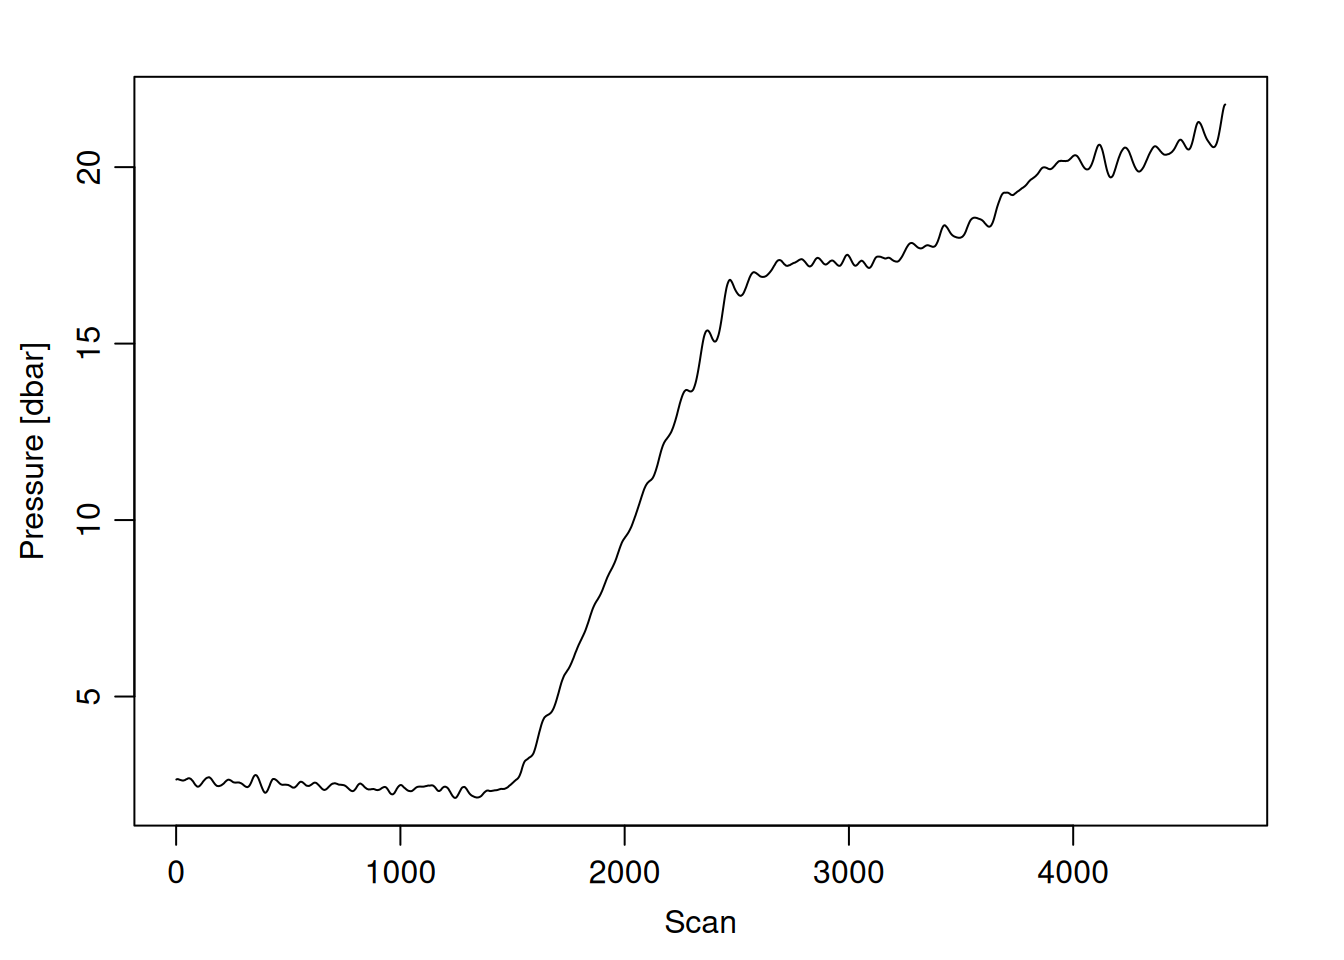
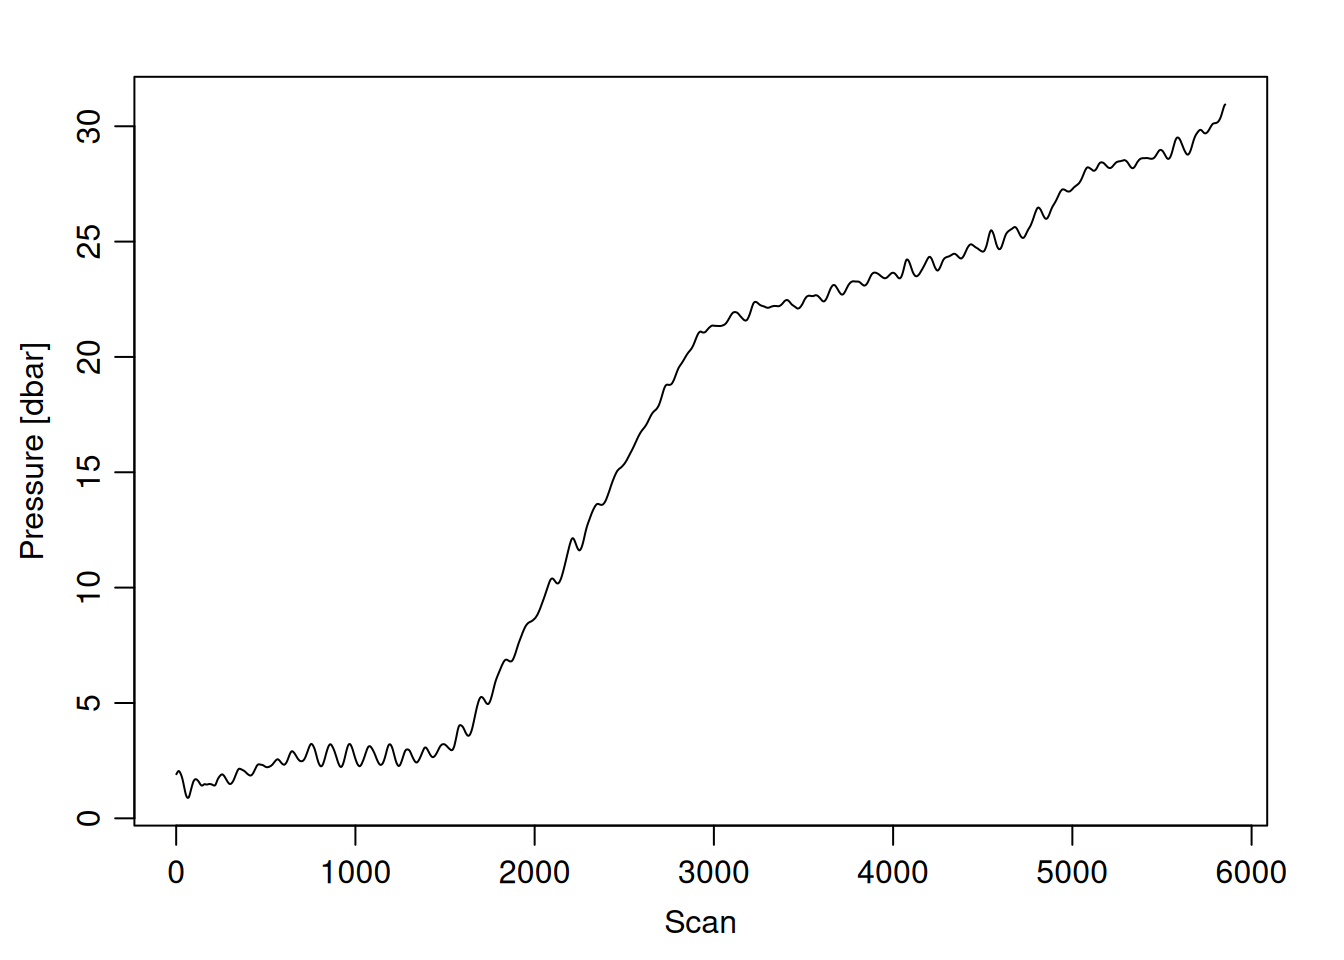
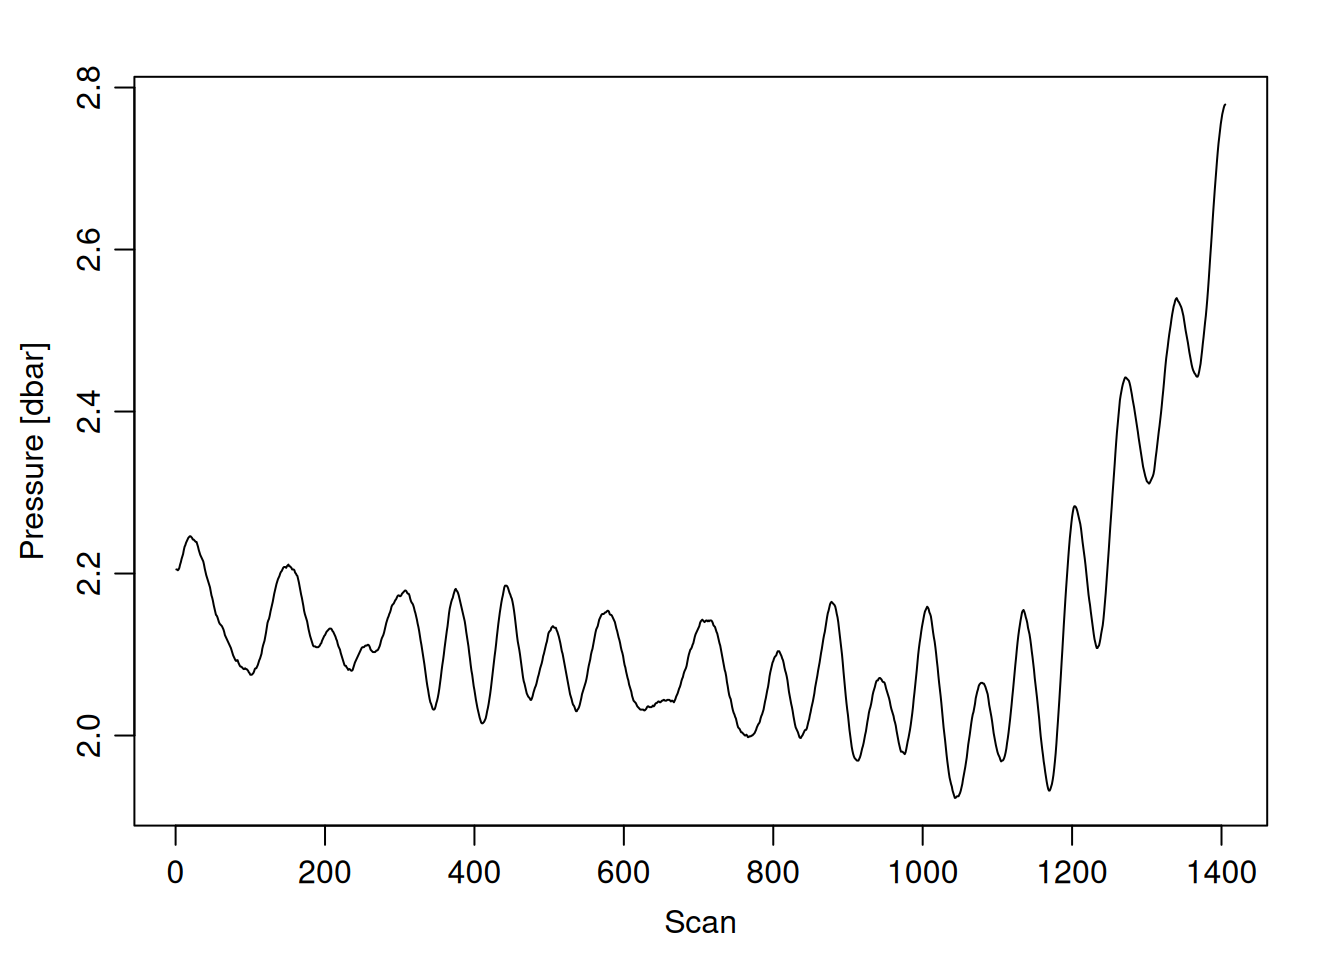
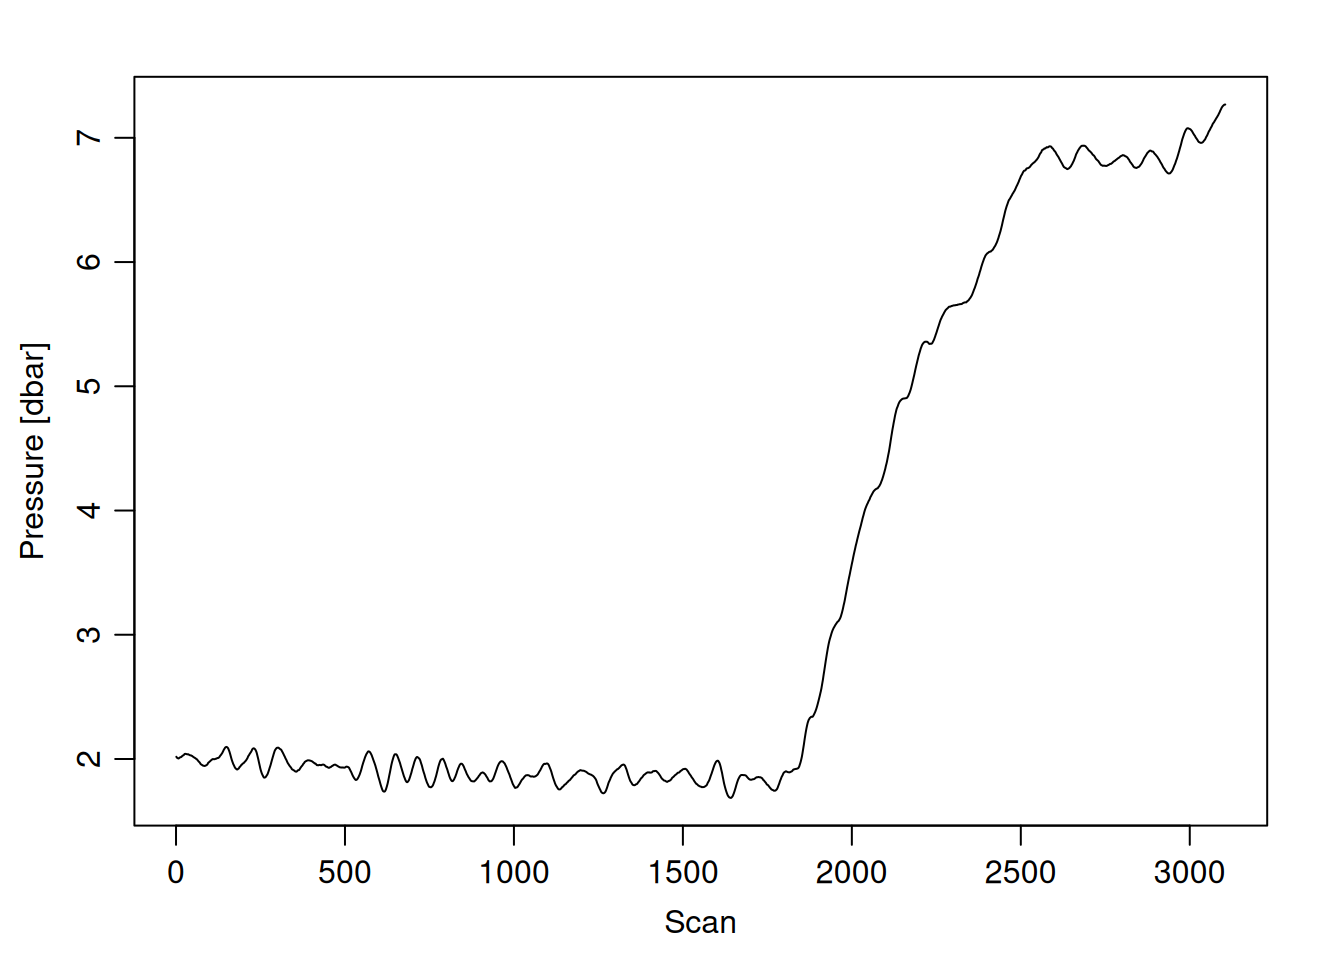
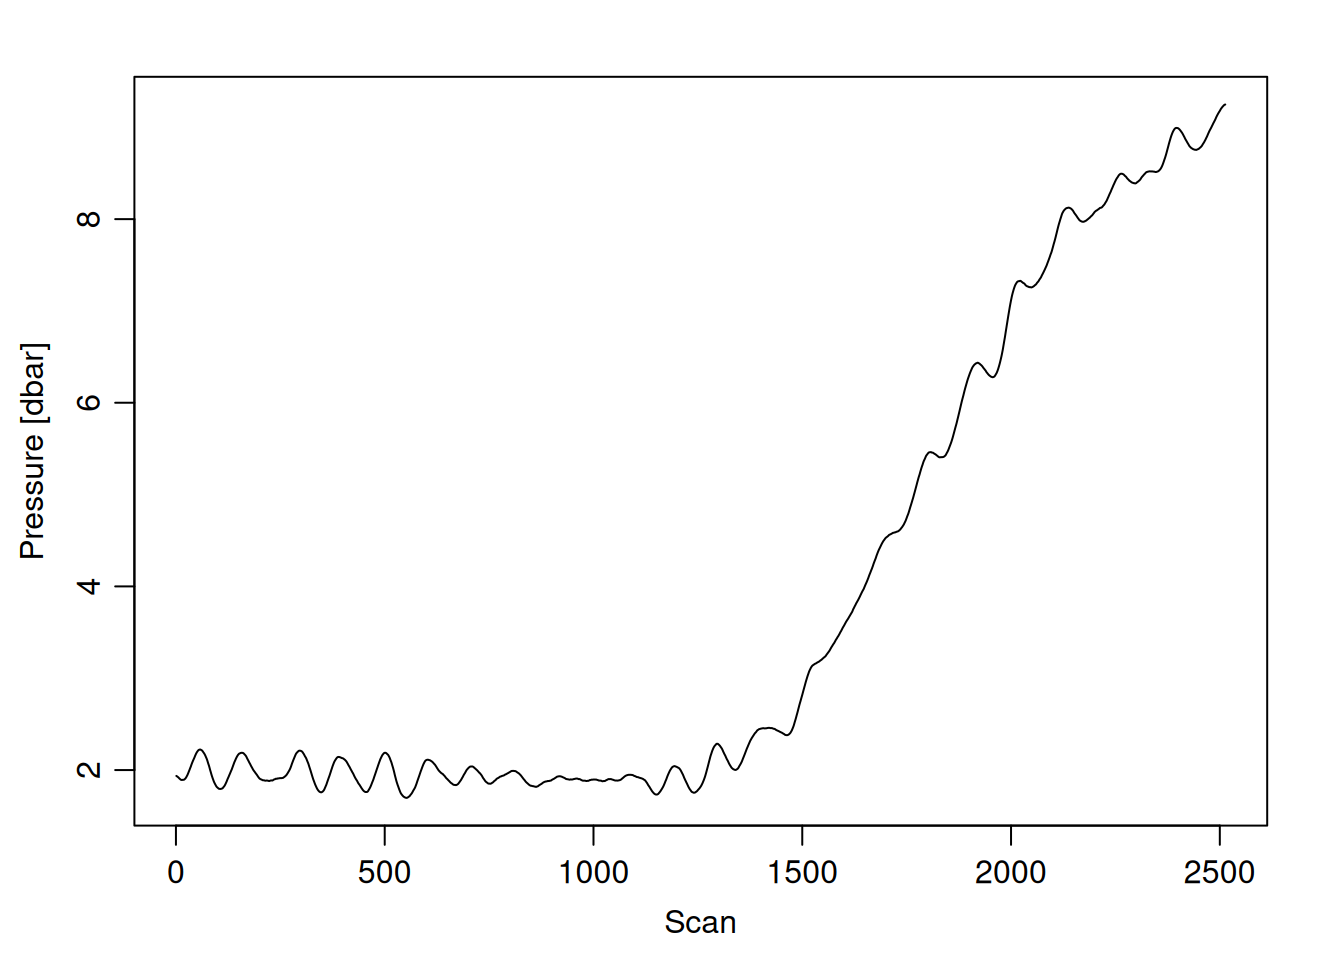
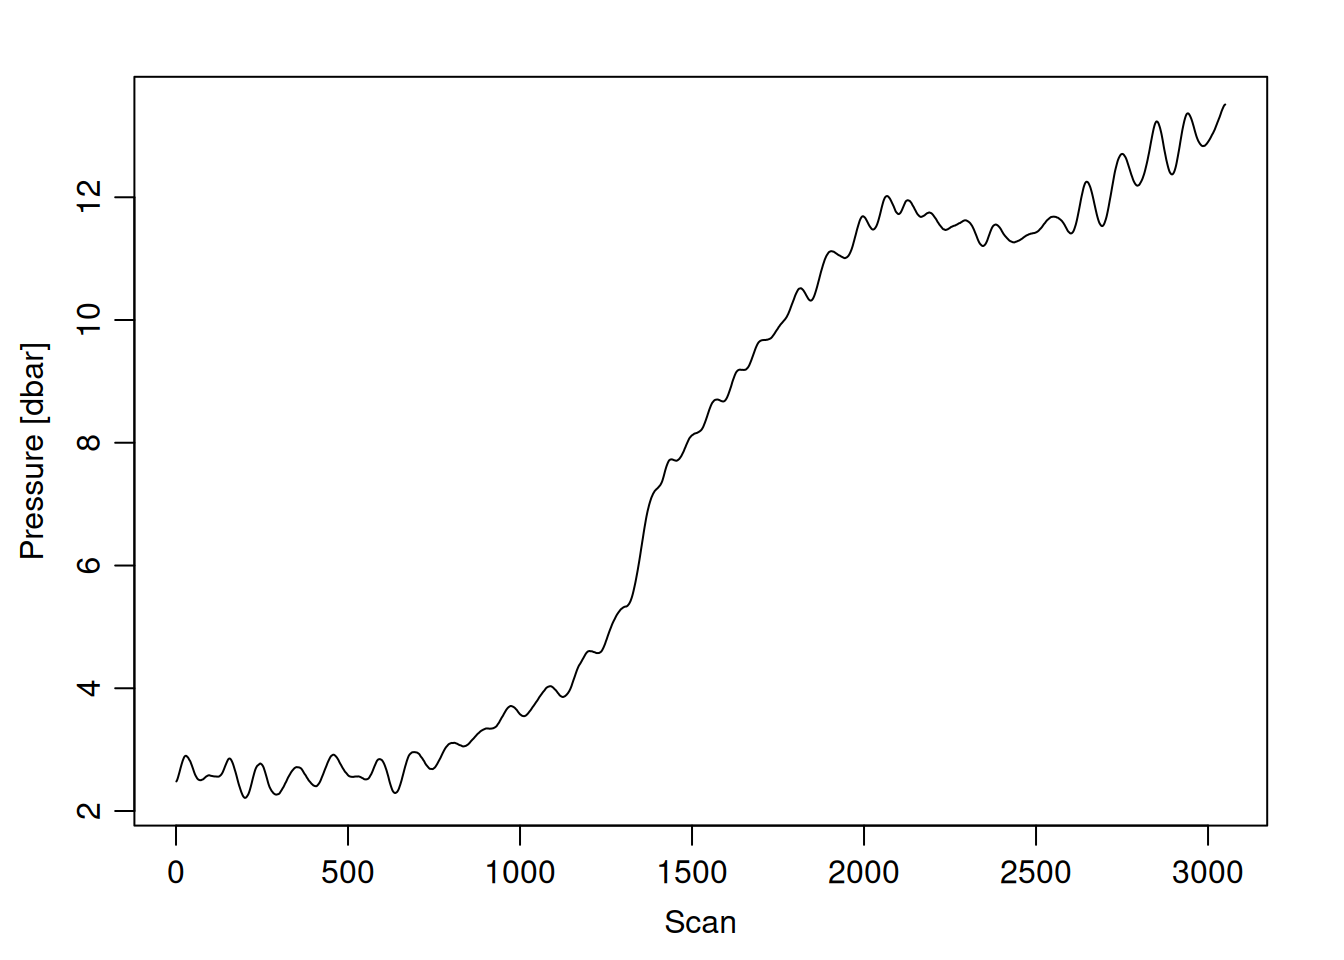
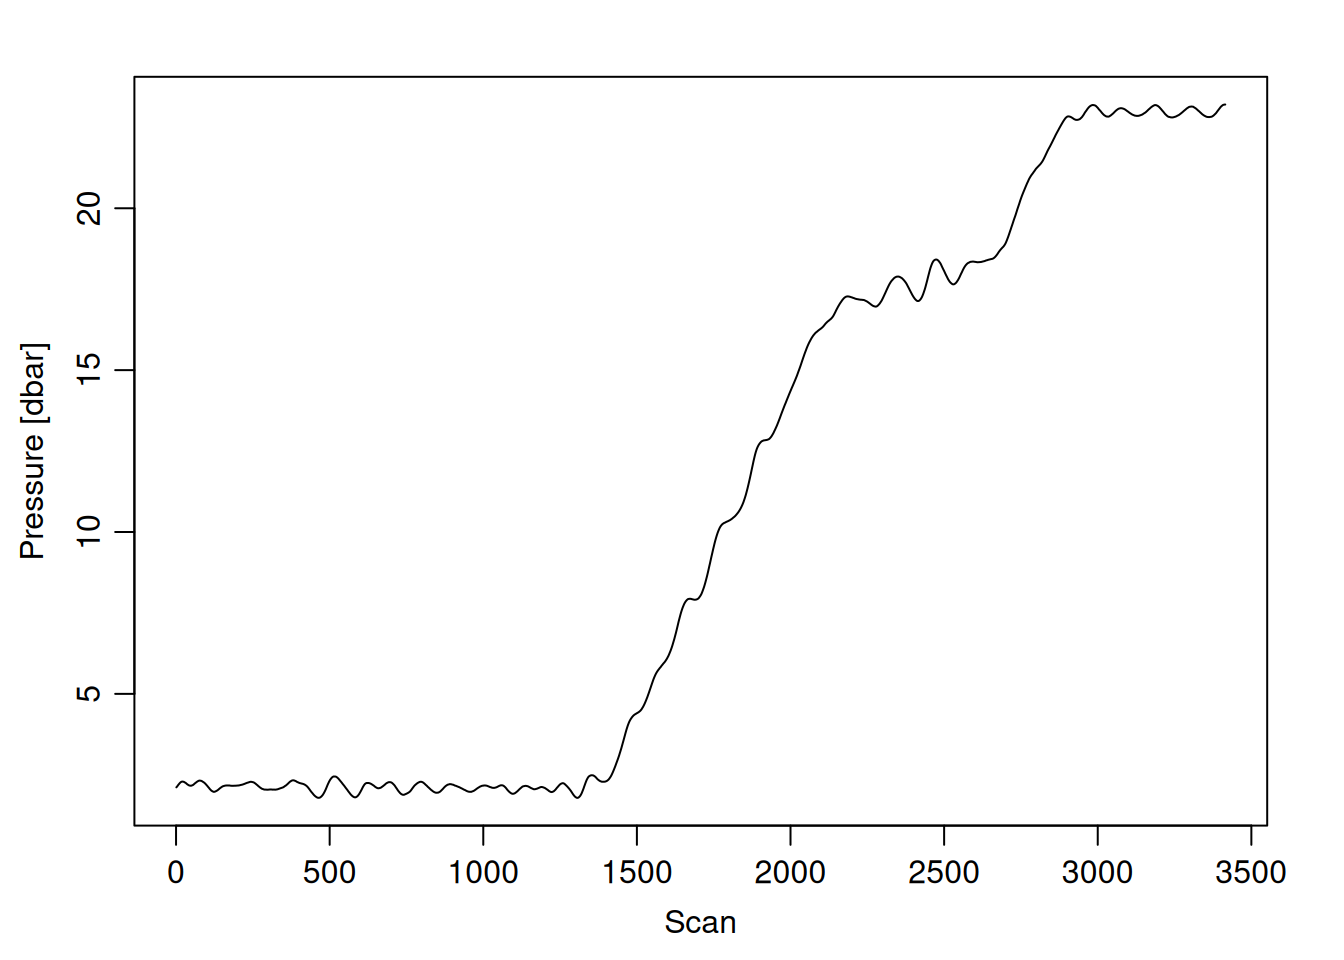
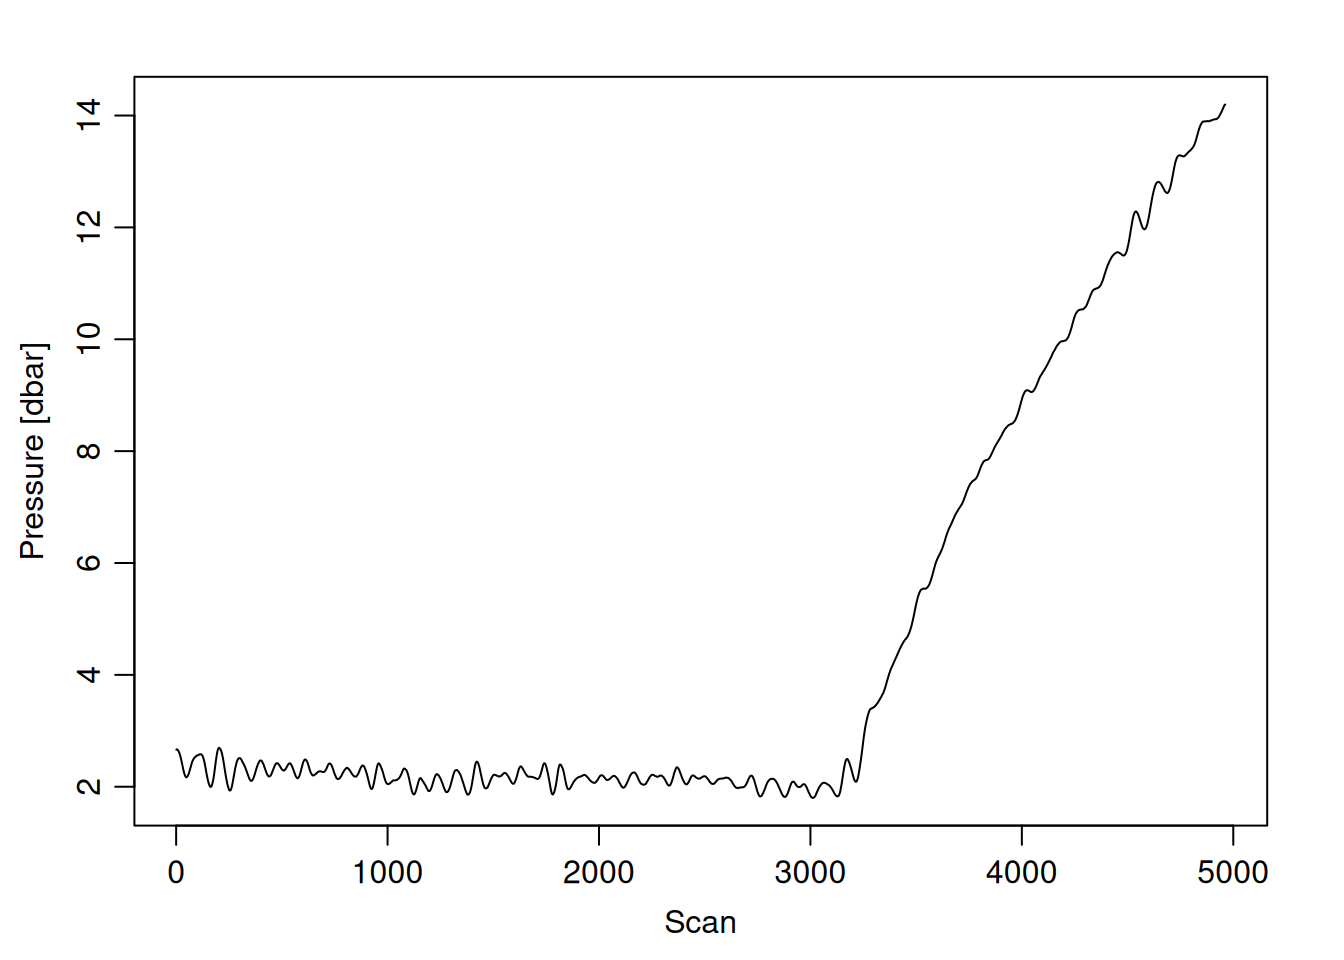
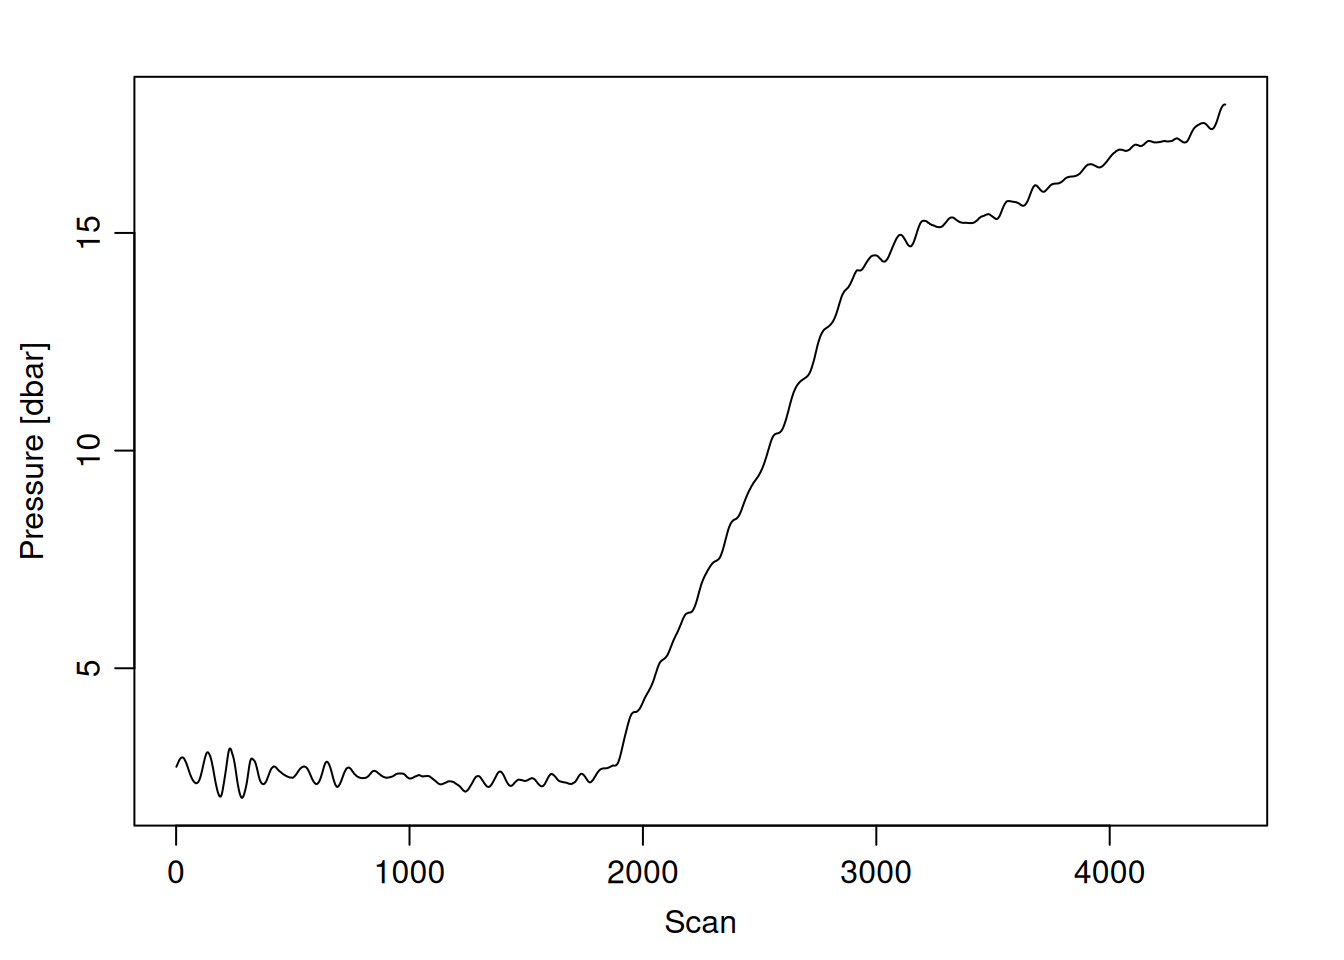
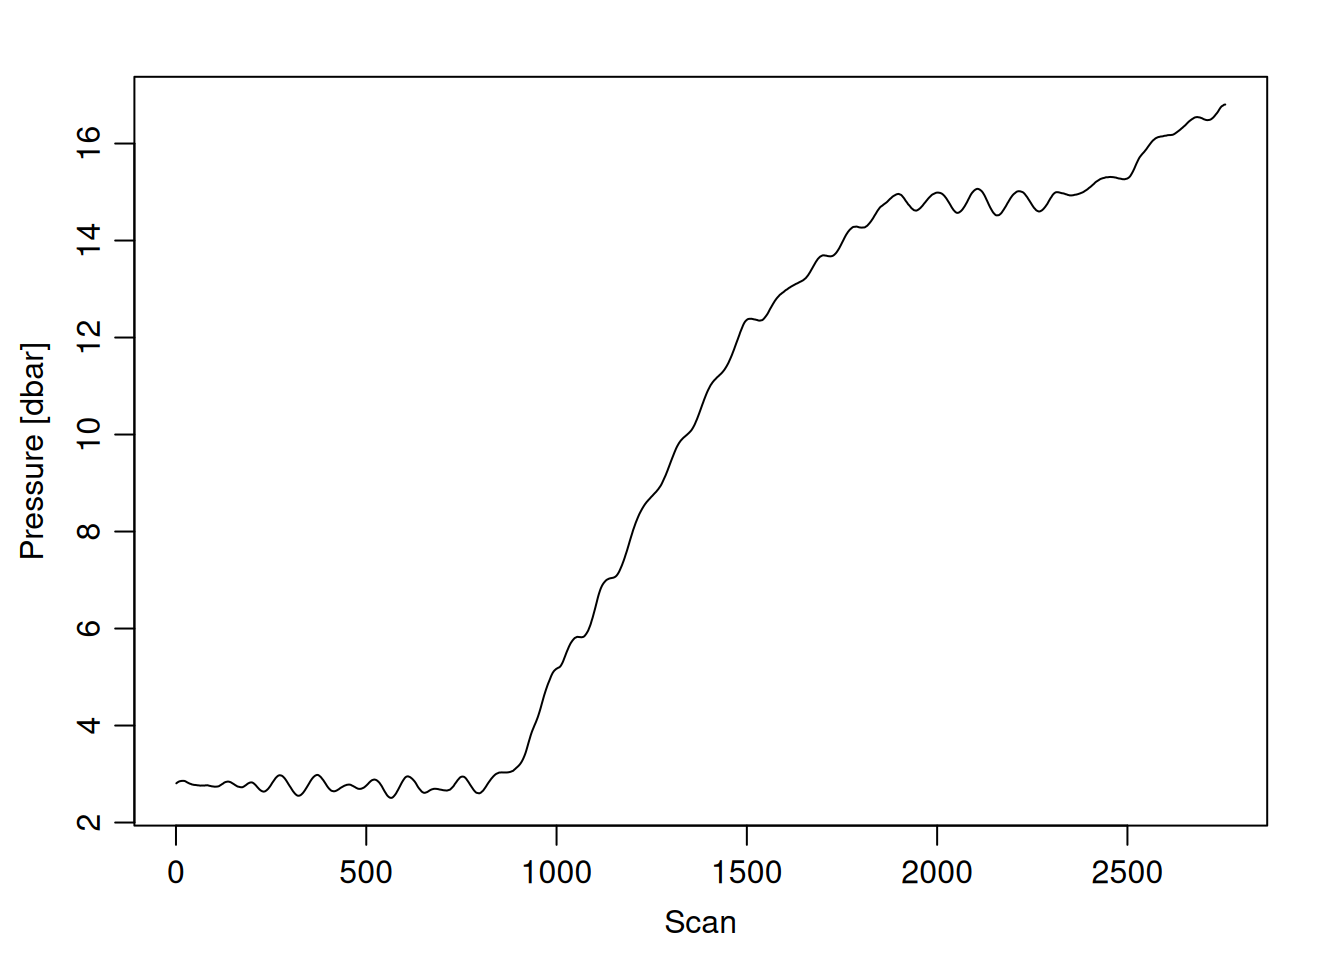
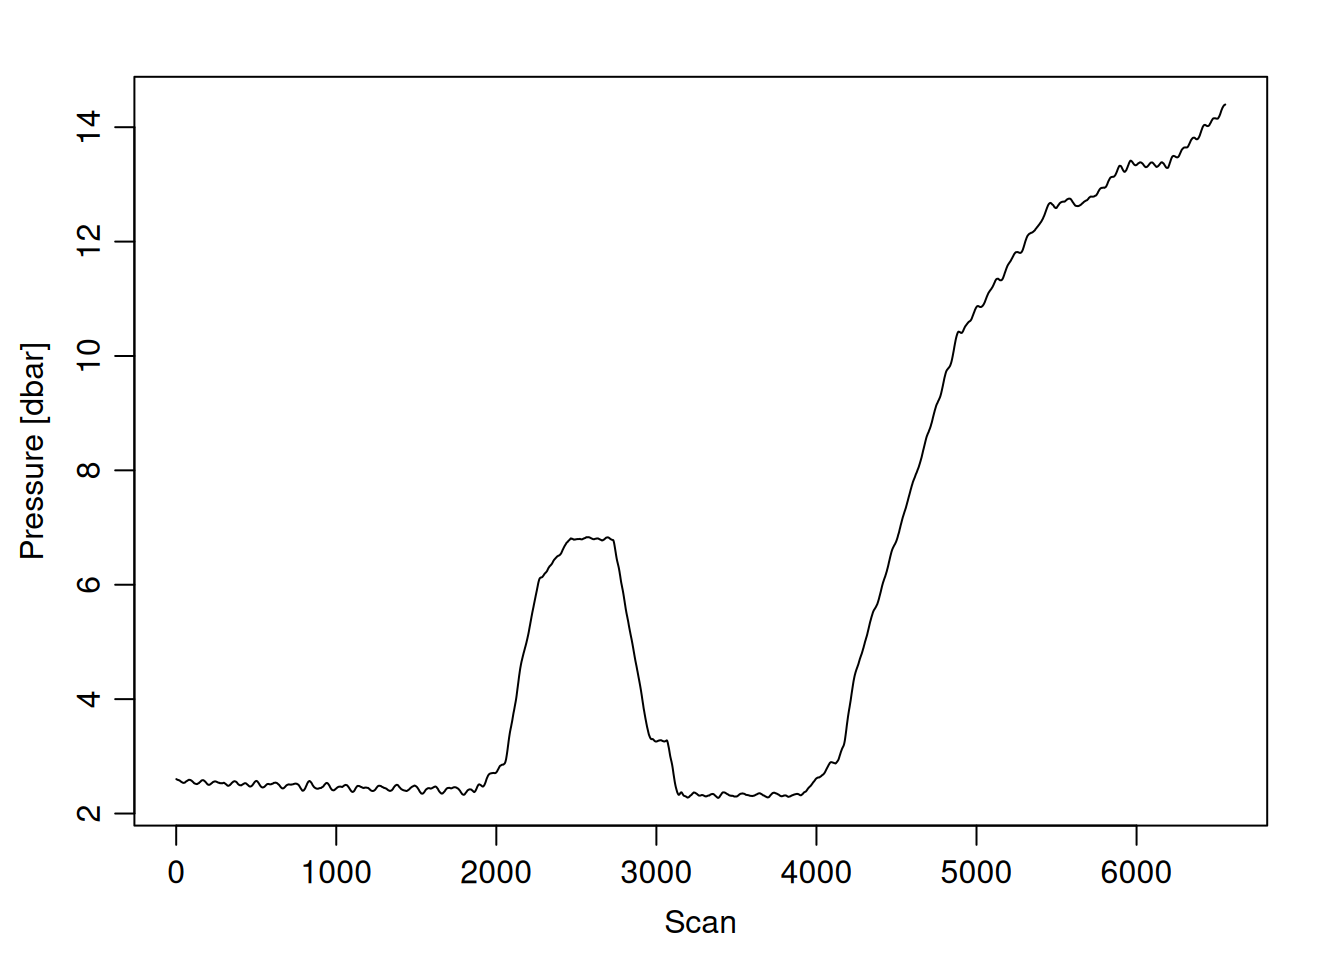
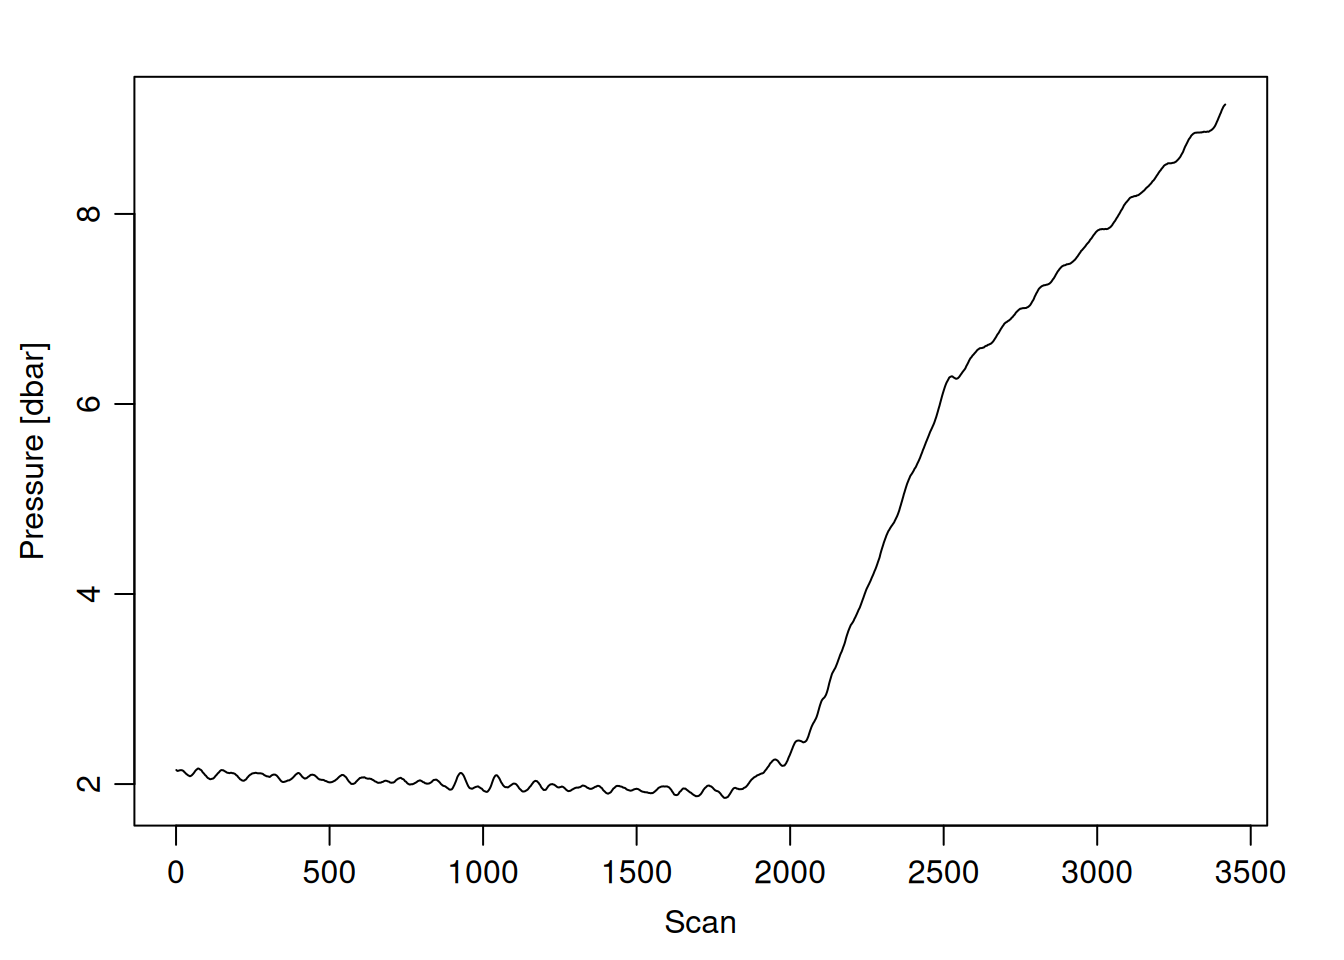
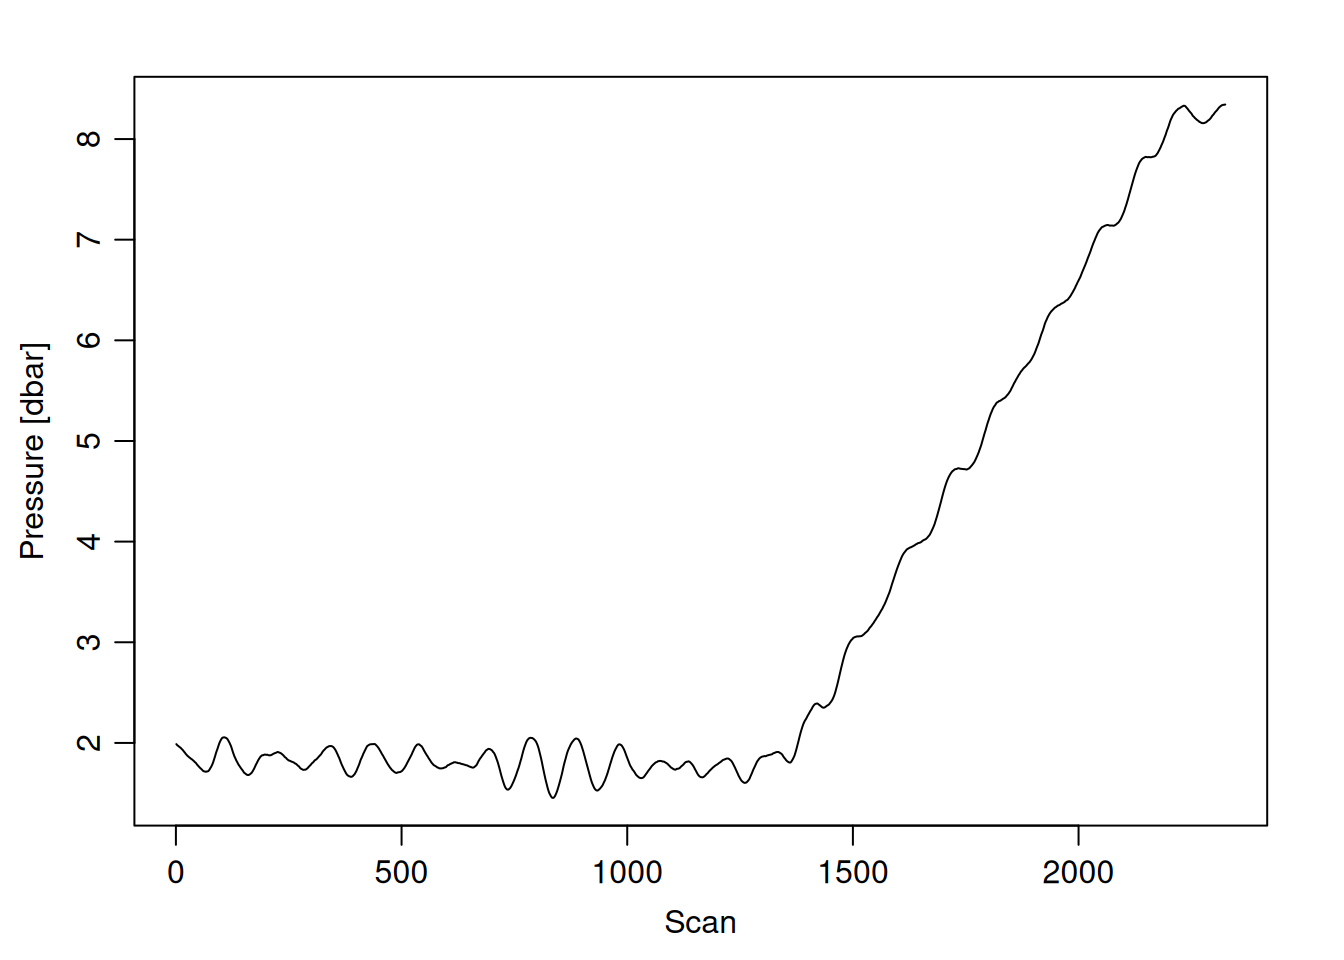
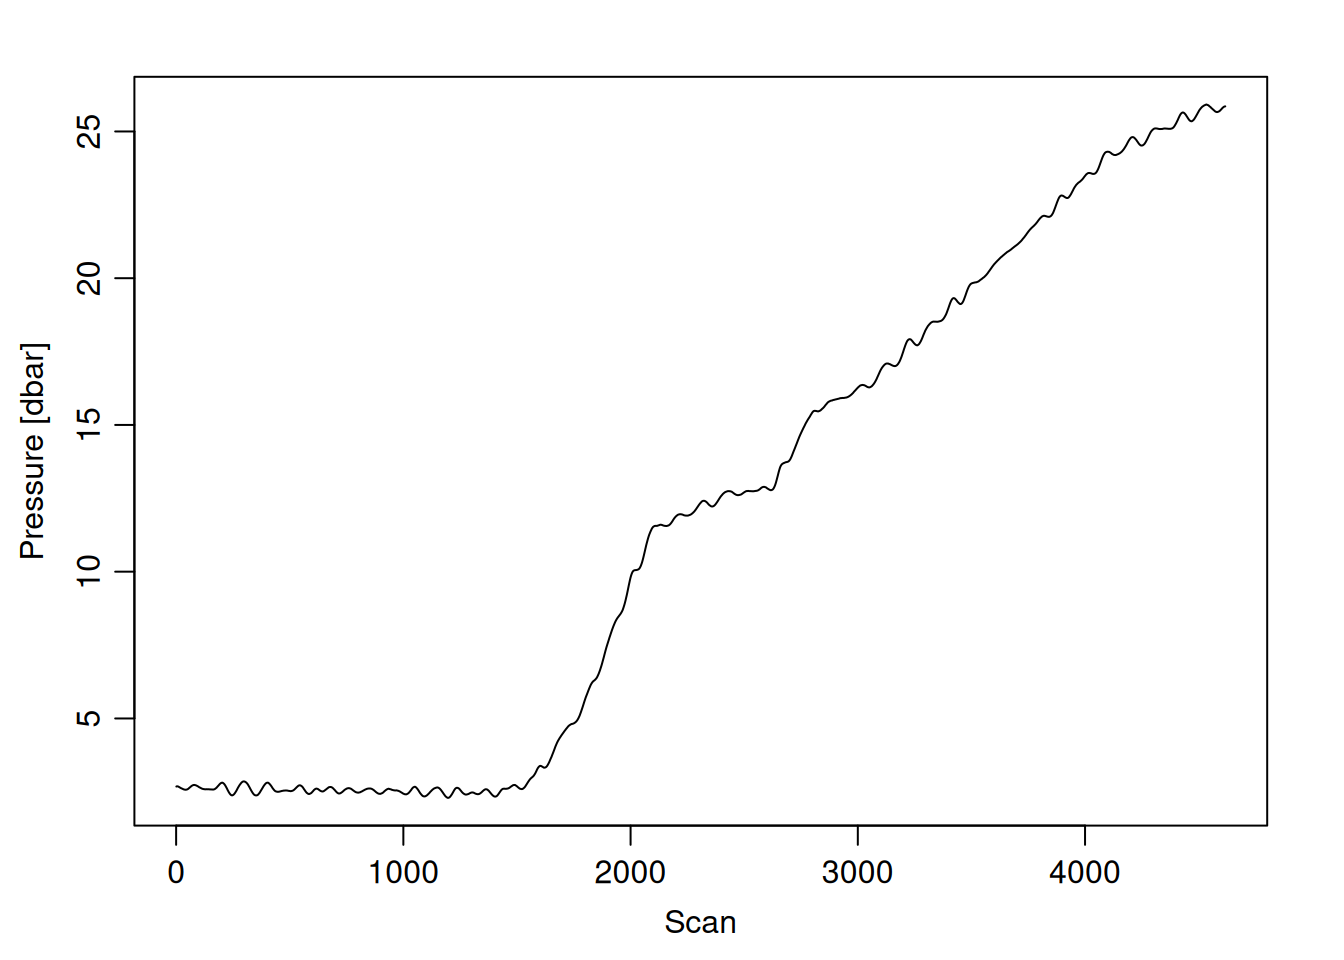
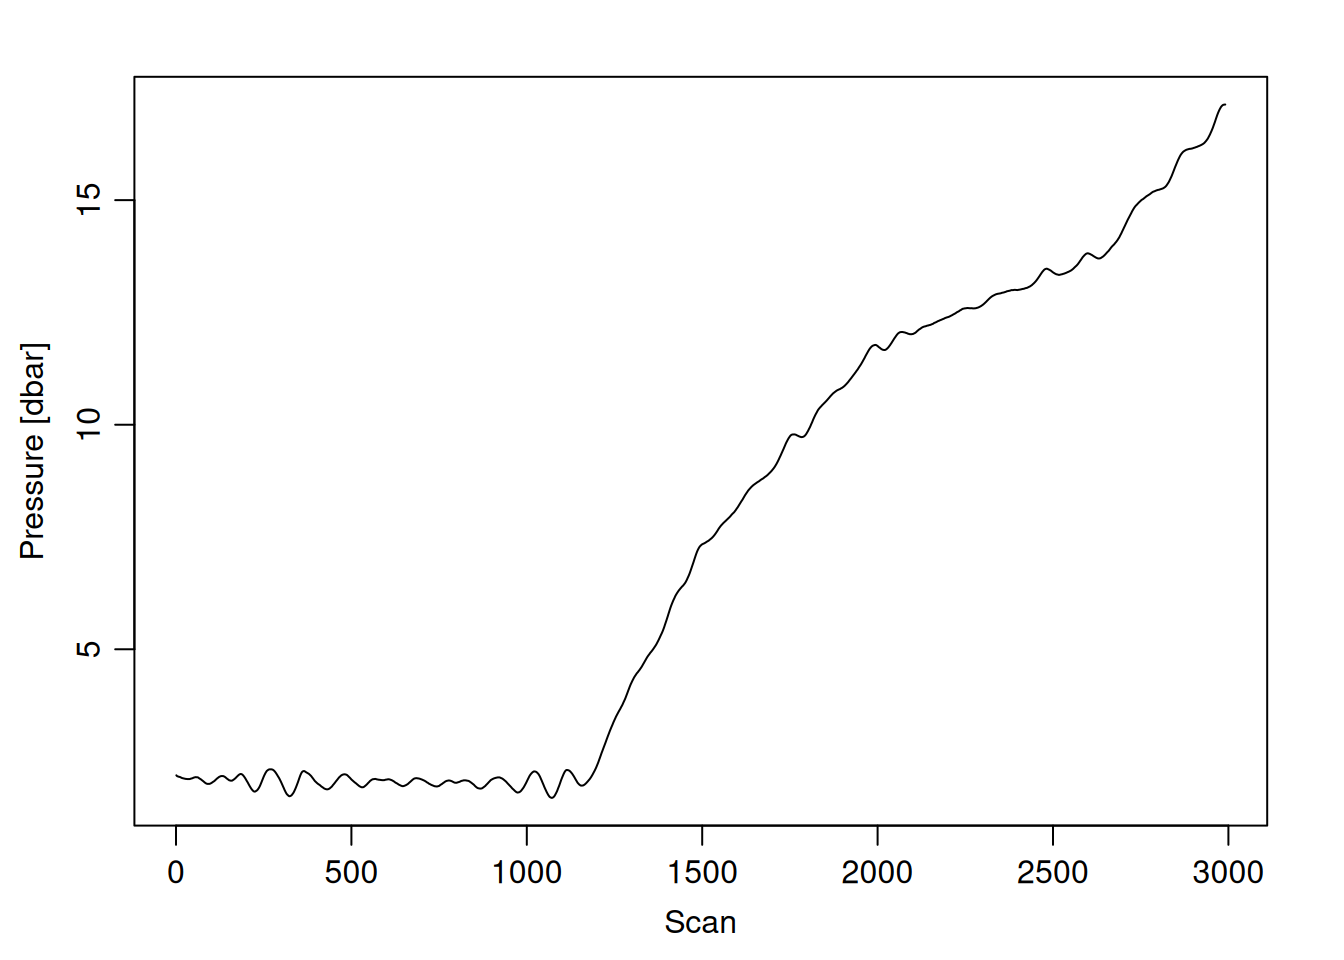
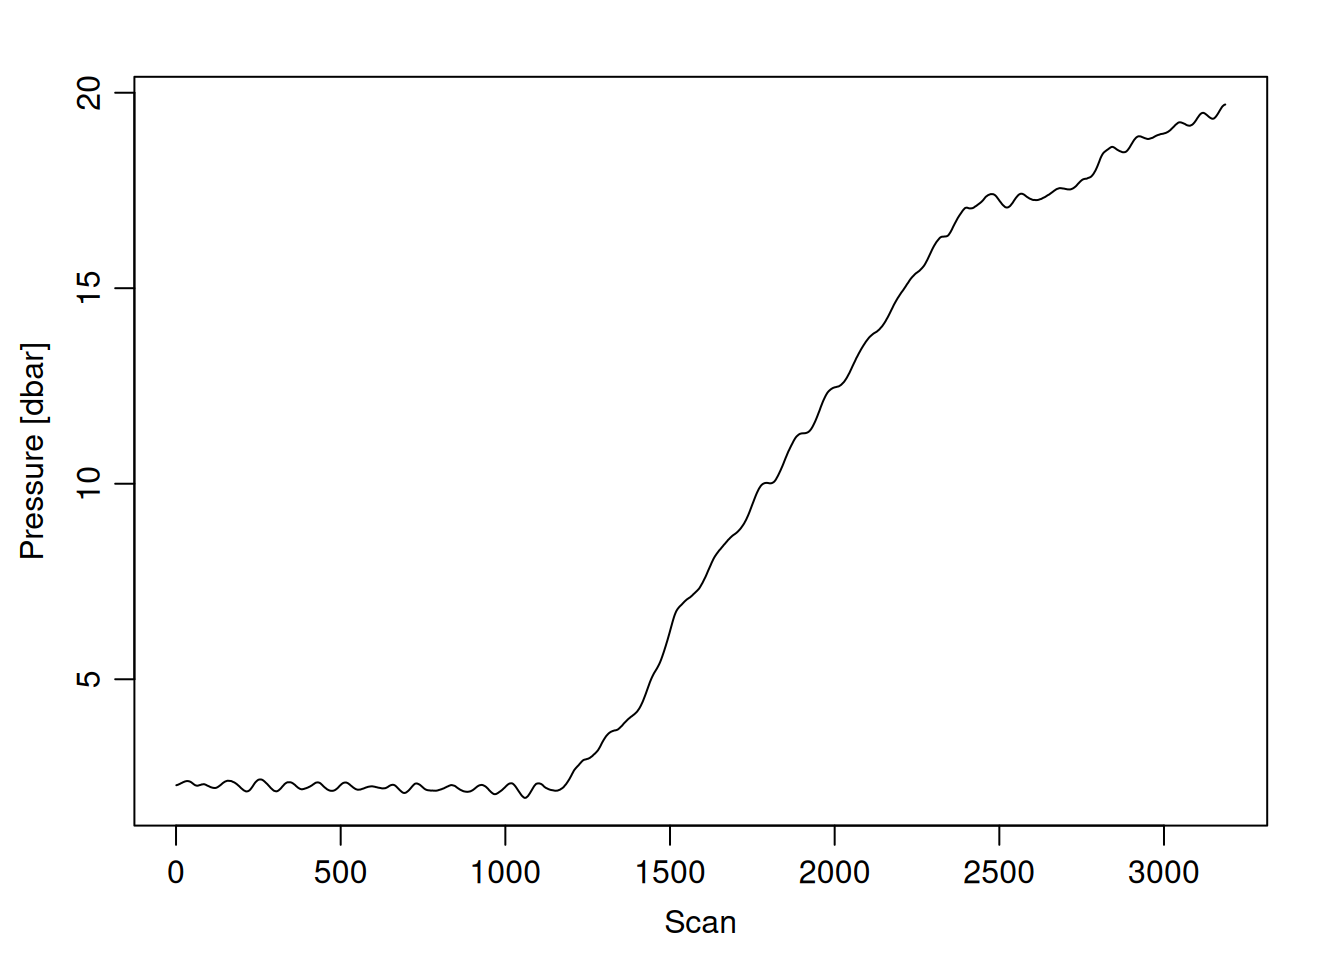
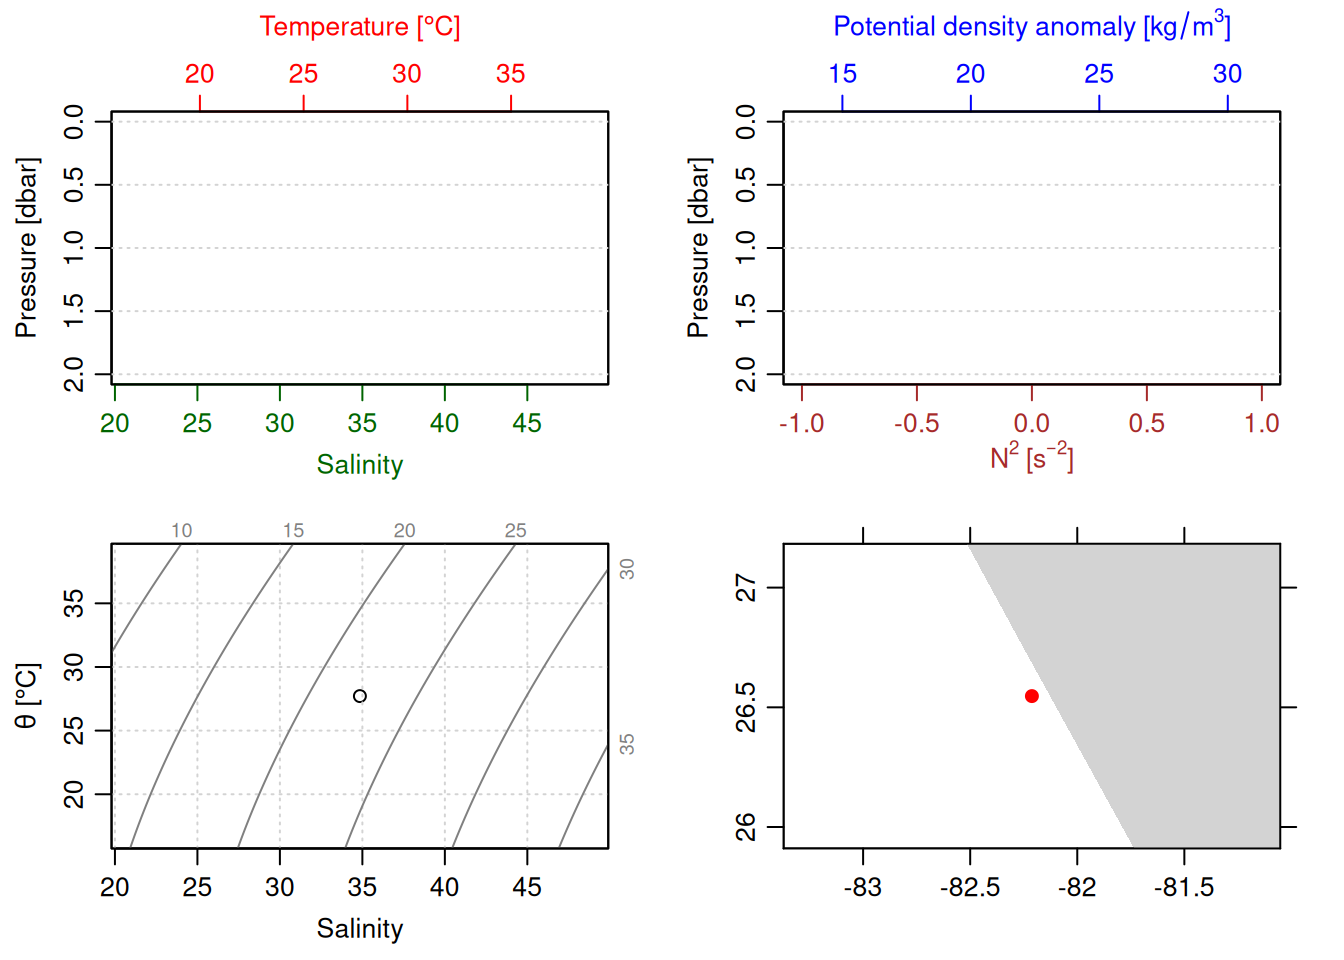
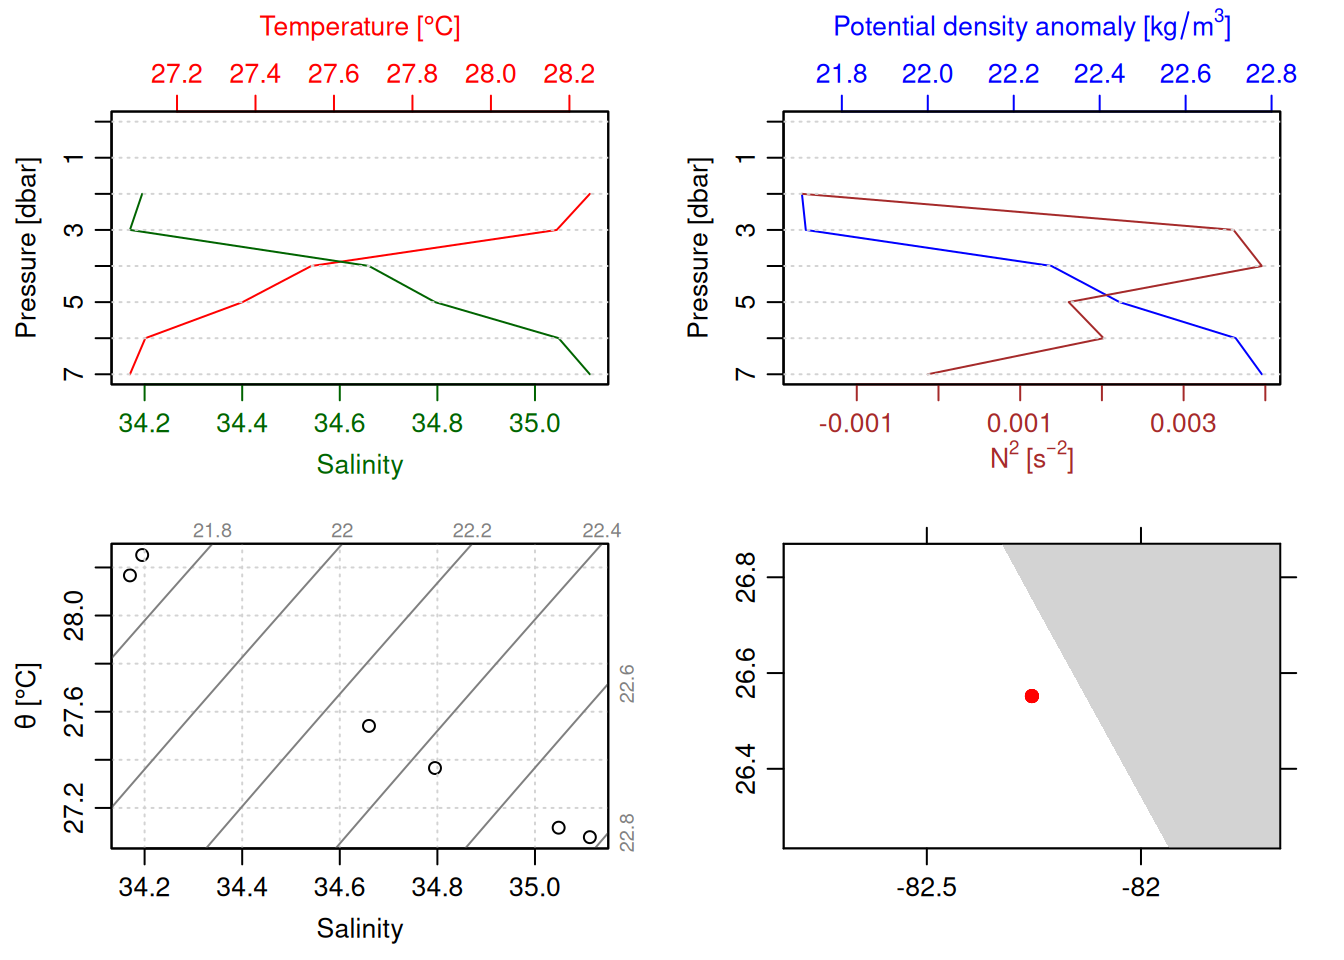
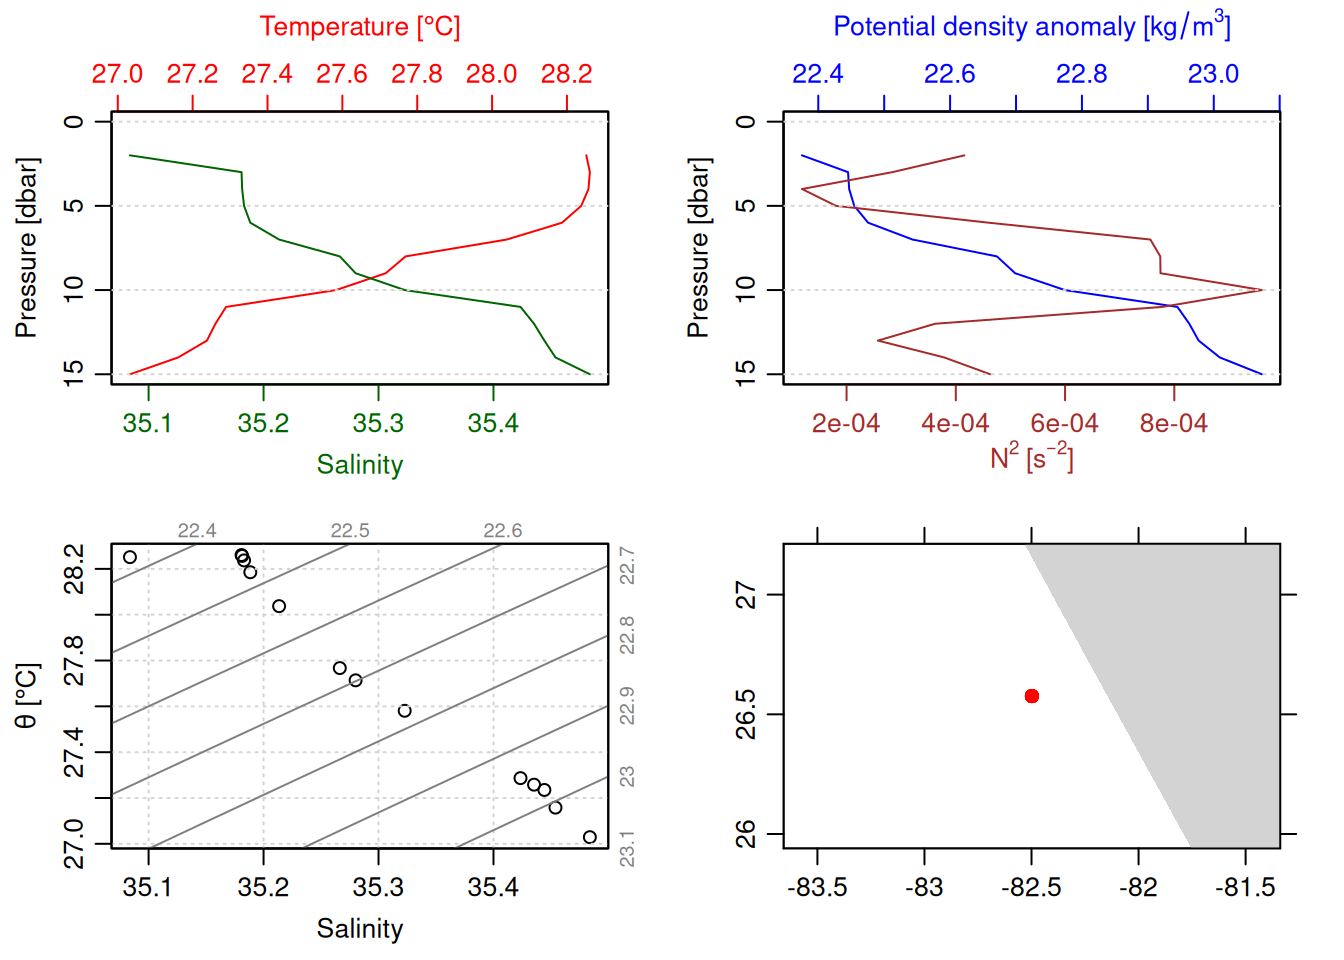
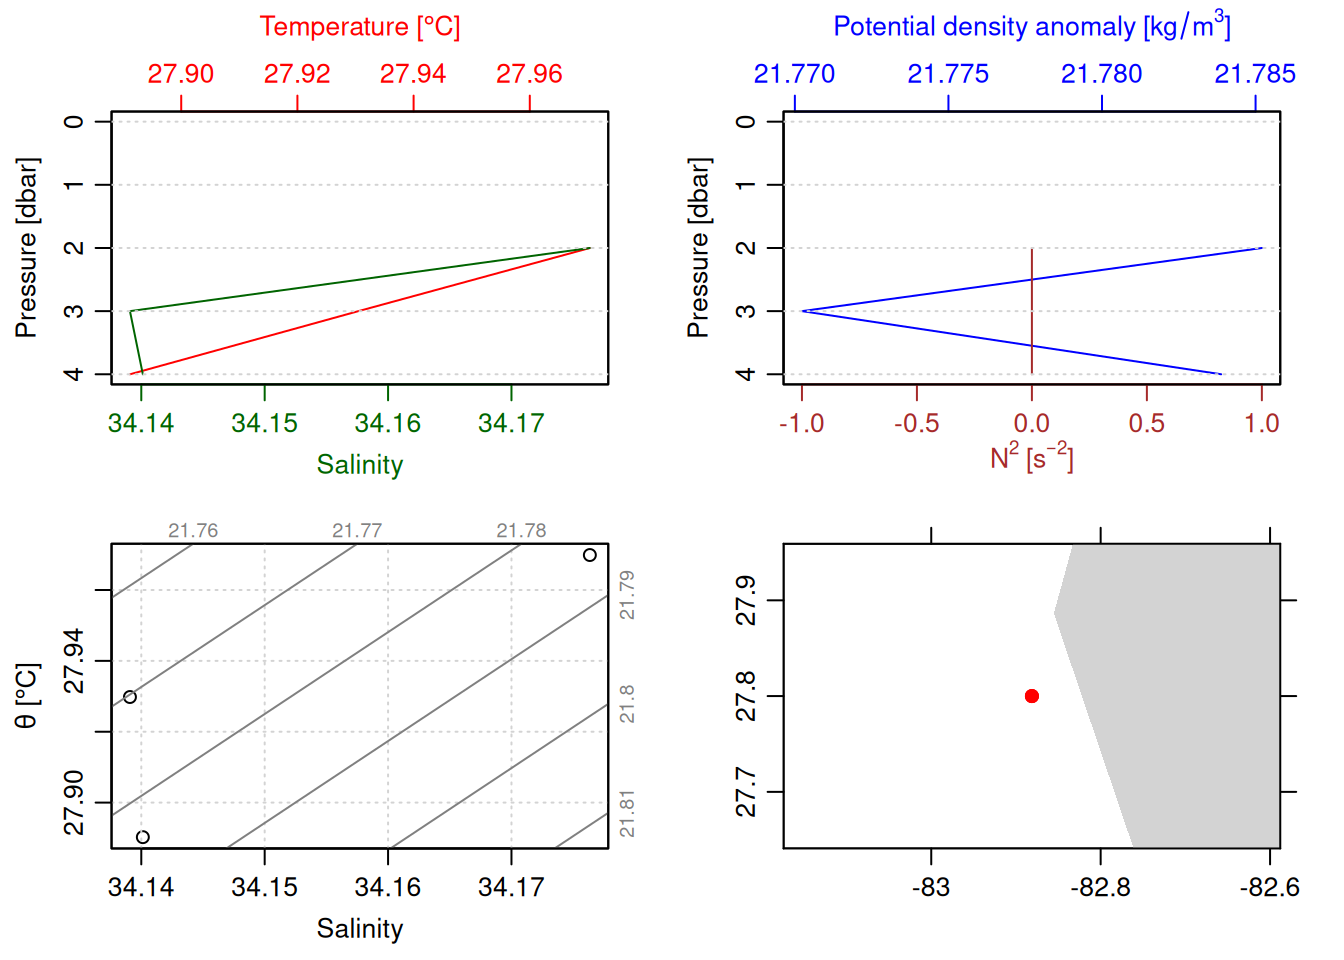
for (i inseq(ctd_FK)){ cast <- ctd_FK[[i]] # 1 is selecting only the first sublist# print(i)print(glue("=== station: {cast@metadata$station[1]}"))print(glue("# scans: {length(cast@data$scan)}"))plotScan(cast)}
=== station: 16
# scans: 21
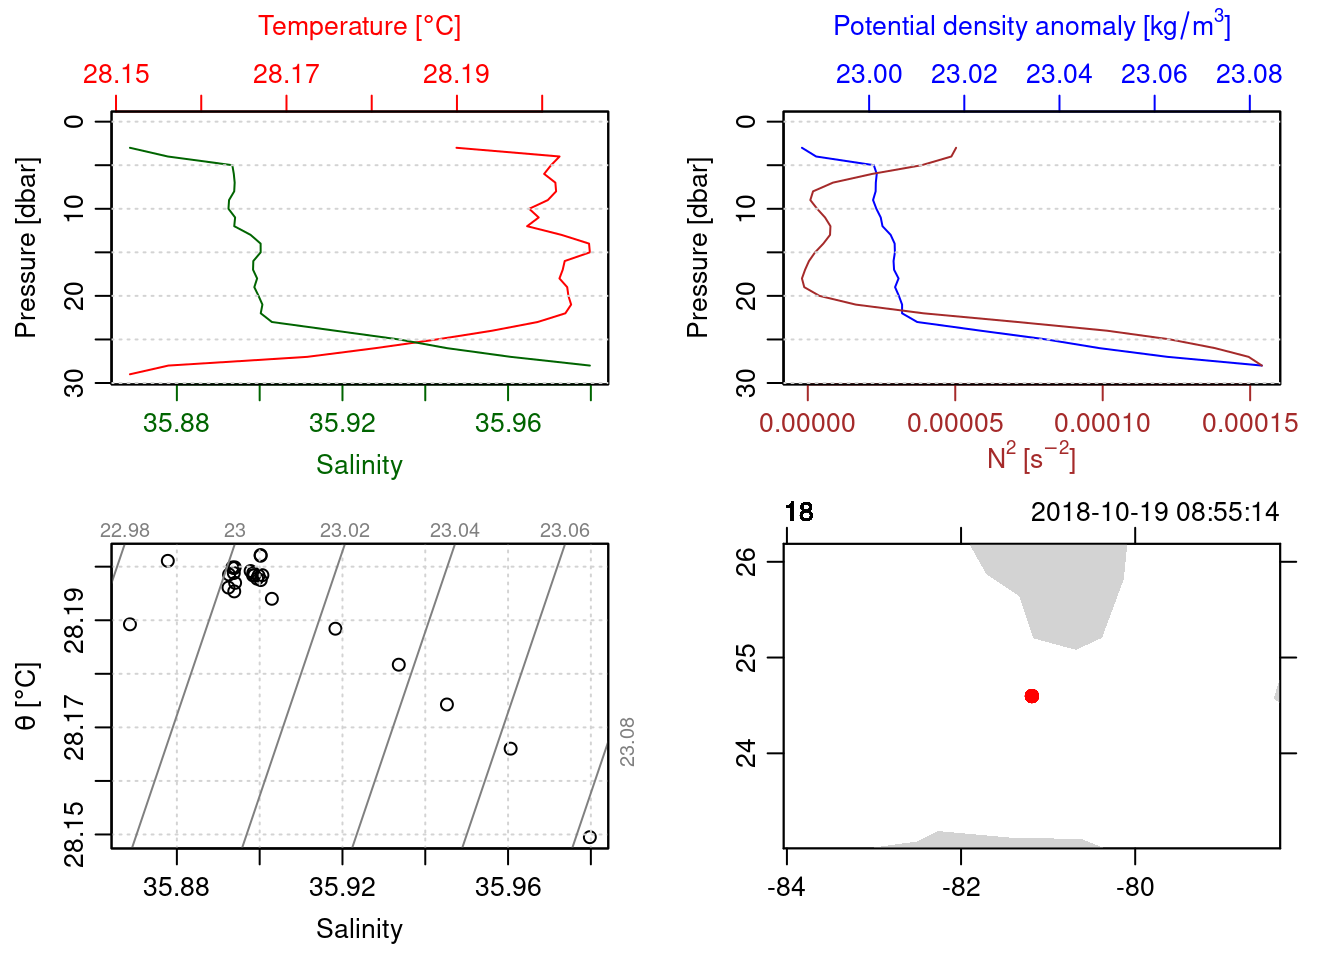
=== station: 18
# scans: 5116
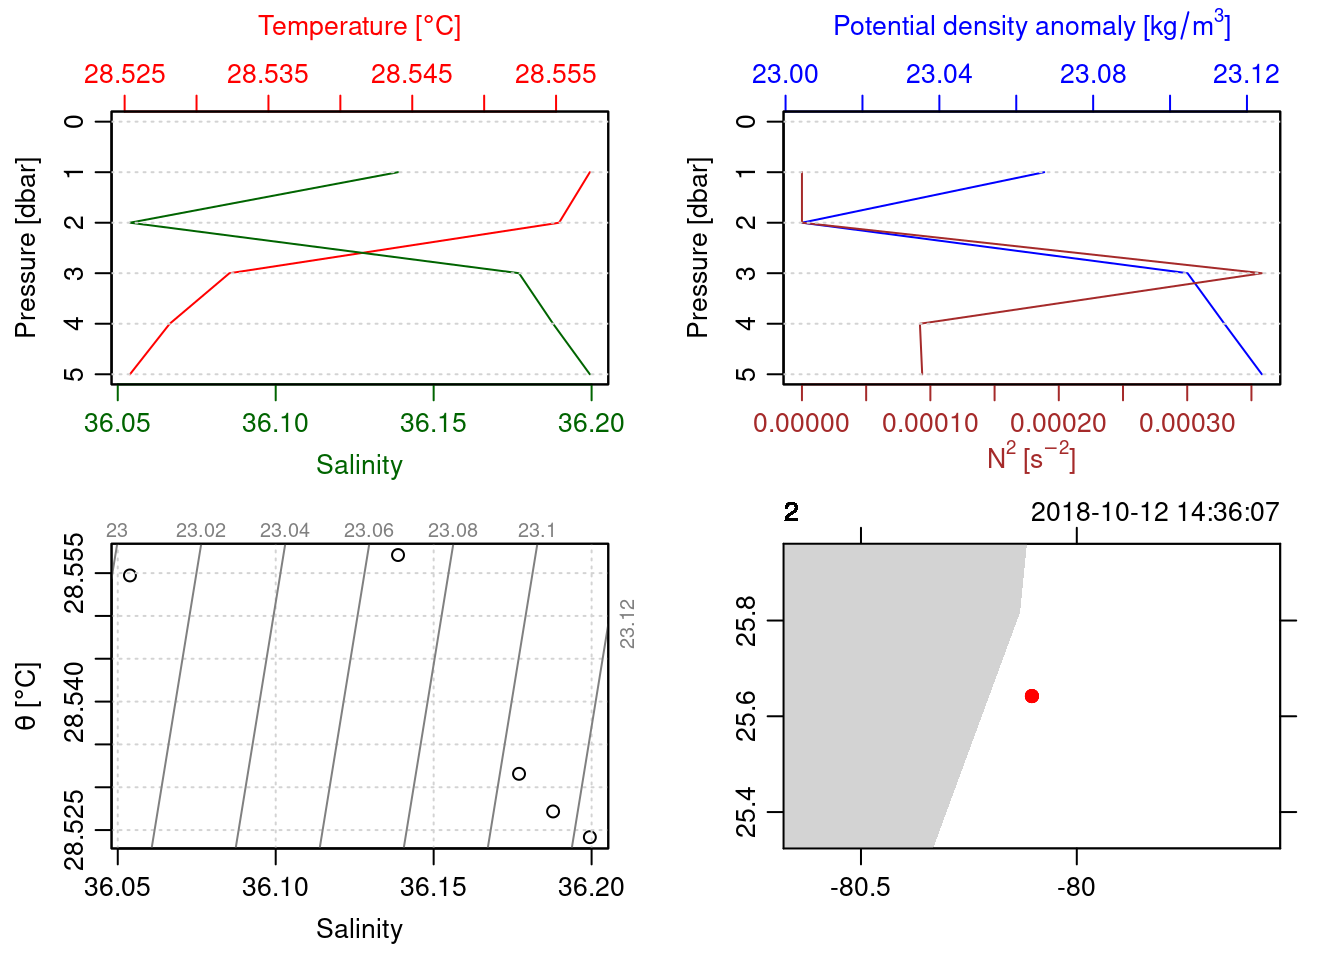
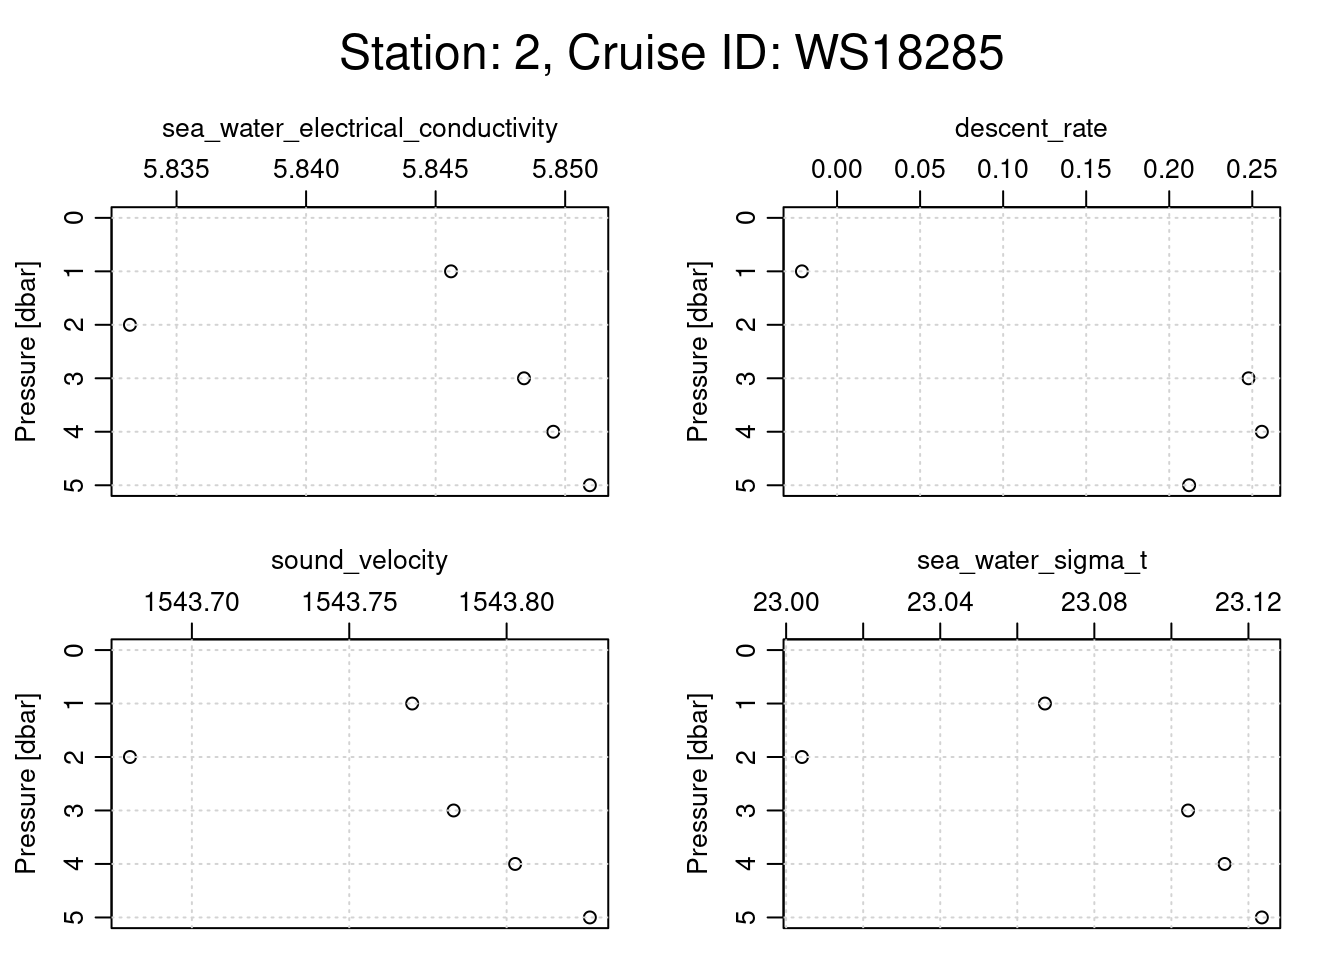
=== station: 2
# scans: 4471
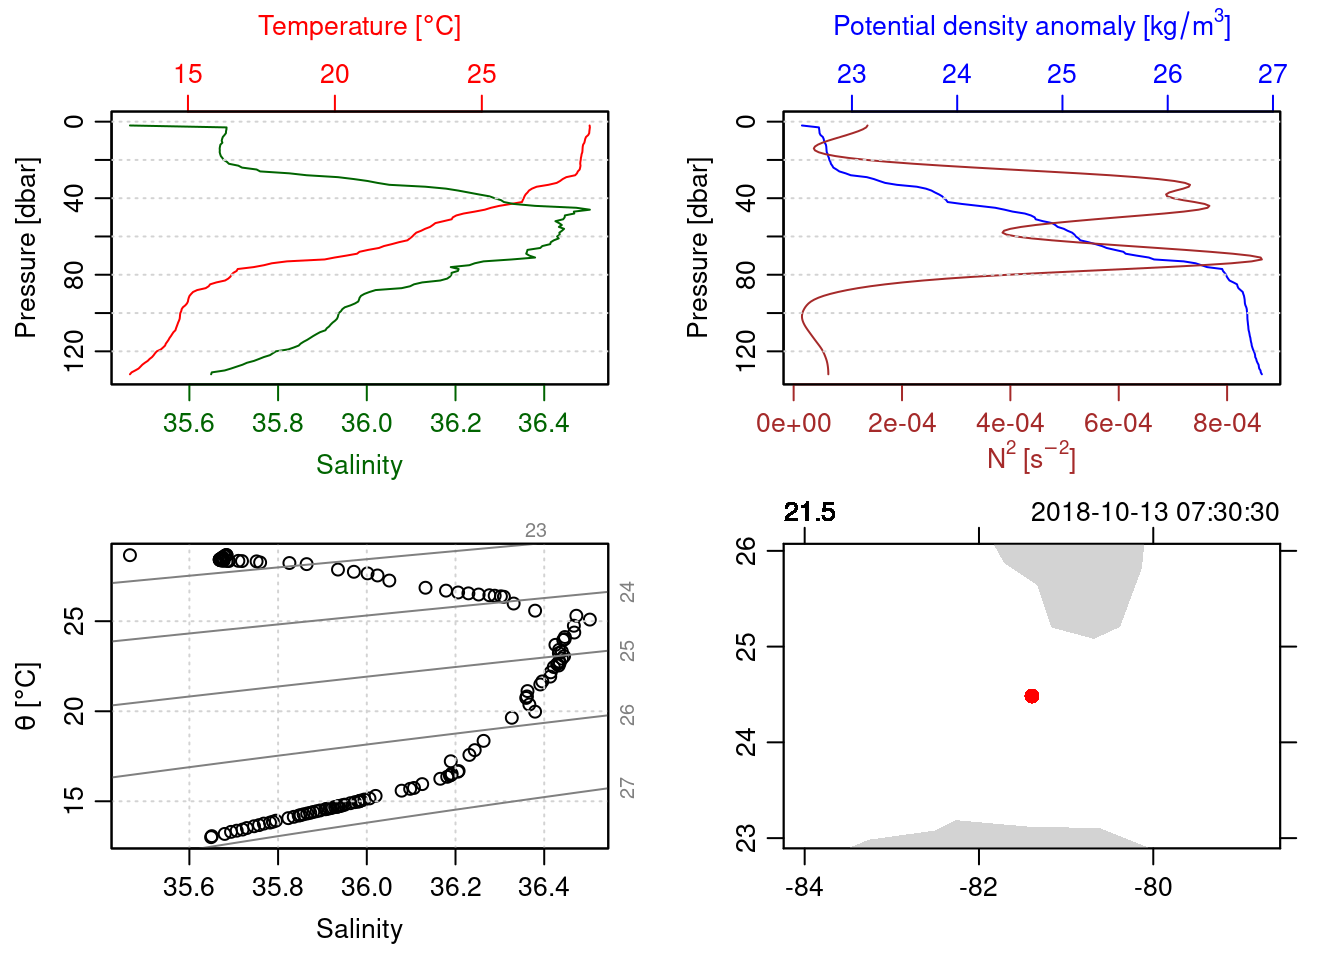
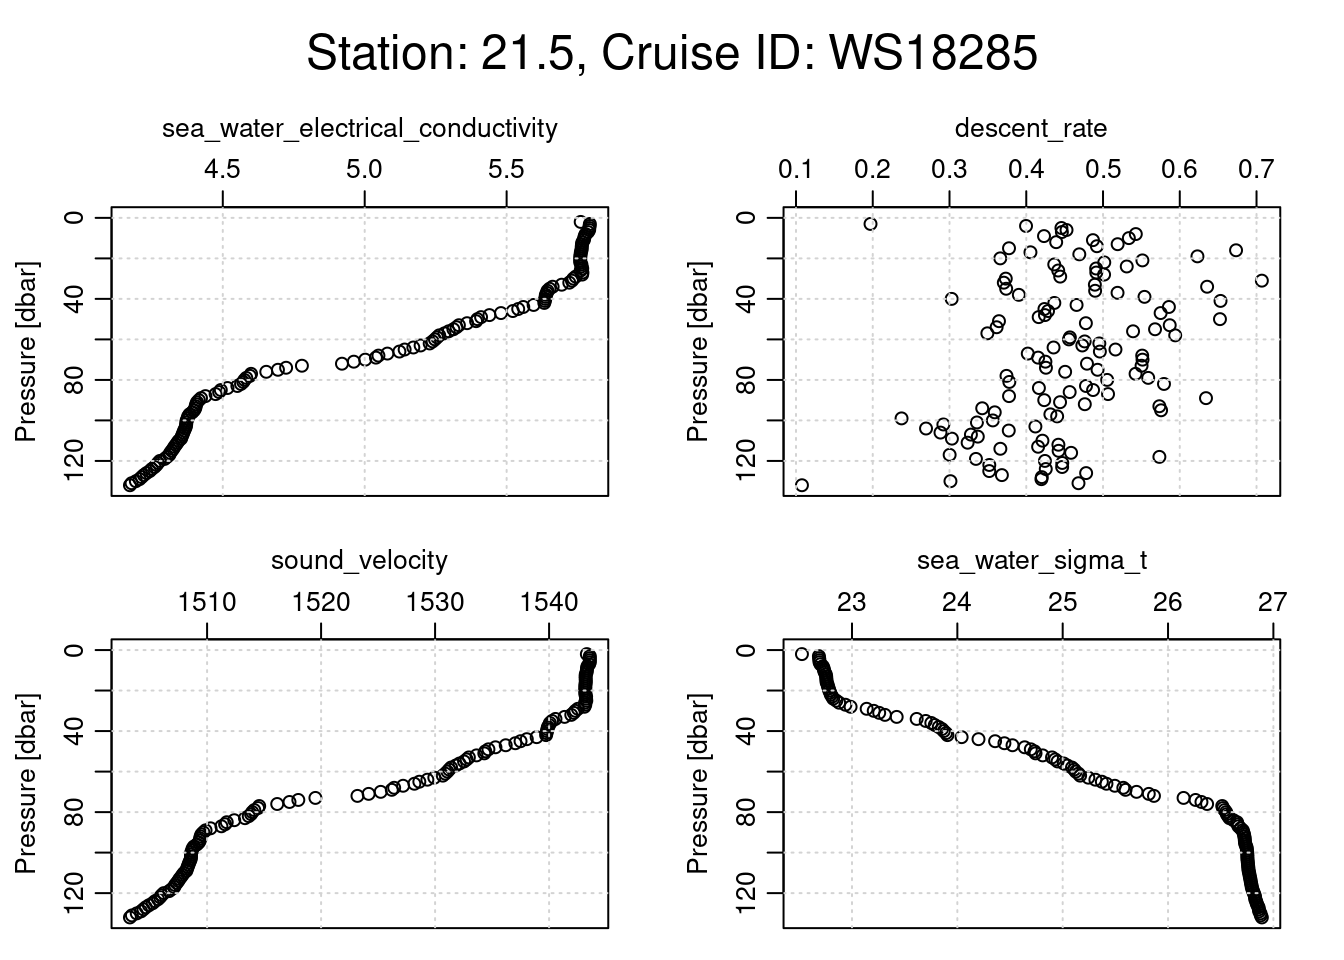
=== station: 21.5
# scans: 9558
=== station: 21.5V2
# scans: 6909
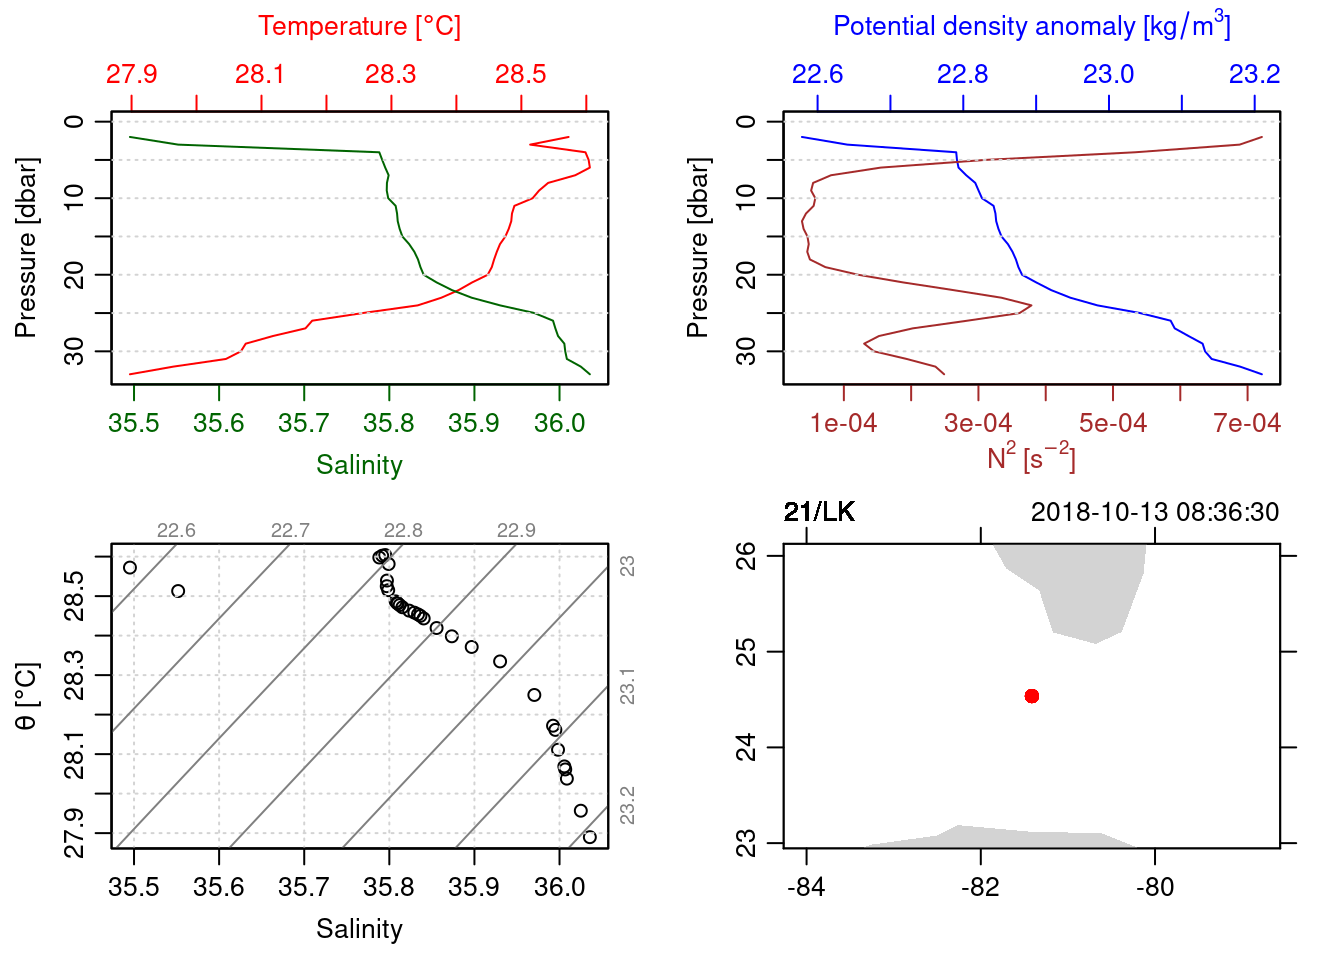
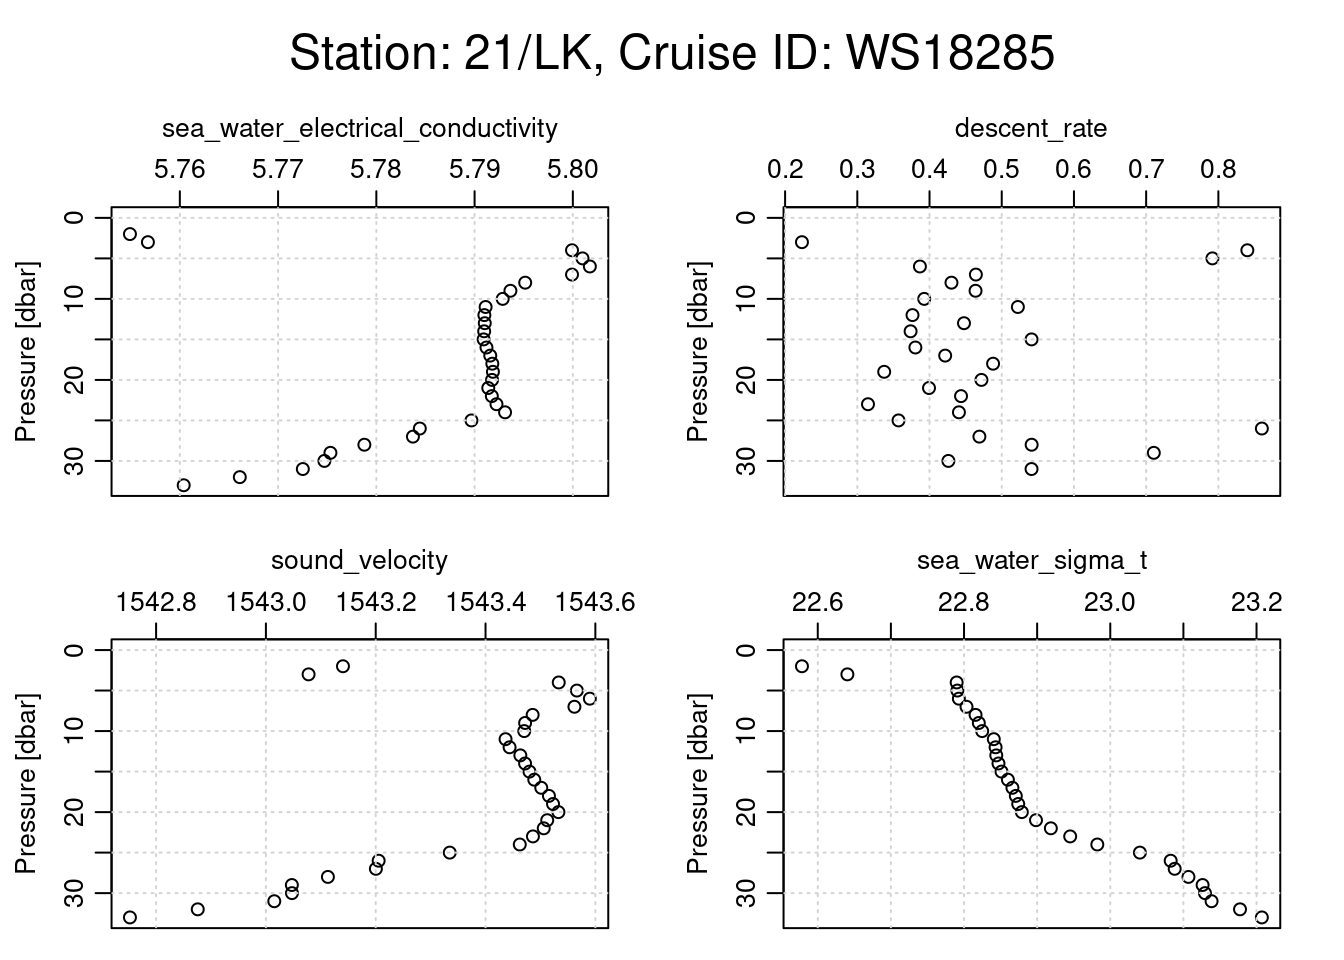
=== station: 21/LK
# scans: 3933
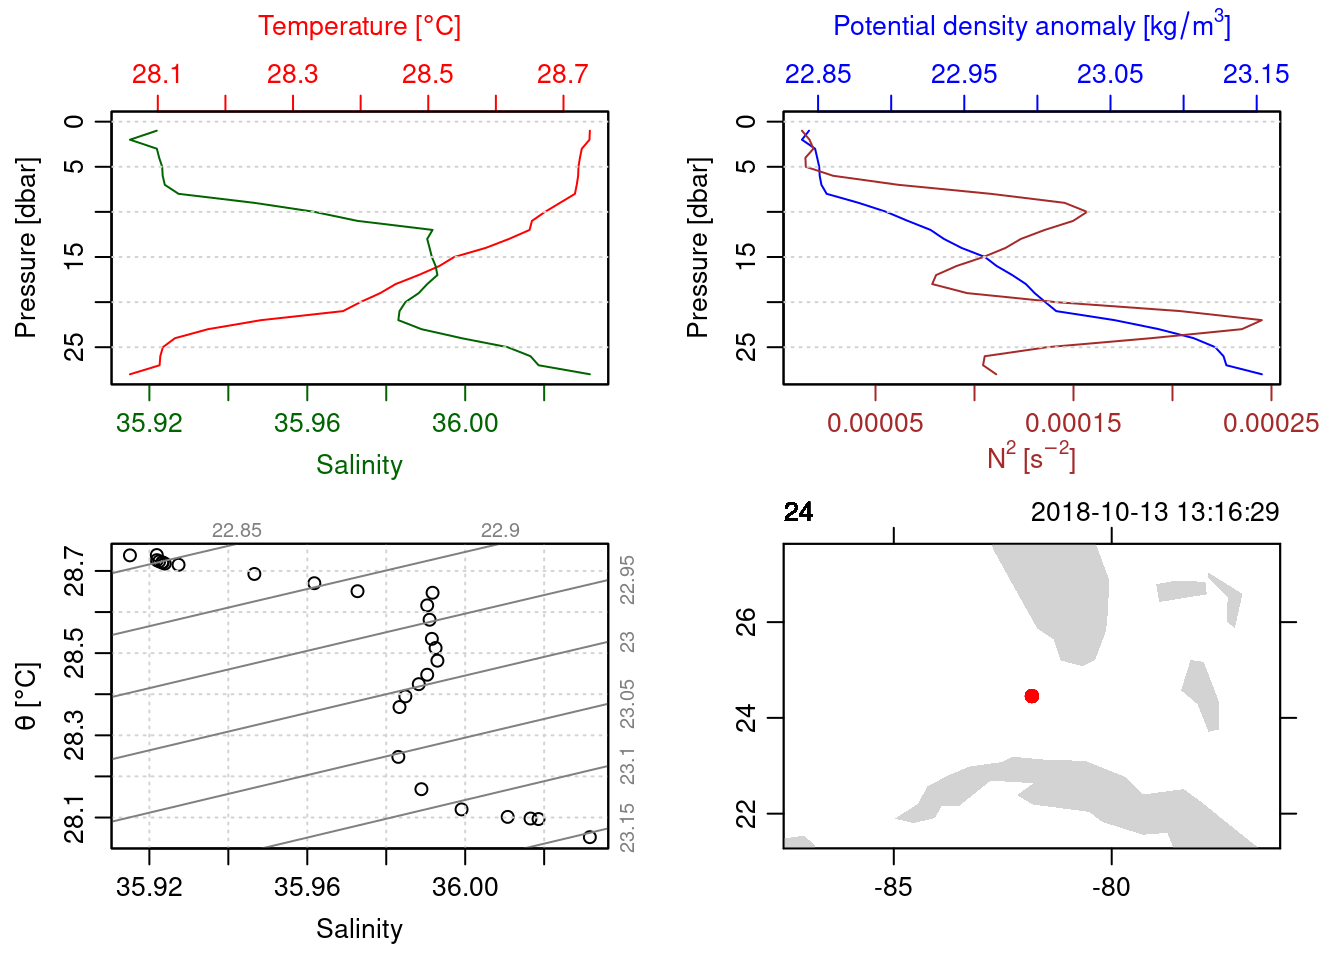
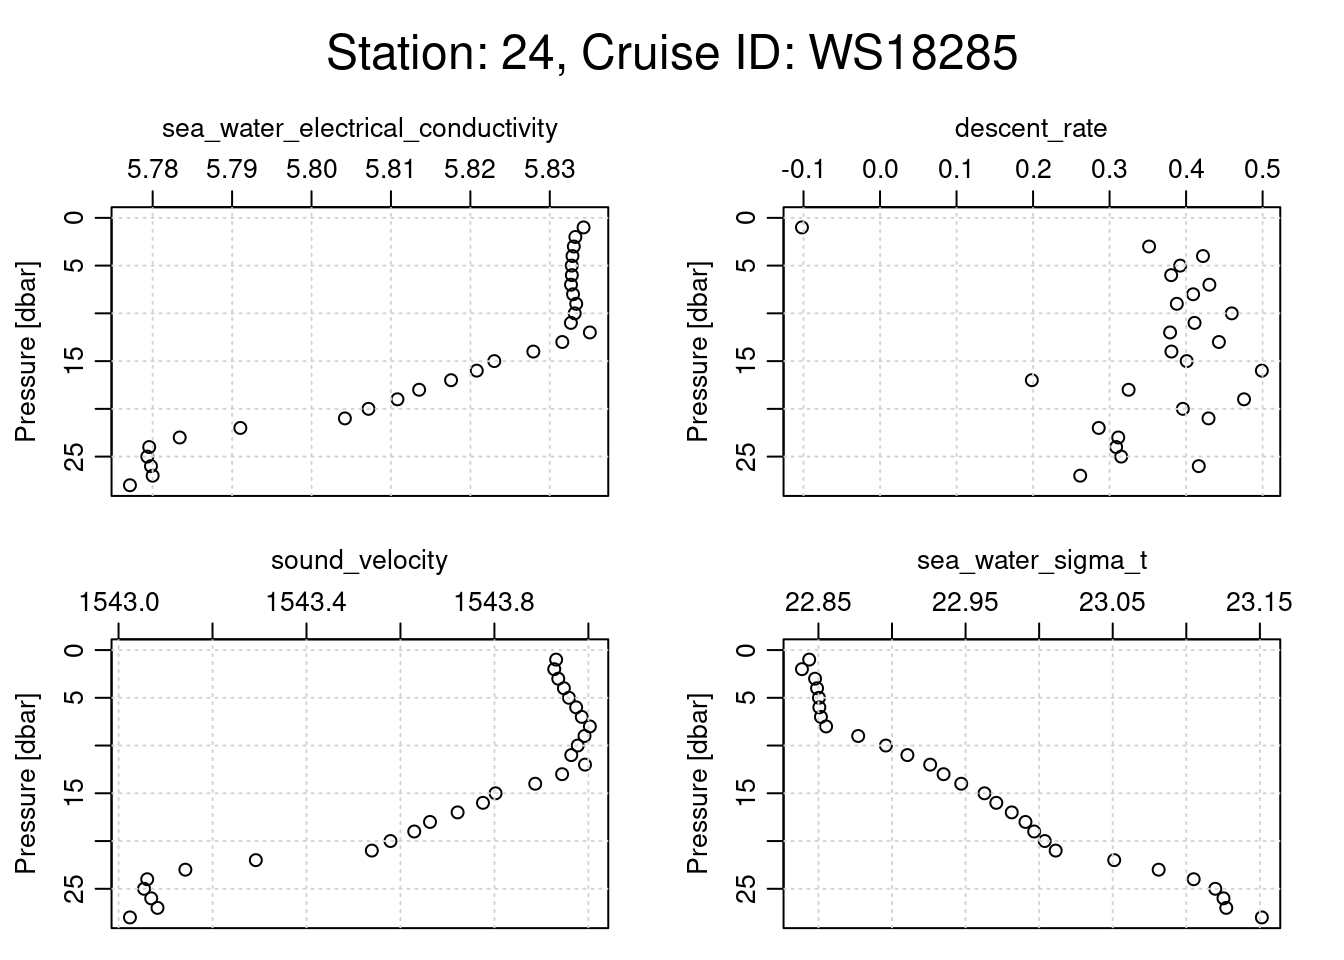
=== station: 24
# scans: 3634
=== station: 30
# scans: 4431
=== station: 31
# scans: 2399
=== station: 33
# scans: 3431
=== station: 45
# scans: 2385
=== station: 51
# scans: 1978
=== station: 54
# scans: 74
=== station: 57
# scans: 4089
=== station: 57.2
# scans: 3148
=== station: 57.3
# scans: 2605
=== station: 58
# scans: 3012
=== station: 59
# scans: 2271
=== station: 60
# scans: 1707
=== station: 68
# scans: 2
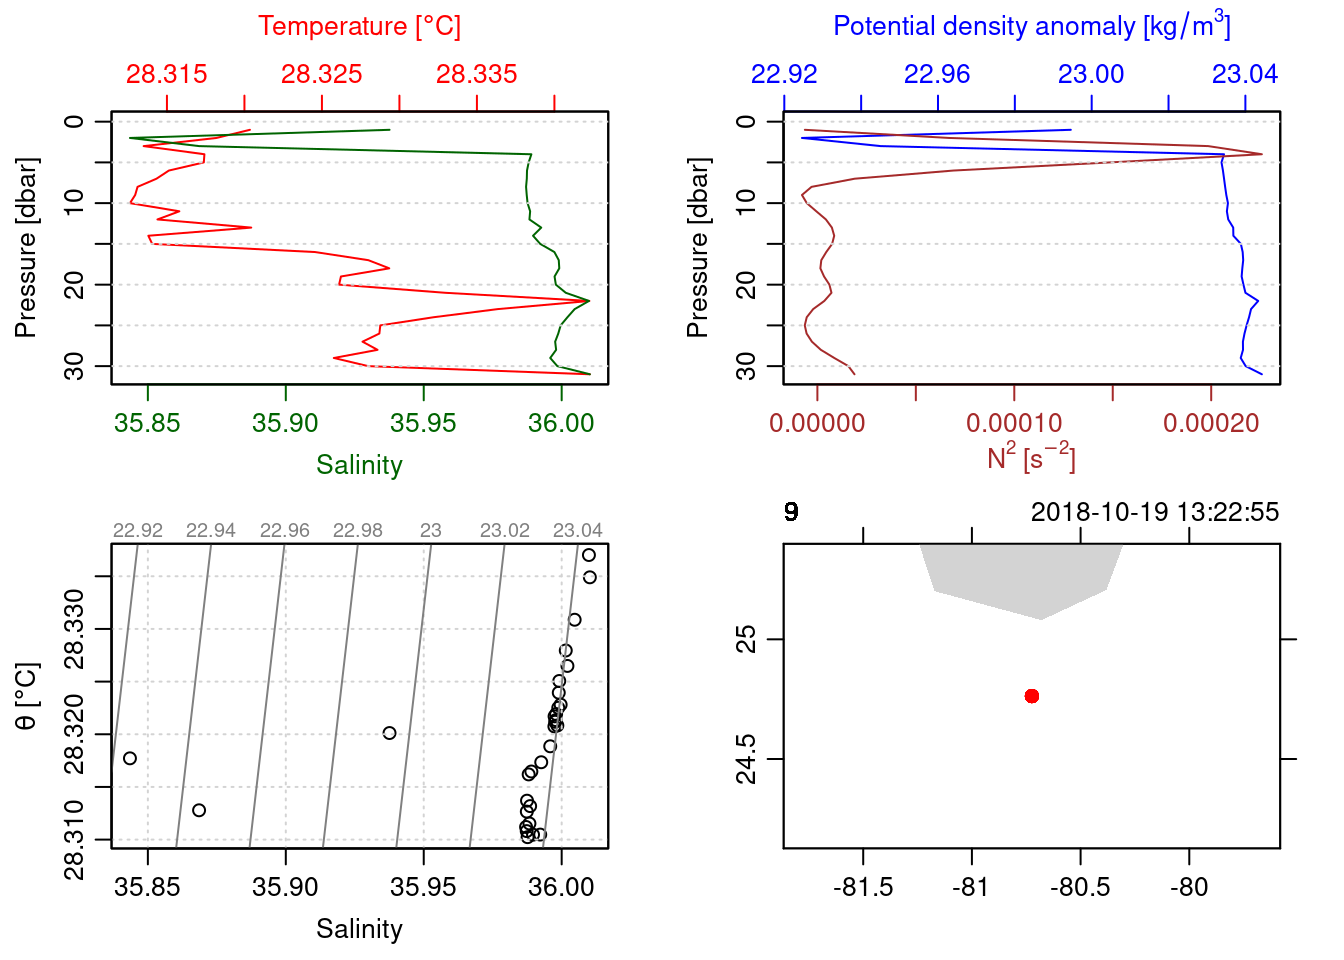
=== station: 9
# scans: 5319
=== station: CAL1
# scans: 2260
=== station: CAL2
# scans: 3972
=== station: CAL3
# scans: 3474
=== station: CAL4
# scans: 3000
=== station: CAL5
# scans: 4840
=== station: CW1
# scans: 2165
=== station: CW2
# scans: 3127
=== station: CW3
# scans: 3744
=== station: CW4
# scans: 3147
=== station: DECKTST
# scans: 49
=== station: DECKTST2
# scans: 3
=== station: GP1
# scans: 2397
=== station: GP2
# scans: 2746
=== station: GP3
# scans: 3784
=== station: GP4
# scans: 3020
=== station: GP5
# scans: 6003
=== station: JUNKPILE
# scans: 2137
=== station: KW1
# scans: 2914
=== station: KW2
# scans: 2863
=== station: KW4
# scans: 4403
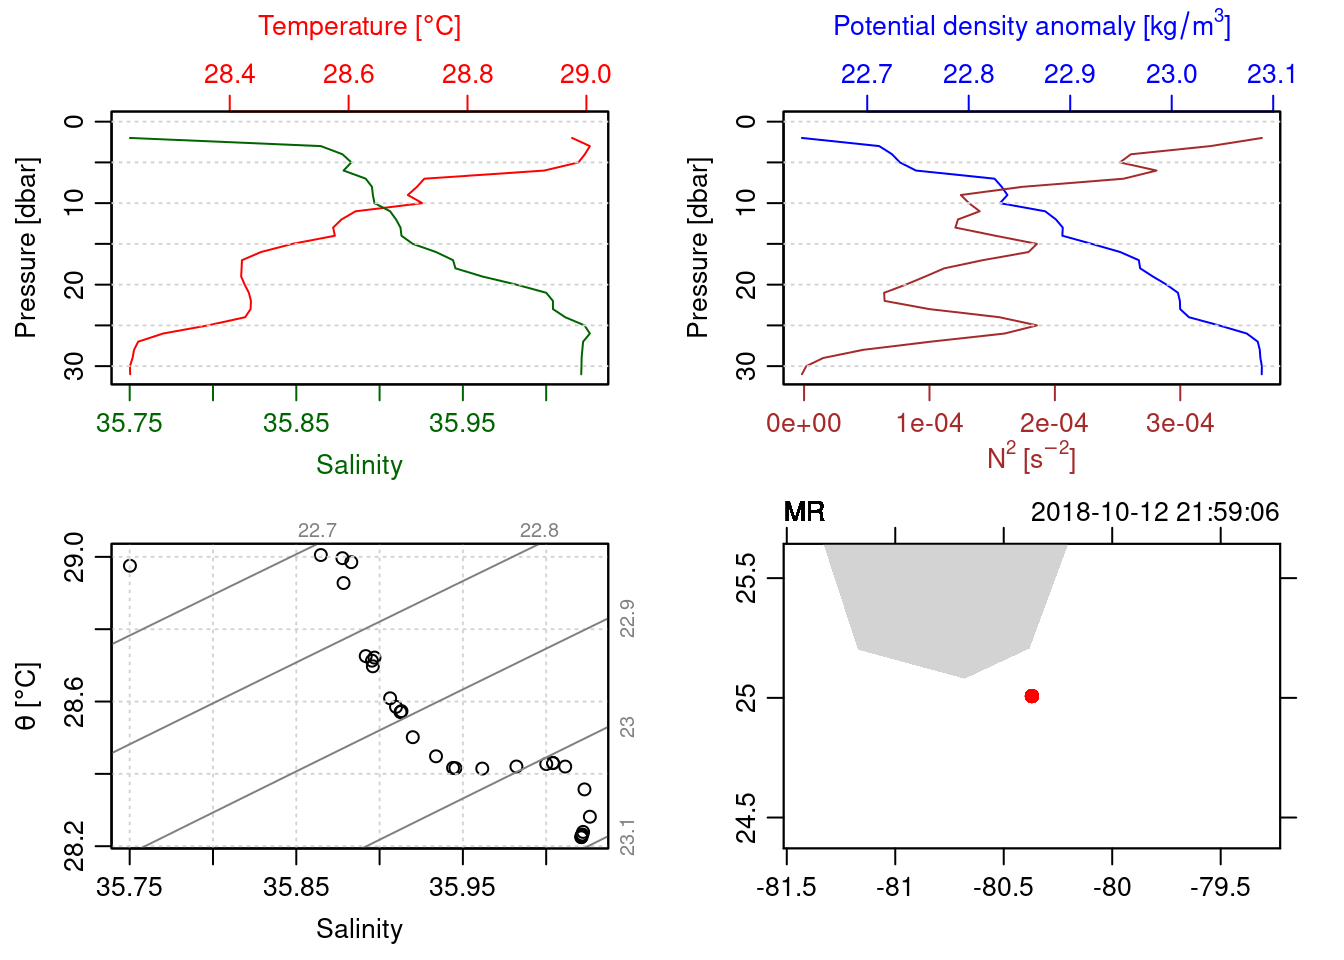
=== station: MR
# scans: 5390
=== station: REAL24
# scans: 3449
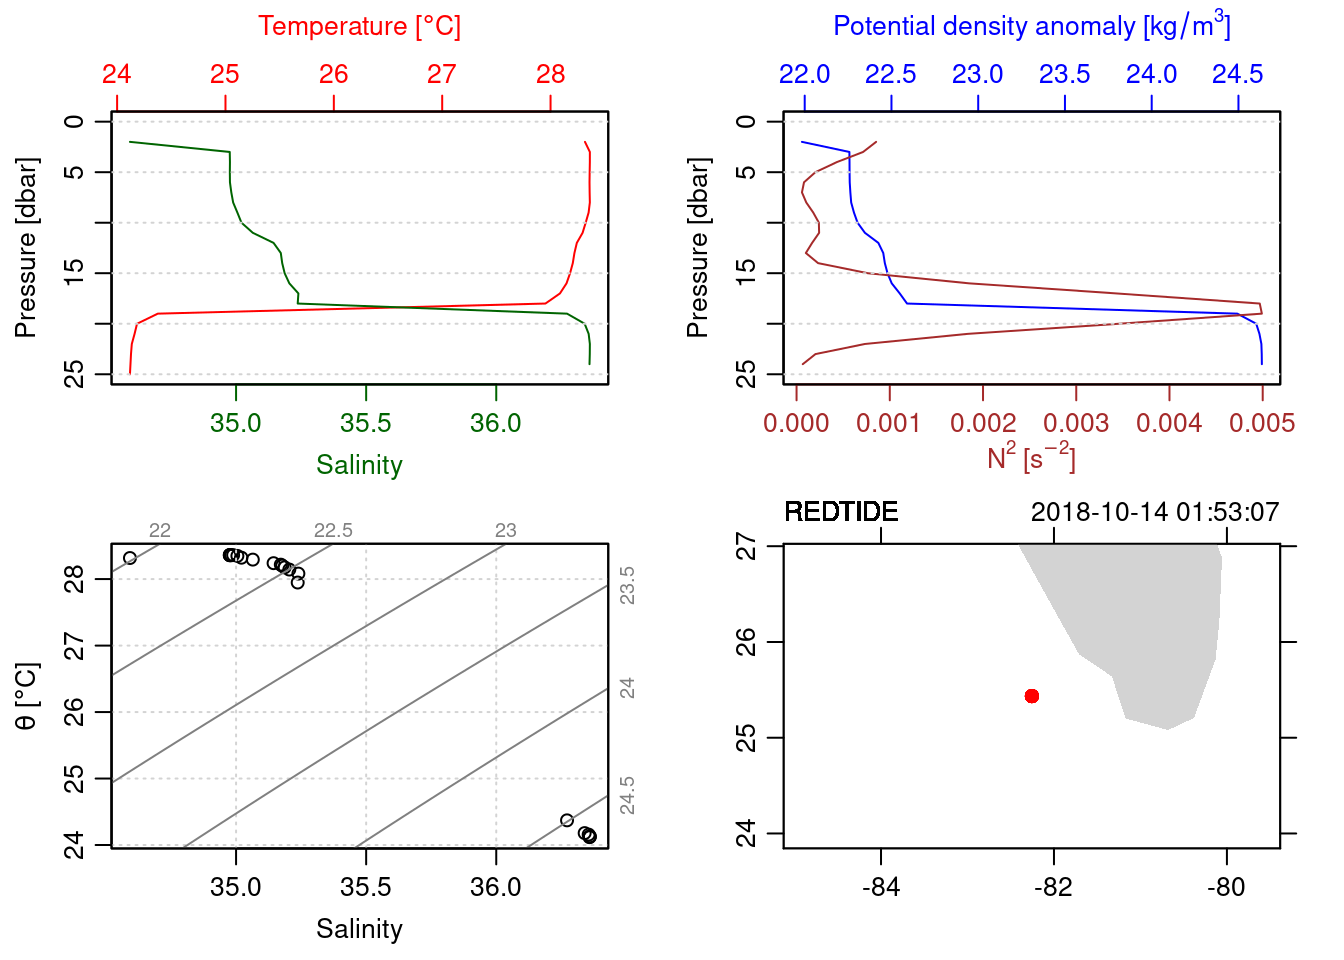
=== station: REDTIDE
# scans: 5113
=== station: RP1
# scans: 4046
=== station: RP2
# scans: 3482
=== station: RP3
# scans: 3283
=== station: RP4
# scans: 3238
=== station: TB1
# scans: 3721
=== station: TB2
# scans: 2970
=== station: TB3
# scans: 4057
=== station: TB4
# scans: 4678
=== station: TB5
# scans: 5853
=== station: TB6
# scans: 1405
=== station: TB7
# scans: 3105
=== station: TB8
# scans: 2513
=== station: TB9
# scans: 4441
=== station: WS
# scans: 2743
=== station: Z03_027
# scans: 3050
=== station: Z03_076
# scans: 3415
=== station: Z03_116
# scans: 4962
=== station: Z03_146
# scans: 4495
=== station: Z03_198
# scans: 2757
=== station: Z04_067
# scans: 6554
=== station: Z04_068
# scans: 3417
=== station: Z04_093
# scans: 2325
=== station: Z04_099
# scans: 4617
=== station: Z04_110
# scans: 2991
=== station: Z04_610
# scans: 3186
plotting each cast in the first list
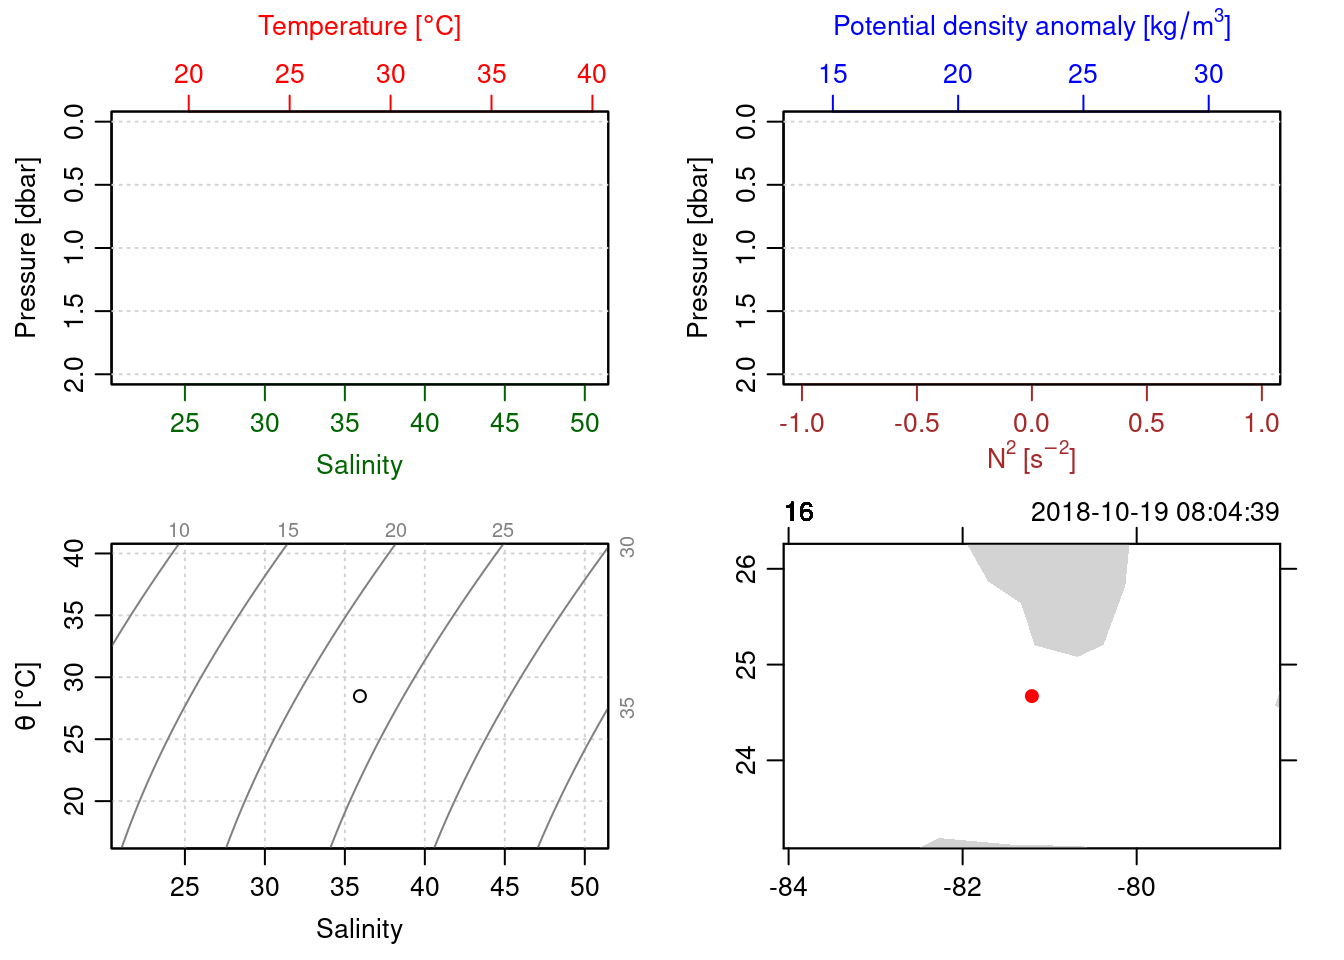
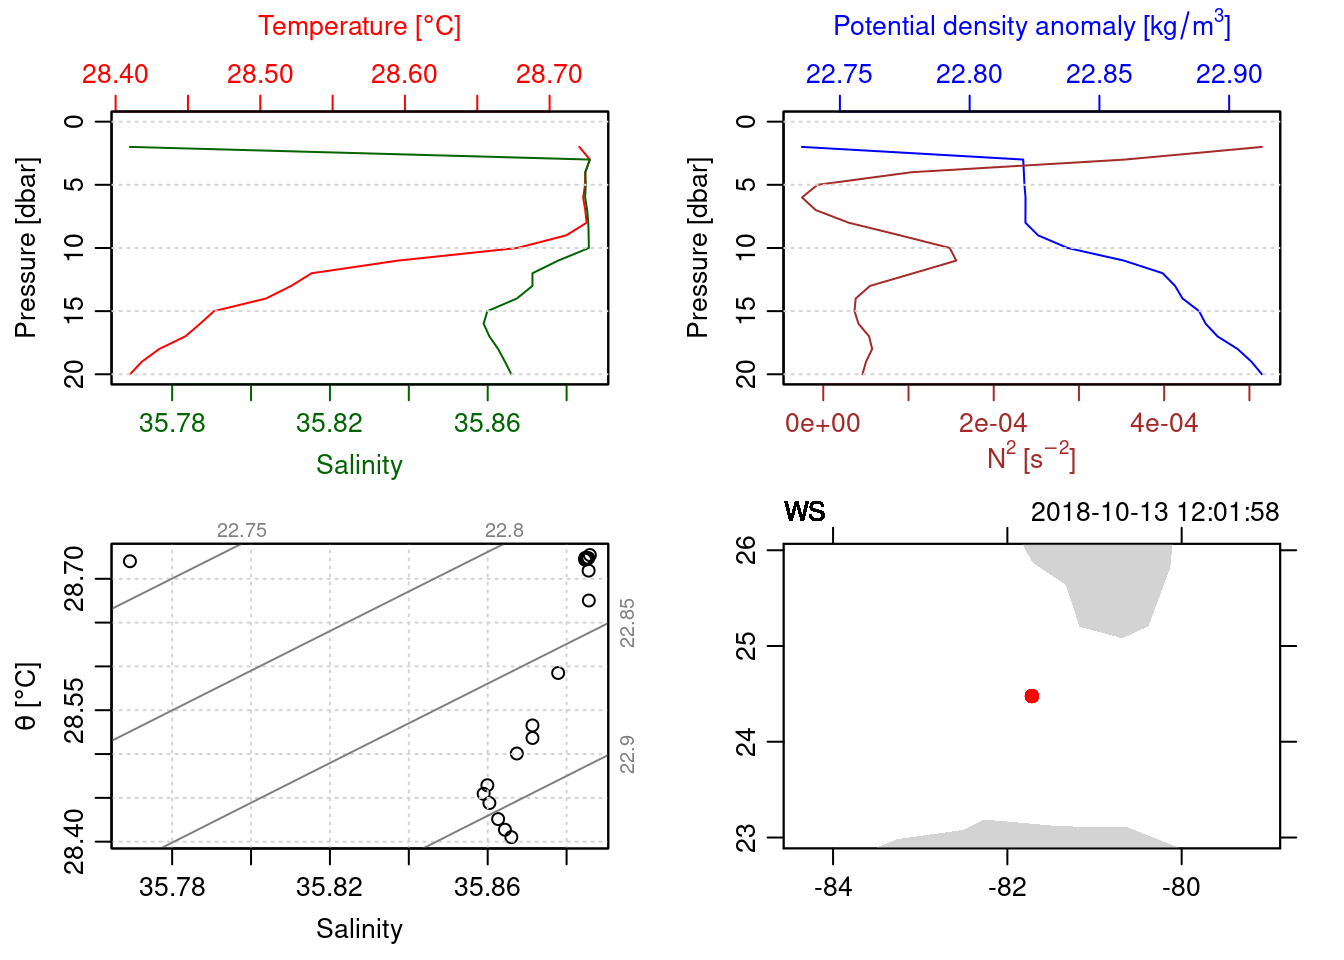
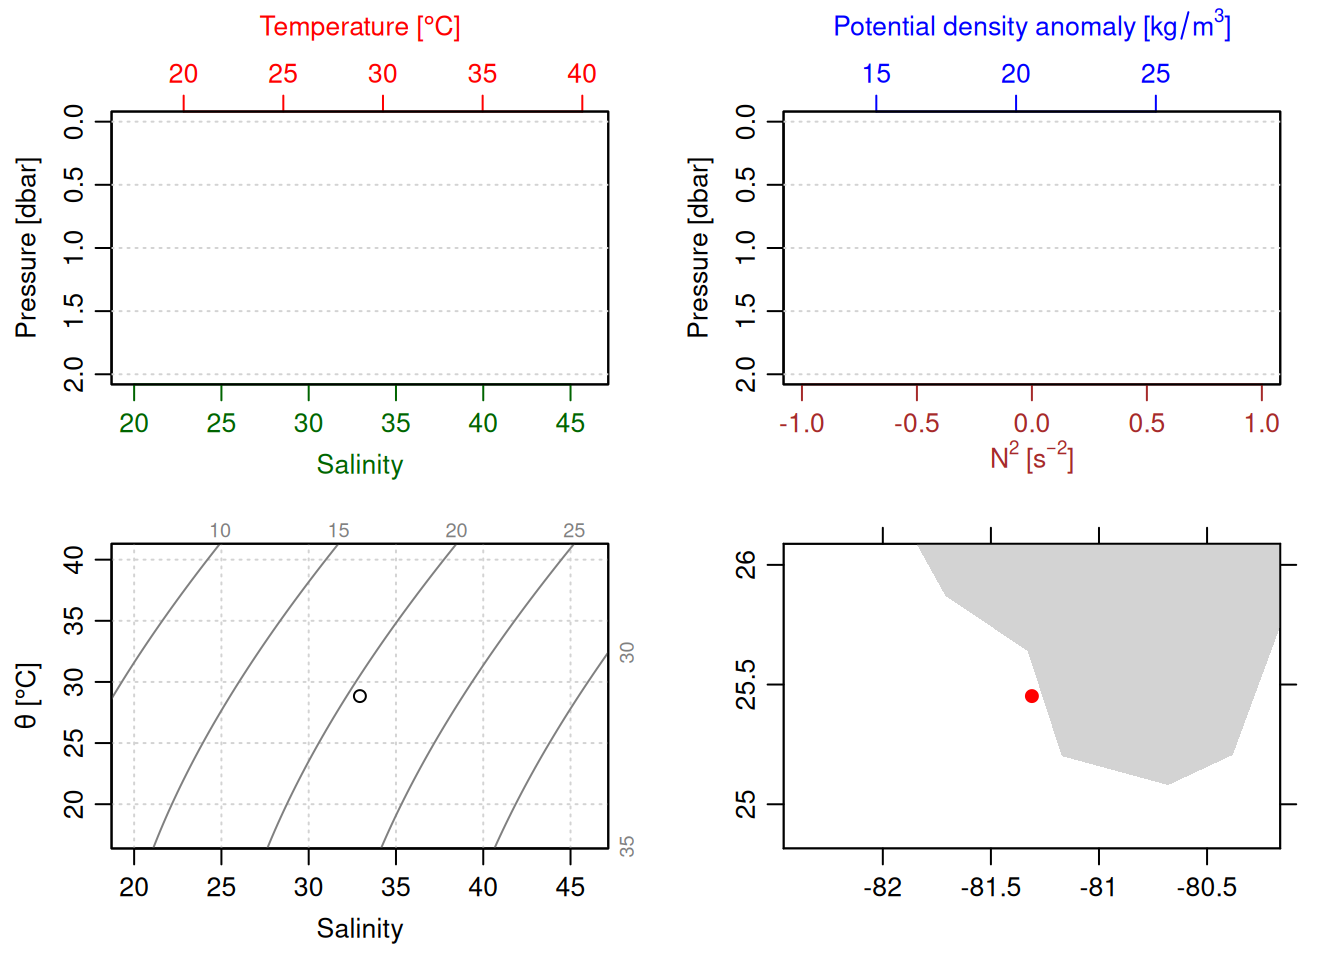
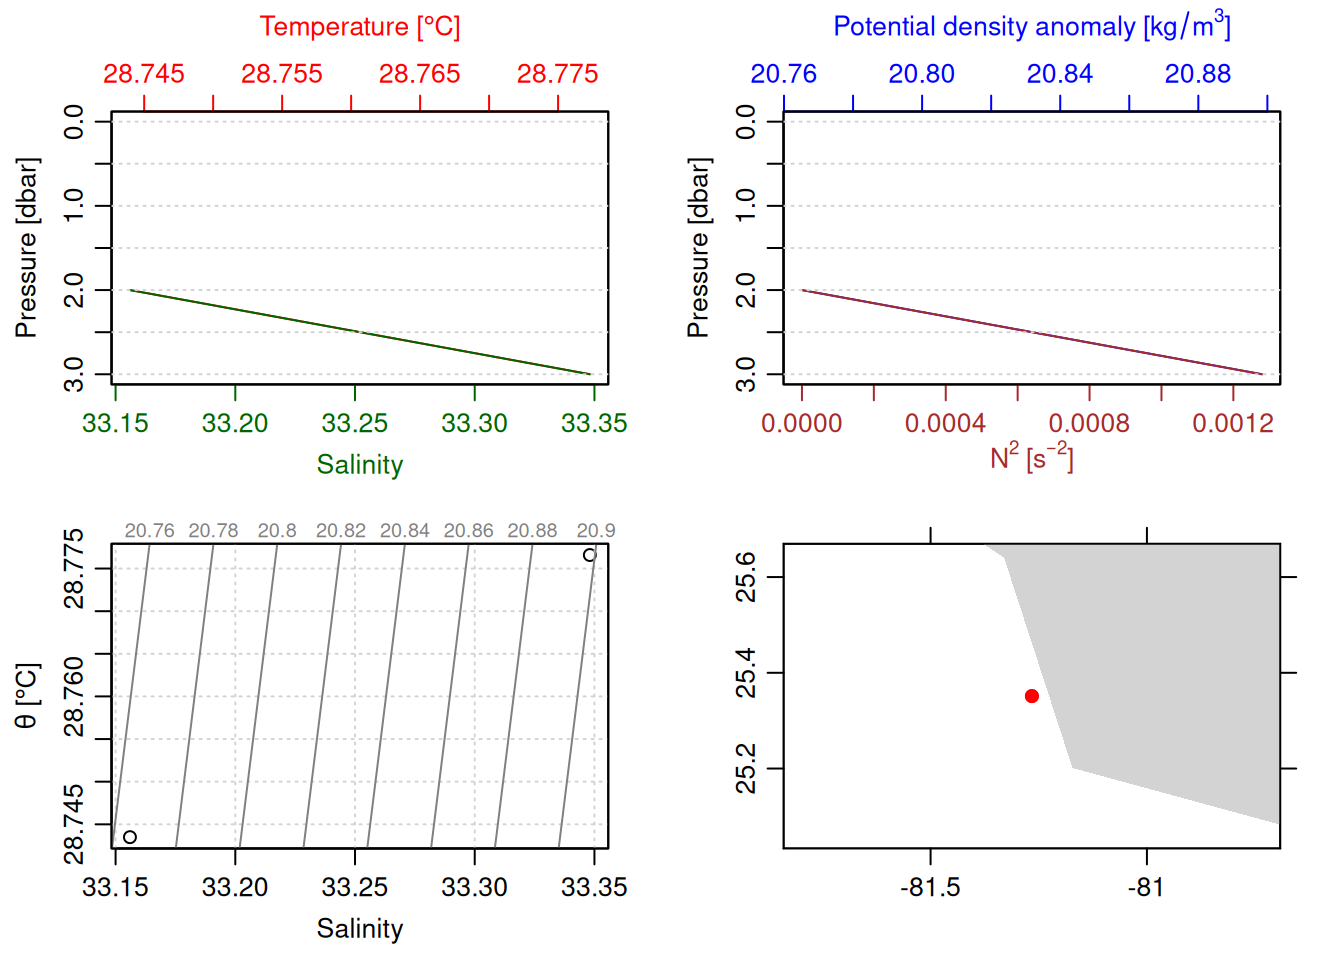
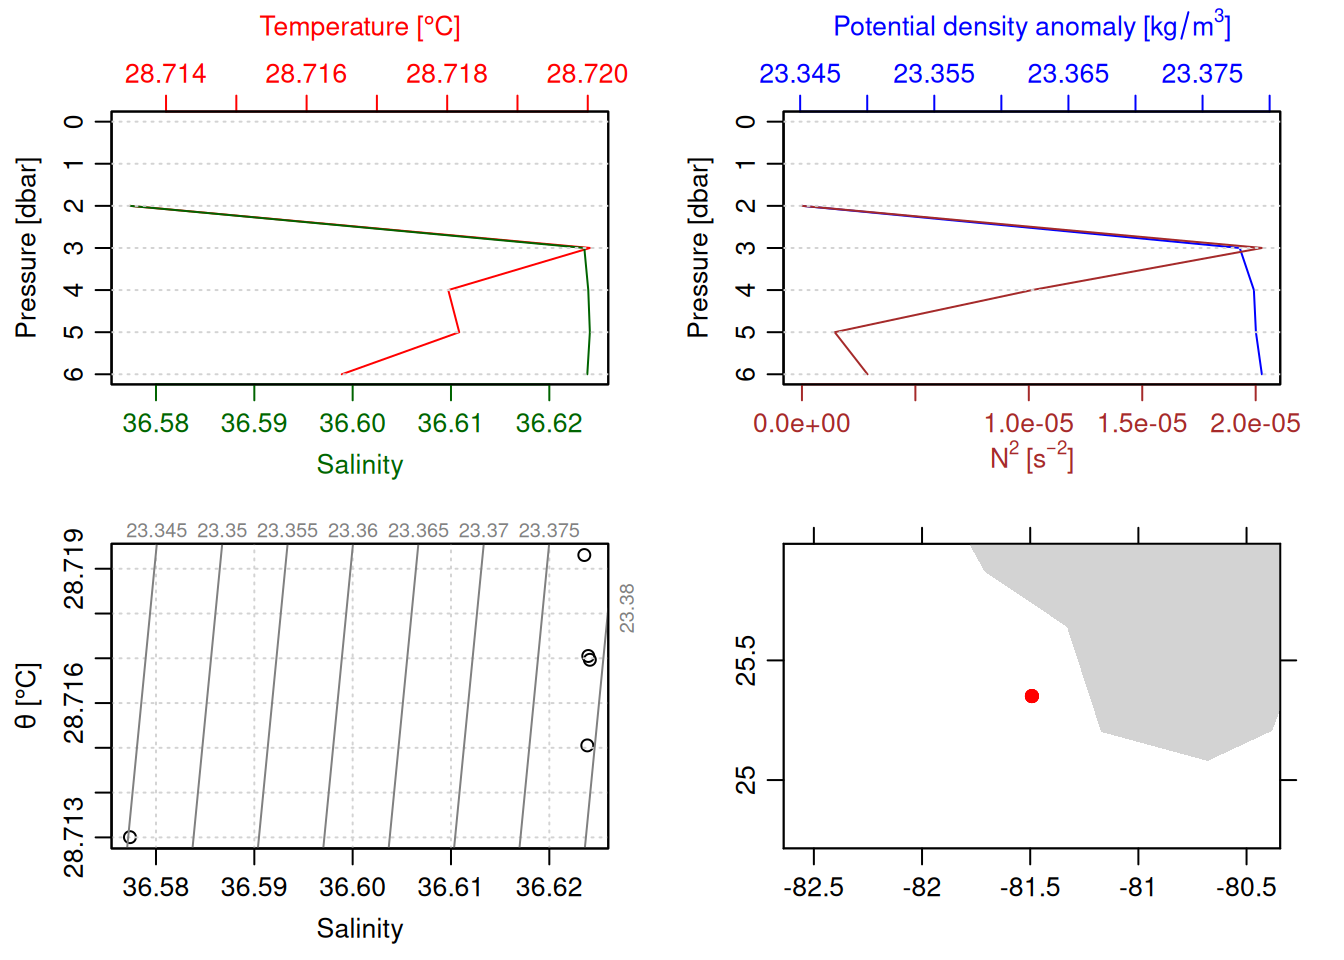
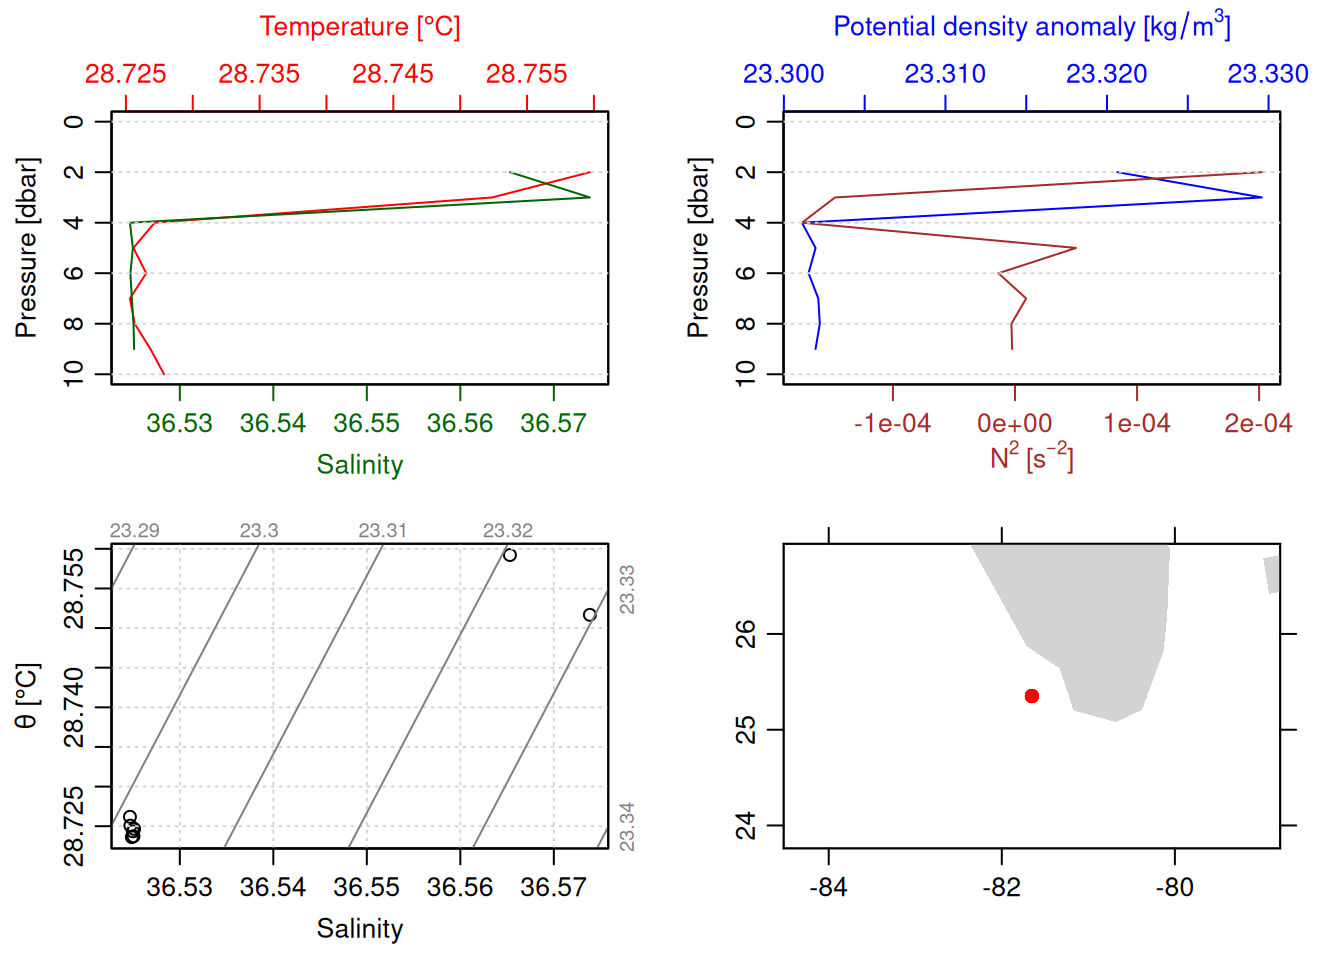
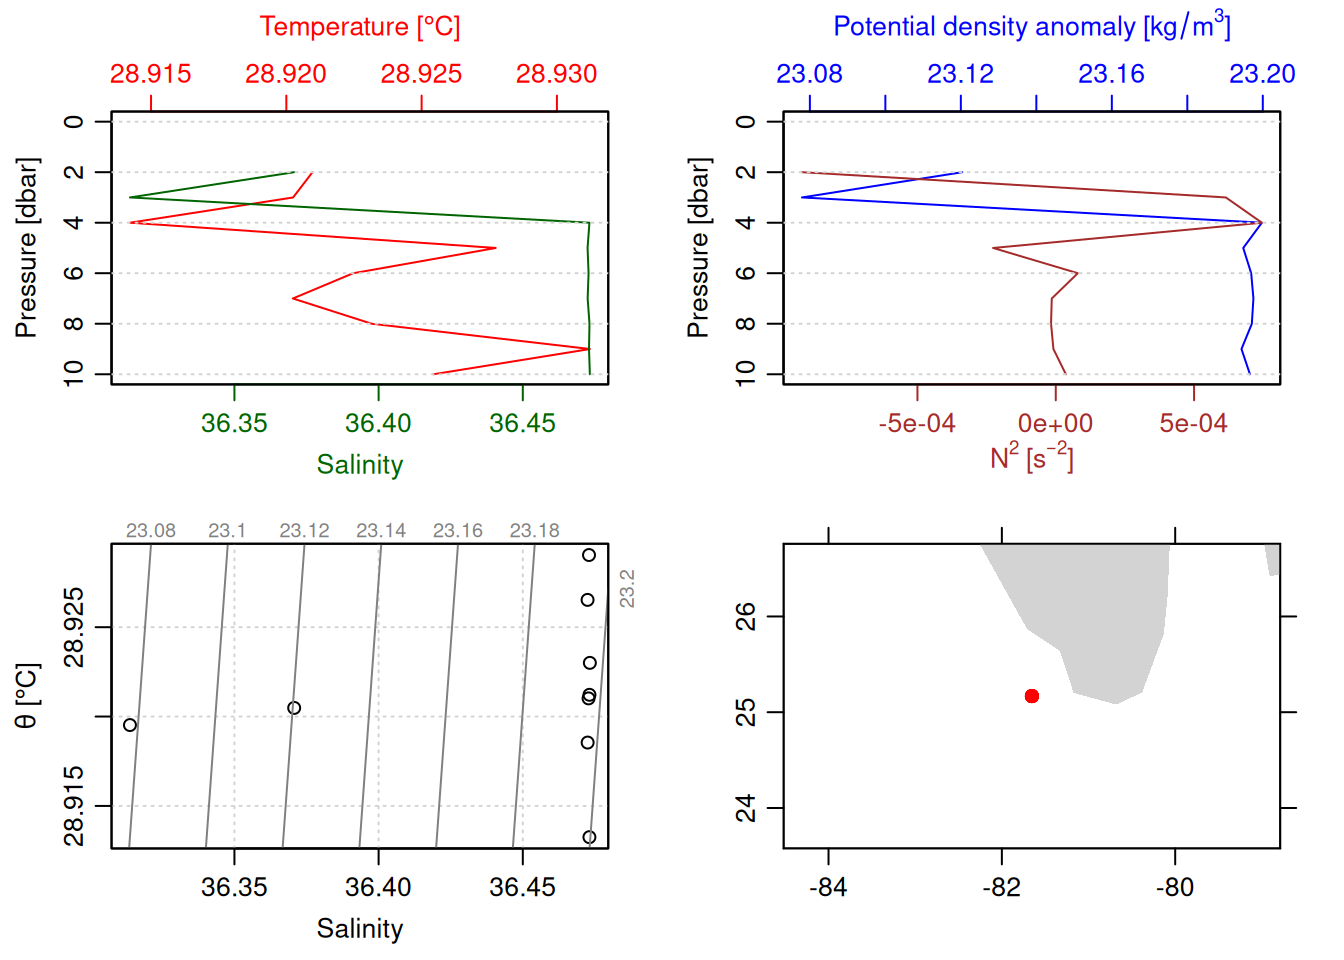
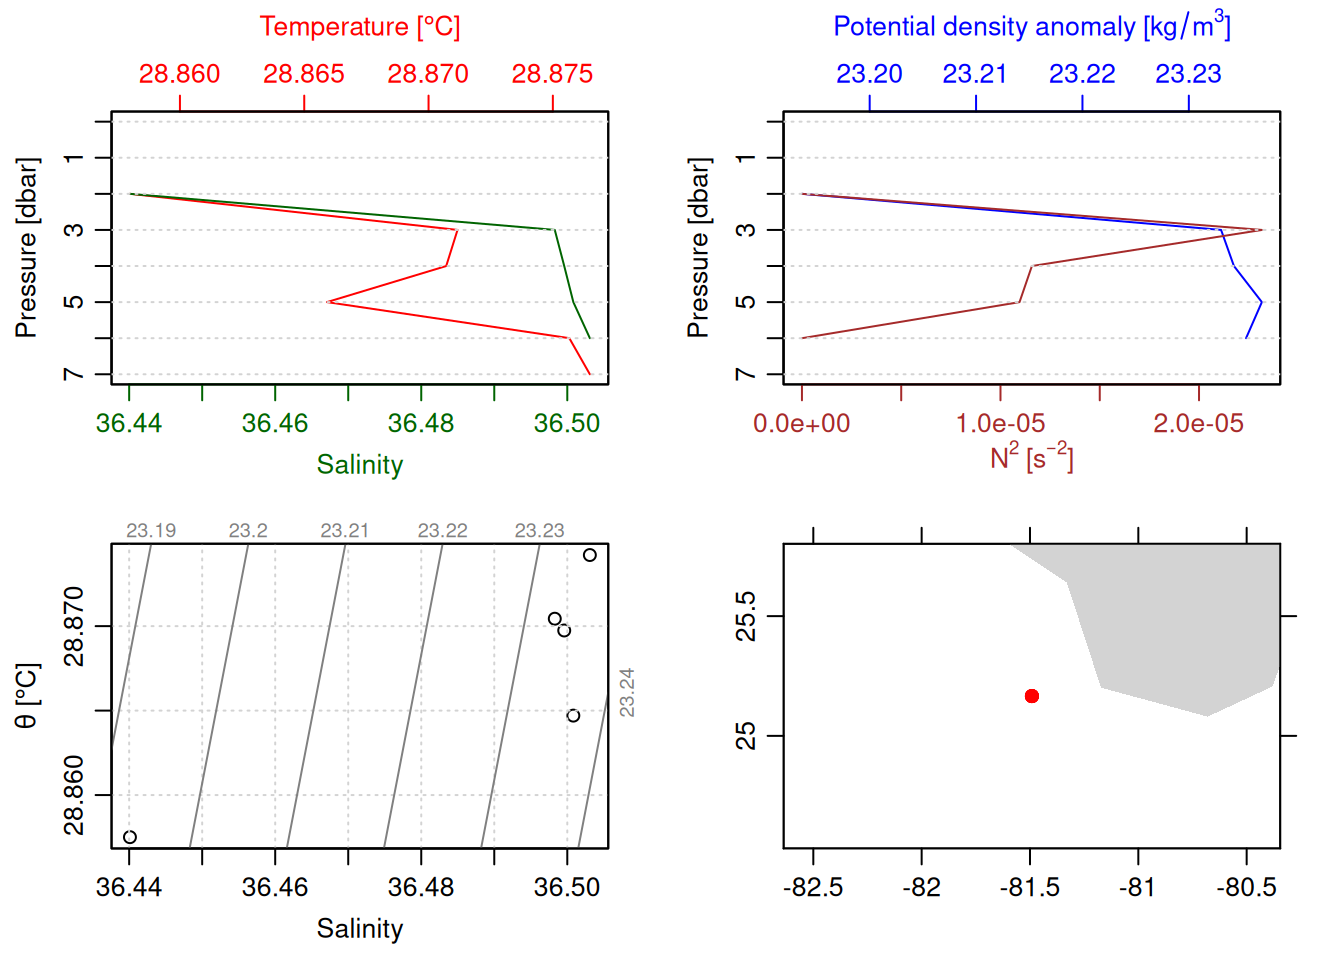
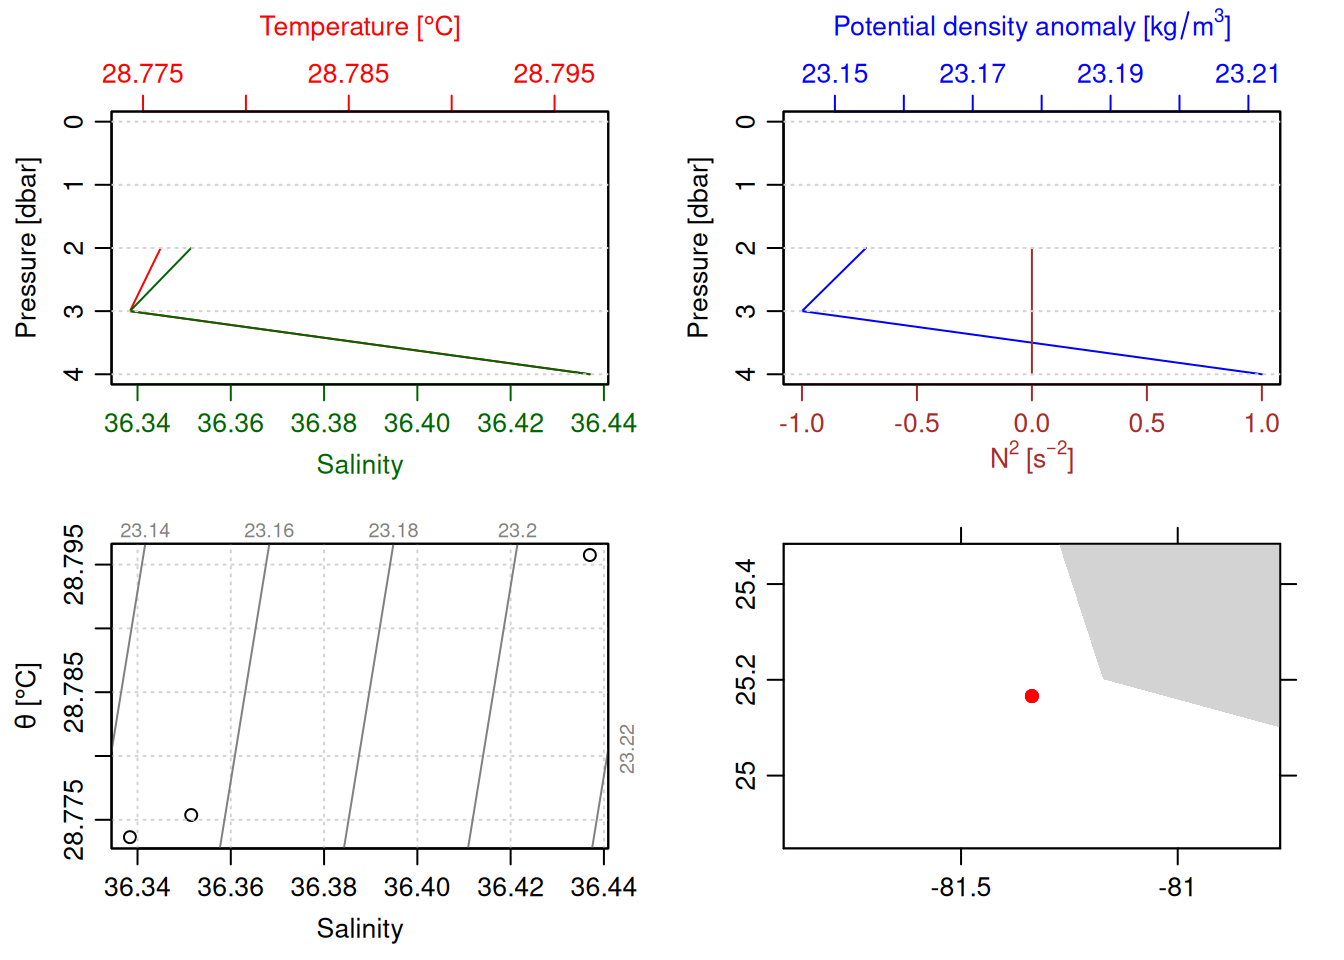
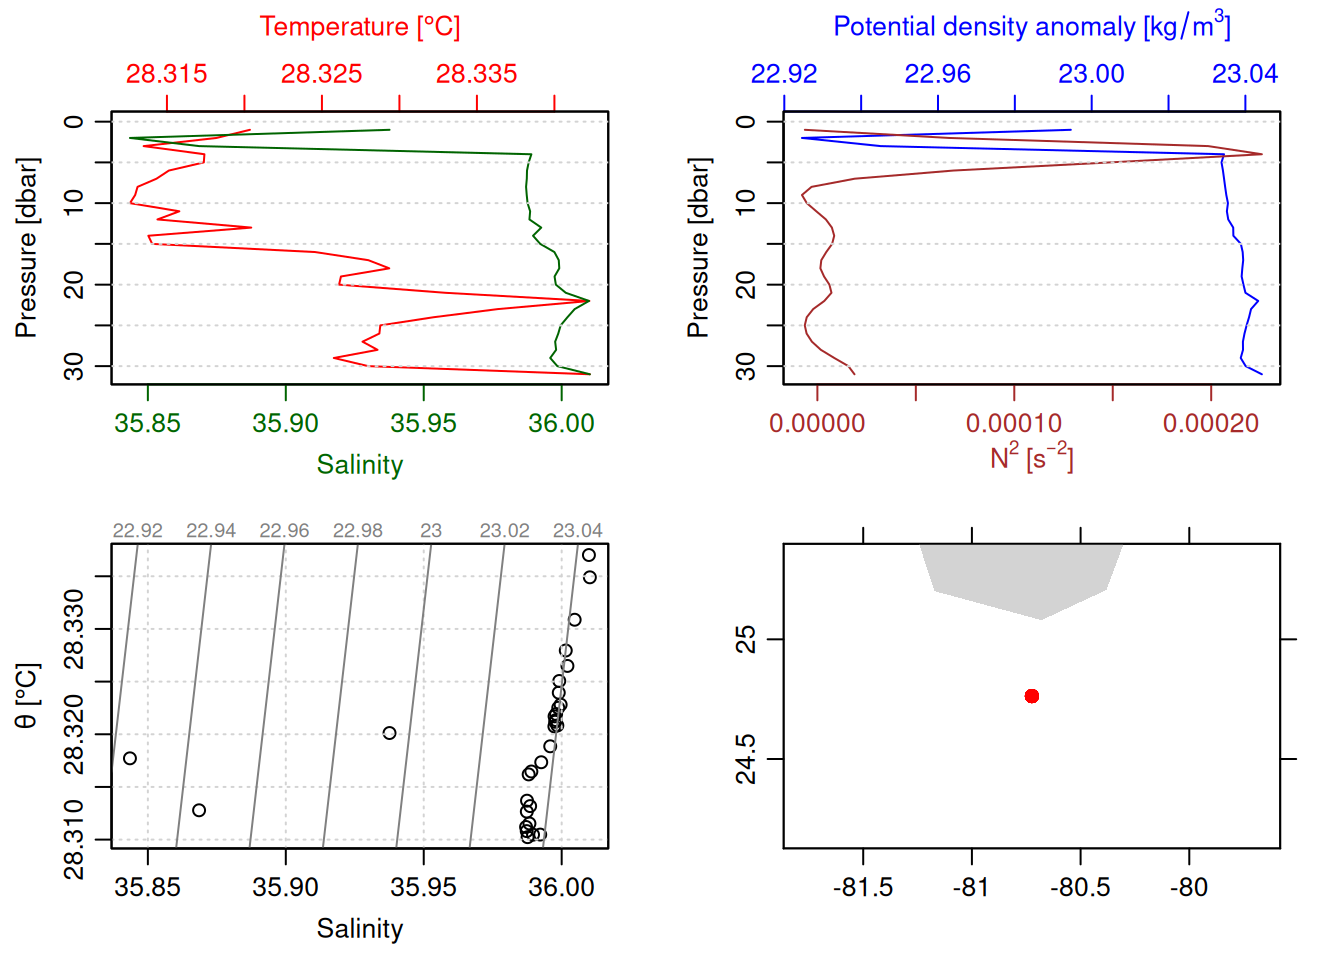
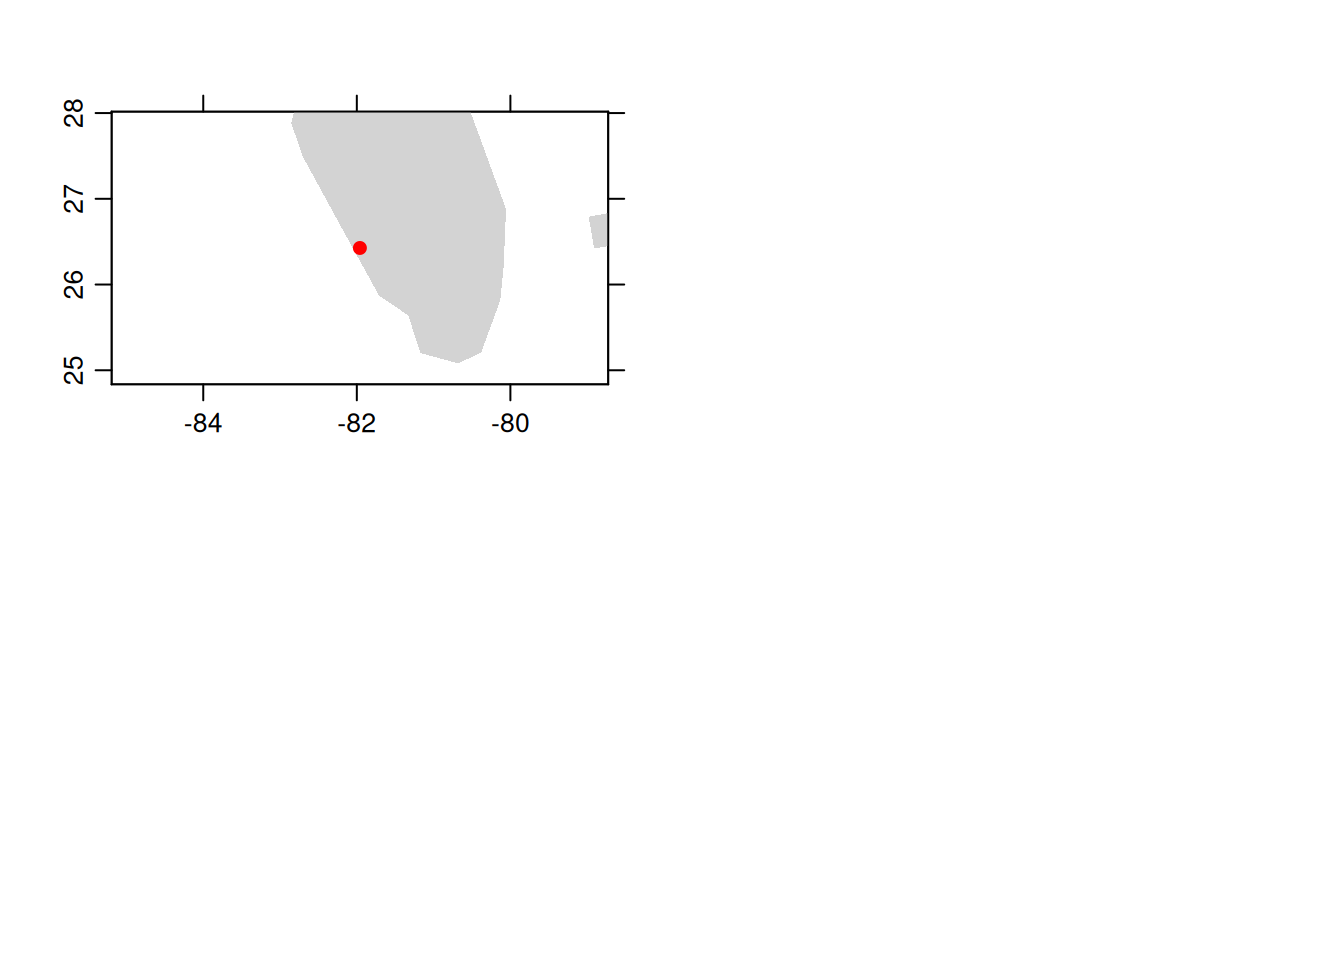
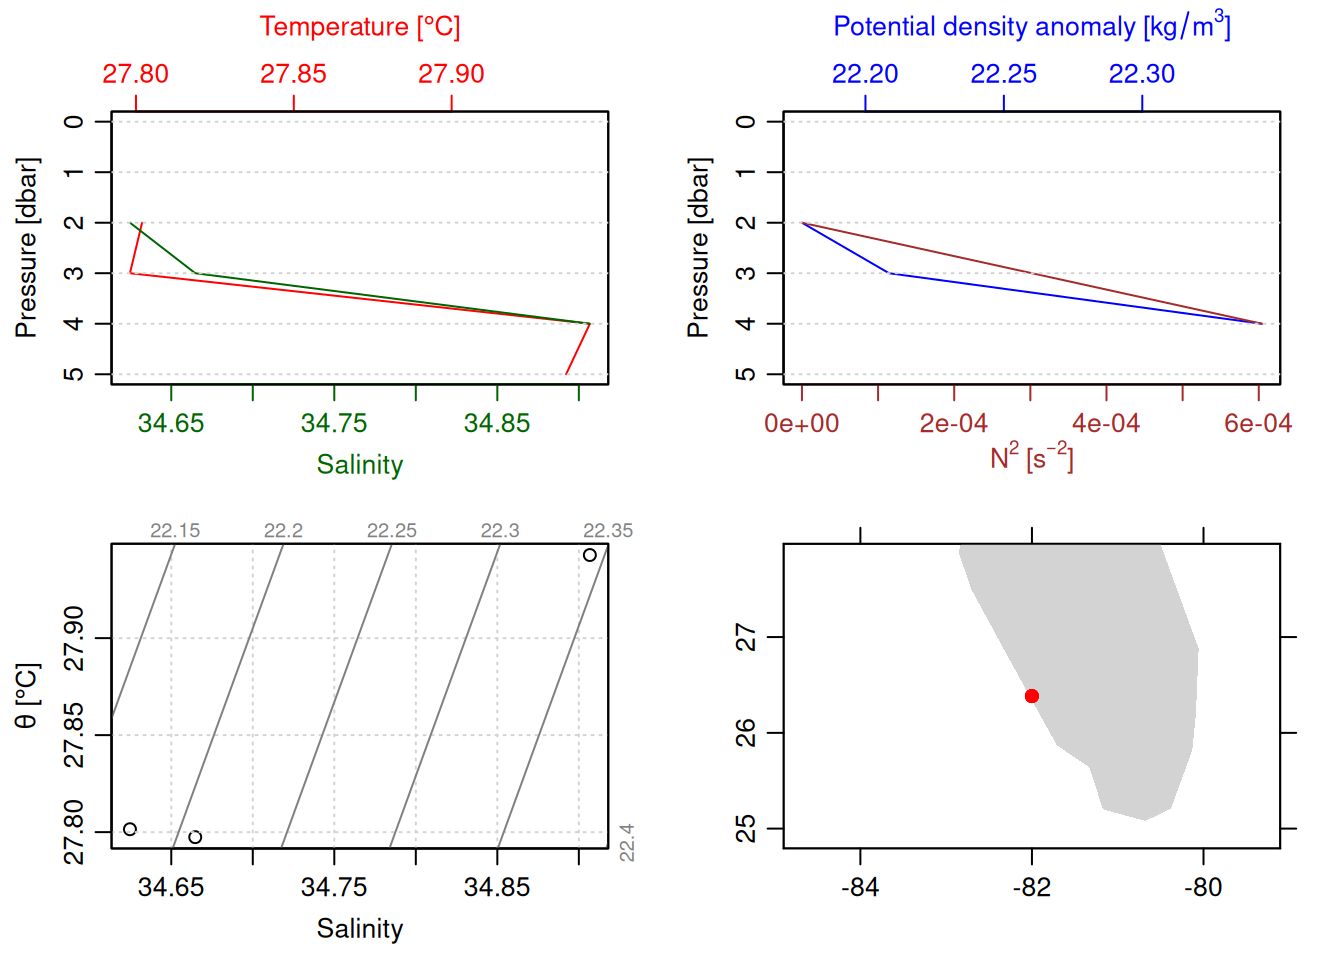
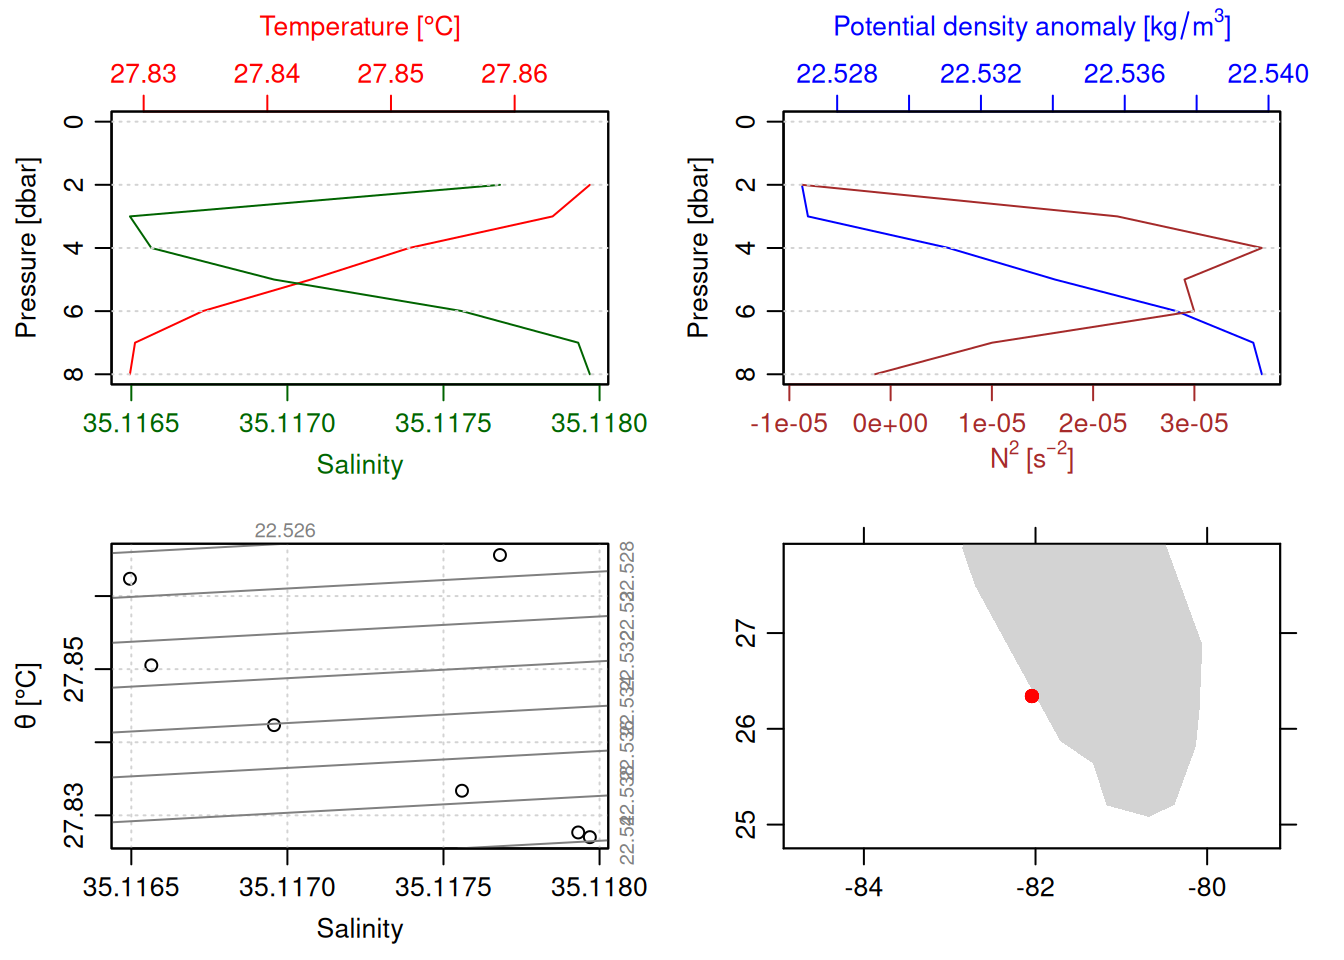
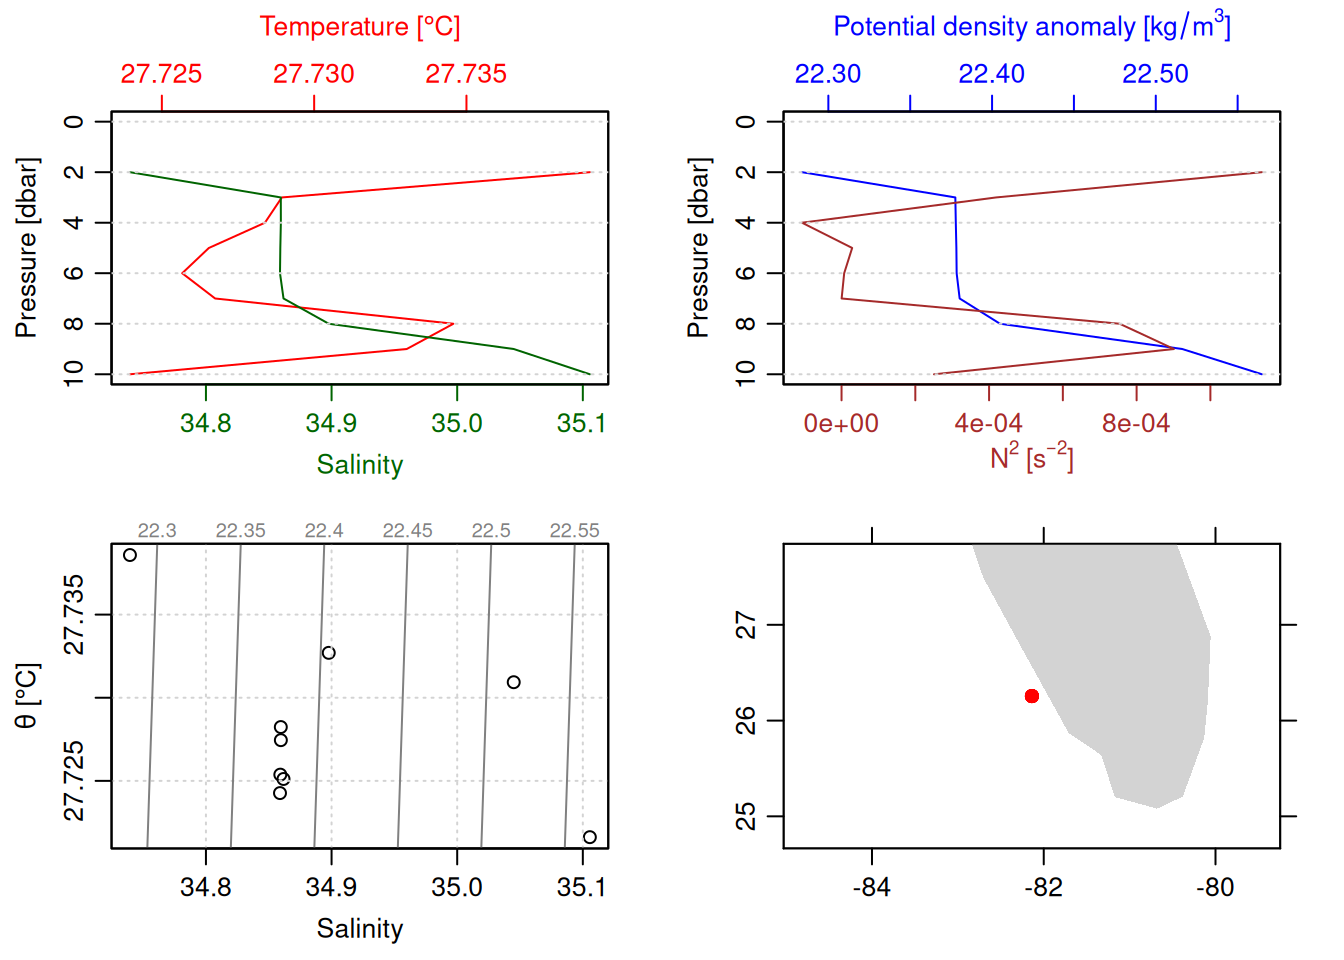
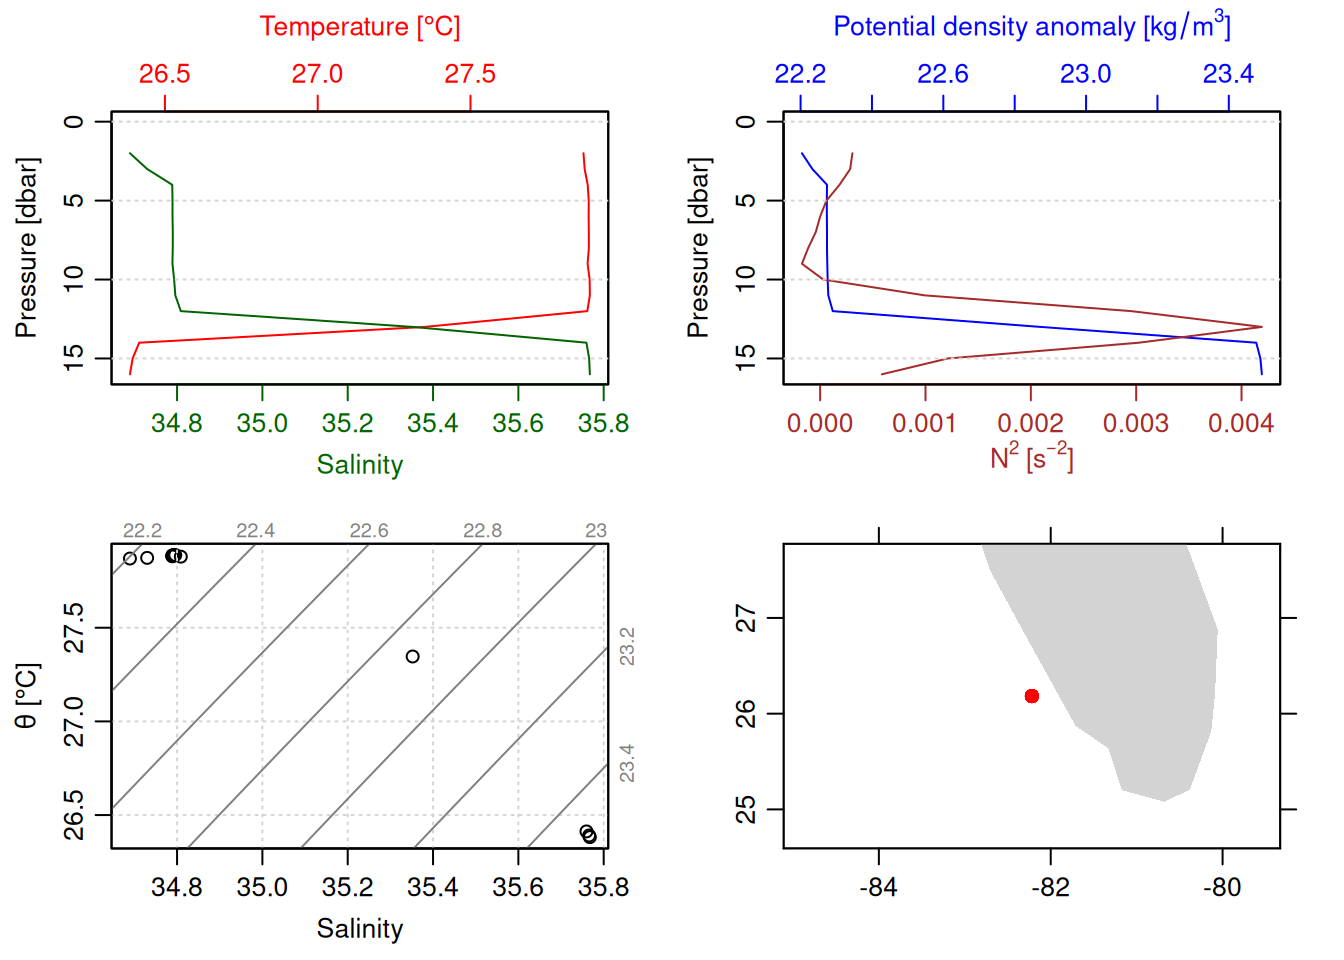
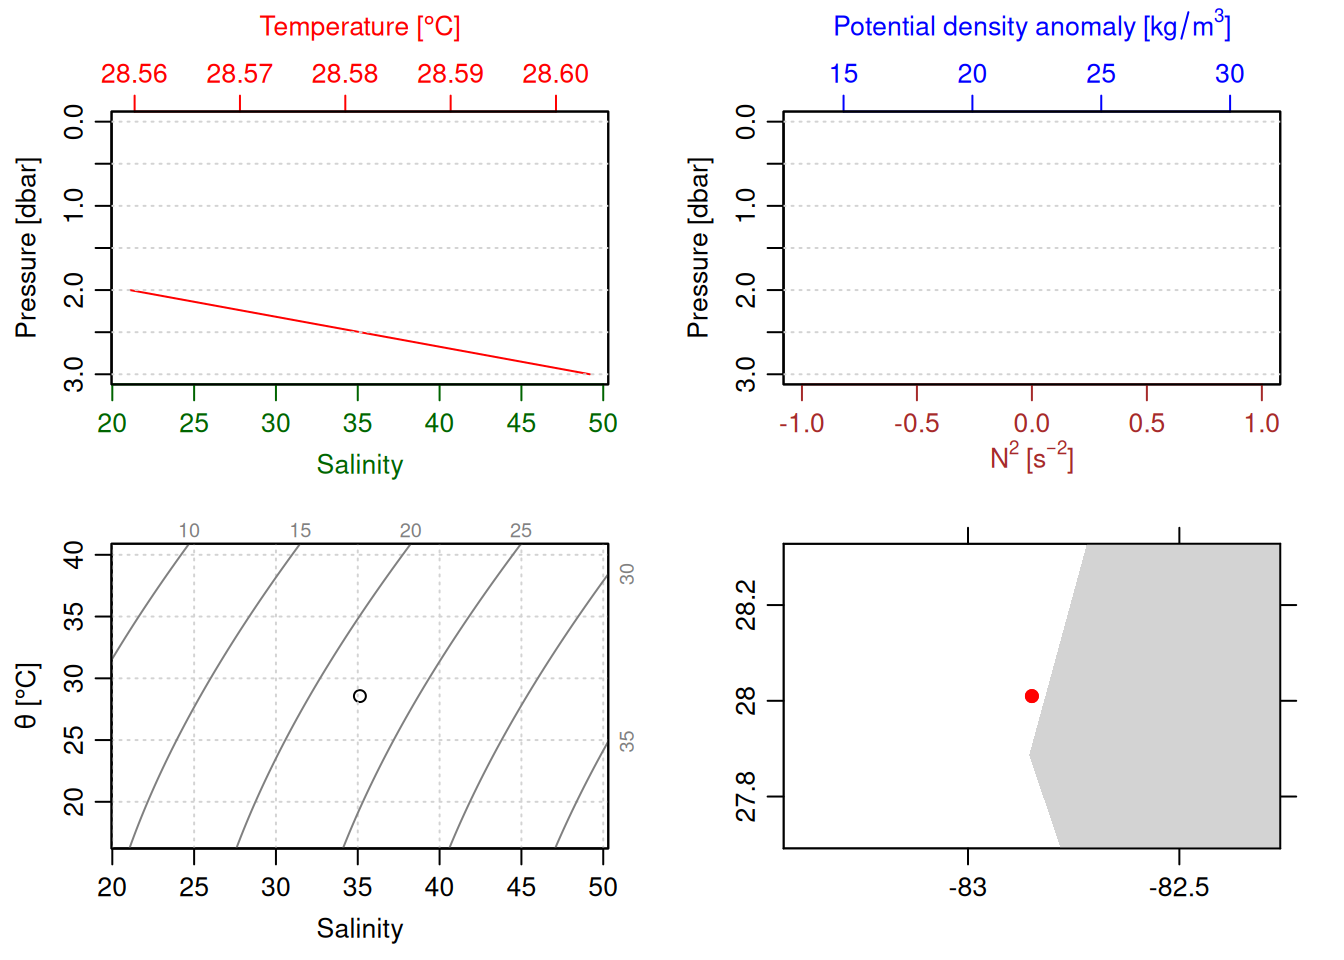
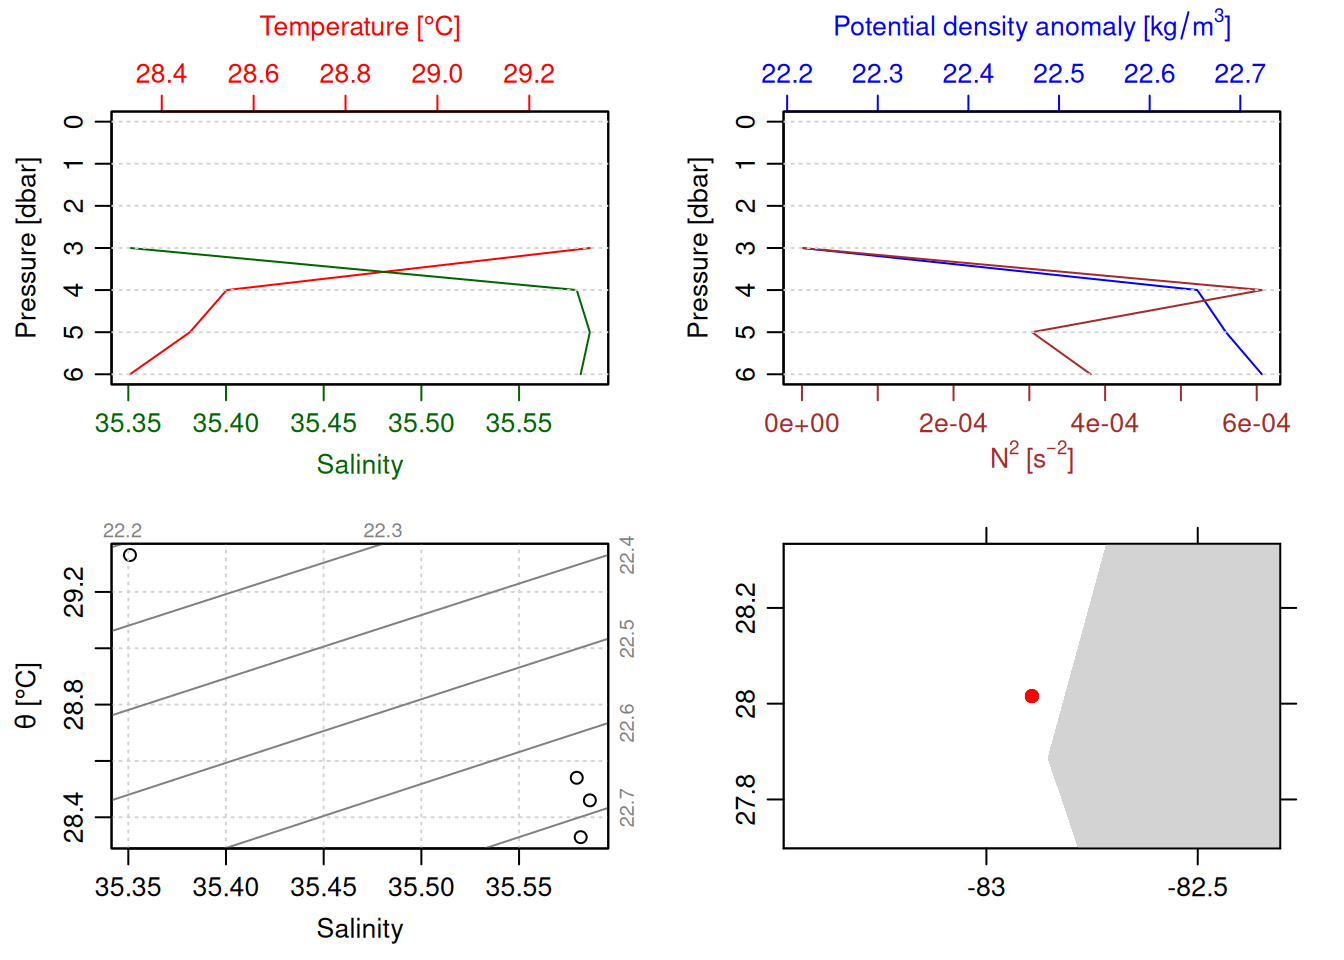
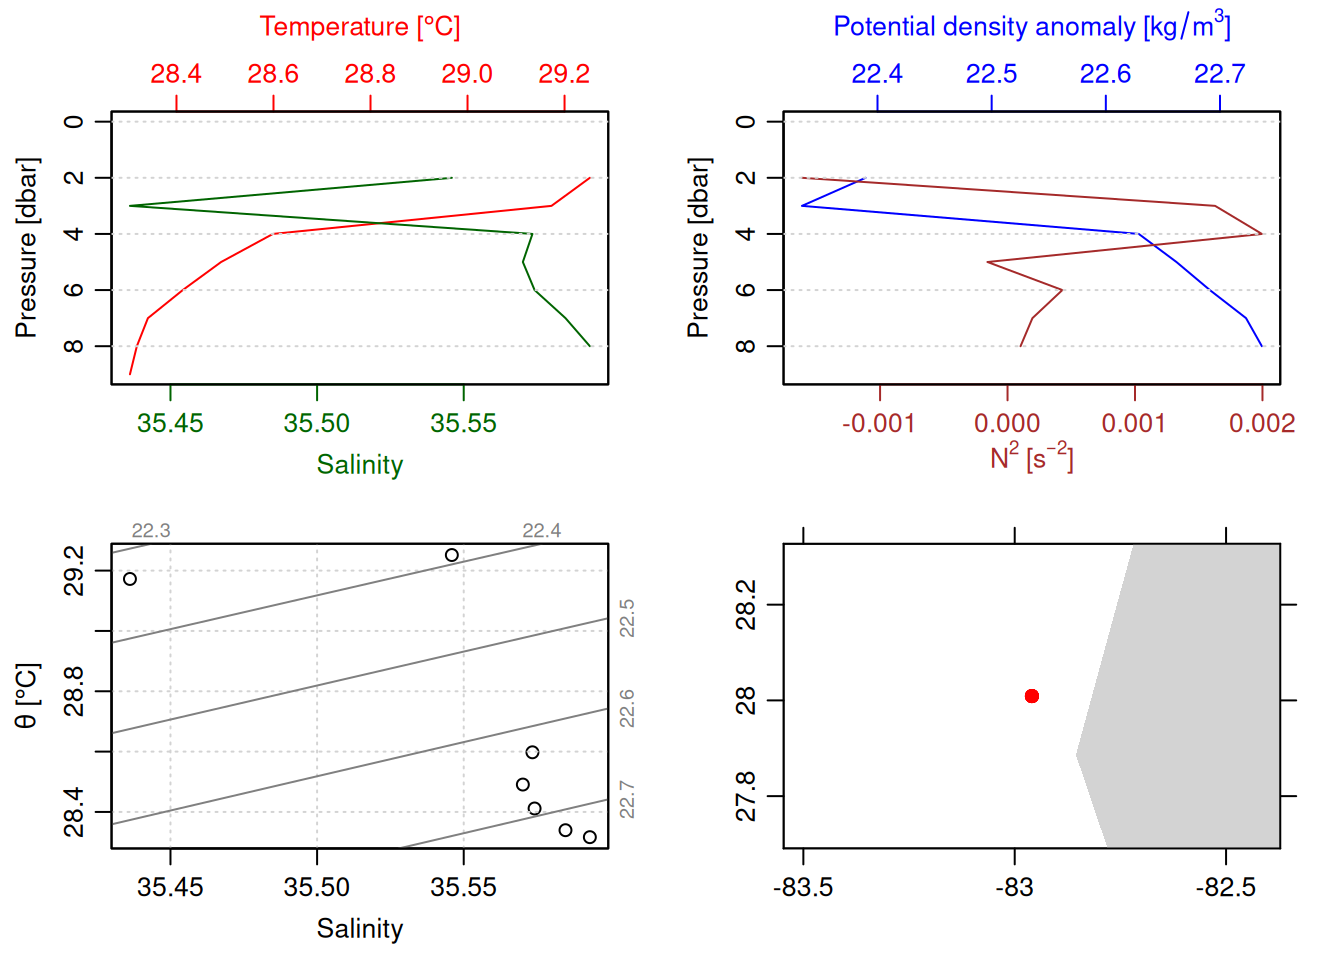
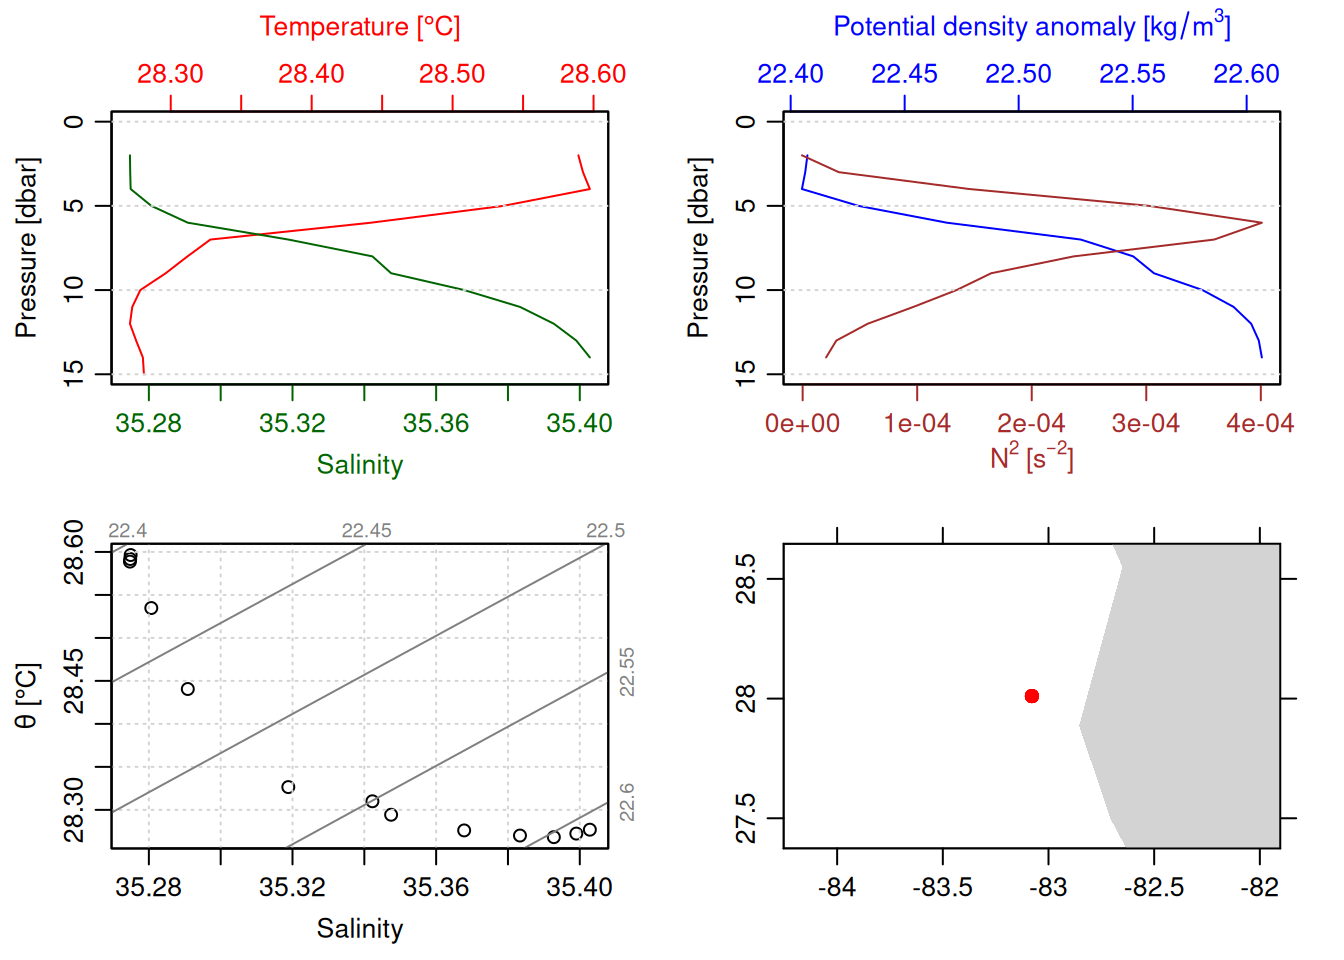
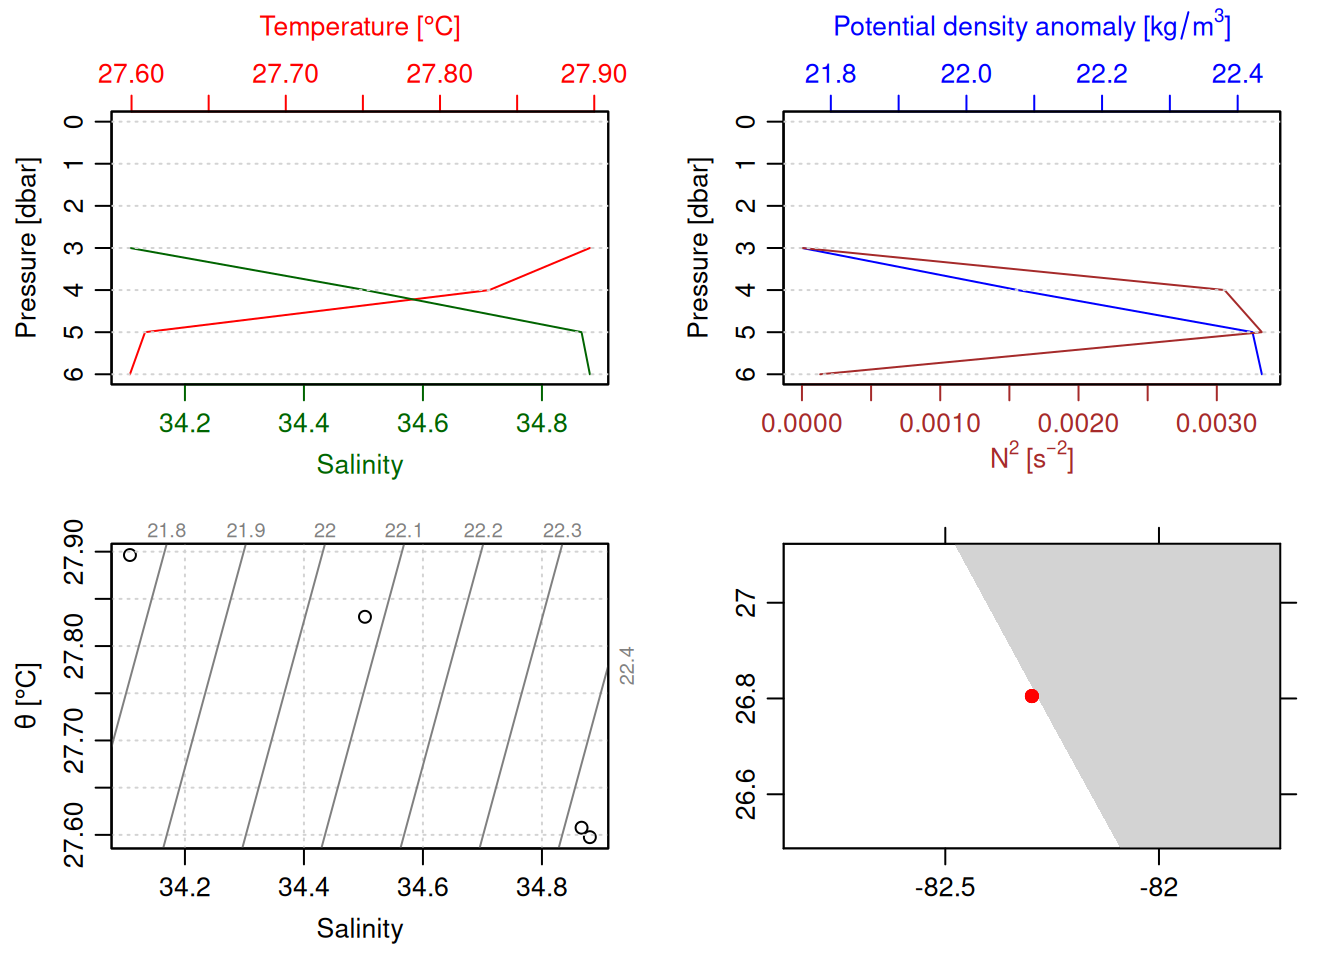
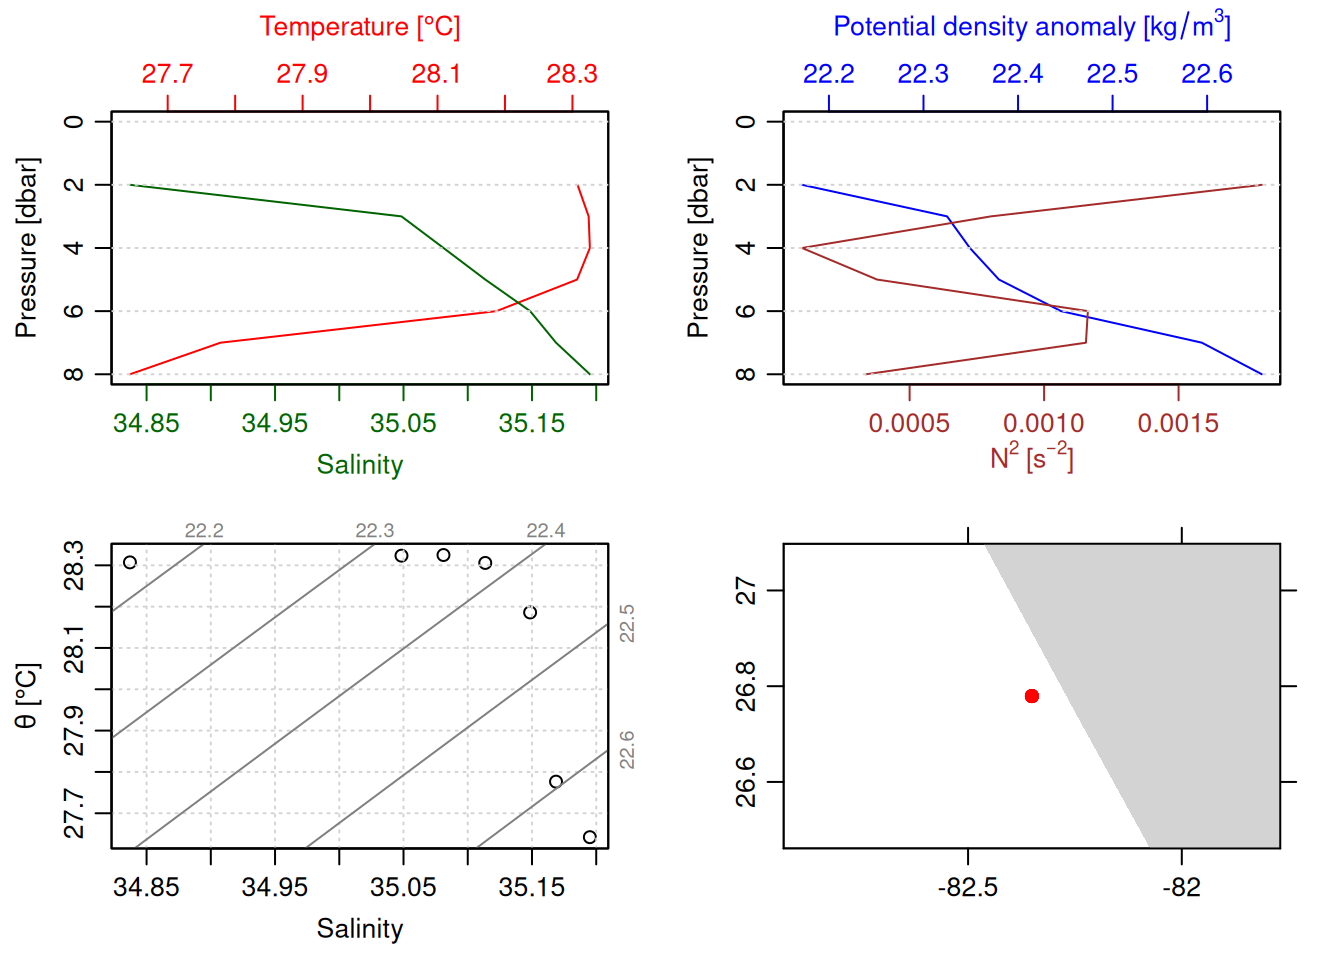
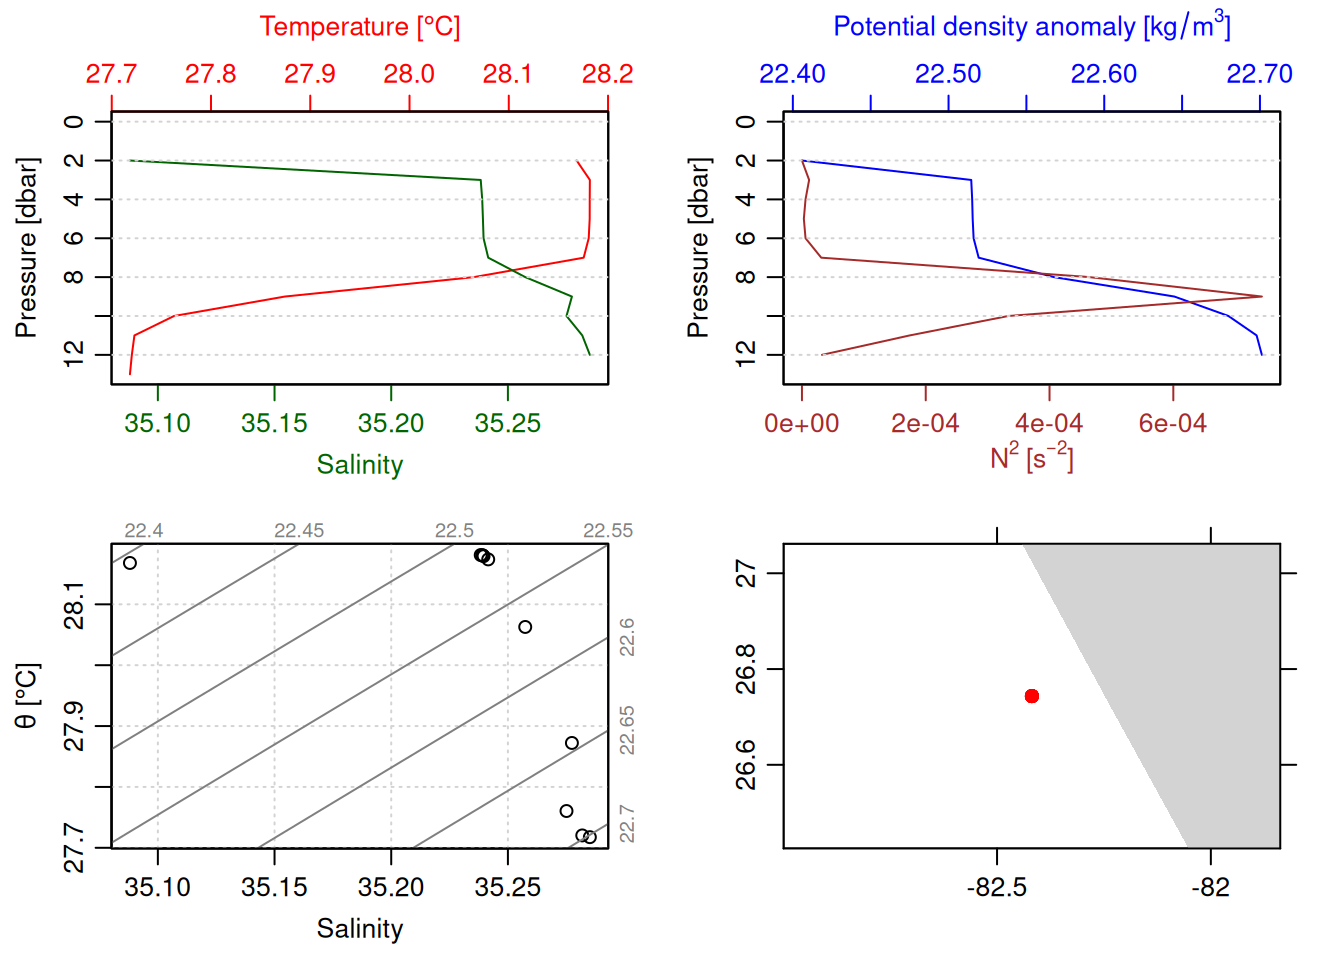
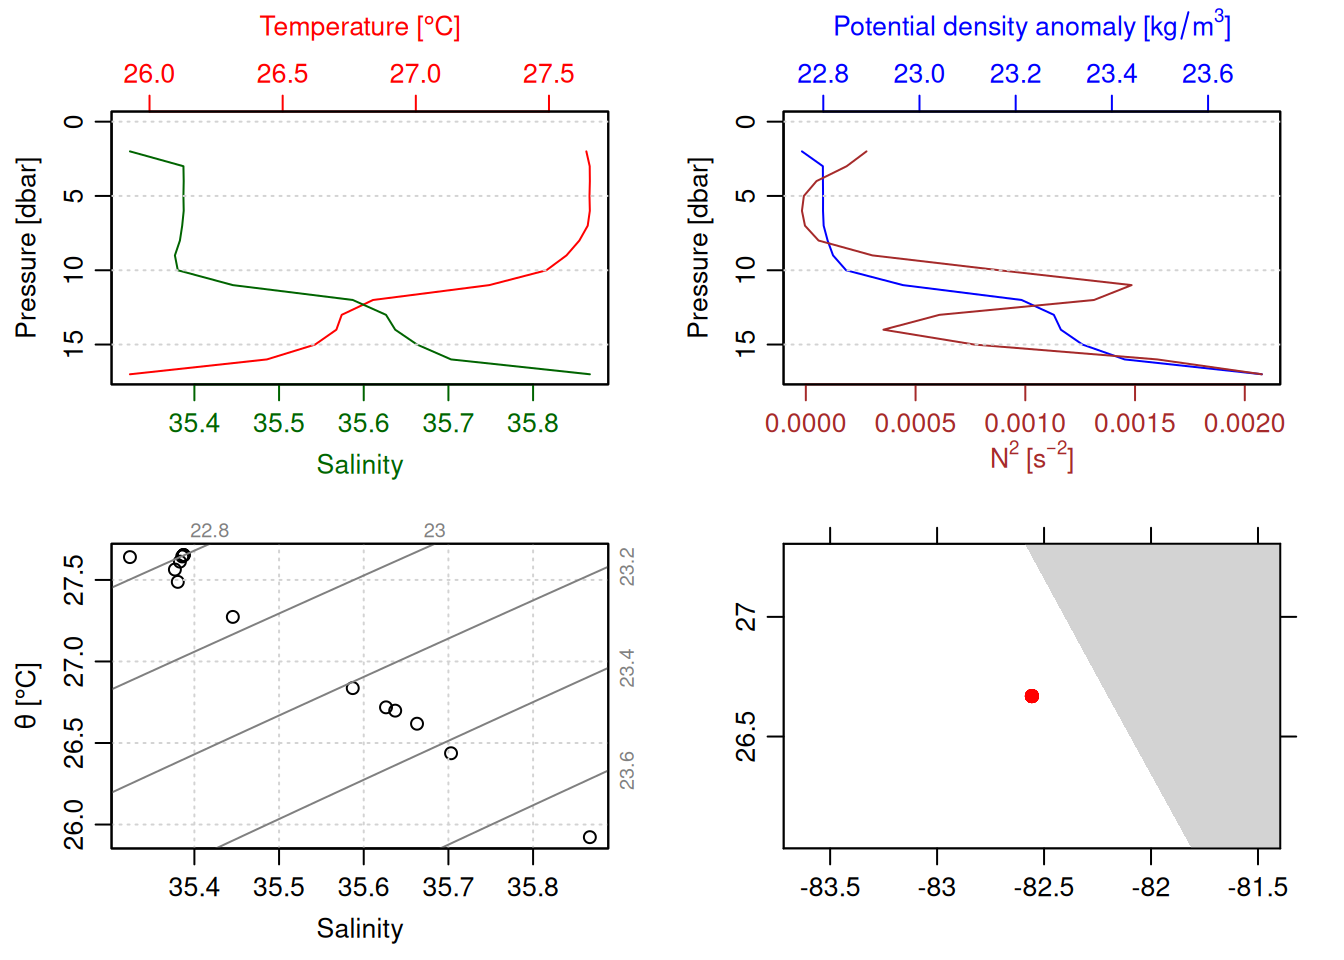
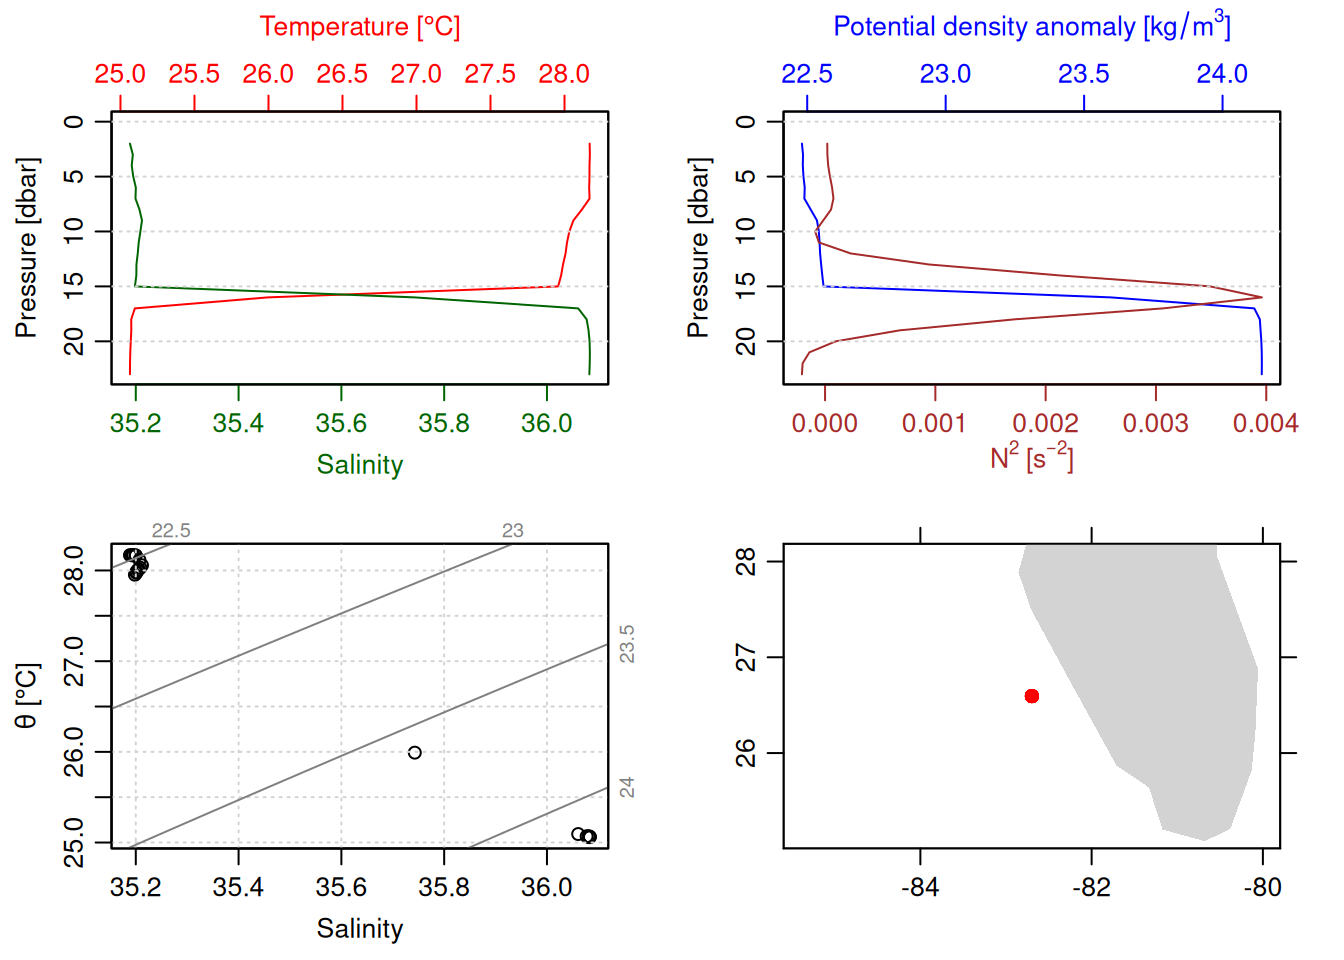
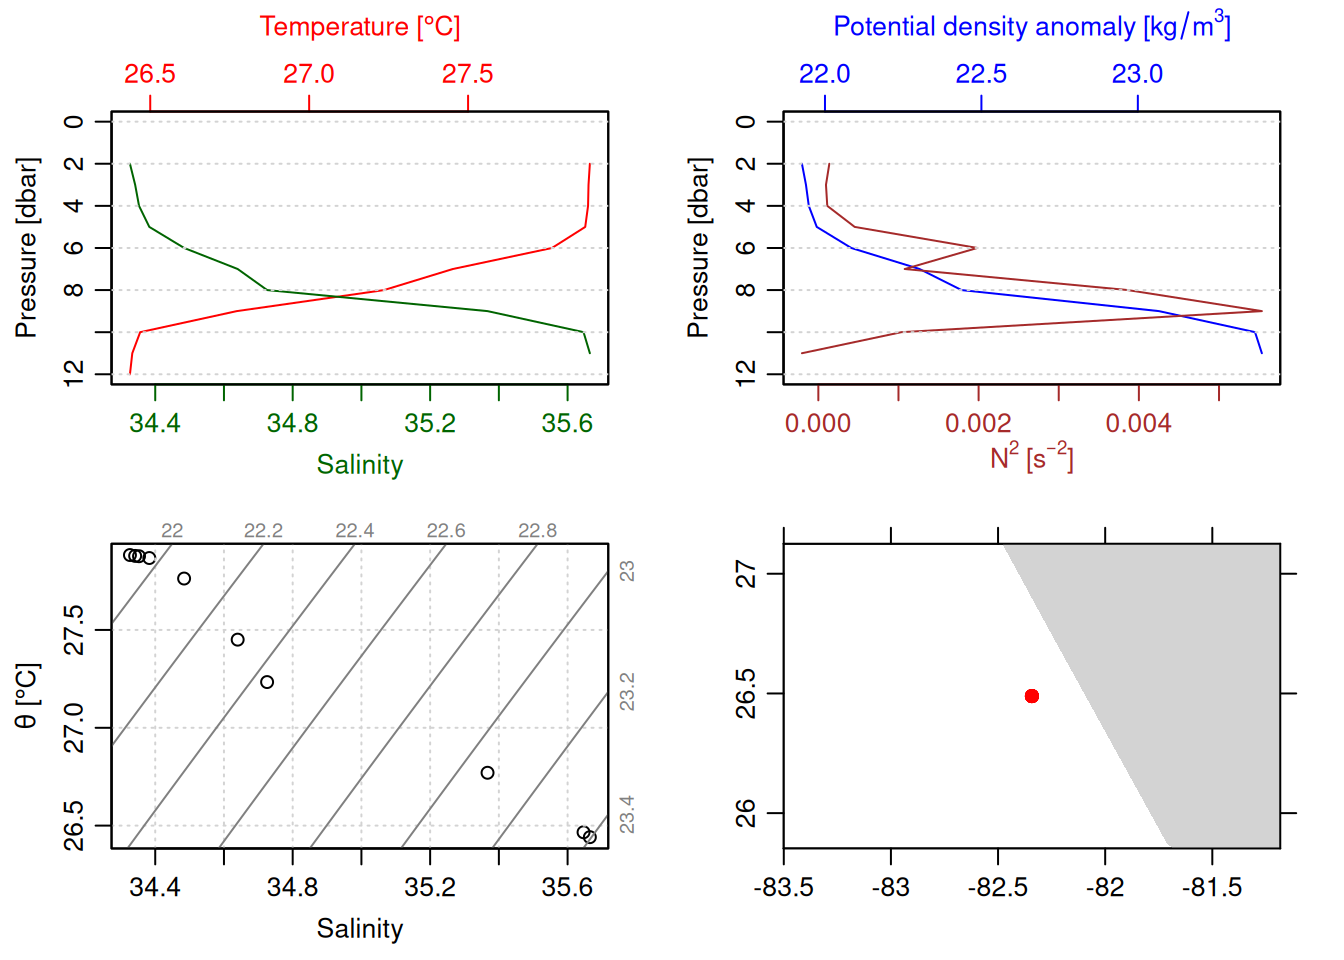
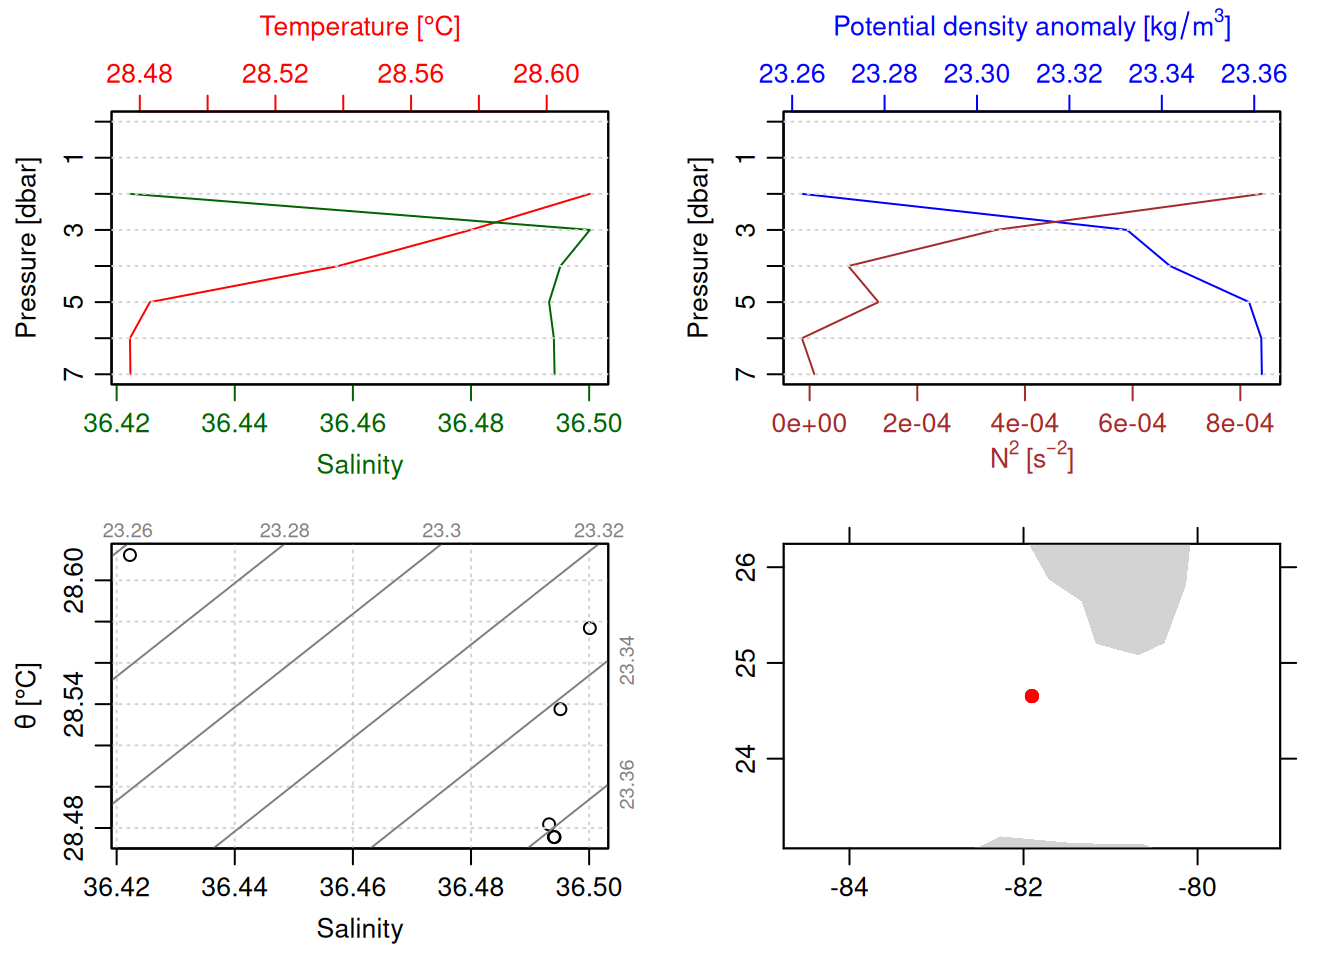
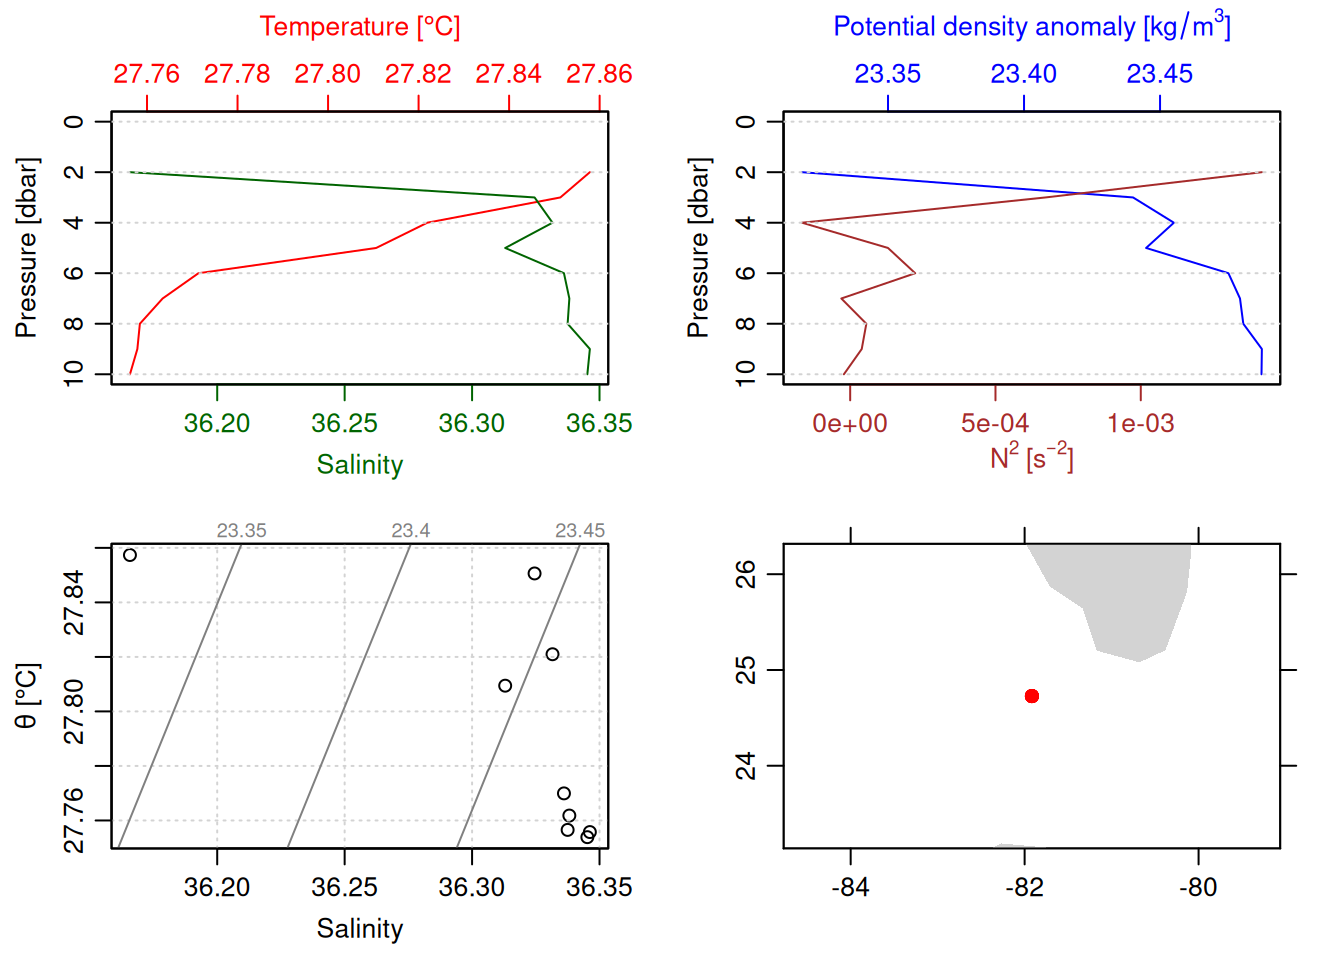
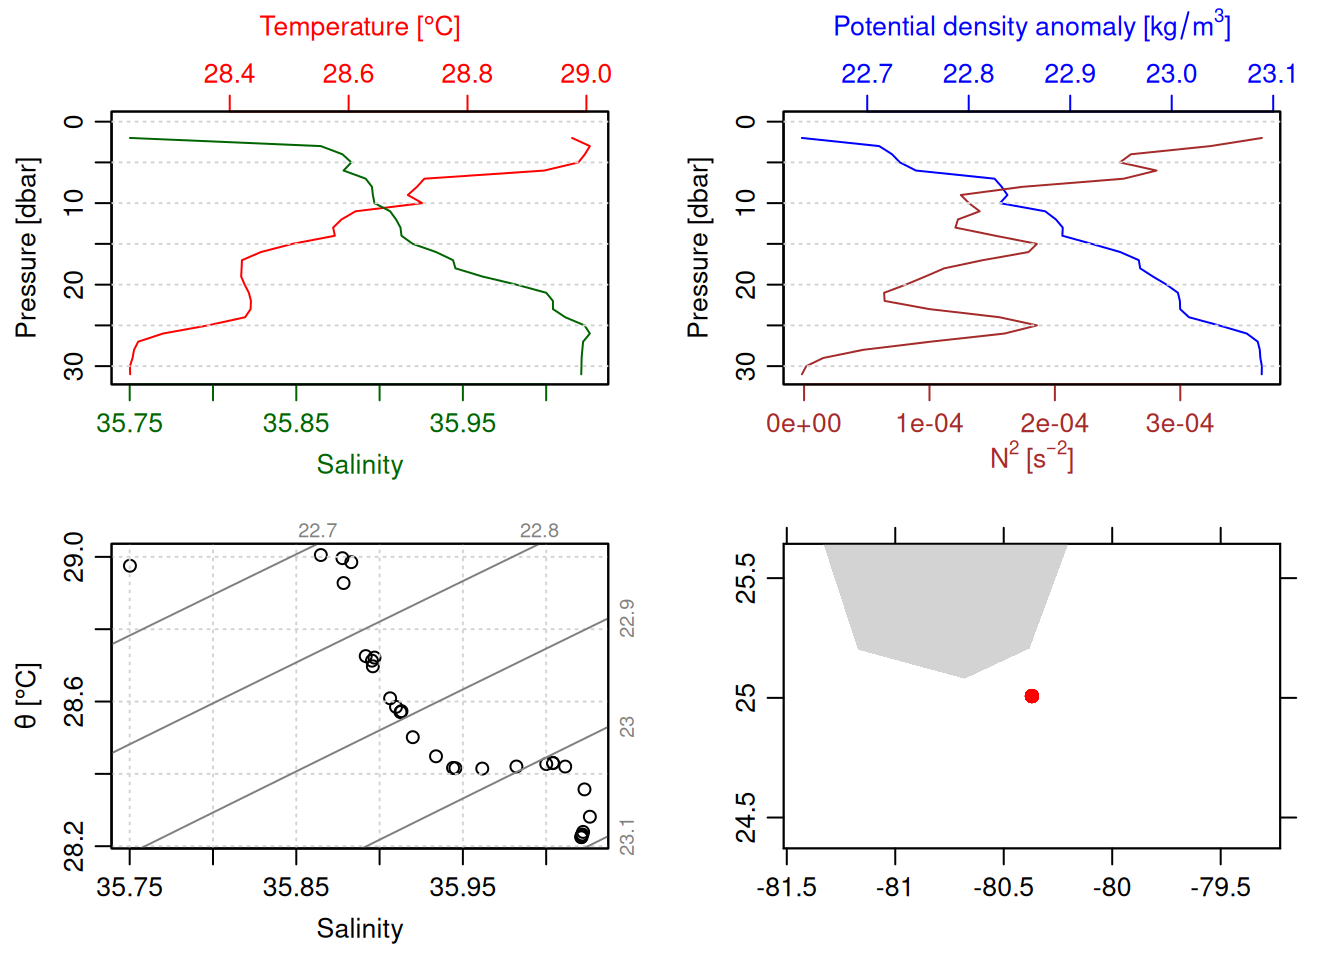
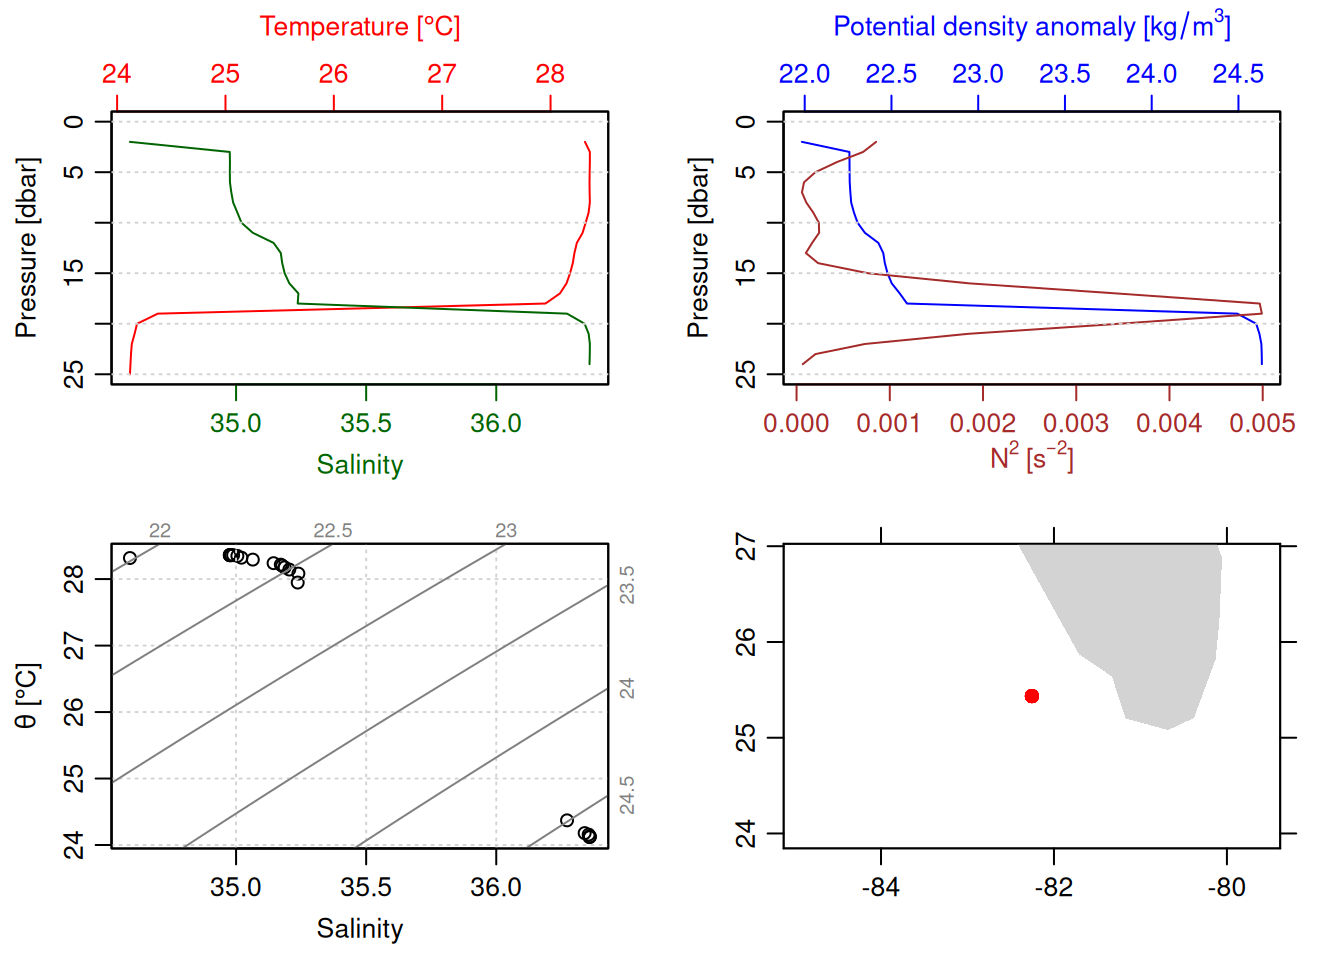
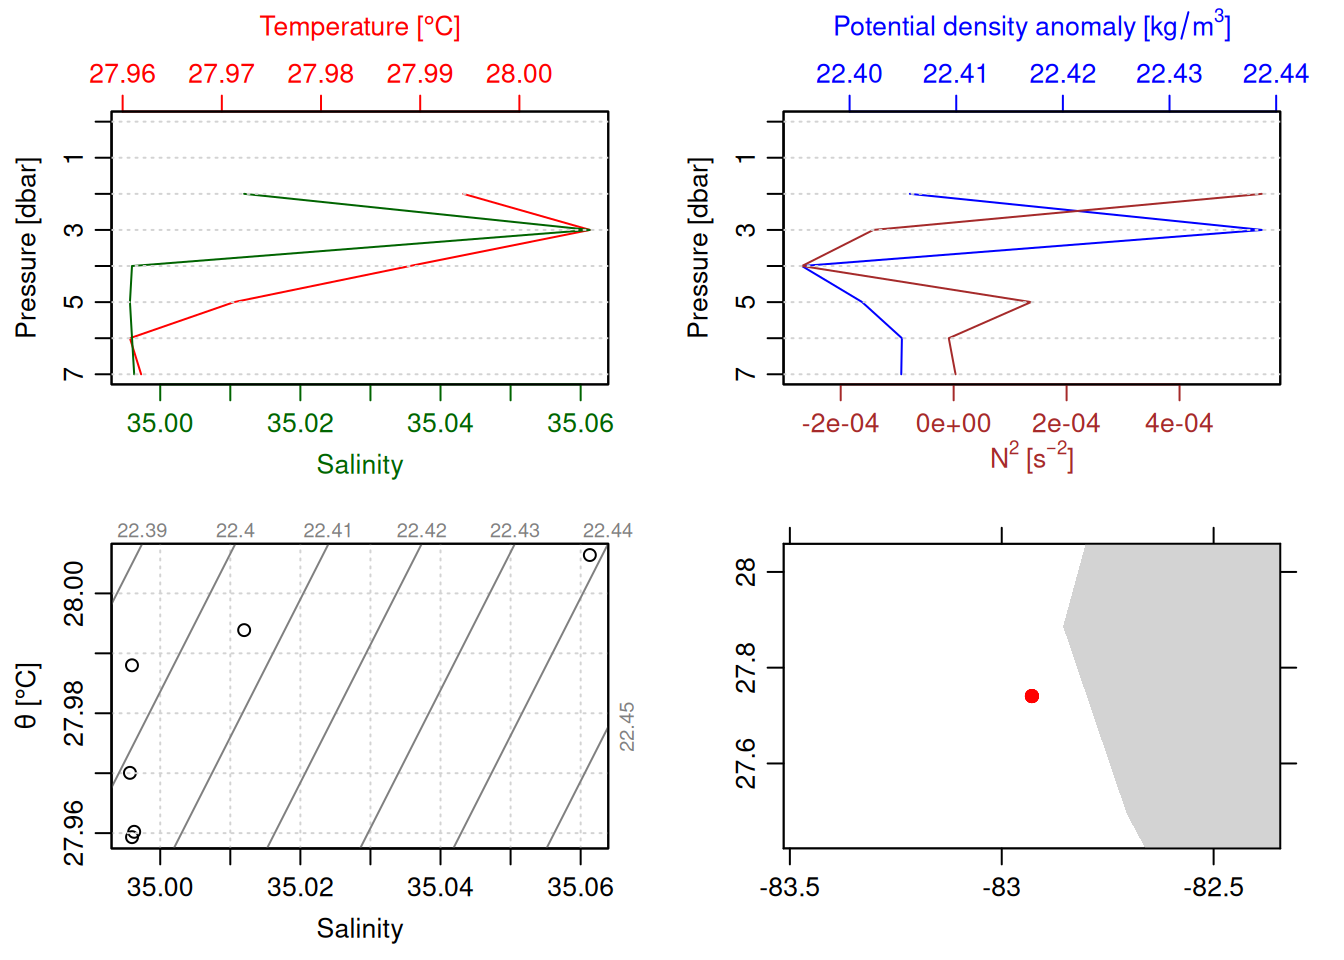
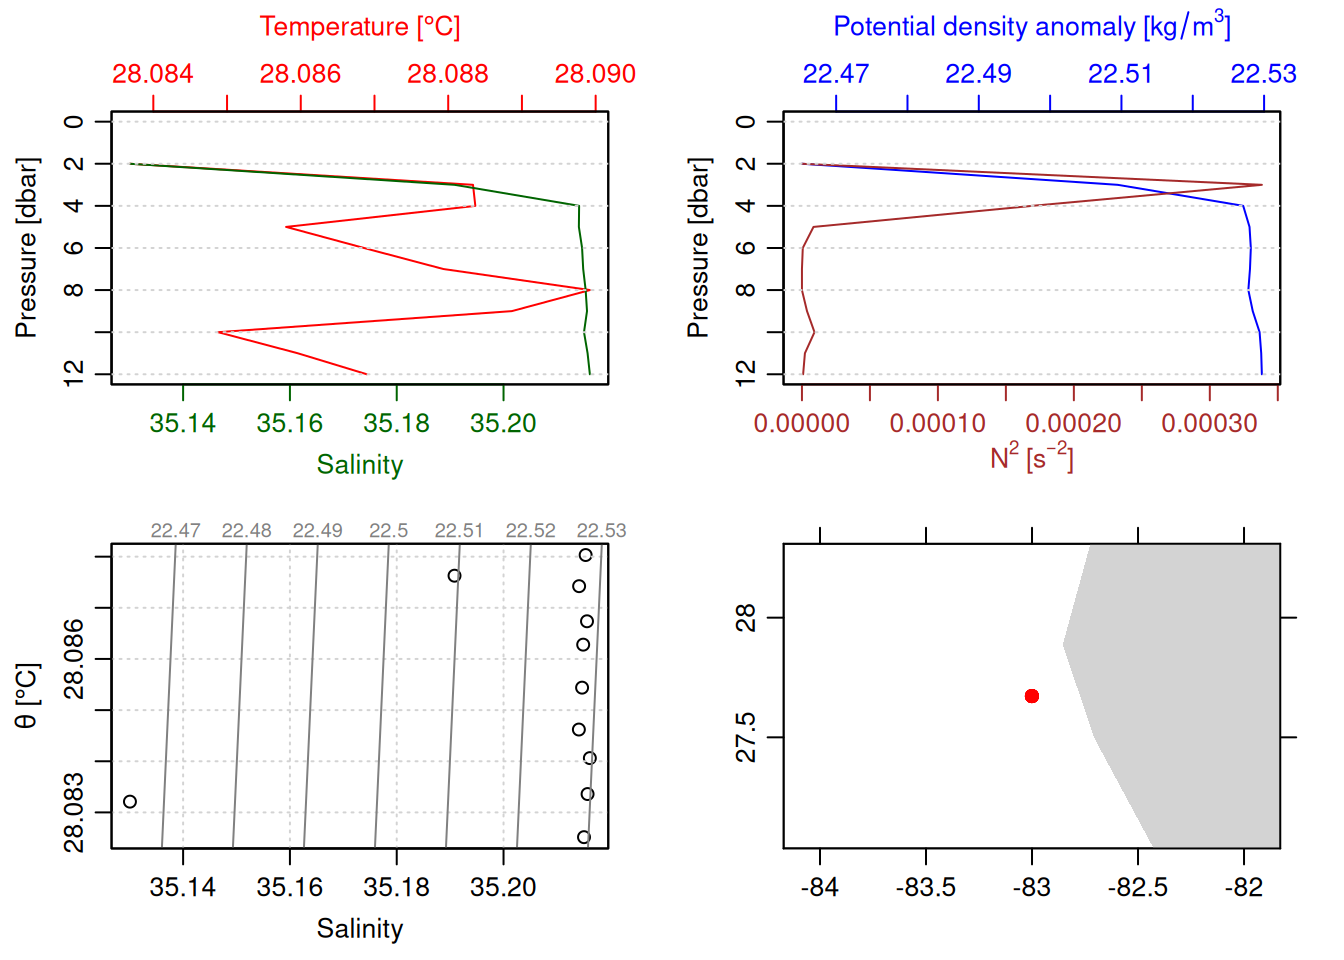
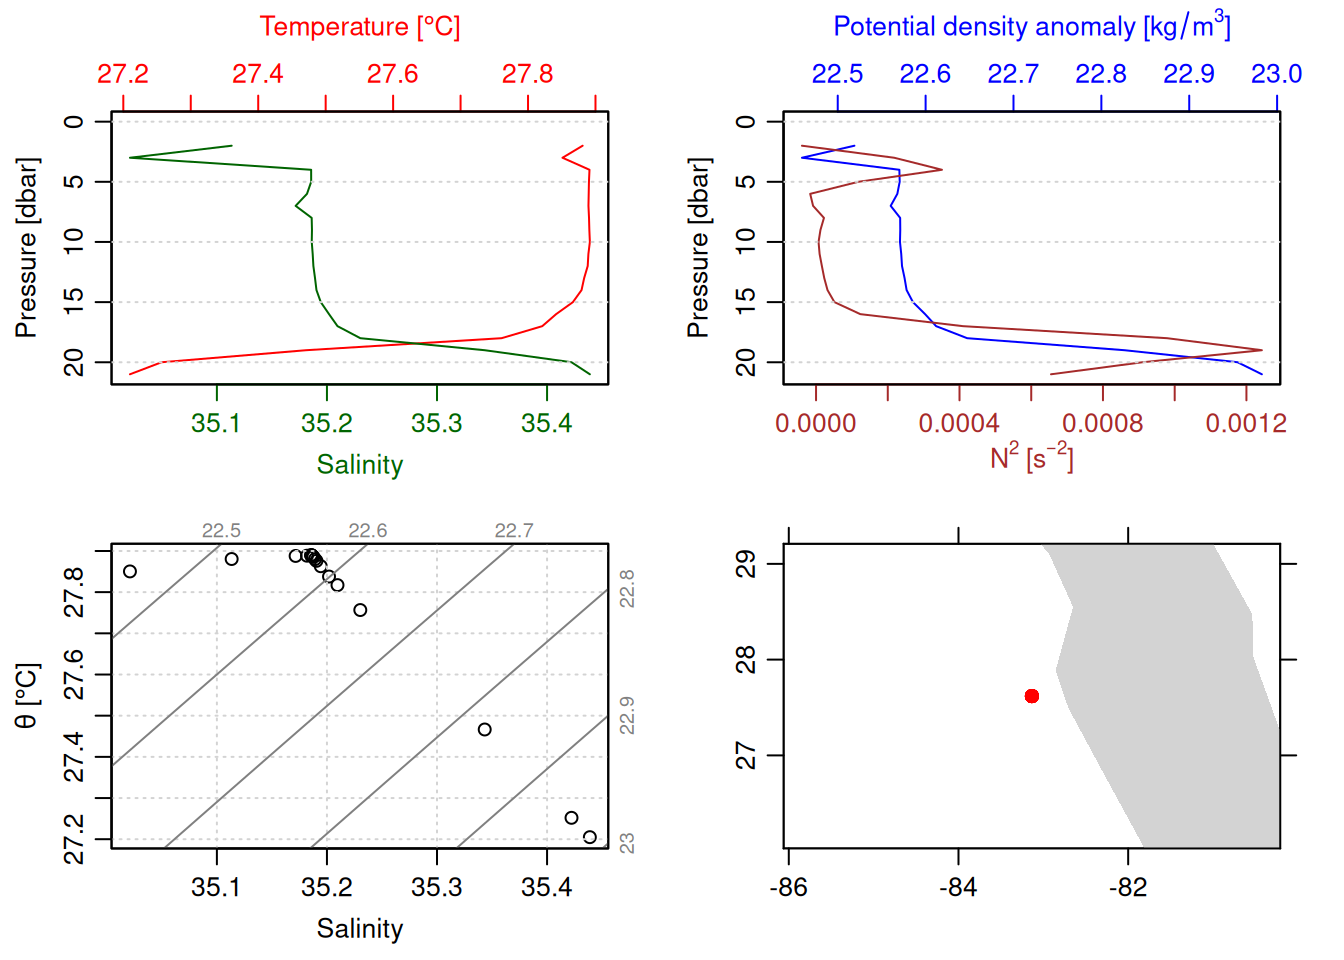
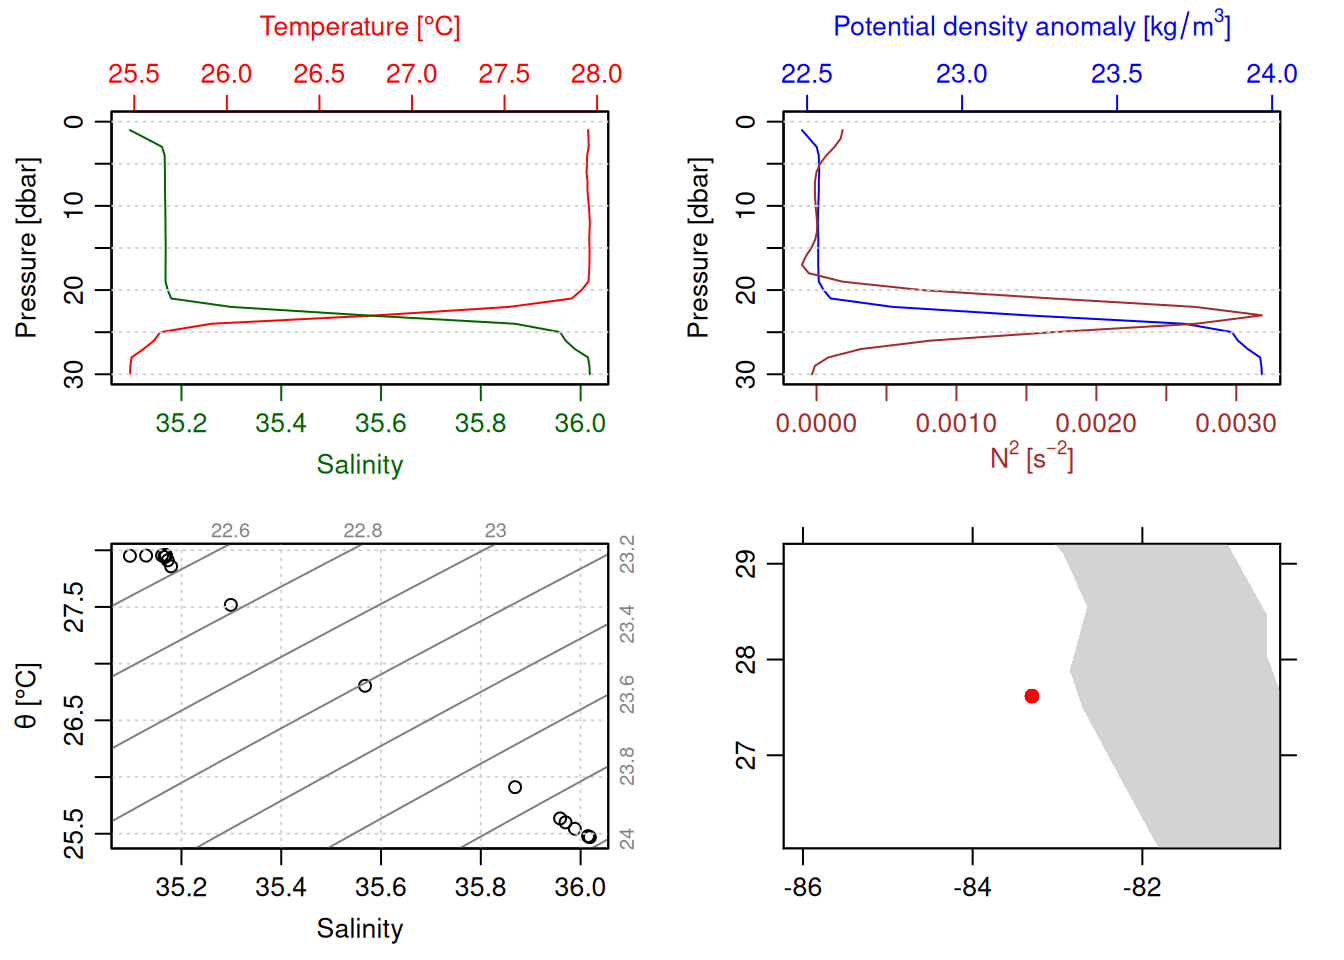
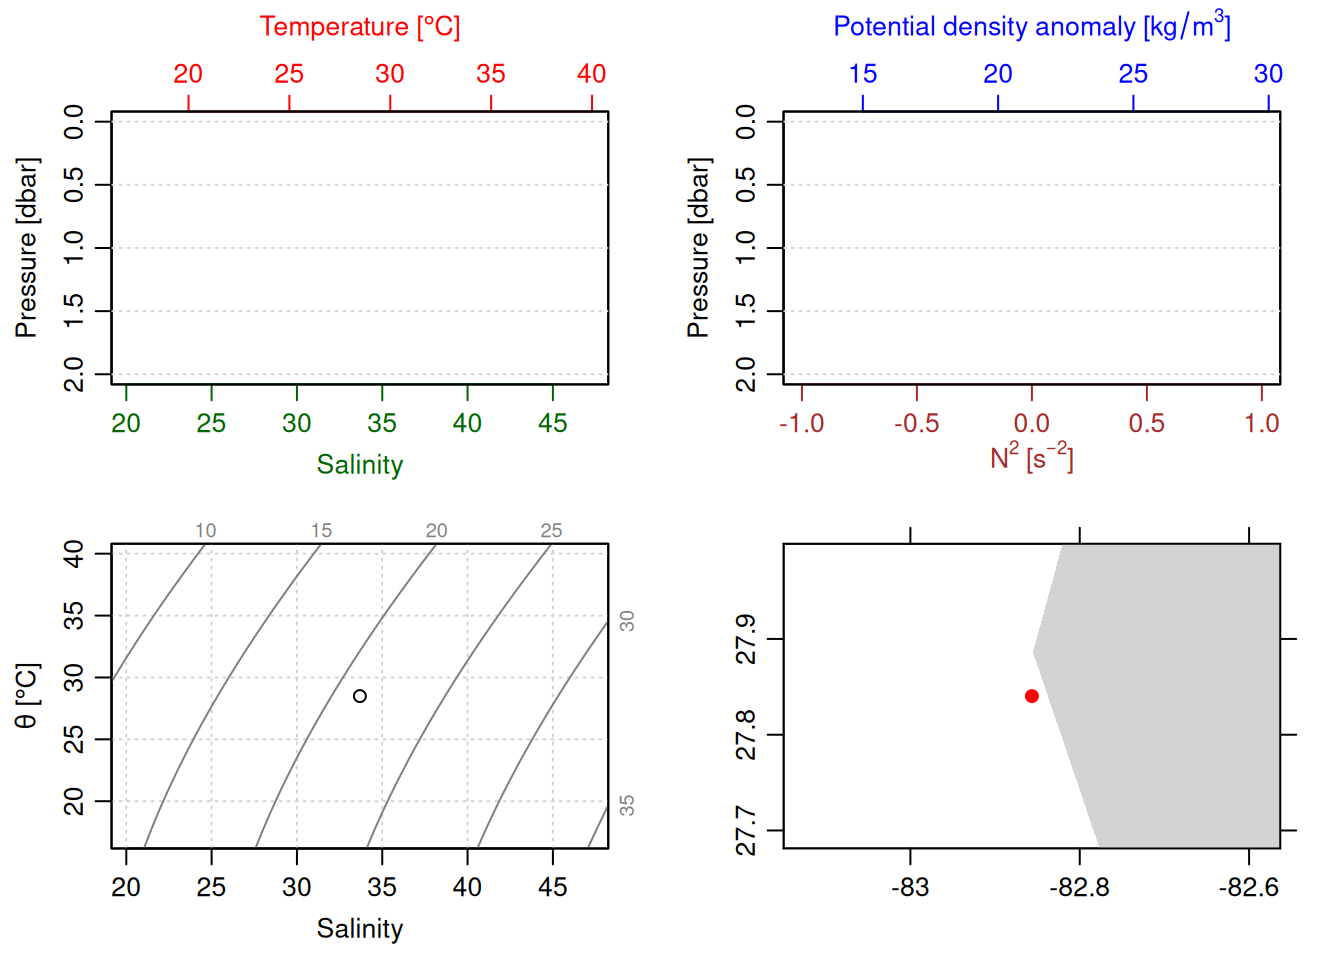
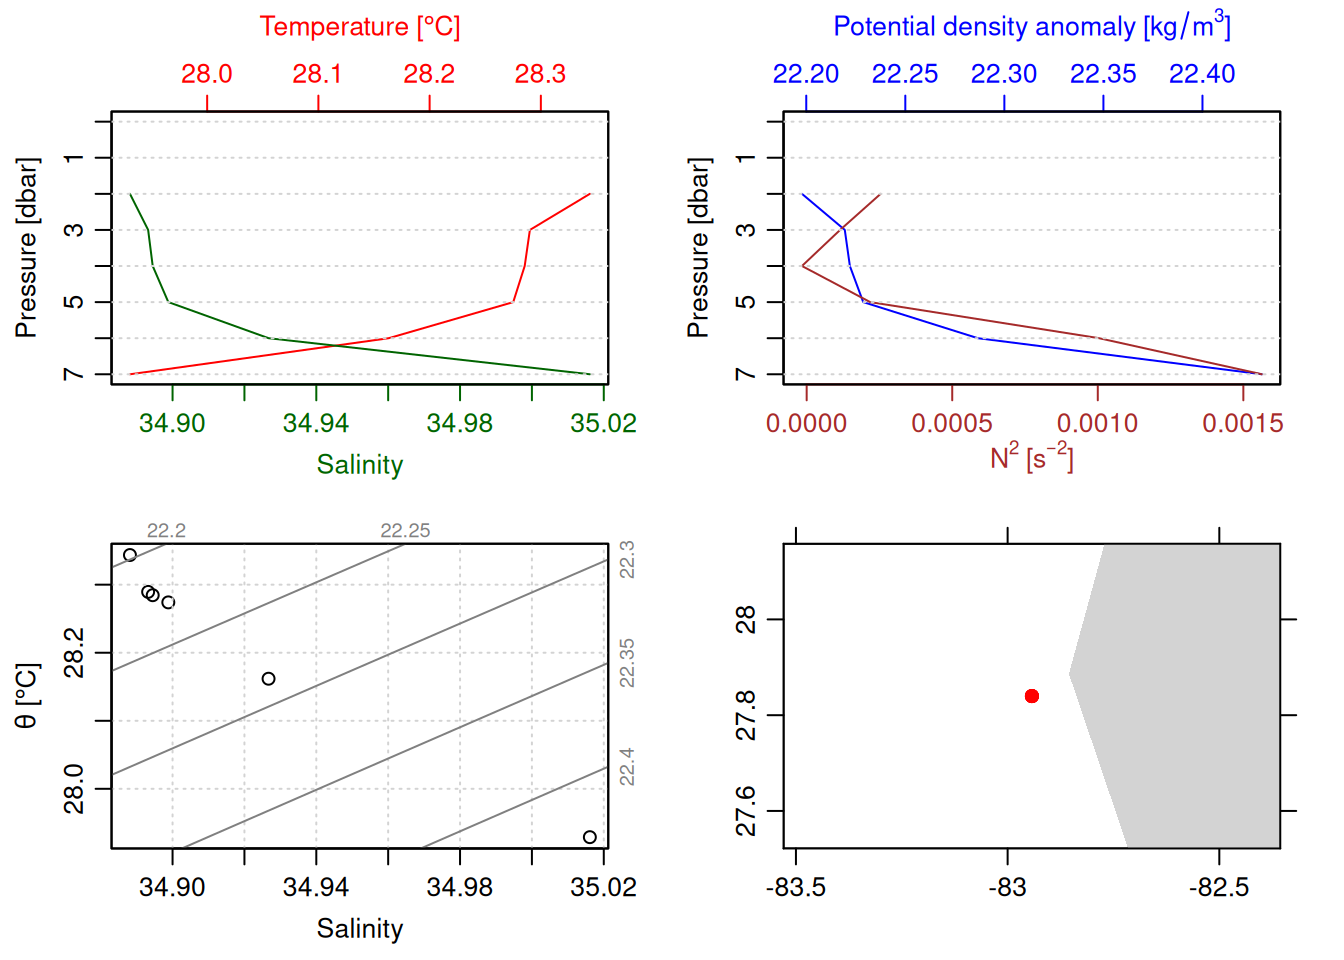
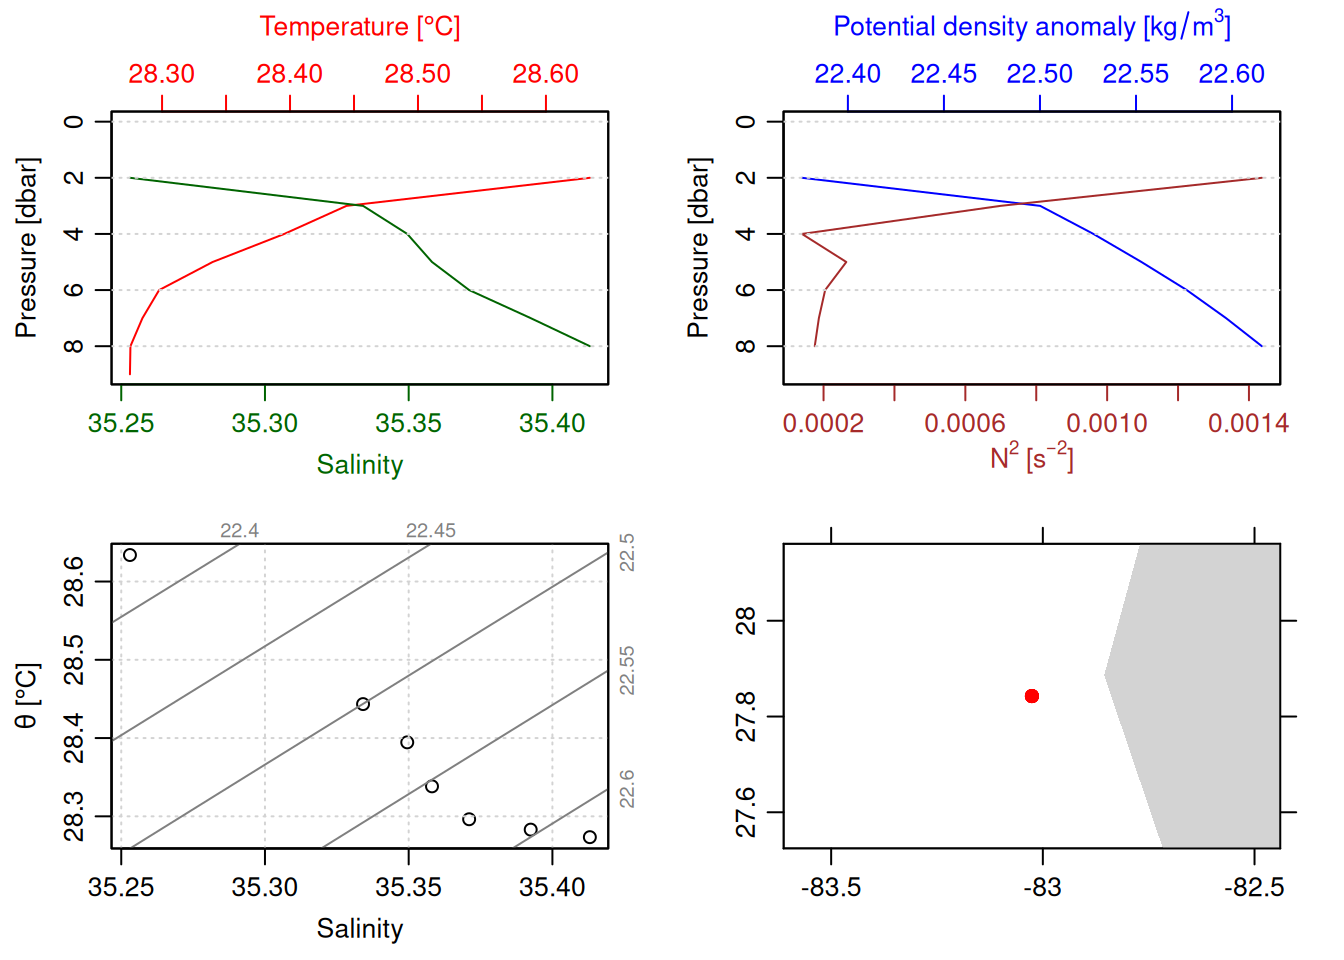
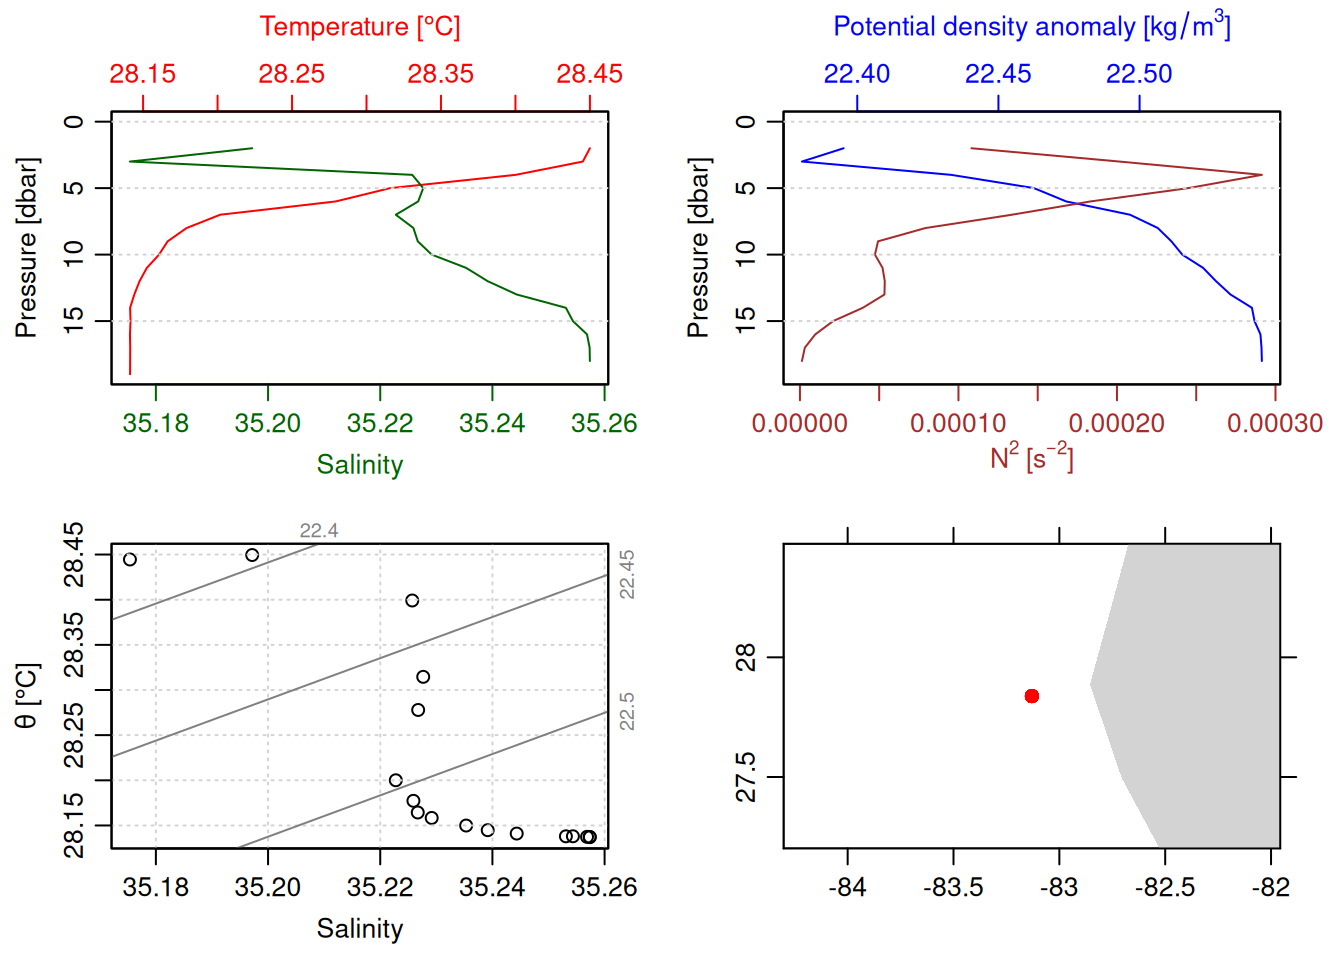
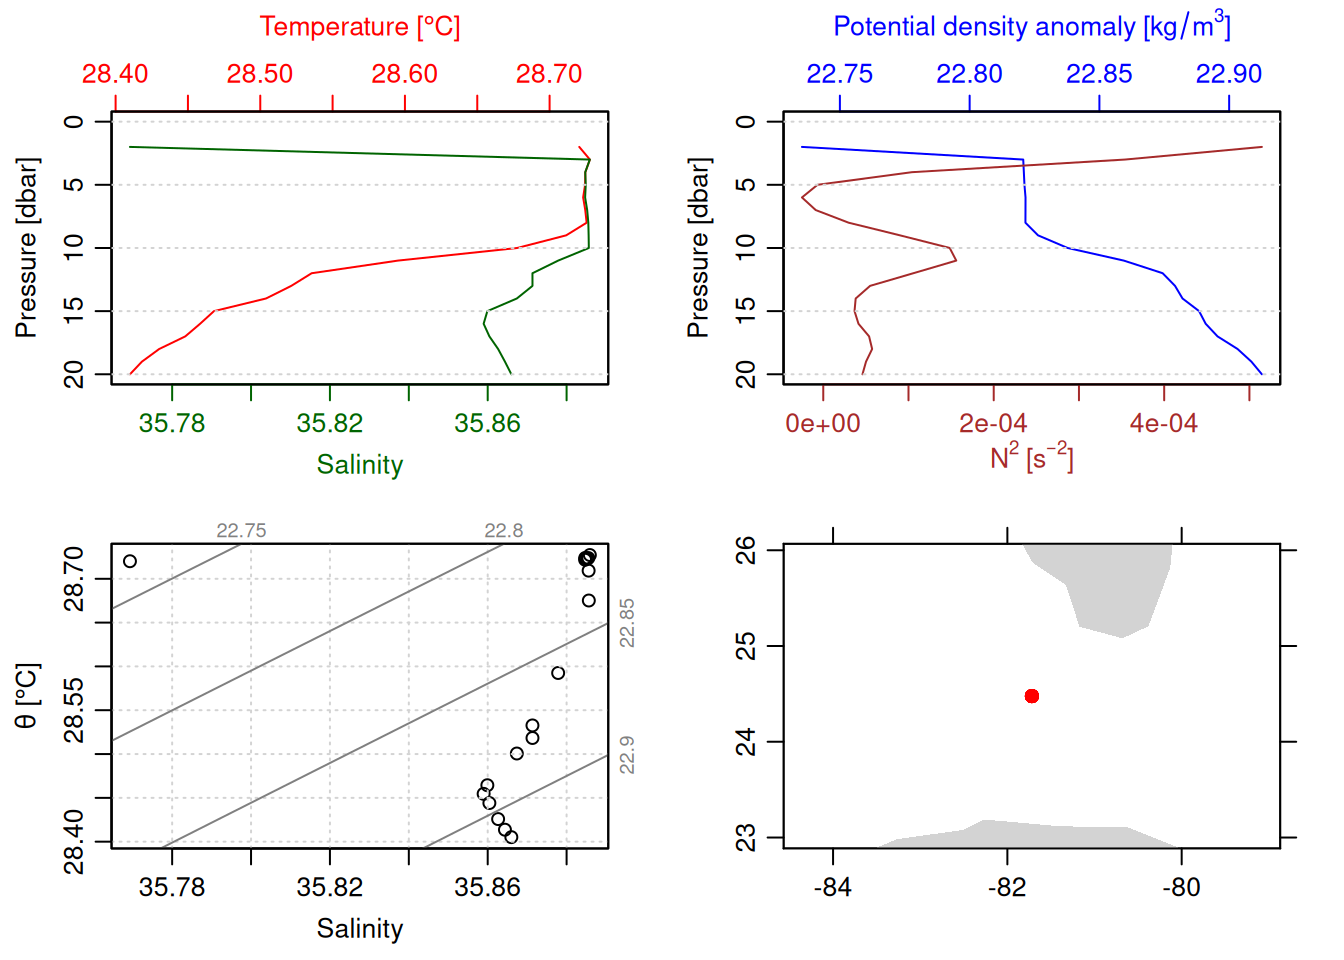
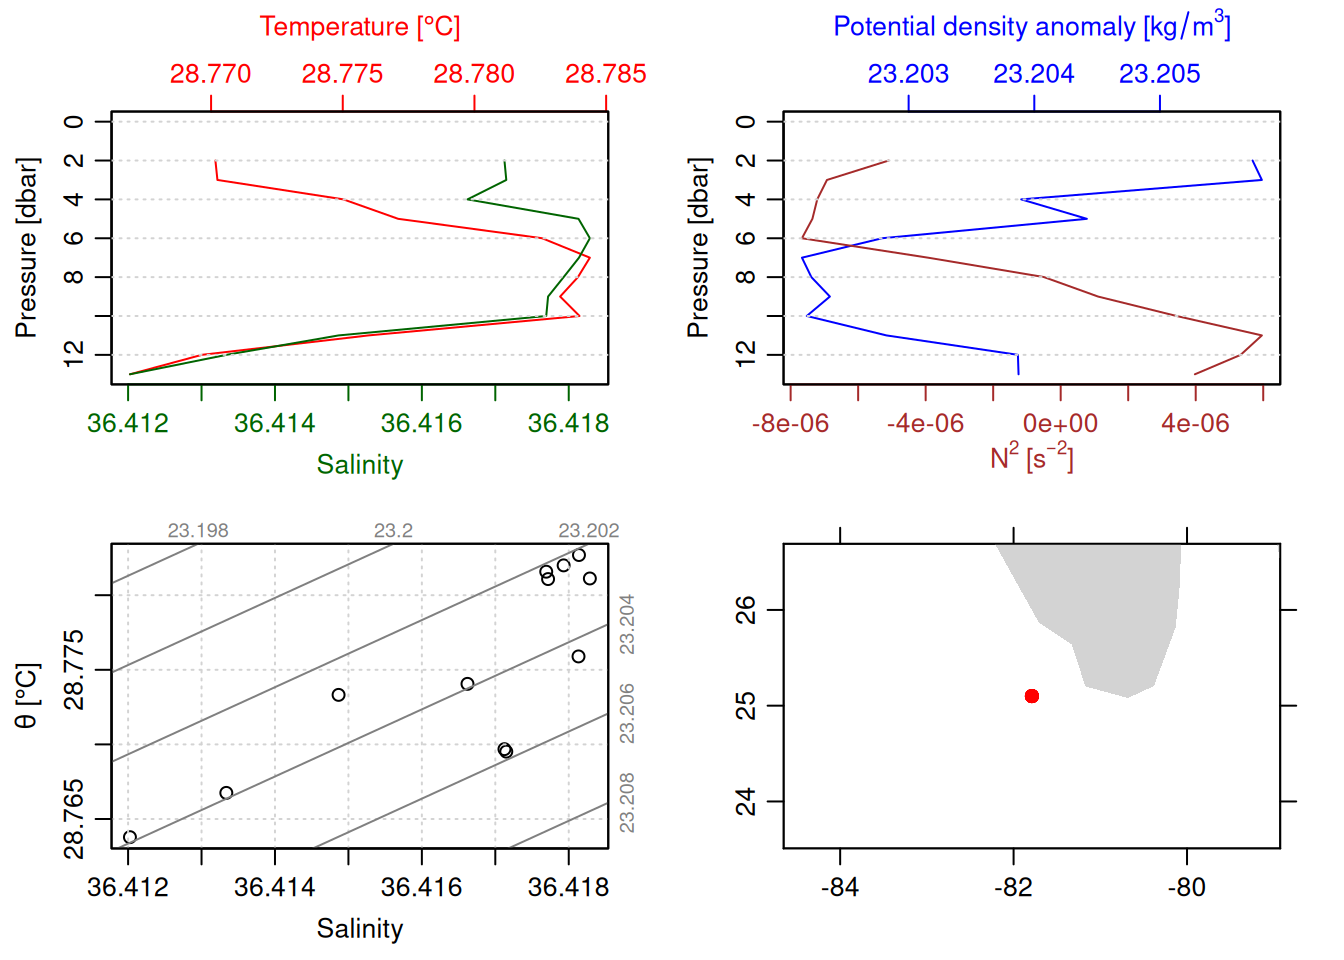
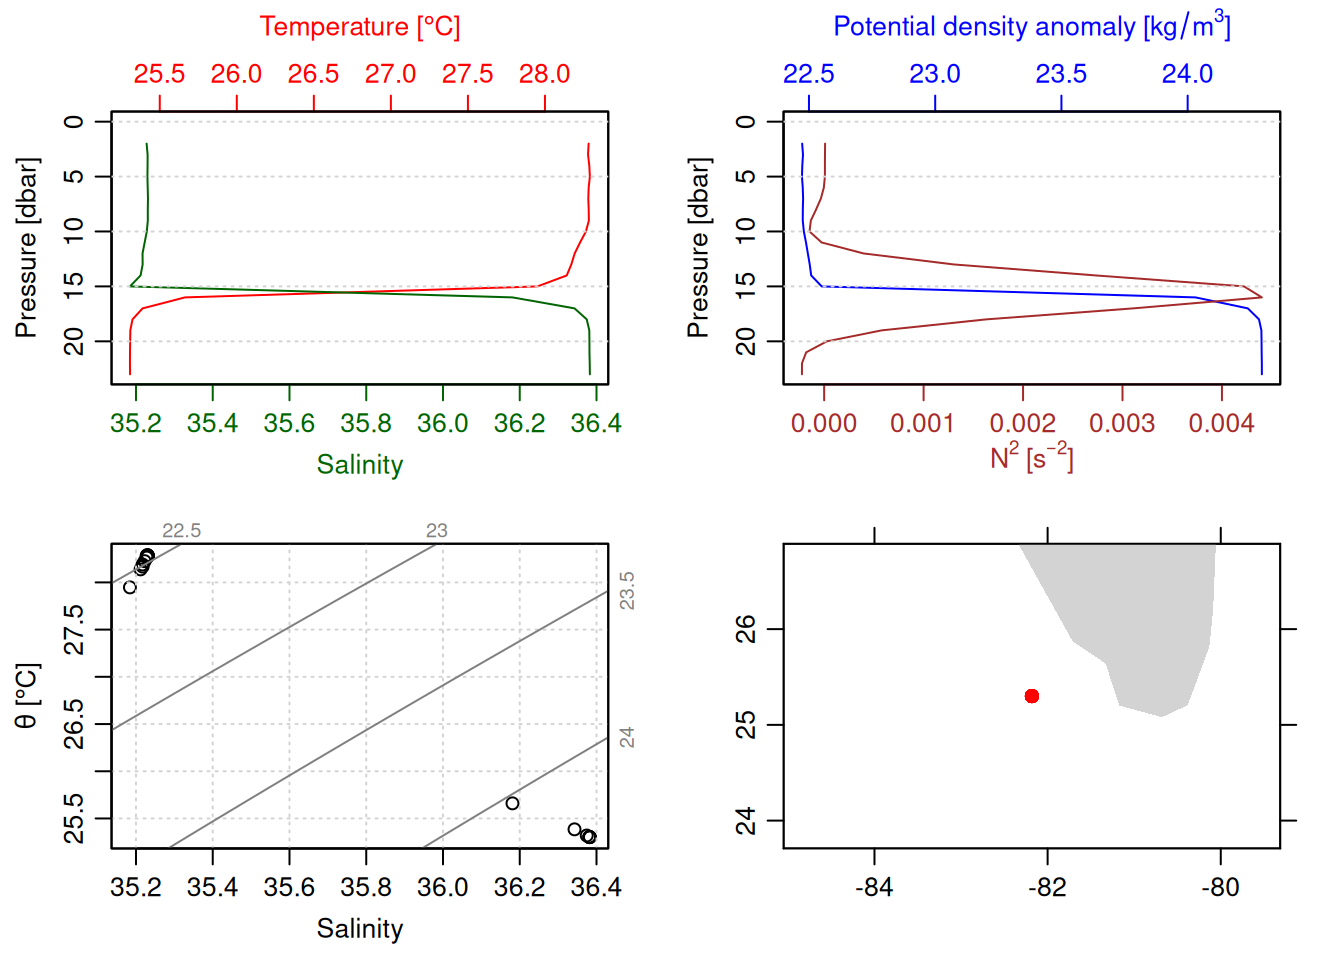
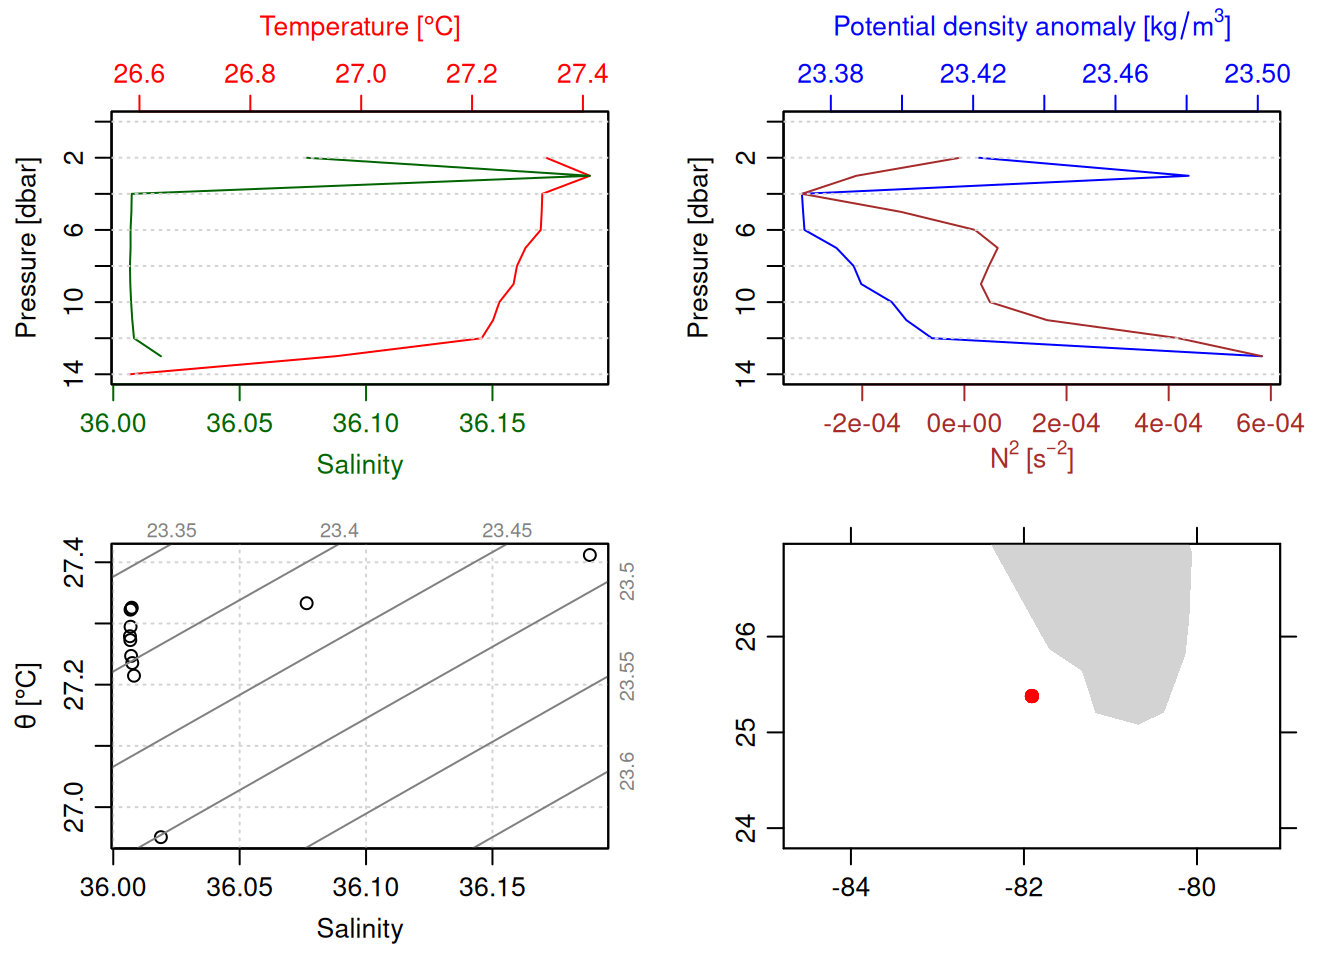
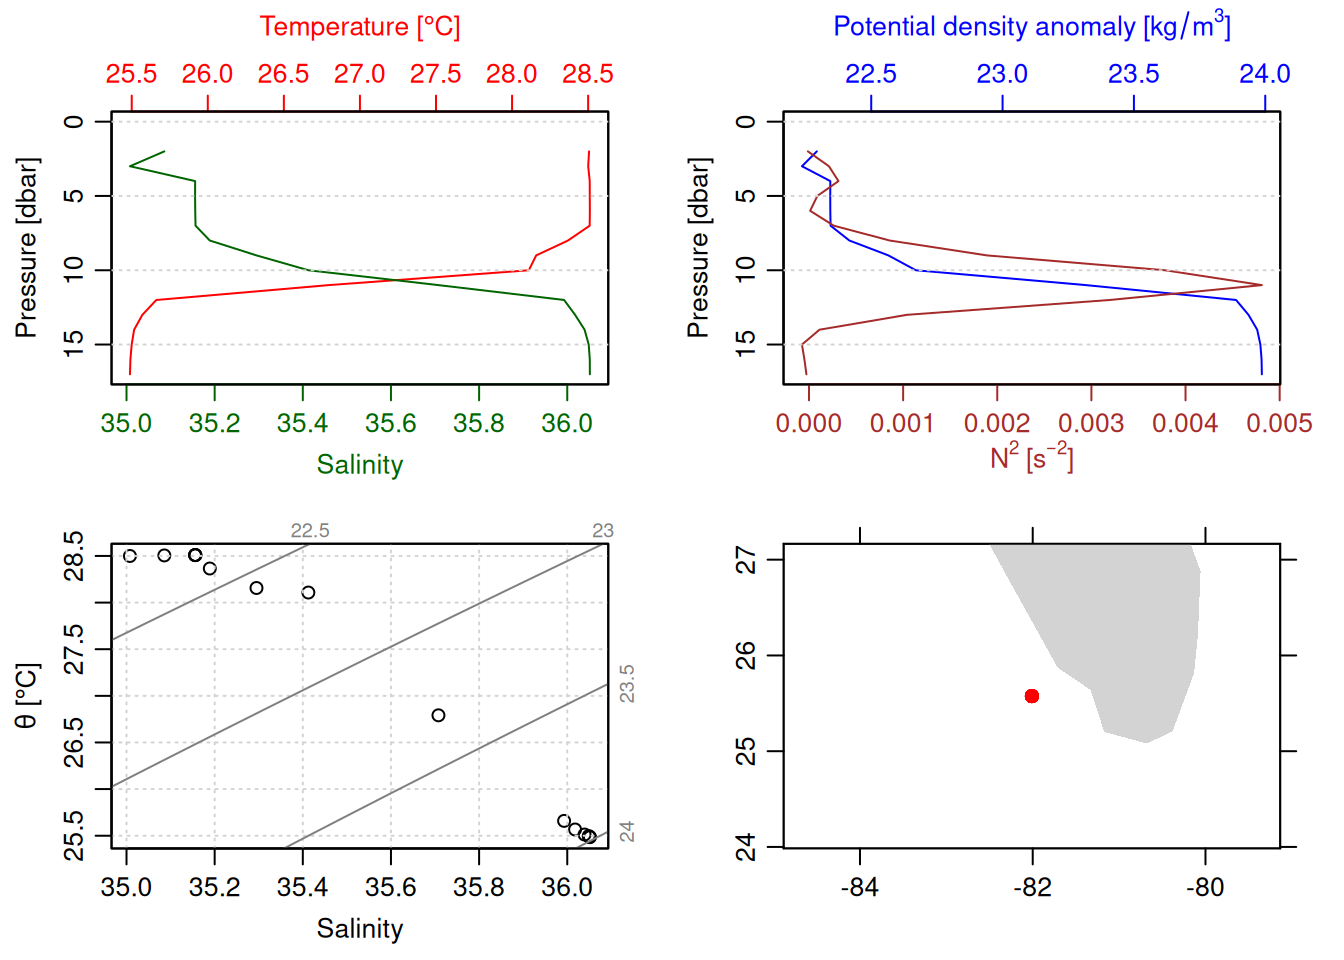
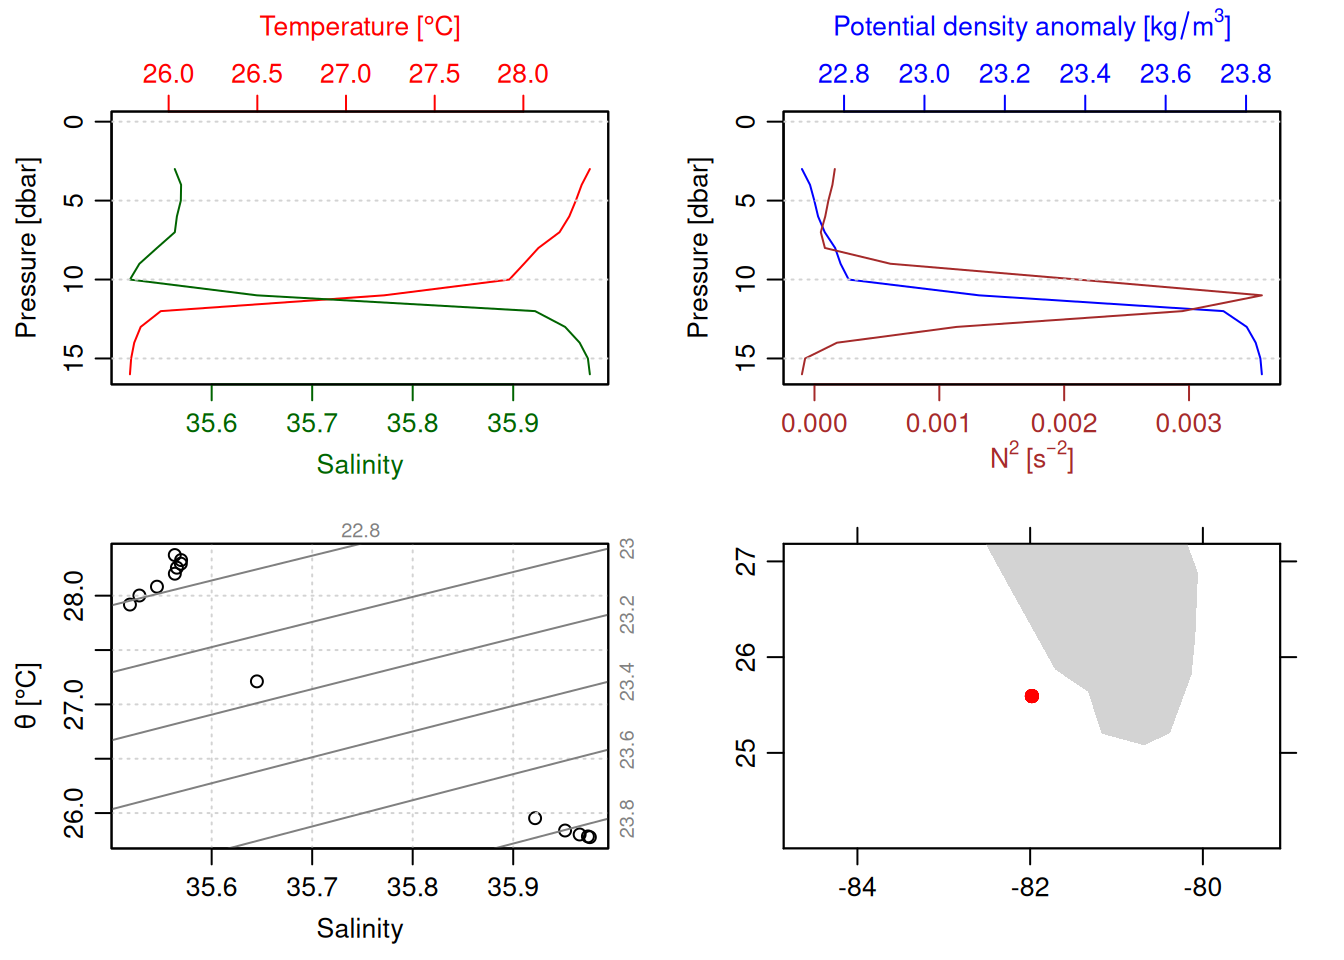
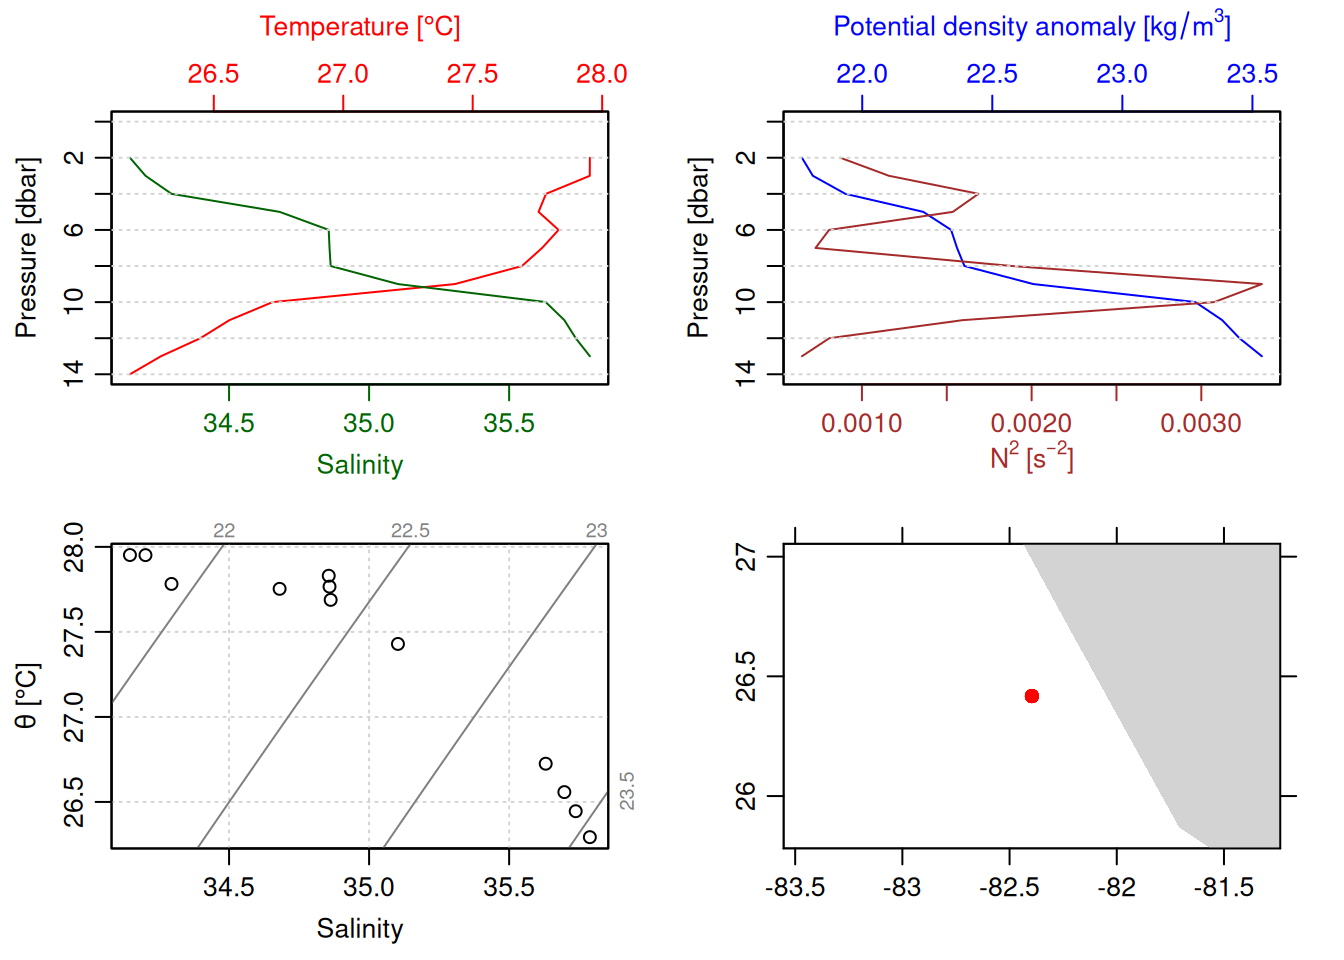
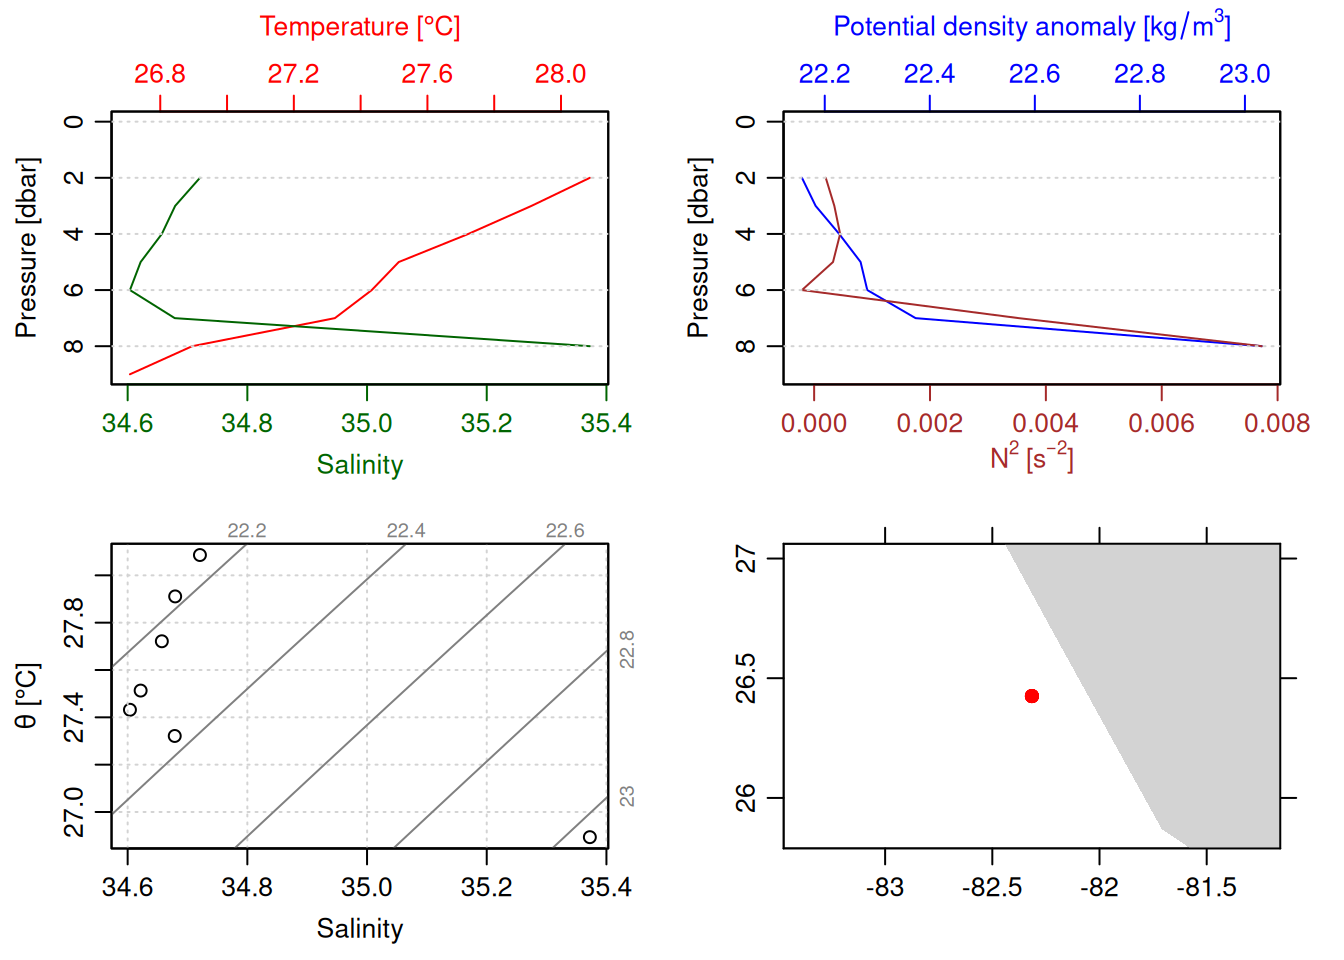
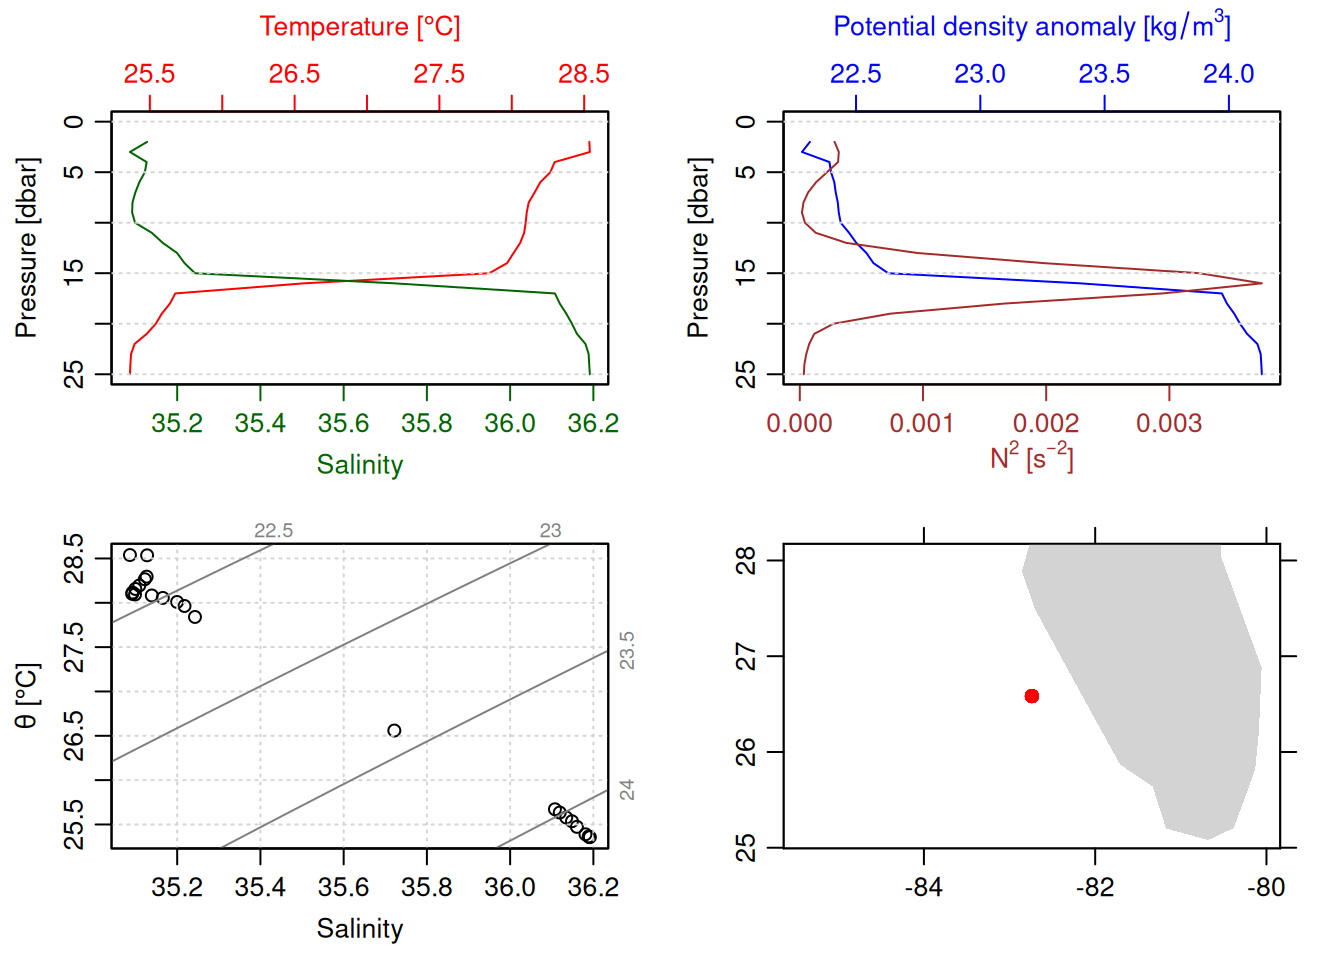
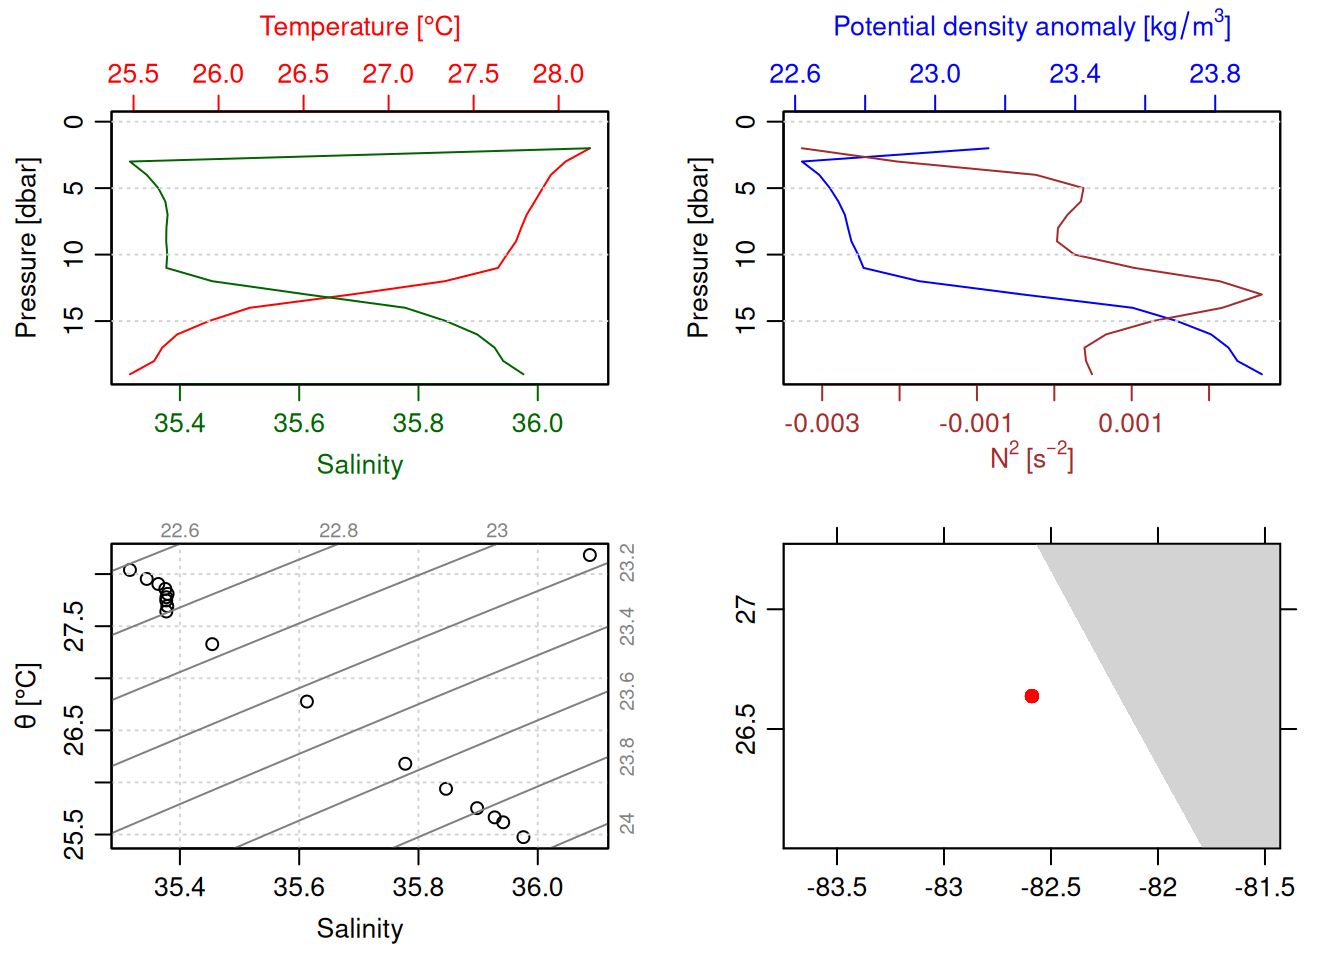
for (i inseq(ctd_FK)){ cast <- ctd_FK[[i]] # 1 is selecting only the first sublisttryCatch({plot(ctdDecimate(ctdTrim(cast))) }, error =function(e){print(e) })}
<simpleError in !is.null(x@metadata$station) && !is.na(x@metadata$station): 'length = 21' in coercion to 'logical(1)'>
<simpleError in !is.null(x@metadata$station) && !is.na(x@metadata$station): 'length = 5116' in coercion to 'logical(1)'>
<simpleError in !is.null(x@metadata$station) && !is.na(x@metadata$station): 'length = 4471' in coercion to 'logical(1)'>
<simpleError in !is.null(x@metadata$station) && !is.na(x@metadata$station): 'length = 9558' in coercion to 'logical(1)'>
<simpleError in !is.null(x@metadata$station) && !is.na(x@metadata$station): 'length = 6909' in coercion to 'logical(1)'>
<simpleError in !is.null(x@metadata$station) && !is.na(x@metadata$station): 'length = 3933' in coercion to 'logical(1)'>
<simpleError in !is.null(x@metadata$station) && !is.na(x@metadata$station): 'length = 3634' in coercion to 'logical(1)'>
<simpleError in !is.null(x@metadata$station) && !is.na(x@metadata$station): 'length = 4431' in coercion to 'logical(1)'>
<simpleError in !is.null(x@metadata$station) && !is.na(x@metadata$station): 'length = 2399' in coercion to 'logical(1)'>
<simpleError in !is.null(x@metadata$station) && !is.na(x@metadata$station): 'length = 3431' in coercion to 'logical(1)'>
<simpleError in !is.null(x@metadata$station) && !is.na(x@metadata$station): 'length = 2385' in coercion to 'logical(1)'>
<simpleError in !is.null(x@metadata$station) && !is.na(x@metadata$station): 'length = 1978' in coercion to 'logical(1)'>
<simpleError in !is.null(x@metadata$station) && !is.na(x@metadata$station): 'length = 4089' in coercion to 'logical(1)'>
<simpleError in !is.null(x@metadata$station) && !is.na(x@metadata$station): 'length = 3148' in coercion to 'logical(1)'>
<simpleError in !is.null(x@metadata$station) && !is.na(x@metadata$station): 'length = 2605' in coercion to 'logical(1)'>
<simpleError in !is.null(x@metadata$station) && !is.na(x@metadata$station): 'length = 3012' in coercion to 'logical(1)'>
<simpleError in !is.null(x@metadata$station) && !is.na(x@metadata$station): 'length = 2271' in coercion to 'logical(1)'>
<simpleError in !is.null(x@metadata$station) && !is.na(x@metadata$station): 'length = 1707' in coercion to 'logical(1)'>
<simpleError in !is.null(x@metadata$station) && !is.na(x@metadata$station): 'length = 5319' in coercion to 'logical(1)'>
<simpleError in !is.null(x@metadata$station) && !is.na(x@metadata$station): 'length = 2260' in coercion to 'logical(1)'>
<simpleError in !is.null(x@metadata$station) && !is.na(x@metadata$station): 'length = 3972' in coercion to 'logical(1)'>
<simpleError in !is.null(x@metadata$station) && !is.na(x@metadata$station): 'length = 3474' in coercion to 'logical(1)'>
<simpleError in !is.null(x@metadata$station) && !is.na(x@metadata$station): 'length = 3000' in coercion to 'logical(1)'>
<simpleError in !is.null(x@metadata$station) && !is.na(x@metadata$station): 'length = 4840' in coercion to 'logical(1)'>
<simpleError in !is.null(x@metadata$station) && !is.na(x@metadata$station): 'length = 2165' in coercion to 'logical(1)'>
<simpleError in !is.null(x@metadata$station) && !is.na(x@metadata$station): 'length = 3127' in coercion to 'logical(1)'>
<simpleError in !is.null(x@metadata$station) && !is.na(x@metadata$station): 'length = 3744' in coercion to 'logical(1)'>
<simpleError in !is.null(x@metadata$station) && !is.na(x@metadata$station): 'length = 3147' in coercion to 'logical(1)'>
<simpleError in h(simpleError(msg, call)): error in evaluating the argument 'x' in selecting a method for function 'plot': missing value where TRUE/FALSE needed>
<simpleError in !is.null(x@metadata$station) && !is.na(x@metadata$station): 'length = 2397' in coercion to 'logical(1)'>
<simpleError in !is.null(x@metadata$station) && !is.na(x@metadata$station): 'length = 2746' in coercion to 'logical(1)'>
<simpleError in !is.null(x@metadata$station) && !is.na(x@metadata$station): 'length = 3784' in coercion to 'logical(1)'>
<simpleError in !is.null(x@metadata$station) && !is.na(x@metadata$station): 'length = 3020' in coercion to 'logical(1)'>
<simpleError in !is.null(x@metadata$station) && !is.na(x@metadata$station): 'length = 6003' in coercion to 'logical(1)'>
<simpleError in !is.null(x@metadata$station) && !is.na(x@metadata$station): 'length = 2137' in coercion to 'logical(1)'>
<simpleError in !is.null(x@metadata$station) && !is.na(x@metadata$station): 'length = 2914' in coercion to 'logical(1)'>
<simpleError in !is.null(x@metadata$station) && !is.na(x@metadata$station): 'length = 2863' in coercion to 'logical(1)'>
<simpleError in !is.null(x@metadata$station) && !is.na(x@metadata$station): 'length = 4403' in coercion to 'logical(1)'>
<simpleError in !is.null(x@metadata$station) && !is.na(x@metadata$station): 'length = 5390' in coercion to 'logical(1)'>
<simpleError in !is.null(x@metadata$station) && !is.na(x@metadata$station): 'length = 3449' in coercion to 'logical(1)'>
<simpleError in !is.null(x@metadata$station) && !is.na(x@metadata$station): 'length = 5113' in coercion to 'logical(1)'>
<simpleError in !is.null(x@metadata$station) && !is.na(x@metadata$station): 'length = 4046' in coercion to 'logical(1)'>
<simpleError in !is.null(x@metadata$station) && !is.na(x@metadata$station): 'length = 3482' in coercion to 'logical(1)'>
<simpleError in !is.null(x@metadata$station) && !is.na(x@metadata$station): 'length = 3283' in coercion to 'logical(1)'>
<simpleError in !is.null(x@metadata$station) && !is.na(x@metadata$station): 'length = 3238' in coercion to 'logical(1)'>
<simpleError in !is.null(x@metadata$station) && !is.na(x@metadata$station): 'length = 3721' in coercion to 'logical(1)'>
<simpleError in !is.null(x@metadata$station) && !is.na(x@metadata$station): 'length = 2970' in coercion to 'logical(1)'>
<simpleError in !is.null(x@metadata$station) && !is.na(x@metadata$station): 'length = 4057' in coercion to 'logical(1)'>
<simpleError in !is.null(x@metadata$station) && !is.na(x@metadata$station): 'length = 4678' in coercion to 'logical(1)'>
<simpleError in !is.null(x@metadata$station) && !is.na(x@metadata$station): 'length = 5853' in coercion to 'logical(1)'>
<simpleError in !is.null(x@metadata$station) && !is.na(x@metadata$station): 'length = 1405' in coercion to 'logical(1)'>
<simpleError in !is.null(x@metadata$station) && !is.na(x@metadata$station): 'length = 3105' in coercion to 'logical(1)'>
<simpleError in !is.null(x@metadata$station) && !is.na(x@metadata$station): 'length = 2513' in coercion to 'logical(1)'>
<simpleError in !is.null(x@metadata$station) && !is.na(x@metadata$station): 'length = 4441' in coercion to 'logical(1)'>
<simpleError in !is.null(x@metadata$station) && !is.na(x@metadata$station): 'length = 2743' in coercion to 'logical(1)'>
<simpleError in !is.null(x@metadata$station) && !is.na(x@metadata$station): 'length = 3050' in coercion to 'logical(1)'>
<simpleError in !is.null(x@metadata$station) && !is.na(x@metadata$station): 'length = 3415' in coercion to 'logical(1)'>
<simpleError in !is.null(x@metadata$station) && !is.na(x@metadata$station): 'length = 4962' in coercion to 'logical(1)'>
<simpleError in !is.null(x@metadata$station) && !is.na(x@metadata$station): 'length = 4495' in coercion to 'logical(1)'>
<simpleError in !is.null(x@metadata$station) && !is.na(x@metadata$station): 'length = 2757' in coercion to 'logical(1)'>
<simpleError in !is.null(x@metadata$station) && !is.na(x@metadata$station): 'length = 6554' in coercion to 'logical(1)'>
<simpleError in !is.null(x@metadata$station) && !is.na(x@metadata$station): 'length = 3417' in coercion to 'logical(1)'>
<simpleError in !is.null(x@metadata$station) && !is.na(x@metadata$station): 'length = 2325' in coercion to 'logical(1)'>
<simpleError in !is.null(x@metadata$station) && !is.na(x@metadata$station): 'length = 4617' in coercion to 'logical(1)'>
<simpleError in !is.null(x@metadata$station) && !is.na(x@metadata$station): 'length = 2991' in coercion to 'logical(1)'>
<simpleError in !is.null(x@metadata$station) && !is.na(x@metadata$station): 'length = 3186' in coercion to 'logical(1)'>
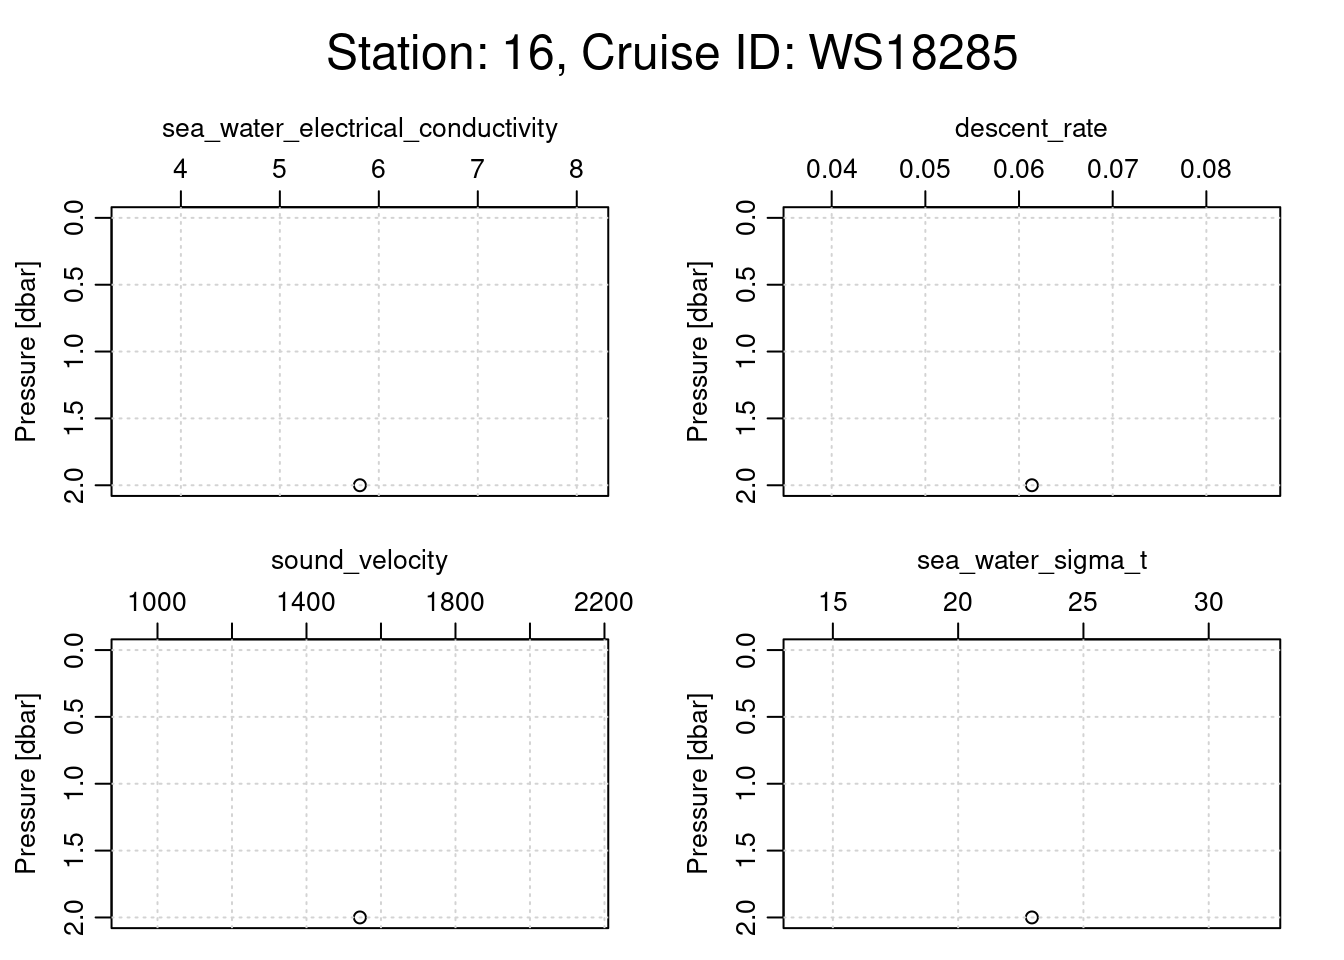
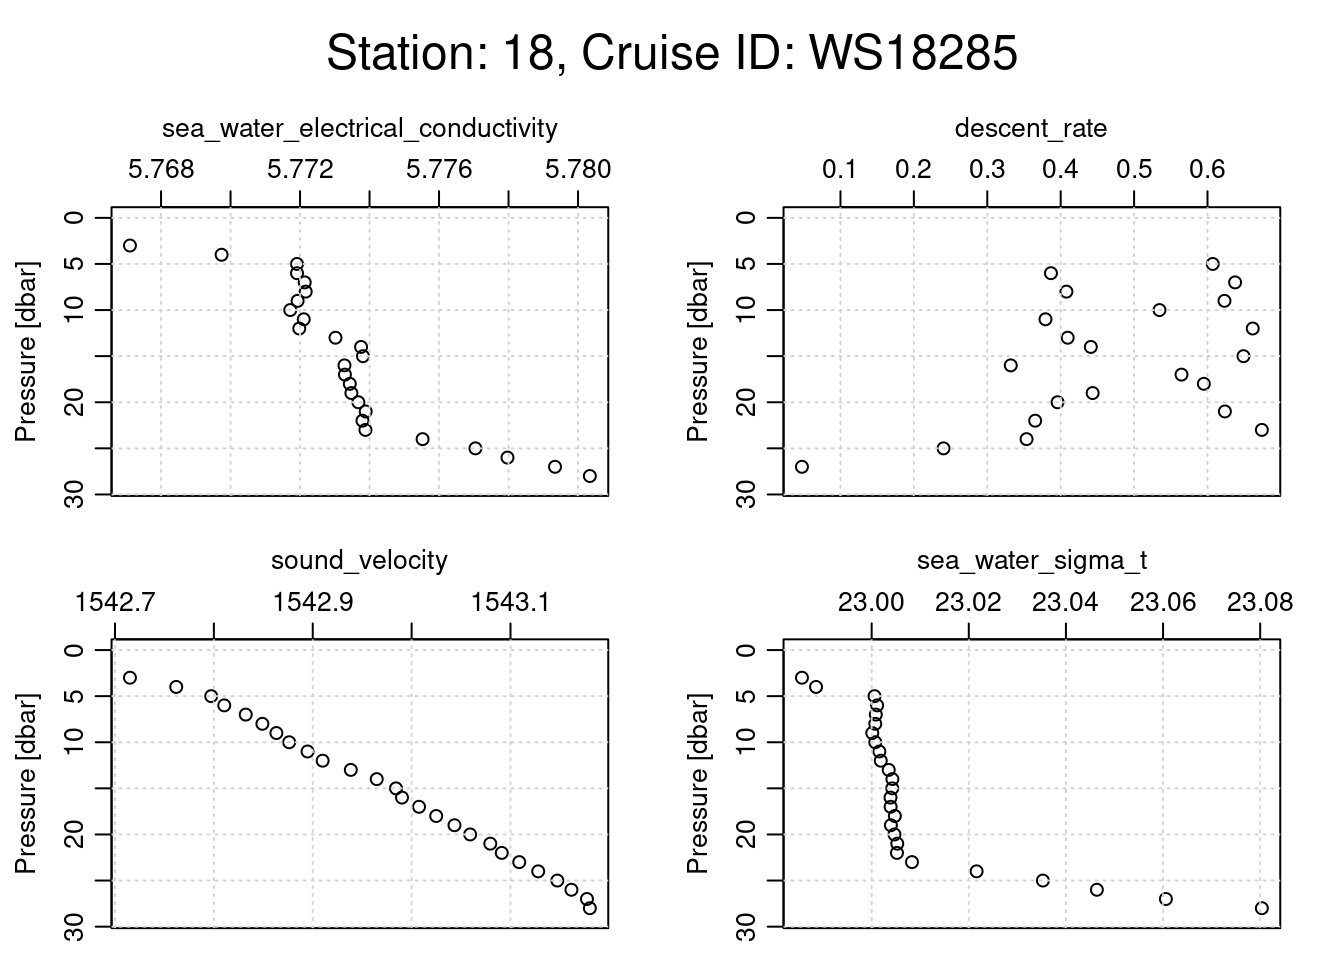
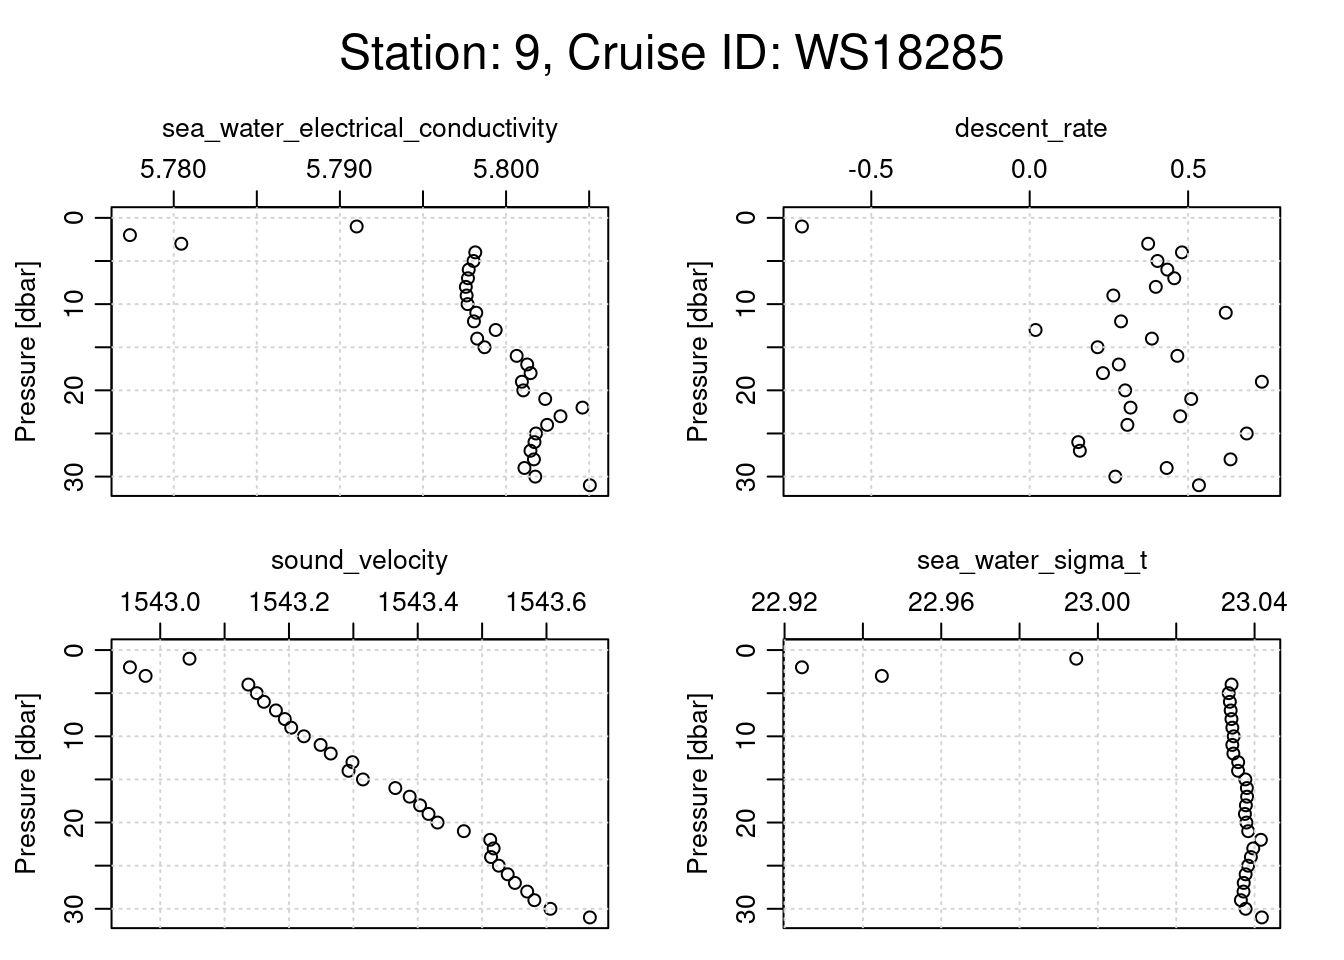
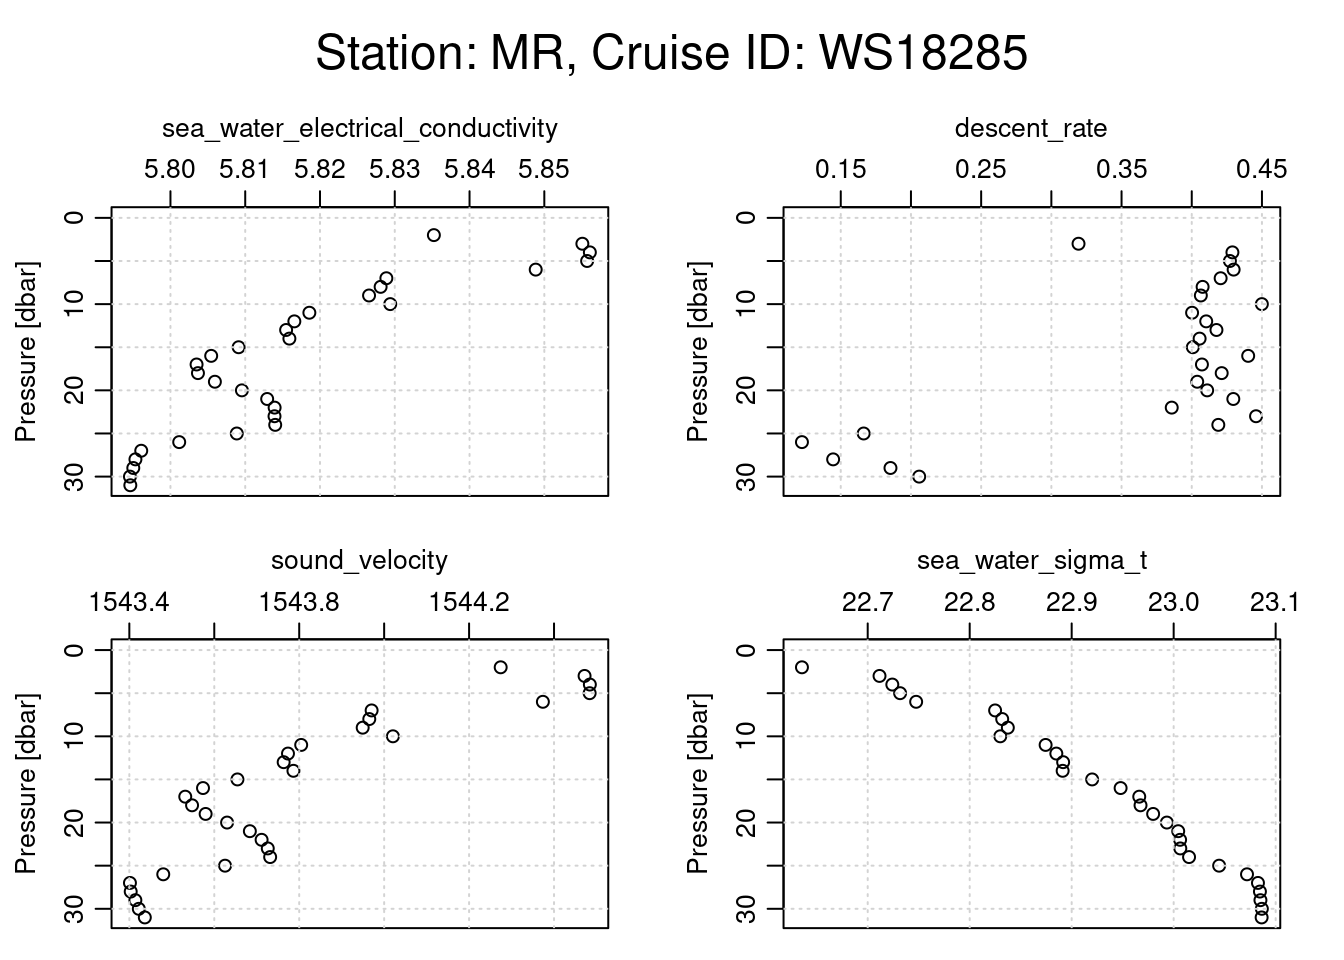
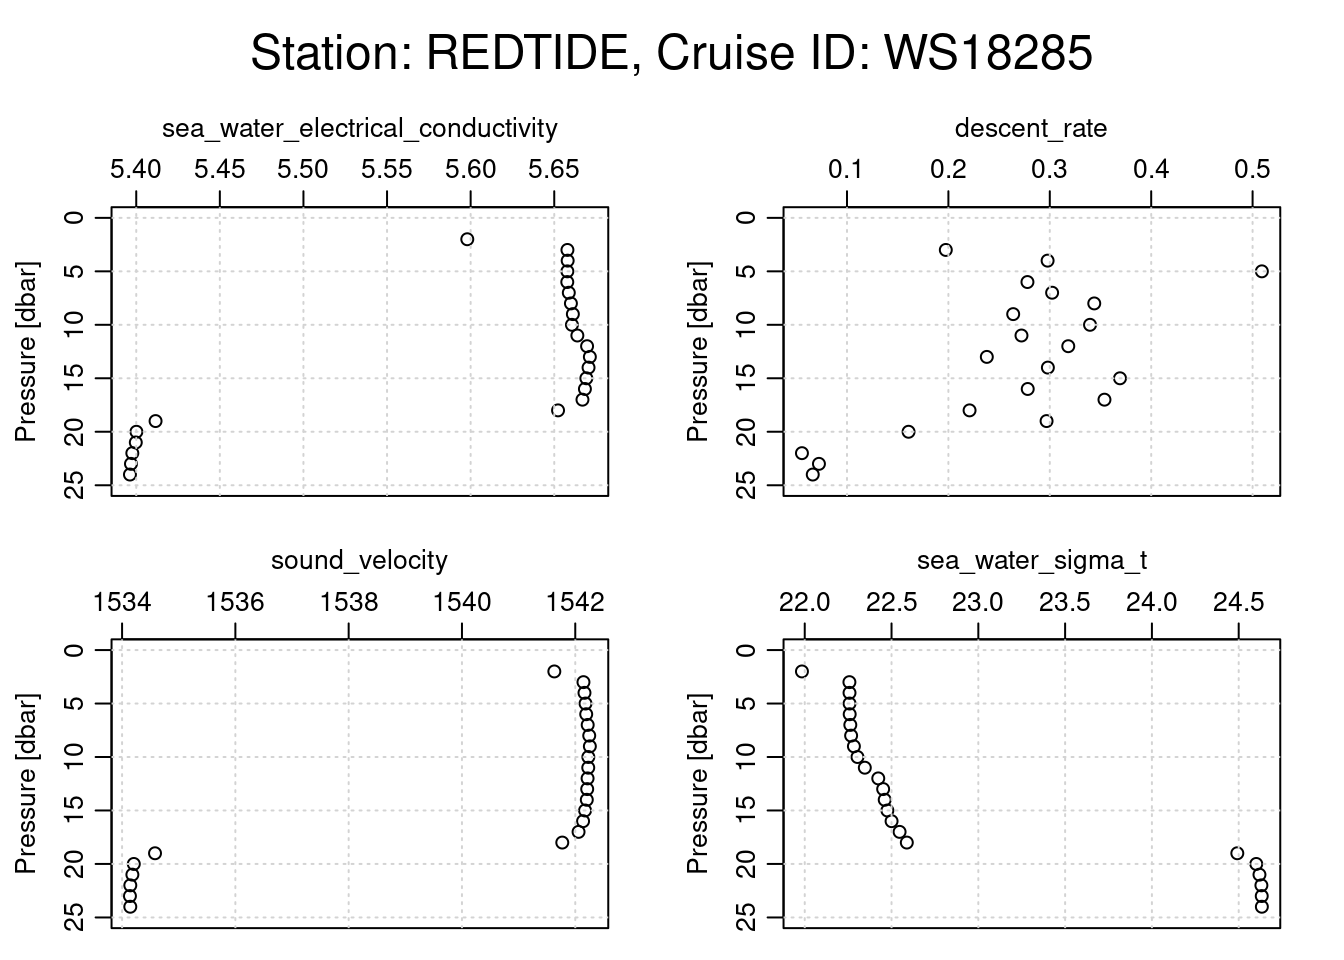
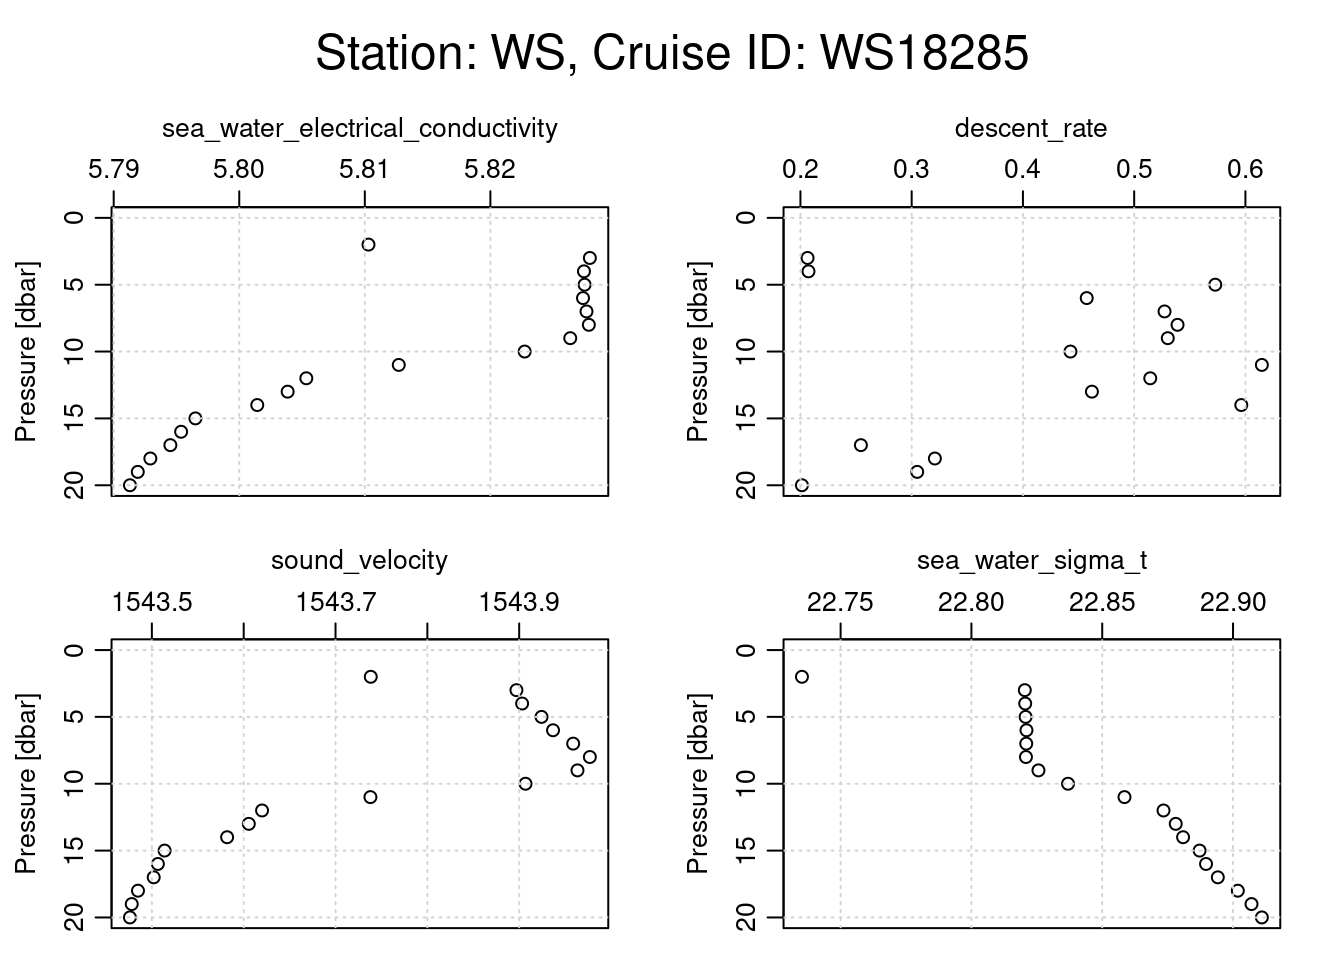
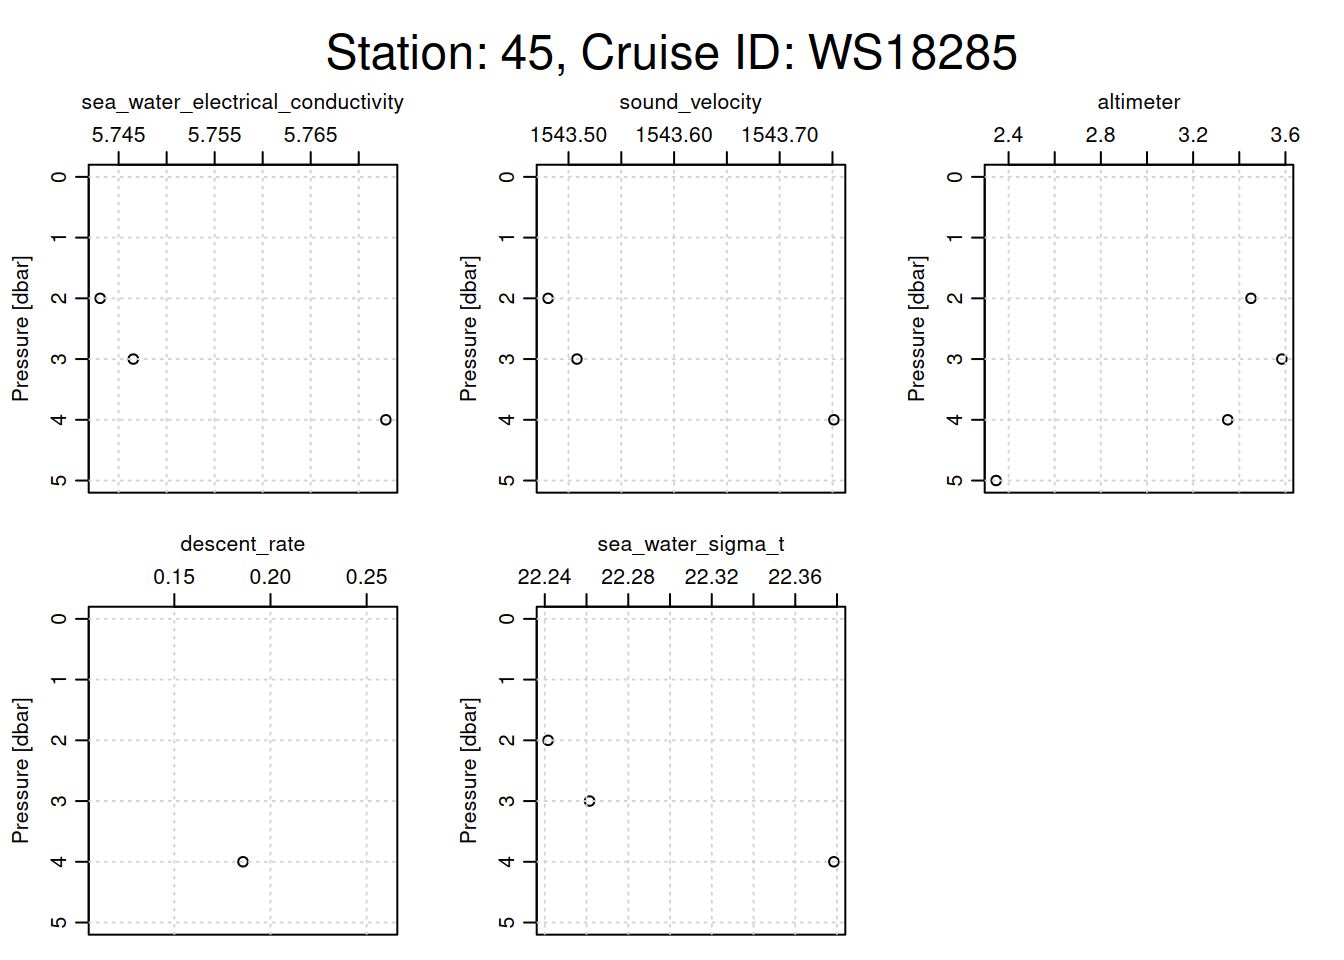
plotting other physical parameters for each cast
# Loop through each CTD castfor (i inseq(ctd_FK)){ cast <- ctd_FK[[i]] # Assuming each sublist contains only one relevant CTD objecttryCatch({# Extract metadata for station name and cruise ID station_name <- cast@metadata$station[1] cruise_id <- cast@data$cruise_id[1]# Generate a title with station name and cruise ID overall_title <- glue::glue("Station: {station_name}, Cruise ID: {cruise_id}")# Set margins: increase the outer margin for the titlepar(oma =c(0, 0, 3, 0)) # Top outer margin increased for title# Plotting function with specific parameters oce::plot(x =ctdDecimate(ctdTrim(cast)),which =c("sea_water_electrical_conductivity","descent_rate", "sound_velocity","sea_water_sigma_t","altimeter" ),main =""# No main title for individual subplots )# Place a single overall title at the top of the plot framemtext(overall_title, side =3, line =1, outer =TRUE, cex =1.5)# Reset outer margins to defaultpar(oma =c(0, 0, 0, 0)) }, error =function(e) {print(e$message) # Print any errors that occur during plotting })}
[1] "need finite 'xlim' values"
[1] "need finite 'xlim' values"
[1] "need finite 'xlim' values"
[1] "need finite 'xlim' values"
[1] "error in evaluating the argument 'x' in selecting a method for function 'plot': missing value where TRUE/FALSE needed"
[1] "need finite 'xlim' values"
[1] "need finite 'xlim' values"
[1] "need finite 'xlim' values"
plotting other nutrient parameters for each cast
# Loop through each CTD castfor (i inseq(ctd_FK)){ cast <- ctd_FK[[i]] # Assuming each sublist contains only one relevant CTD objecttryCatch({# Extract metadata for station name and cruise ID station_name <- cast@metadata$station[1] cruise_id <- cast@data$cruise_id[1]# Generate a title with station name and cruise ID overall_title <- glue::glue("Station: {station_name}, Cruise ID: {cruise_id}")# Set margins: increase the outer margin for the titlepar(oma =c(0, 0, 3, 0)) # Top outer margin increased for title# Plotting function with specific parameters oce::plot(x =ctdDecimate(ctdTrim(cast)),which =c("CDOM", "dissolved_oxygen","oxygen_saturation","chlorophyll_concentration", "chlorophyll_fluorescence" ),main =""# No main title for individual subplots )# Place a single overall title at the top of the plot framemtext(overall_title, side =3, line =1, outer =TRUE, cex =1.5)# Reset outer margins to defaultpar(oma =c(0, 0, 0, 0)) }, error =function(e) {print(e$message) # Print any errors that occur during plotting })}
[1] "In plot,ctd-method() : which=\"CDOMdissolved_oxygenoxygen_saturationchlorophyll_concentrationchlorophyll_fluorescence\" cannot be handled"
[1] "In plot,ctd-method() : which=\"CDOMdissolved_oxygenoxygen_saturationchlorophyll_concentrationchlorophyll_fluorescence\" cannot be handled"
[1] "In plot,ctd-method() : which=\"CDOMdissolved_oxygenoxygen_saturationchlorophyll_concentrationchlorophyll_fluorescence\" cannot be handled"
[1] "In plot,ctd-method() : which=\"CDOMdissolved_oxygenoxygen_saturationchlorophyll_concentrationchlorophyll_fluorescence\" cannot be handled"
[1] "In plot,ctd-method() : which=\"CDOMdissolved_oxygenoxygen_saturationchlorophyll_concentrationchlorophyll_fluorescence\" cannot be handled"
[1] "In plot,ctd-method() : which=\"CDOMdissolved_oxygenoxygen_saturationchlorophyll_concentrationchlorophyll_fluorescence\" cannot be handled"
[1] "In plot,ctd-method() : which=\"CDOMdissolved_oxygenoxygen_saturationchlorophyll_concentrationchlorophyll_fluorescence\" cannot be handled"
[1] "In plot,ctd-method() : which=\"CDOMdissolved_oxygenoxygen_saturationchlorophyll_concentrationchlorophyll_fluorescence\" cannot be handled"
[1] "In plot,ctd-method() : which=\"CDOMdissolved_oxygenoxygen_saturationchlorophyll_concentrationchlorophyll_fluorescence\" cannot be handled"
[1] "In plot,ctd-method() : which=\"CDOMdissolved_oxygenoxygen_saturationchlorophyll_concentrationchlorophyll_fluorescence\" cannot be handled"
[1] "In plot,ctd-method() : which=\"CDOMdissolved_oxygenoxygen_saturationchlorophyll_concentrationchlorophyll_fluorescence\" cannot be handled"
[1] "In plot,ctd-method() : which=\"CDOMdissolved_oxygenoxygen_saturationchlorophyll_concentrationchlorophyll_fluorescence\" cannot be handled"
[1] "plot.new has not been called yet"
[1] "In plot,ctd-method() : which=\"CDOMdissolved_oxygenoxygen_saturationchlorophyll_concentrationchlorophyll_fluorescence\" cannot be handled"
[1] "In plot,ctd-method() : which=\"CDOMdissolved_oxygenoxygen_saturationchlorophyll_concentrationchlorophyll_fluorescence\" cannot be handled"
[1] "In plot,ctd-method() : which=\"CDOMdissolved_oxygenoxygen_saturationchlorophyll_concentrationchlorophyll_fluorescence\" cannot be handled"
[1] "In plot,ctd-method() : which=\"CDOMdissolved_oxygenoxygen_saturationchlorophyll_concentrationchlorophyll_fluorescence\" cannot be handled"
[1] "In plot,ctd-method() : which=\"CDOMdissolved_oxygenoxygen_saturationchlorophyll_concentrationchlorophyll_fluorescence\" cannot be handled"
[1] "In plot,ctd-method() : which=\"CDOMdissolved_oxygenoxygen_saturationchlorophyll_concentrationchlorophyll_fluorescence\" cannot be handled"
[1] "In plot,ctd-method() : which=\"CDOMdissolved_oxygenoxygen_saturationchlorophyll_concentrationchlorophyll_fluorescence\" cannot be handled"
[1] "In plot,ctd-method() : which=\"CDOMdissolved_oxygenoxygen_saturationchlorophyll_concentrationchlorophyll_fluorescence\" cannot be handled"
[1] "In plot,ctd-method() : which=\"CDOMdissolved_oxygenoxygen_saturationchlorophyll_concentrationchlorophyll_fluorescence\" cannot be handled"
[1] "In plot,ctd-method() : which=\"CDOMdissolved_oxygenoxygen_saturationchlorophyll_concentrationchlorophyll_fluorescence\" cannot be handled"
[1] "In plot,ctd-method() : which=\"CDOMdissolved_oxygenoxygen_saturationchlorophyll_concentrationchlorophyll_fluorescence\" cannot be handled"
[1] "In plot,ctd-method() : which=\"CDOMdissolved_oxygenoxygen_saturationchlorophyll_concentrationchlorophyll_fluorescence\" cannot be handled"
[1] "In plot,ctd-method() : which=\"CDOMdissolved_oxygenoxygen_saturationchlorophyll_concentrationchlorophyll_fluorescence\" cannot be handled"
[1] "In plot,ctd-method() : which=\"CDOMdissolved_oxygenoxygen_saturationchlorophyll_concentrationchlorophyll_fluorescence\" cannot be handled"
[1] "In plot,ctd-method() : which=\"CDOMdissolved_oxygenoxygen_saturationchlorophyll_concentrationchlorophyll_fluorescence\" cannot be handled"
[1] "In plot,ctd-method() : which=\"CDOMdissolved_oxygenoxygen_saturationchlorophyll_concentrationchlorophyll_fluorescence\" cannot be handled"
[1] "In plot,ctd-method() : which=\"CDOMdissolved_oxygenoxygen_saturationchlorophyll_concentrationchlorophyll_fluorescence\" cannot be handled"
[1] "plot.new has not been called yet"
[1] "error in evaluating the argument 'x' in selecting a method for function 'plot': missing value where TRUE/FALSE needed"
[1] "In plot,ctd-method() : which=\"CDOMdissolved_oxygenoxygen_saturationchlorophyll_concentrationchlorophyll_fluorescence\" cannot be handled"
[1] "In plot,ctd-method() : which=\"CDOMdissolved_oxygenoxygen_saturationchlorophyll_concentrationchlorophyll_fluorescence\" cannot be handled"
[1] "In plot,ctd-method() : which=\"CDOMdissolved_oxygenoxygen_saturationchlorophyll_concentrationchlorophyll_fluorescence\" cannot be handled"
[1] "In plot,ctd-method() : which=\"CDOMdissolved_oxygenoxygen_saturationchlorophyll_concentrationchlorophyll_fluorescence\" cannot be handled"
[1] "In plot,ctd-method() : which=\"CDOMdissolved_oxygenoxygen_saturationchlorophyll_concentrationchlorophyll_fluorescence\" cannot be handled"
[1] "In plot,ctd-method() : which=\"CDOMdissolved_oxygenoxygen_saturationchlorophyll_concentrationchlorophyll_fluorescence\" cannot be handled"
[1] "In plot,ctd-method() : which=\"CDOMdissolved_oxygenoxygen_saturationchlorophyll_concentrationchlorophyll_fluorescence\" cannot be handled"
[1] "In plot,ctd-method() : which=\"CDOMdissolved_oxygenoxygen_saturationchlorophyll_concentrationchlorophyll_fluorescence\" cannot be handled"
[1] "In plot,ctd-method() : which=\"CDOMdissolved_oxygenoxygen_saturationchlorophyll_concentrationchlorophyll_fluorescence\" cannot be handled"
[1] "In plot,ctd-method() : which=\"CDOMdissolved_oxygenoxygen_saturationchlorophyll_concentrationchlorophyll_fluorescence\" cannot be handled"
[1] "In plot,ctd-method() : which=\"CDOMdissolved_oxygenoxygen_saturationchlorophyll_concentrationchlorophyll_fluorescence\" cannot be handled"
[1] "In plot,ctd-method() : which=\"CDOMdissolved_oxygenoxygen_saturationchlorophyll_concentrationchlorophyll_fluorescence\" cannot be handled"
[1] "In plot,ctd-method() : which=\"CDOMdissolved_oxygenoxygen_saturationchlorophyll_concentrationchlorophyll_fluorescence\" cannot be handled"
[1] "In plot,ctd-method() : which=\"CDOMdissolved_oxygenoxygen_saturationchlorophyll_concentrationchlorophyll_fluorescence\" cannot be handled"
[1] "In plot,ctd-method() : which=\"CDOMdissolved_oxygenoxygen_saturationchlorophyll_concentrationchlorophyll_fluorescence\" cannot be handled"
[1] "In plot,ctd-method() : which=\"CDOMdissolved_oxygenoxygen_saturationchlorophyll_concentrationchlorophyll_fluorescence\" cannot be handled"
[1] "In plot,ctd-method() : which=\"CDOMdissolved_oxygenoxygen_saturationchlorophyll_concentrationchlorophyll_fluorescence\" cannot be handled"
[1] "In plot,ctd-method() : which=\"CDOMdissolved_oxygenoxygen_saturationchlorophyll_concentrationchlorophyll_fluorescence\" cannot be handled"
[1] "In plot,ctd-method() : which=\"CDOMdissolved_oxygenoxygen_saturationchlorophyll_concentrationchlorophyll_fluorescence\" cannot be handled"
[1] "In plot,ctd-method() : which=\"CDOMdissolved_oxygenoxygen_saturationchlorophyll_concentrationchlorophyll_fluorescence\" cannot be handled"
[1] "In plot,ctd-method() : which=\"CDOMdissolved_oxygenoxygen_saturationchlorophyll_concentrationchlorophyll_fluorescence\" cannot be handled"
[1] "In plot,ctd-method() : which=\"CDOMdissolved_oxygenoxygen_saturationchlorophyll_concentrationchlorophyll_fluorescence\" cannot be handled"
[1] "In plot,ctd-method() : which=\"CDOMdissolved_oxygenoxygen_saturationchlorophyll_concentrationchlorophyll_fluorescence\" cannot be handled"
[1] "In plot,ctd-method() : which=\"CDOMdissolved_oxygenoxygen_saturationchlorophyll_concentrationchlorophyll_fluorescence\" cannot be handled"
[1] "In plot,ctd-method() : which=\"CDOMdissolved_oxygenoxygen_saturationchlorophyll_concentrationchlorophyll_fluorescence\" cannot be handled"
[1] "In plot,ctd-method() : which=\"CDOMdissolved_oxygenoxygen_saturationchlorophyll_concentrationchlorophyll_fluorescence\" cannot be handled"
[1] "In plot,ctd-method() : which=\"CDOMdissolved_oxygenoxygen_saturationchlorophyll_concentrationchlorophyll_fluorescence\" cannot be handled"
[1] "In plot,ctd-method() : which=\"CDOMdissolved_oxygenoxygen_saturationchlorophyll_concentrationchlorophyll_fluorescence\" cannot be handled"
[1] "In plot,ctd-method() : which=\"CDOMdissolved_oxygenoxygen_saturationchlorophyll_concentrationchlorophyll_fluorescence\" cannot be handled"
[1] "In plot,ctd-method() : which=\"CDOMdissolved_oxygenoxygen_saturationchlorophyll_concentrationchlorophyll_fluorescence\" cannot be handled"
[1] "In plot,ctd-method() : which=\"CDOMdissolved_oxygenoxygen_saturationchlorophyll_concentrationchlorophyll_fluorescence\" cannot be handled"
[1] "In plot,ctd-method() : which=\"CDOMdissolved_oxygenoxygen_saturationchlorophyll_concentrationchlorophyll_fluorescence\" cannot be handled"
[1] "In plot,ctd-method() : which=\"CDOMdissolved_oxygenoxygen_saturationchlorophyll_concentrationchlorophyll_fluorescence\" cannot be handled"
[1] "In plot,ctd-method() : which=\"CDOMdissolved_oxygenoxygen_saturationchlorophyll_concentrationchlorophyll_fluorescence\" cannot be handled"
[1] "In plot,ctd-method() : which=\"CDOMdissolved_oxygenoxygen_saturationchlorophyll_concentrationchlorophyll_fluorescence\" cannot be handled"
[1] "In plot,ctd-method() : which=\"CDOMdissolved_oxygenoxygen_saturationchlorophyll_concentrationchlorophyll_fluorescence\" cannot be handled"
[1] "In plot,ctd-method() : which=\"CDOMdissolved_oxygenoxygen_saturationchlorophyll_concentrationchlorophyll_fluorescence\" cannot be handled"
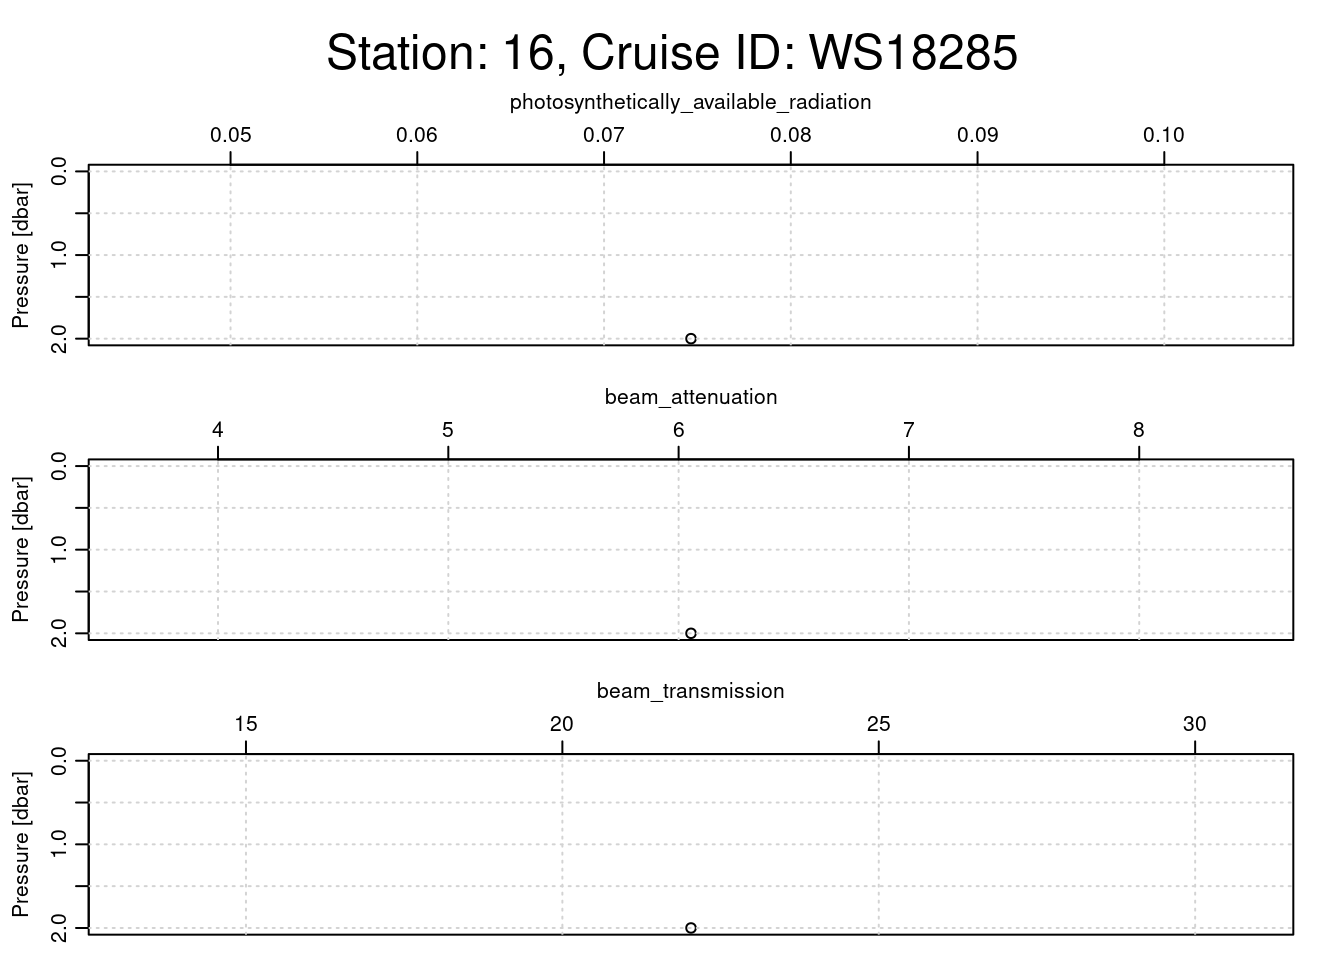
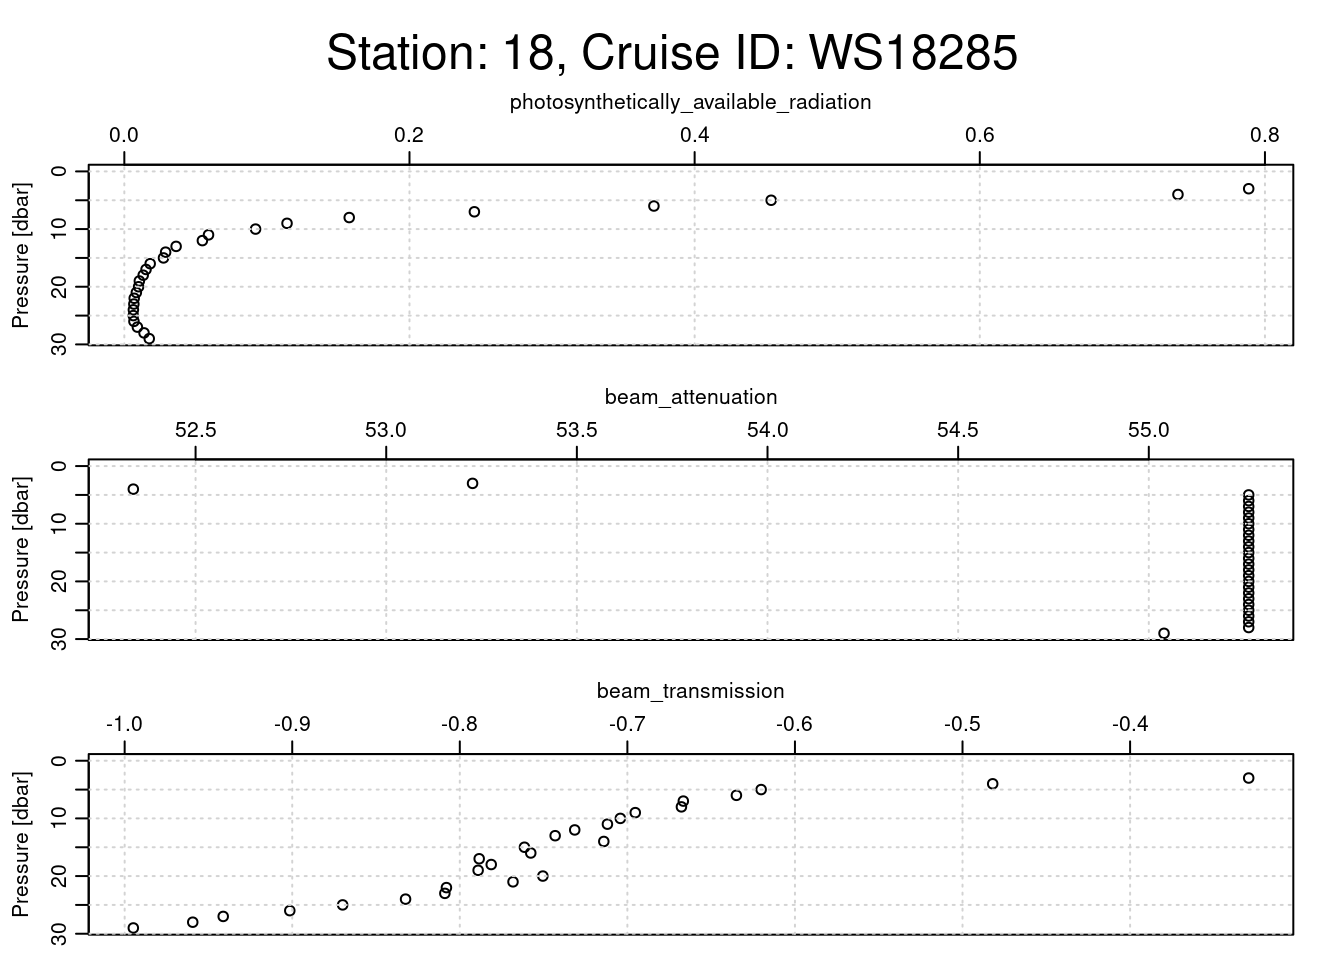
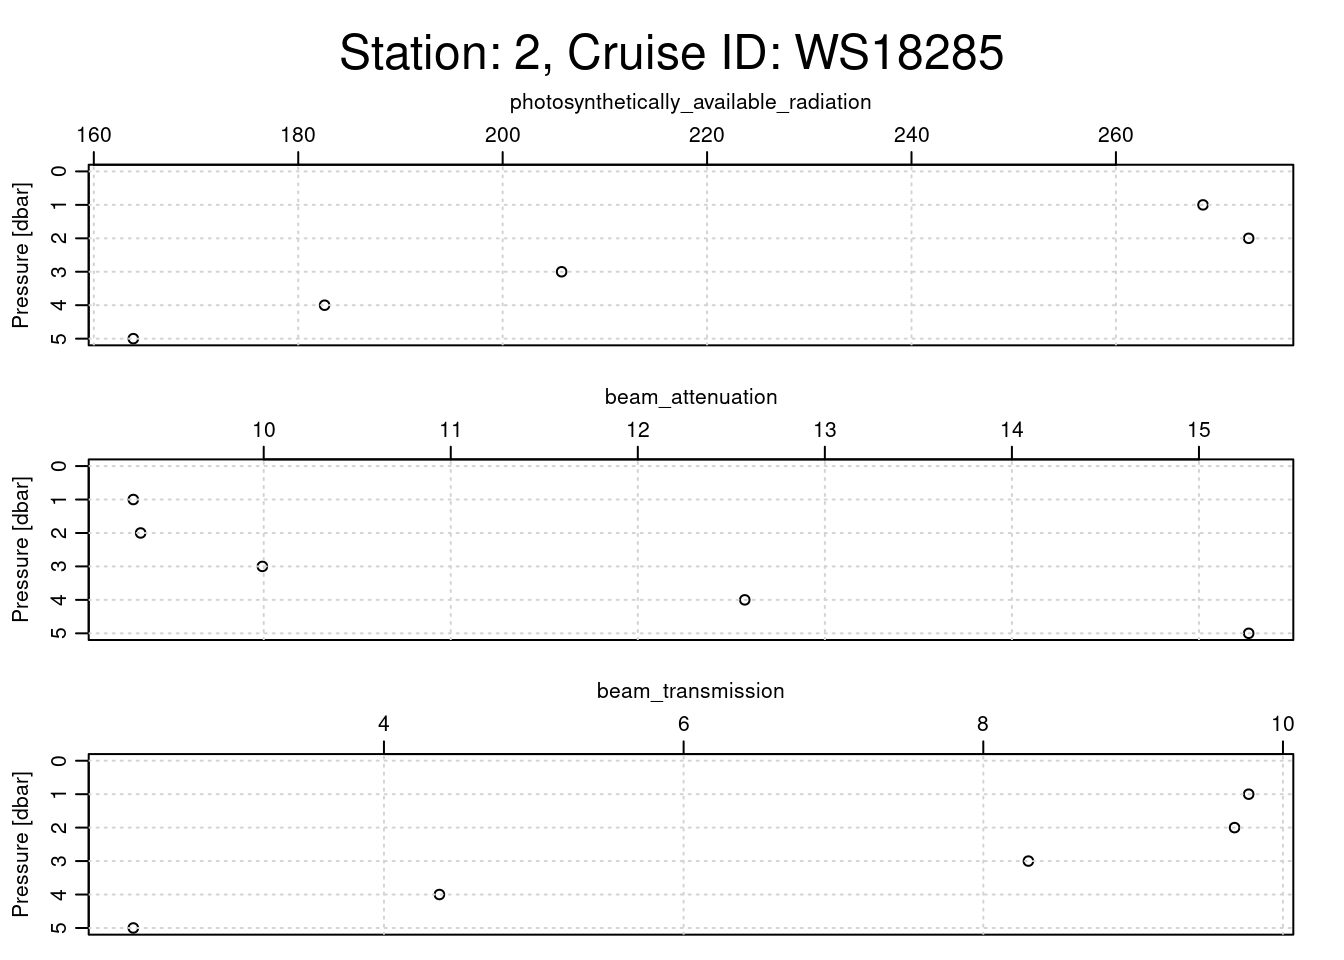
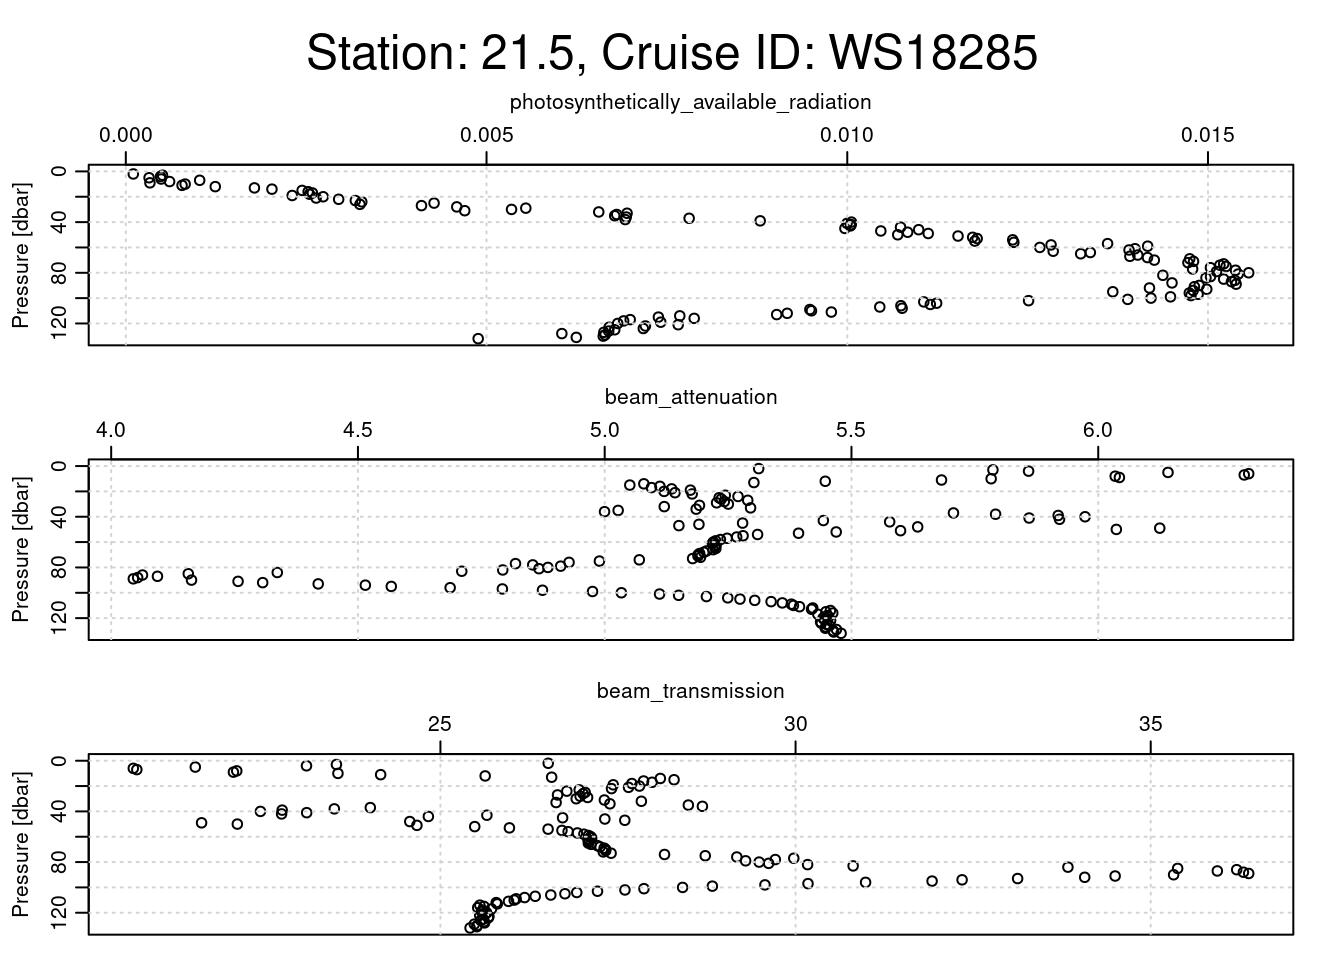
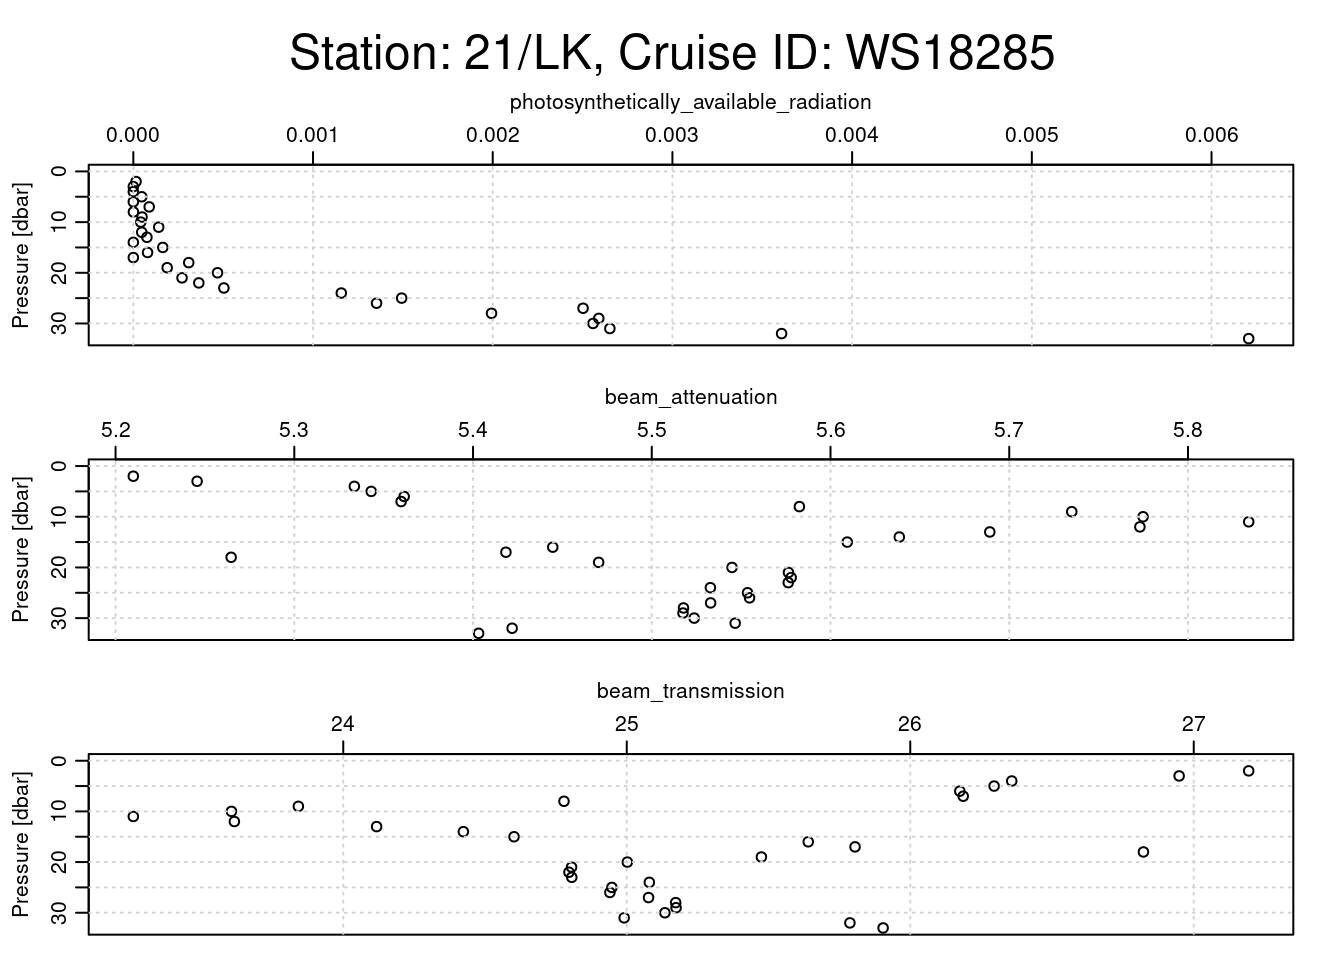
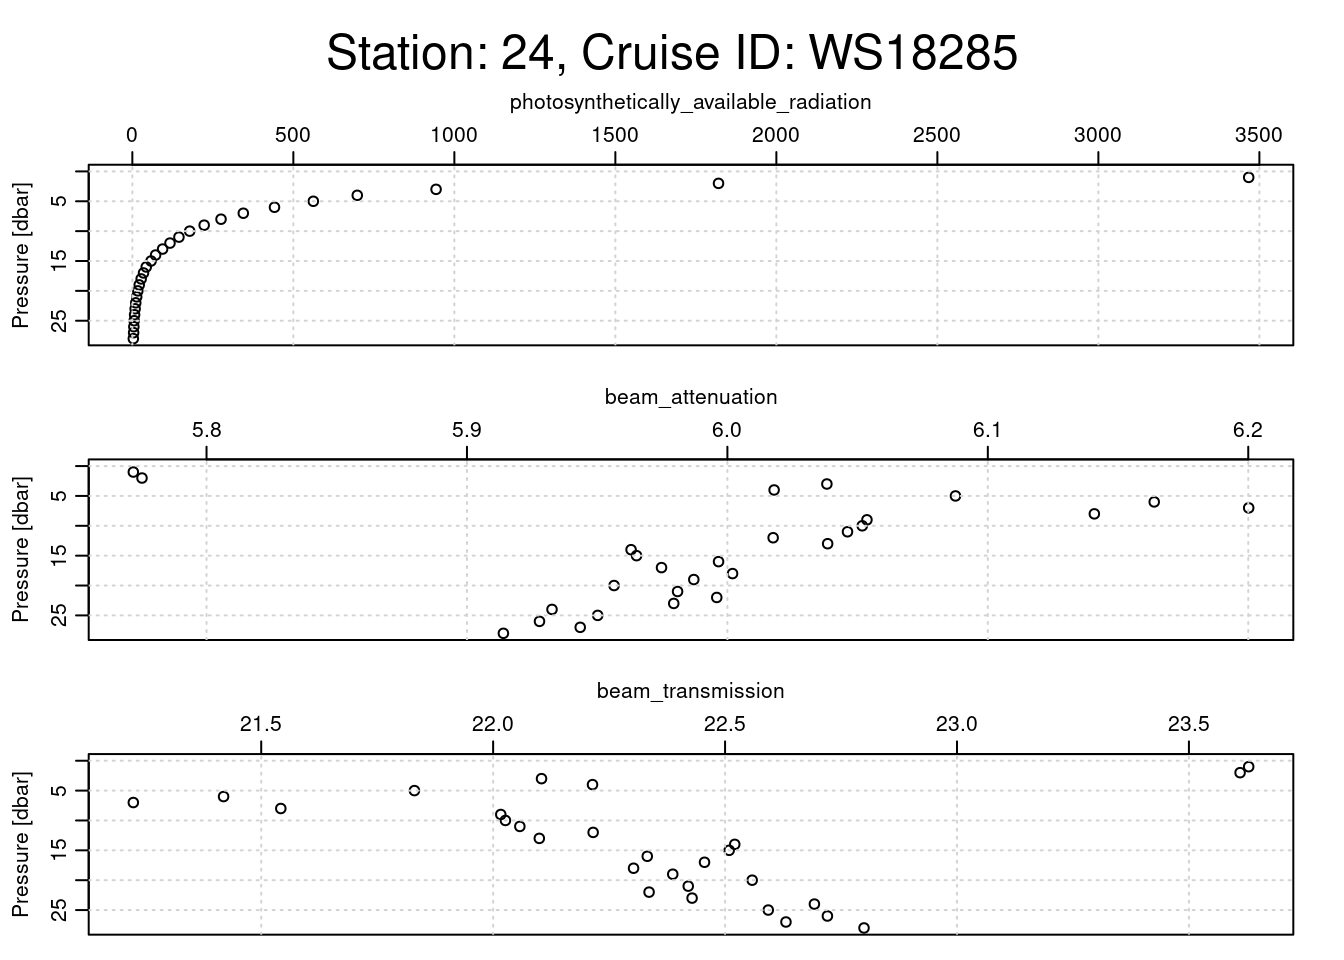
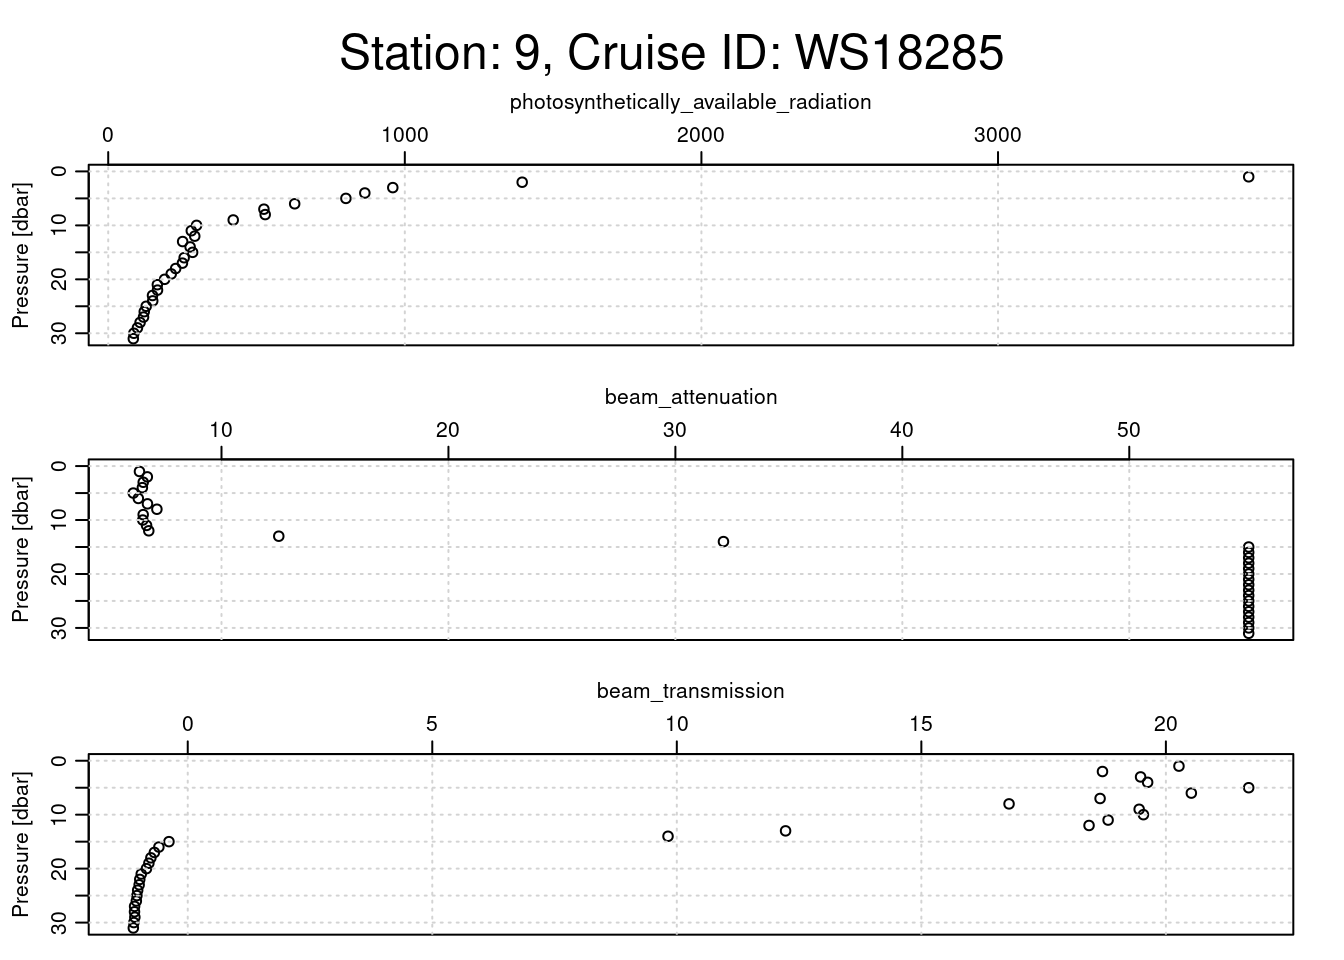
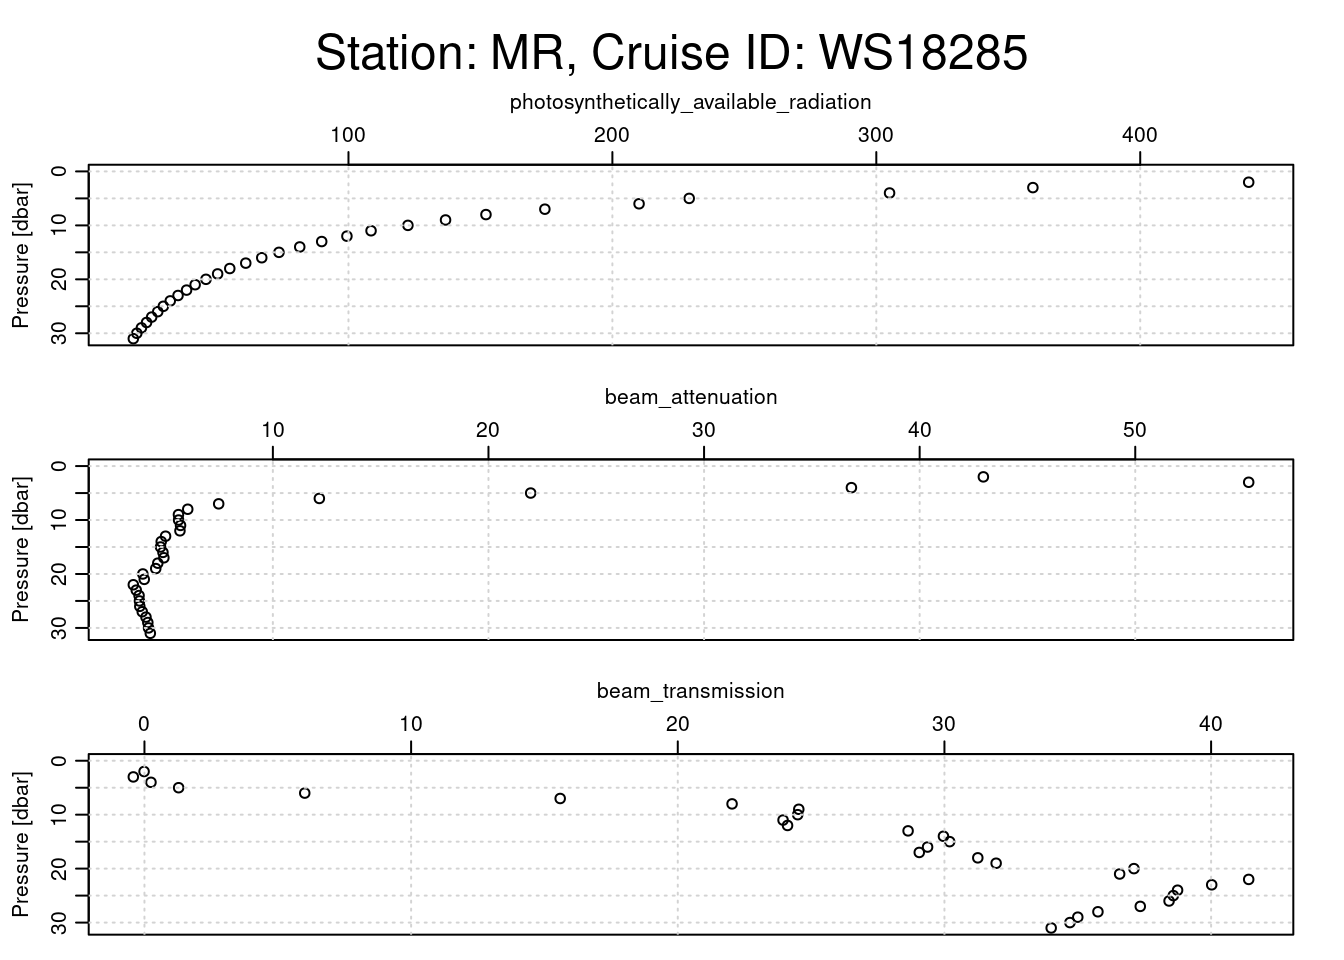
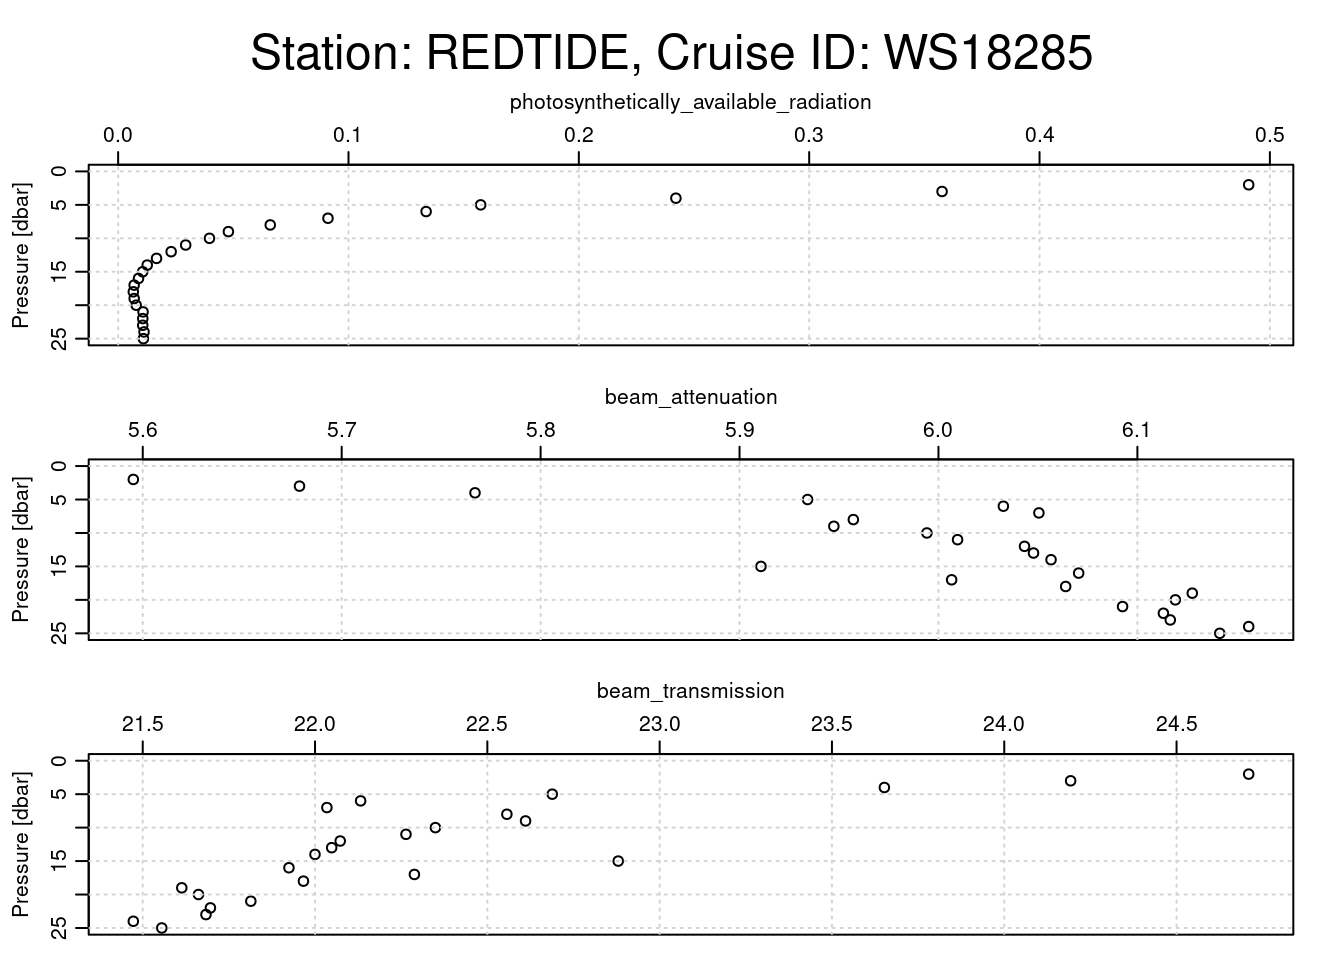
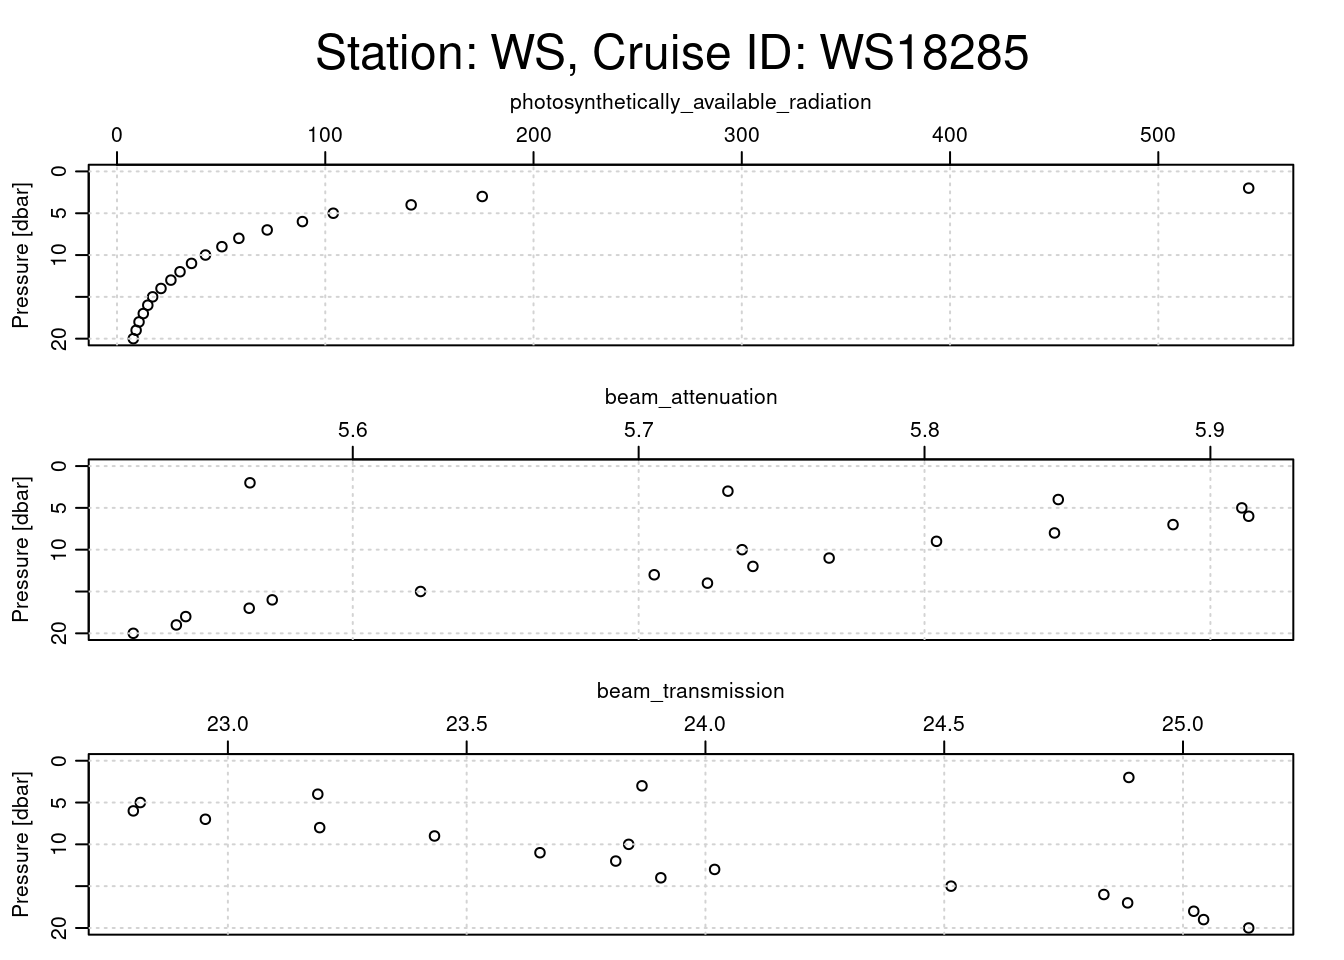
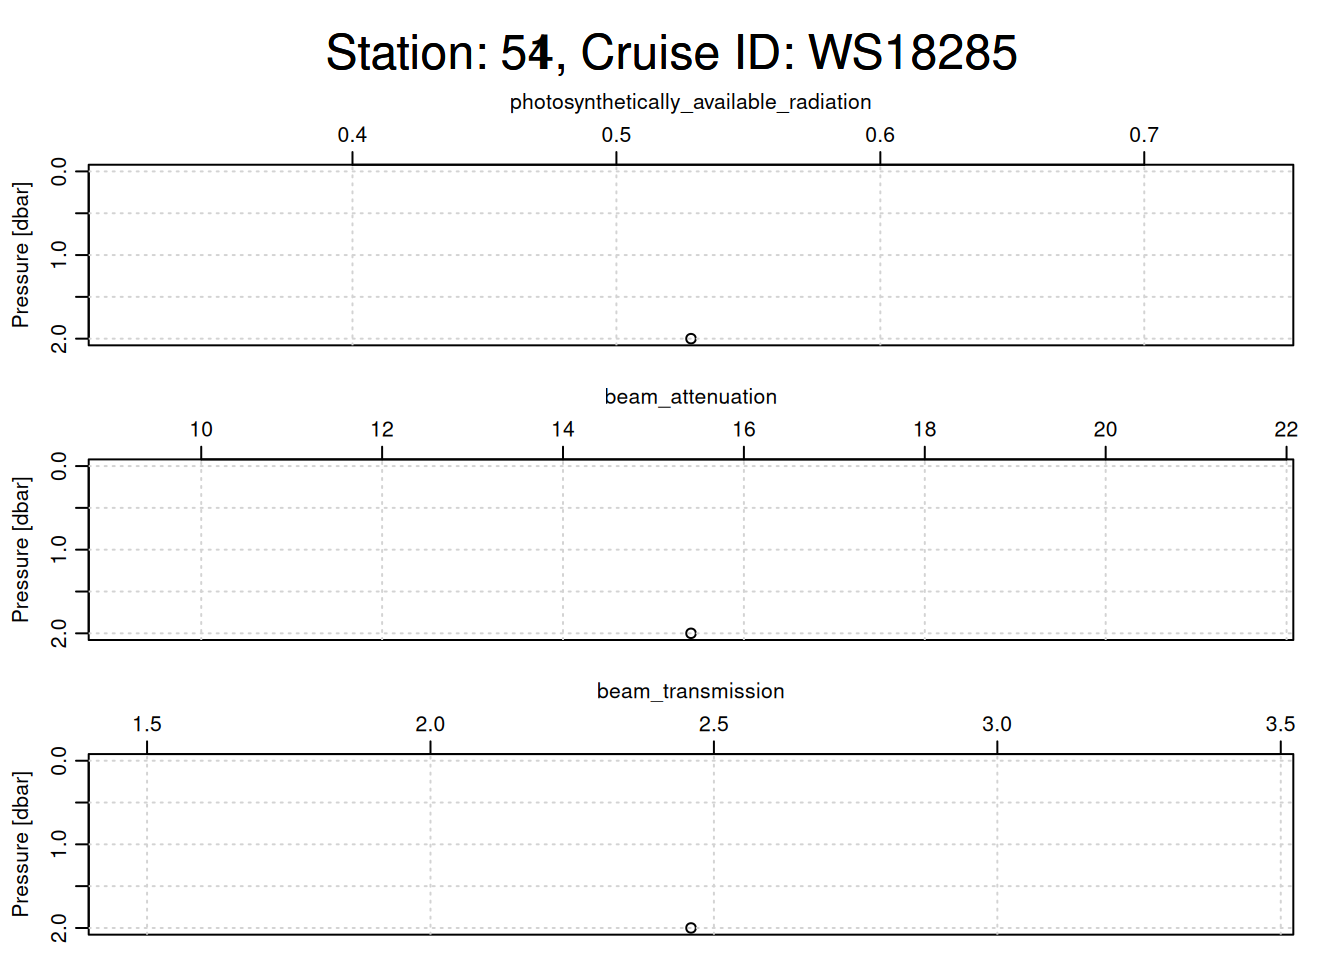
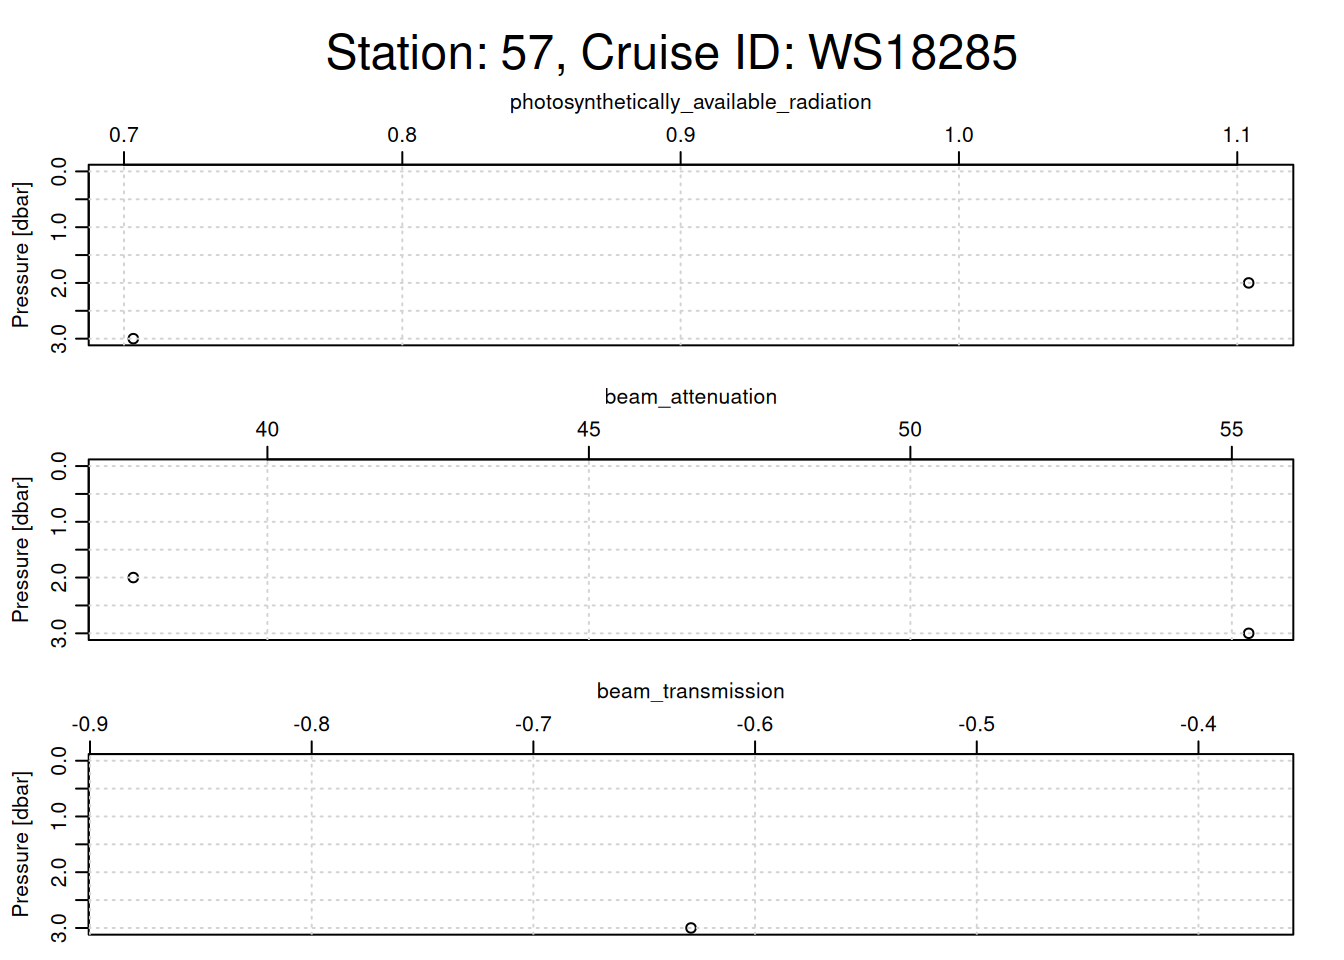
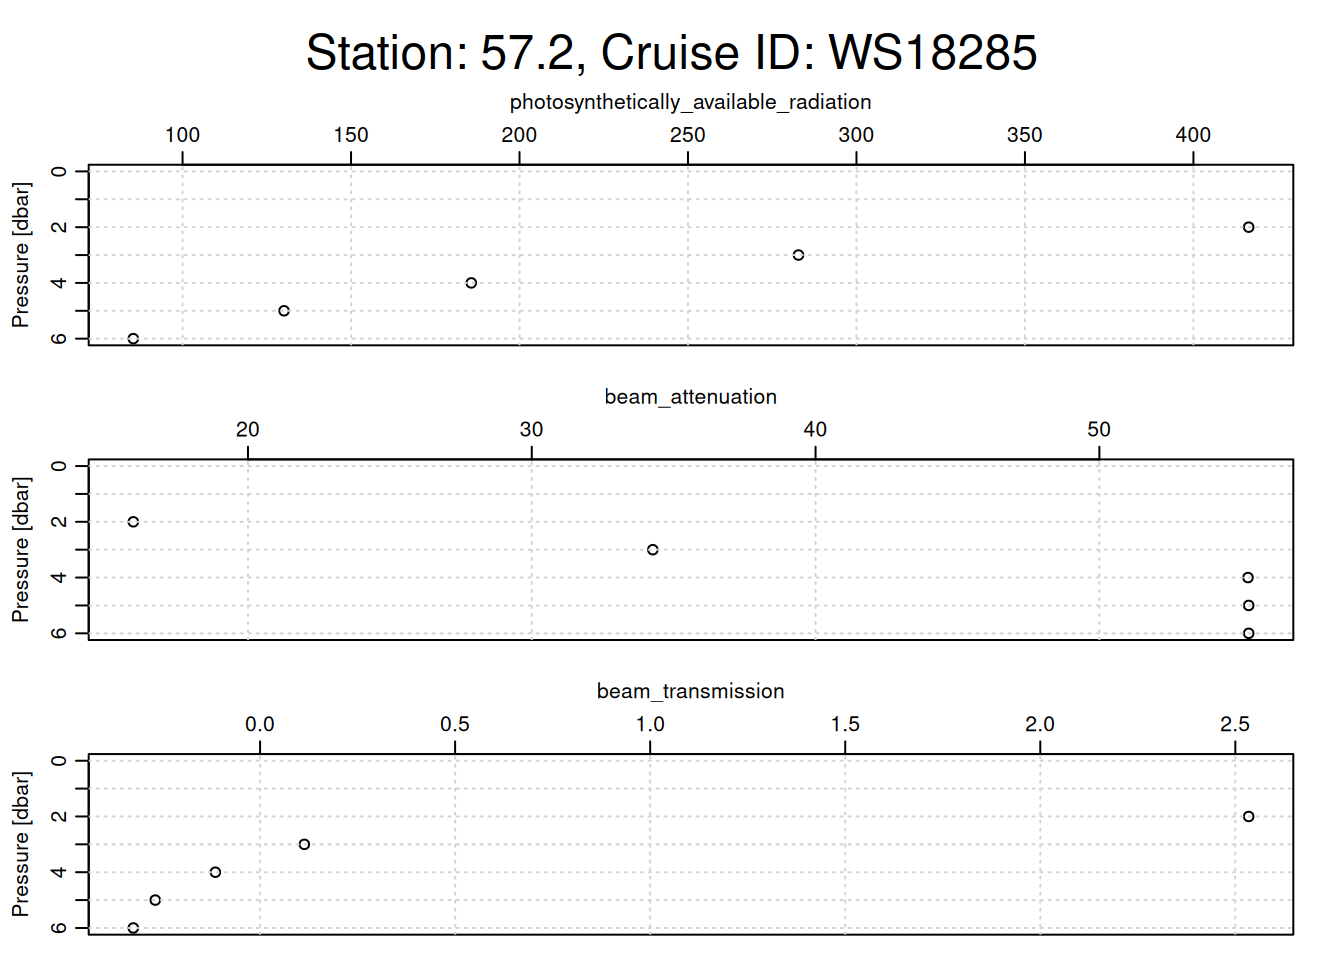
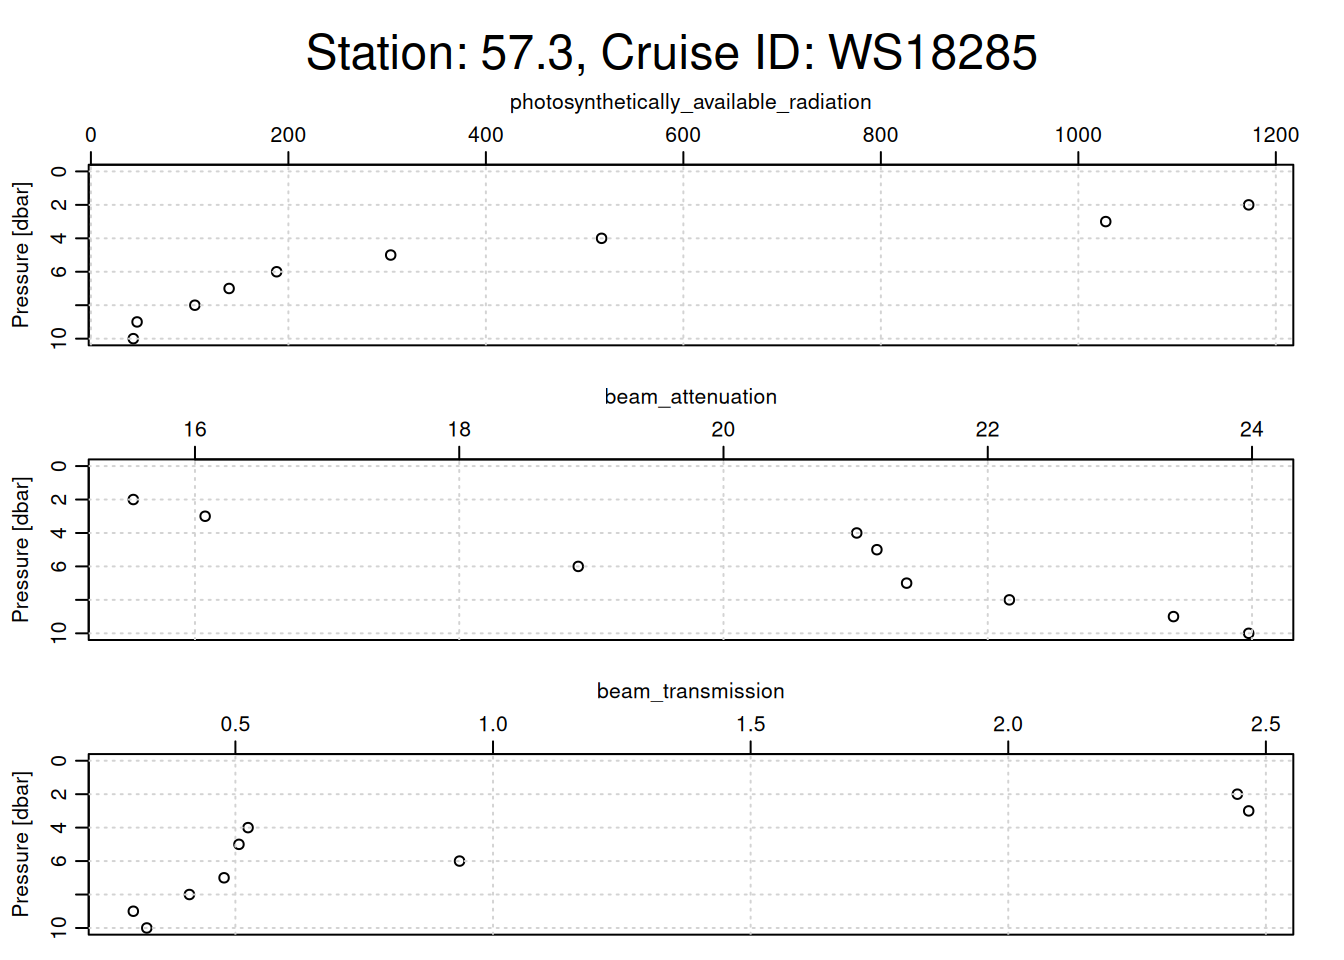
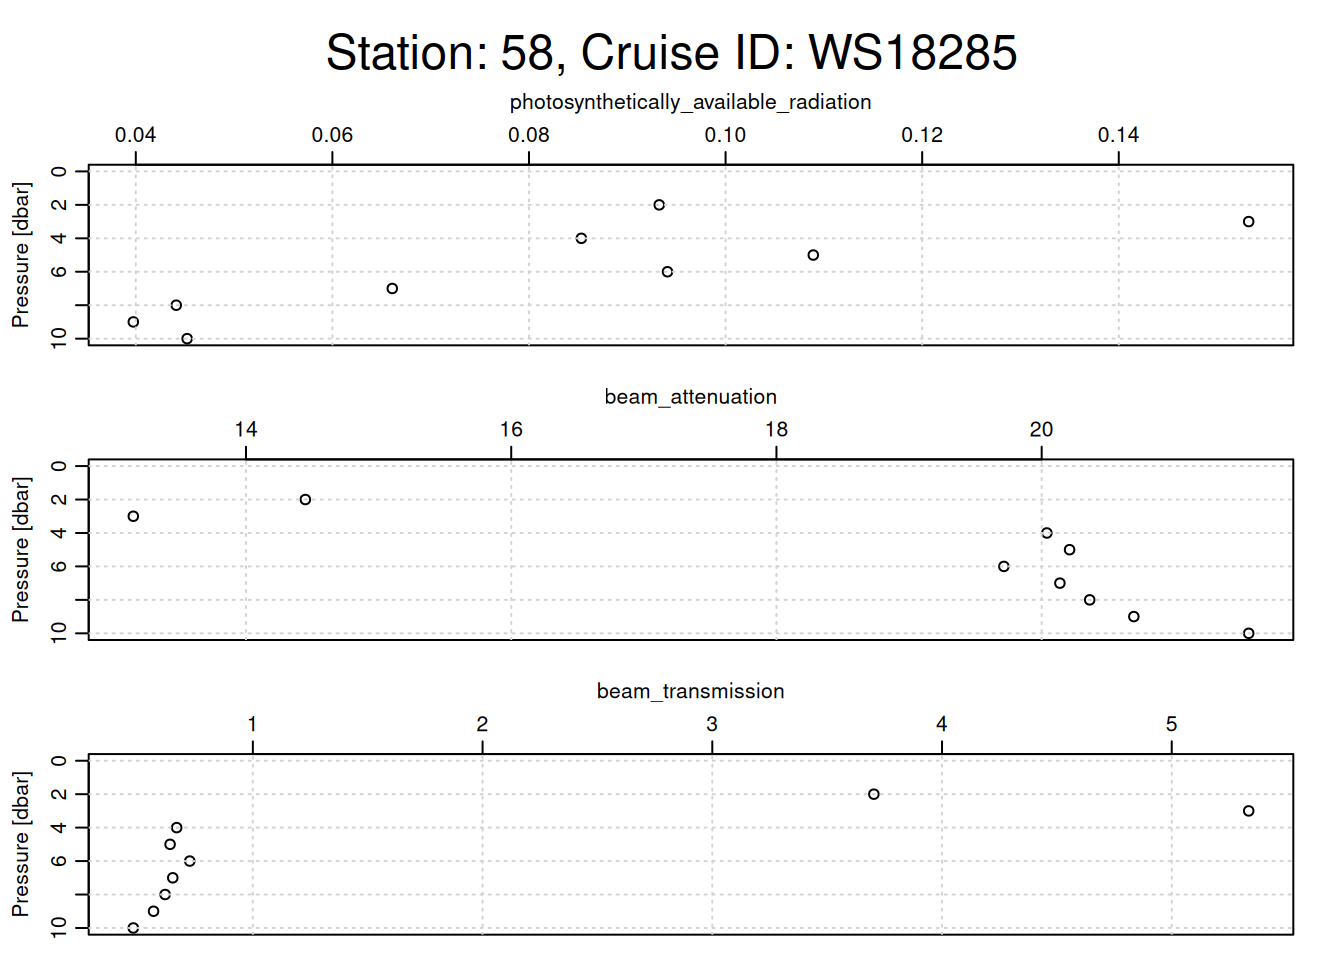
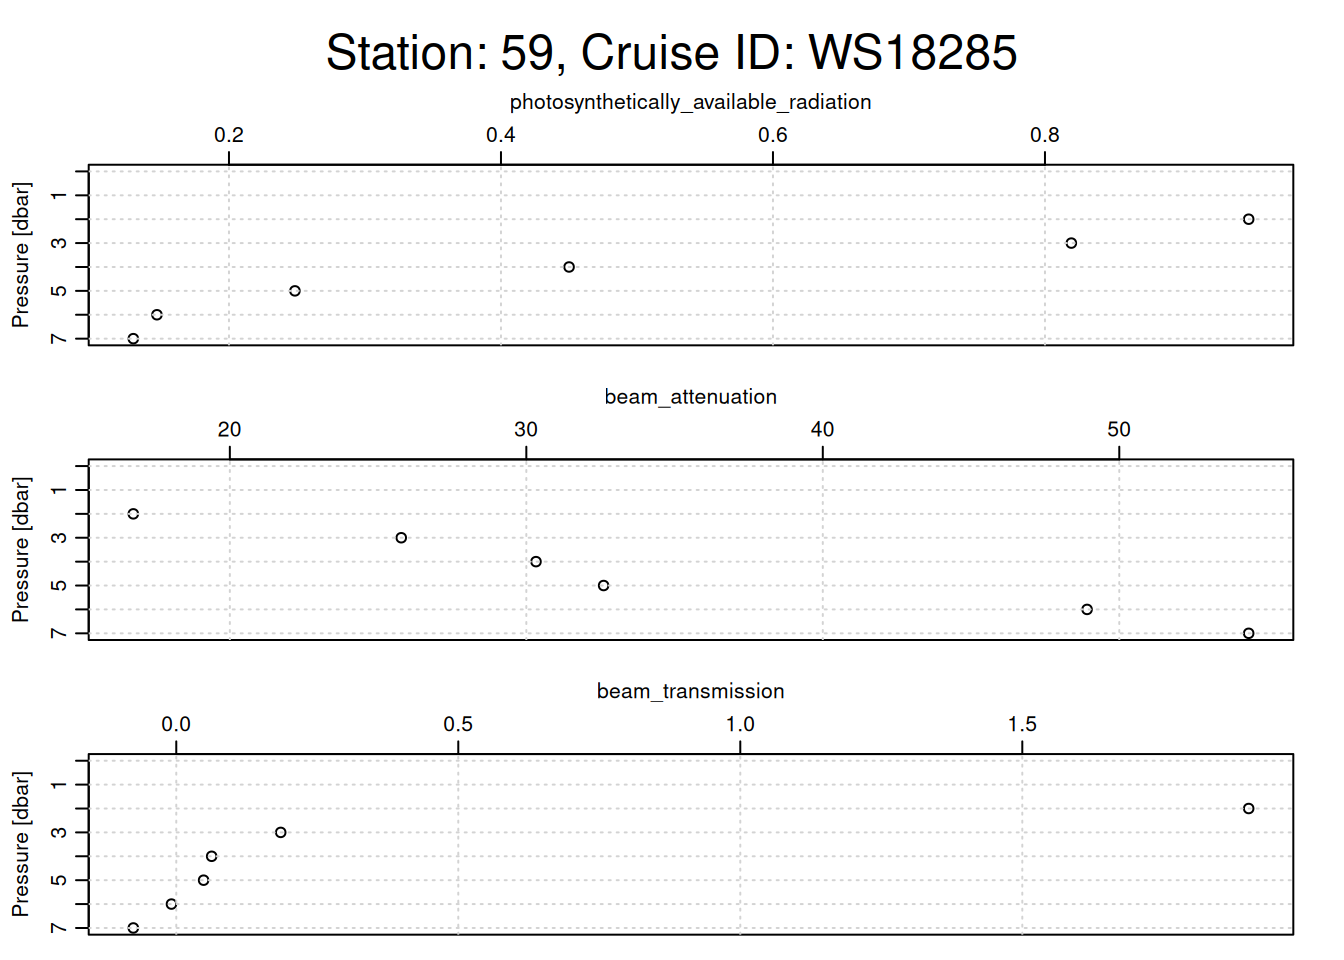
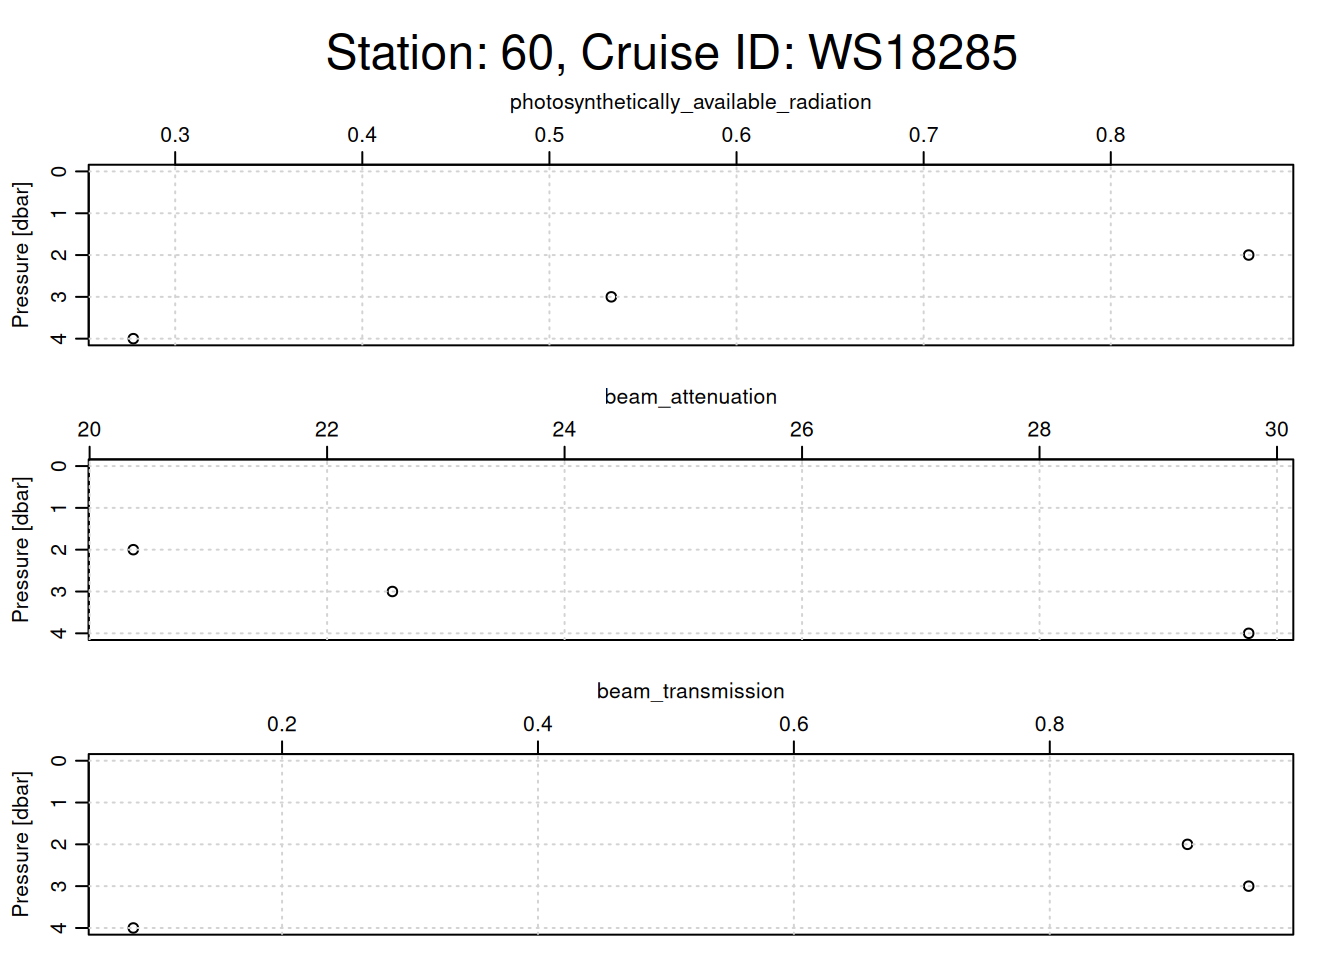
plotting other optical parameters for each cast
# Loop through each CTD castfor (i inseq(ctd_FK)){ cast <- ctd_FK[[i]] # Assuming each sublist contains only one relevant CTD objecttryCatch({# Extract metadata for station name and cruise ID station_name <- cast@metadata$station[1] cruise_id <- cast@data$cruise_id[1]# Generate a title with station name and cruise ID overall_title <- glue::glue("Station: {station_name}, Cruise ID: {cruise_id}")# Set margins: increase the outer margin for the titlepar(oma =c(0, 0, 3, 0)) # Top outer margin increased for title# Plotting function with specific parameters oce::plot(x =ctdDecimate(ctdTrim(cast)),which =c("photosynthetically_available_radiation","beam_attenuation","beam_transmission" ),main =""# No main title for individual subplots )# Place a single overall title at the top of the plot framemtext(overall_title, side =3, line =1, outer =TRUE, cex =1.5)# Reset outer margins to defaultpar(oma =c(0, 0, 0, 0)) }, error =function(e) {print(e$message) # Print any errors that occur during plotting })}
[1] "need finite 'xlim' values"
[1] "error in evaluating the argument 'x' in selecting a method for function 'plot': missing value where TRUE/FALSE needed"
loop through every cast, clean, & save
combined_df <-data.frame()for (i inseq(ctd_FK)){tryCatch({ cast <- ctd_FK[[i]] # 1 is selecting only the first sublist# print(class(cast))# clean cast trimmed_cast <-ctdTrim(cast) decimated_cast <-ctdDecimate(trimmed_cast, p =0.5) # binned to 0.5 m# convert to df cast_df <-as.data.frame(decimated_cast@data)# Add metadata# assumes station ID and cruise ID the same for all & just uses 1st one cast_df <-mutate( cast_df,station = cast@data$station[1],cruise_id = cast@data$cruise_id[1] )# drop NA rows left by cleaning cast_df <-subset(cast_df, !is.na(scan))# Append the data to the combined dataframe combined_df <-rbind(combined_df, cast_df) }, error =function(e){print(glue("error in cast {cast@metadata$station[1]}"))print(e) })}
error in cast DECKTST2
<simpleError in if (nbad > 0) {    if (replace == "reference") {        x[bad] <- x.reference[bad]    }    else {        x[bad] <- rep(NA, nbad)    }}: missing value where TRUE/FALSE needed>
loop through every cast, clean, & save
# Save to CSVfile_path <-here(glue("data/cleaned/{cruise_id}.csv"))write.csv(combined_df, file_path, row.names =FALSE)