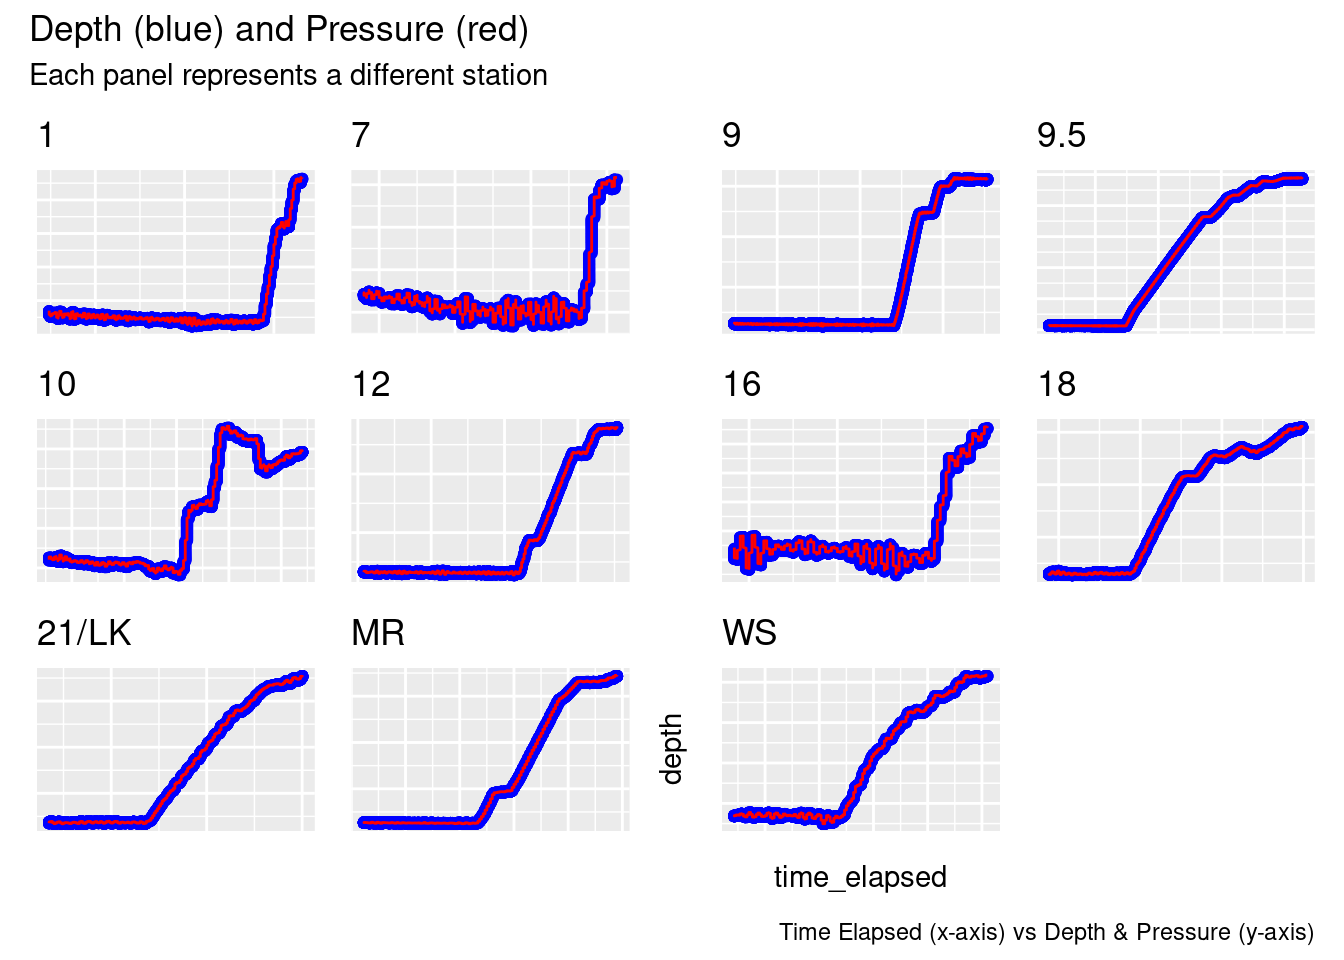
tryCatch({ plots <-list()for (station_name inunique(cruise_df$station)) { subset_df <-filter(cruise_df, station == station_name) plots[[station_name]] <-ggplot(subset_df, aes(x = time_elapsed)) +geom_point(aes(y = depth), color ="blue") +# Plot depth in bluegeom_line(aes(y = sea_water_pressure), color ="red") +# Plot sea water pressure in redggtitle(glue("{station_name}")) +theme(axis.title.x =element_blank(),axis.title.y =element_blank(),axis.text.x =element_blank(),axis.text.y =element_blank(),axis.ticks.x =element_blank(),axis.ticks.y =element_blank() ) # Remove individual axis titles and text }# drop nulls plots <- purrr::compact(plots)# Combine all plots into a grid combined_plot <-wrap_plots(plots) +plot_layout(ncol =4) +# Adjust ncol to set number of columns in the gridplot_annotation(title ="Depth (blue) and Pressure (red)",subtitle ="Each panel represents a different station",caption ="Time Elapsed (x-axis) vs Depth & Pressure (y-axis)" ) +theme(plot.tag =element_text(size =12, face ="bold"),plot.tag.position ="topleft",axis.title.x =element_text(margin =margin(t =10)),axis.title.y =element_text(margin =margin(r =10)) )print(combined_plot)}, error =function(er){print(er)});
`geom_line()`: Each group consists of only one observation.
ℹ Do you need to adjust the group aesthetic?
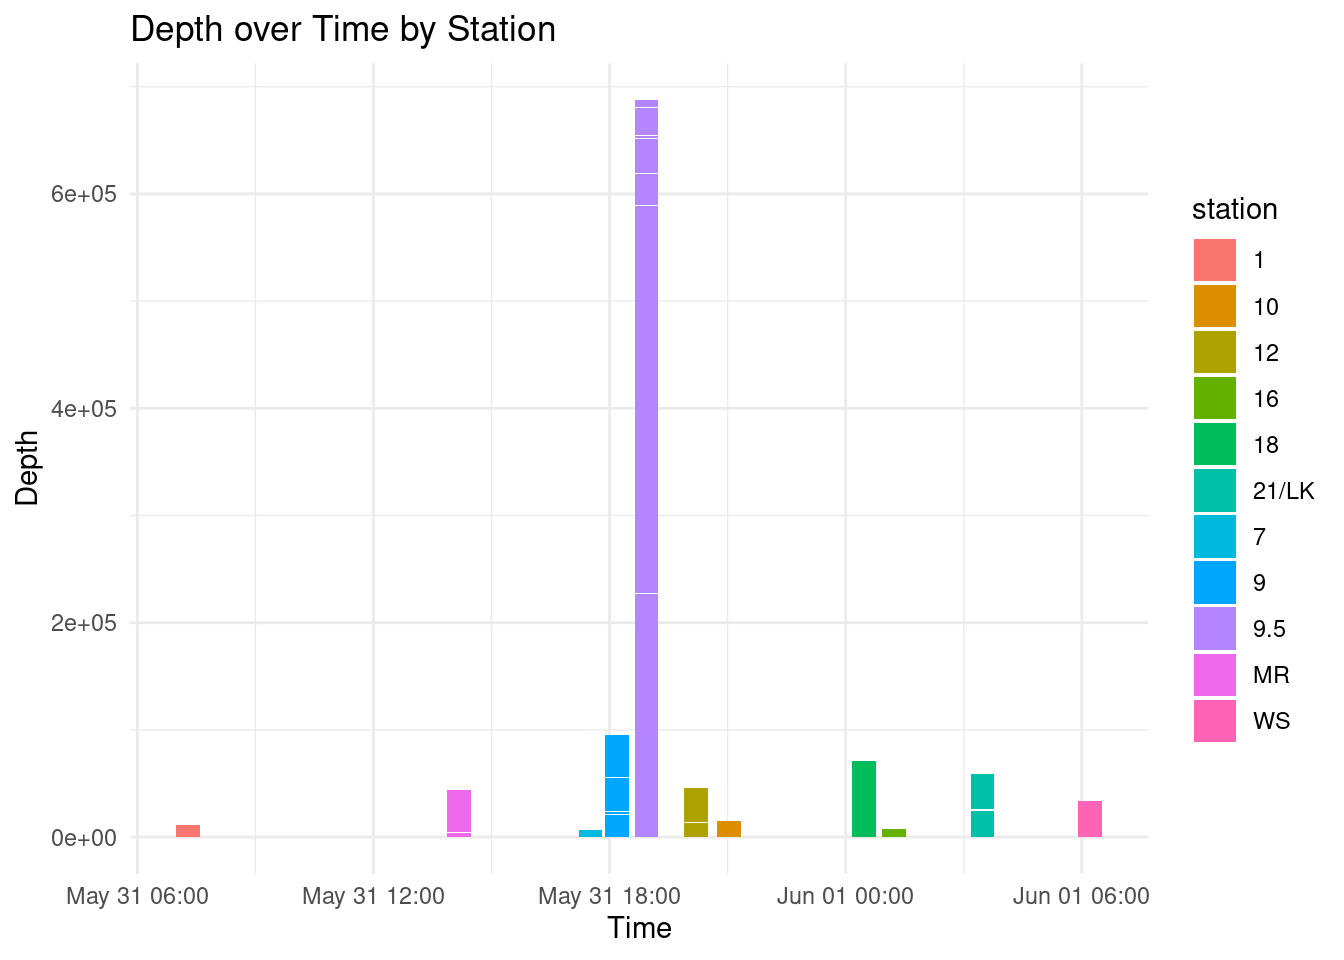
plot across all stations
p <-ggplot(cruise_df, aes(x = time, y = depth, fill = station)) +geom_col() +# This creates the bars# geom_text(aes(label = station), vjust = -0.3) + # This adds labels to each bar, adjust vjust for positionlabs(x ="Time", y ="Depth", title ="Depth over Time by Station") +# Set labels and titletheme_minimal() # Use a minimal themeprint(p)
create oce.ctd objects from dataframes
ctd_load <-function(data, other_params =NULL) {# create csv into ctd object test_ctd <-as.ctd(salinity = data$sea_water_salinity,temperature = data$sea_water_temperature,pressure = data$sea_water_pressure,station = data$station )# add additional columns to ctd objectif (!is.null(other_params)) {for (param_name in other_params) { test_ctd <-oceSetData(object = test_ctd,name = param_name,value = data[[param_name]] ) } }print(glue("{data$station[1]}:\t{length(test_ctd@data$scan)} scans"))return(test_ctd)}# Define other parameters to addother_params <-c("cruise_id", "station", "time", "time_elapsed", "latitude", "longitude", "sea_water_electrical_conductivity", "CDOM", "dissolved_oxygen","oxygen_saturation", "chlorophyll_concentration", "chlorophyll_fluorescence", "photosynthetically_available_radiation", "beam_attenuation","beam_transmission", "depth", "sea_water_sigma_t","descent_rate", "sound_velocity","altimeter")# Split data by station and create data listctd_FK <- cruise_df %>%split(.$station) %>%map(~ctd_load(.x, other_params = other_params)) # ~ is a lambda(x)
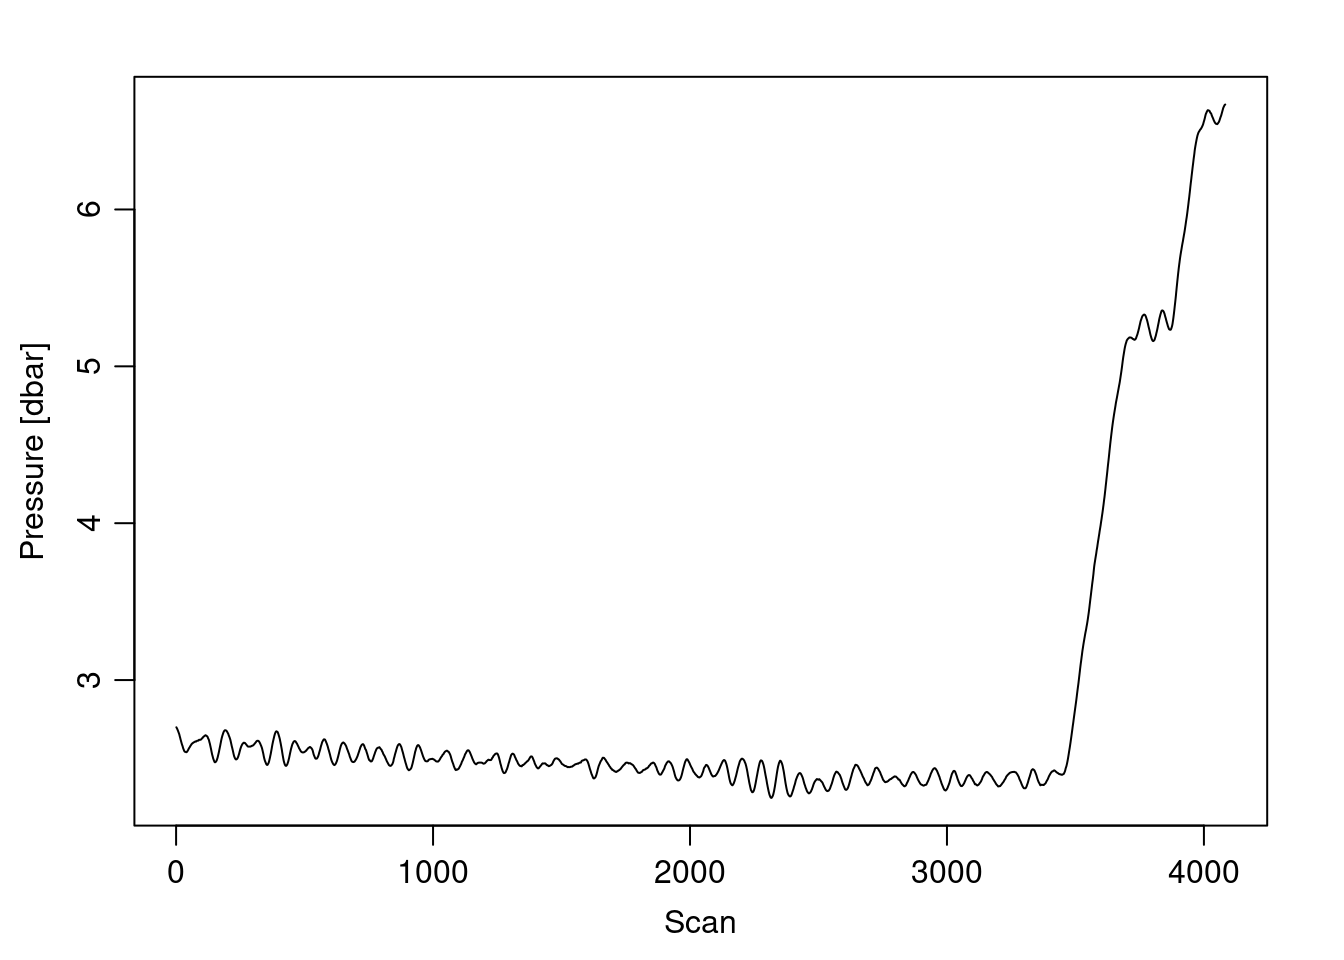
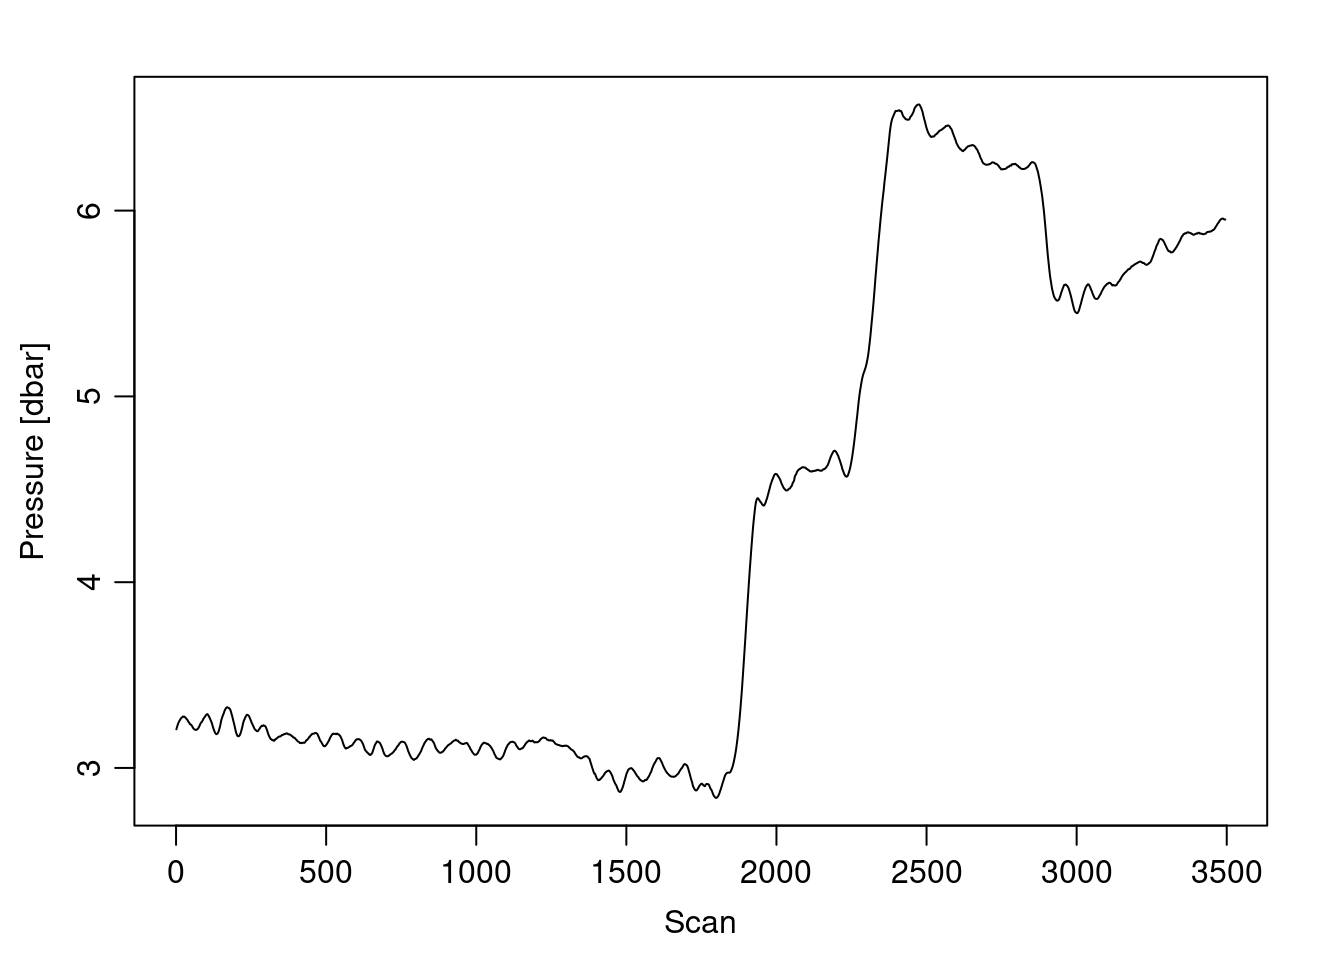
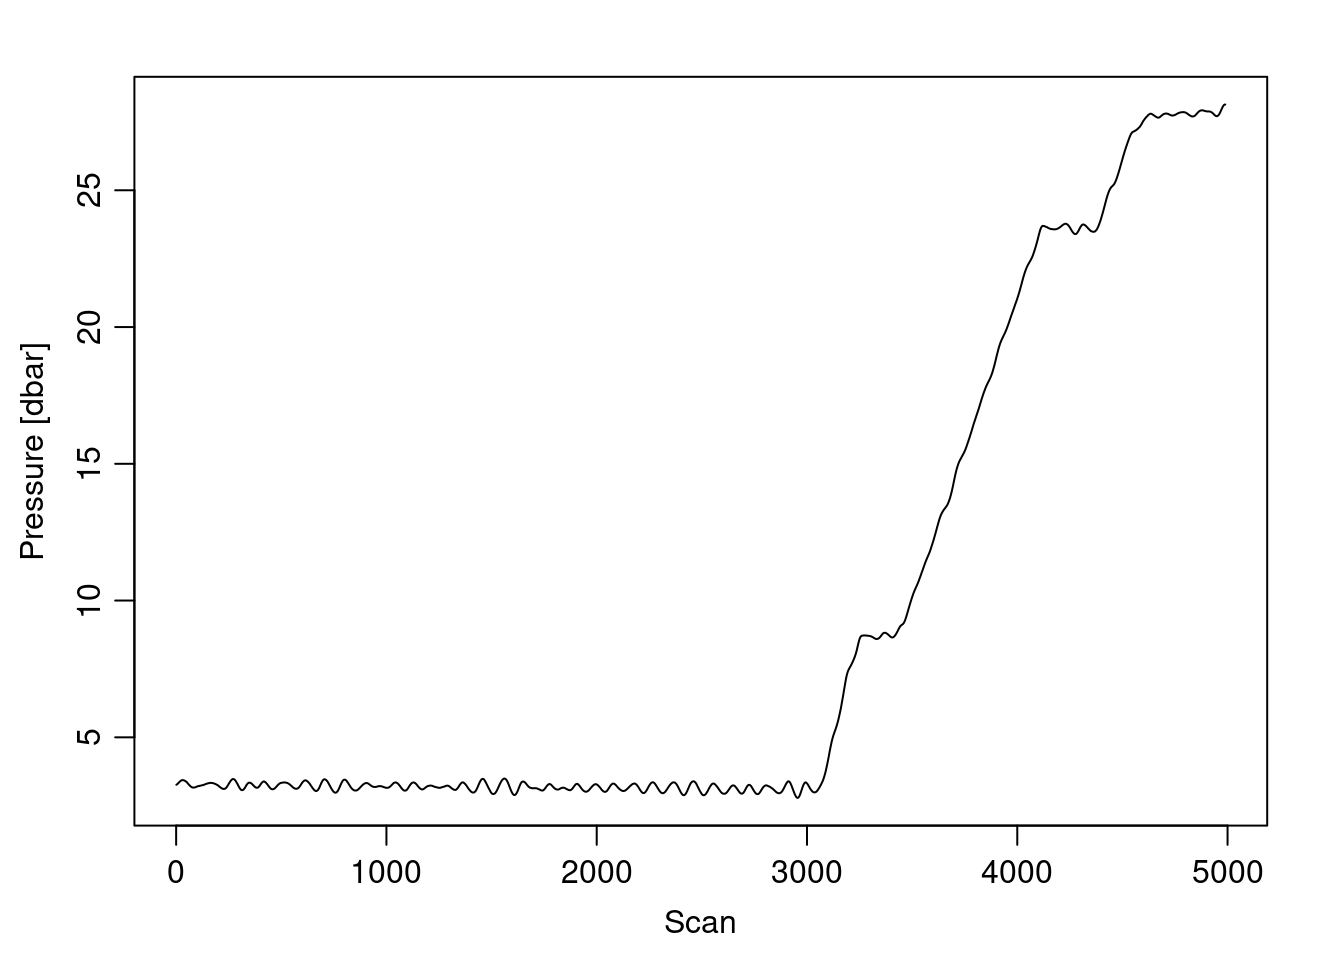
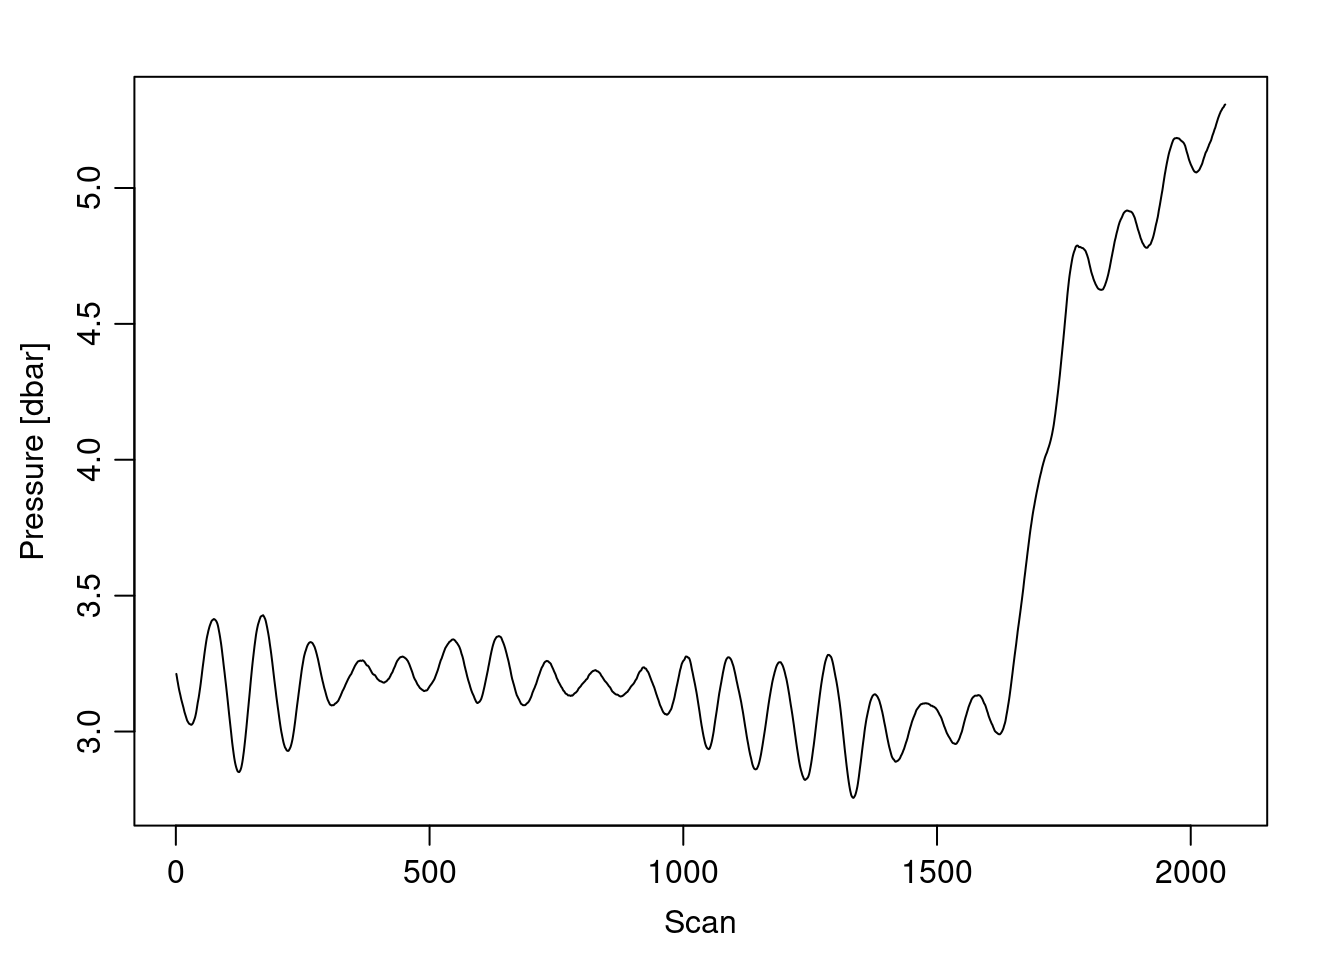
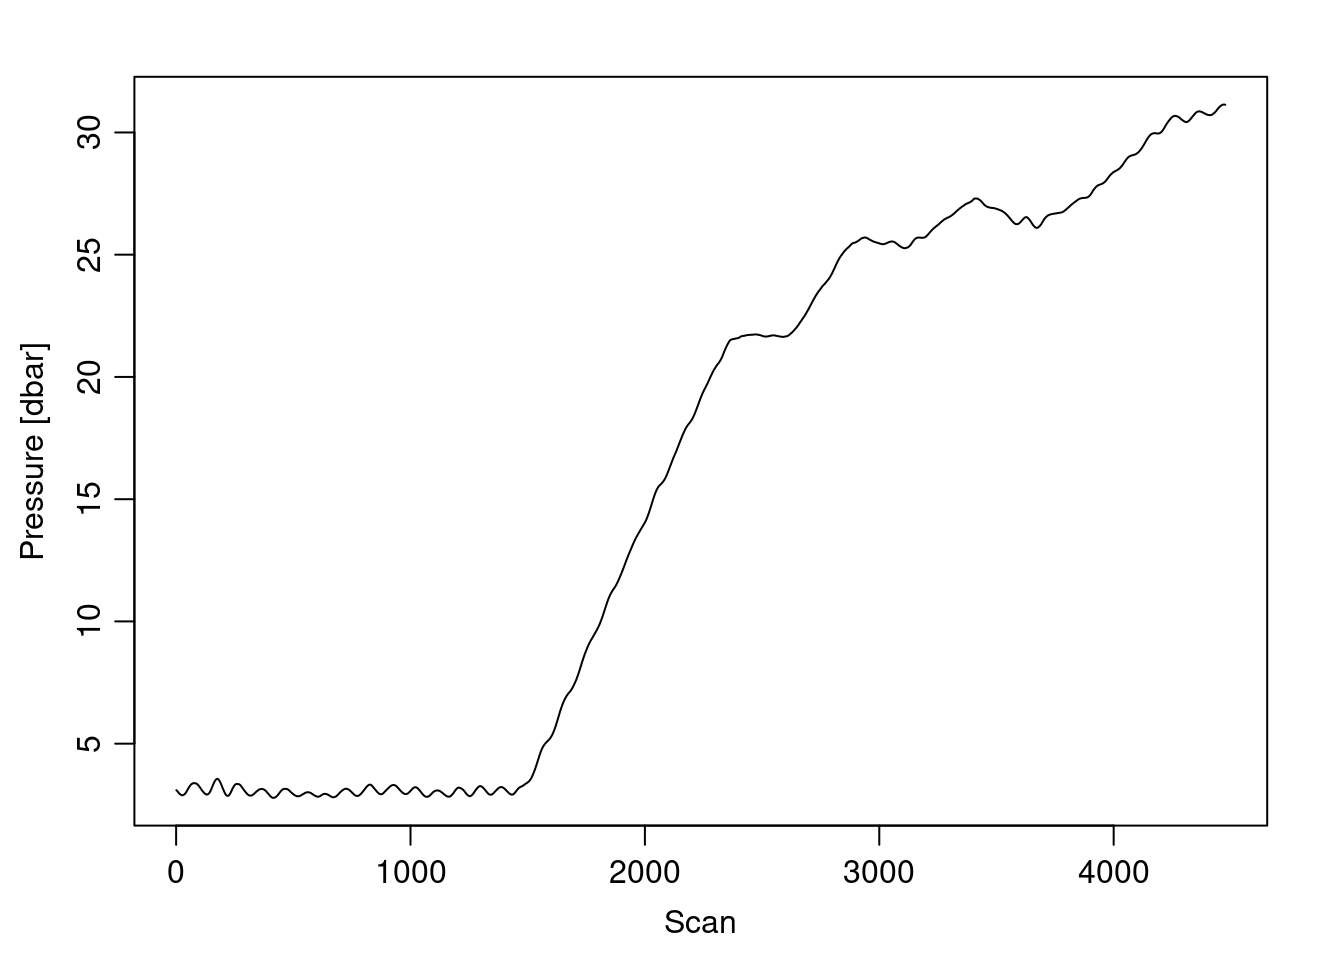
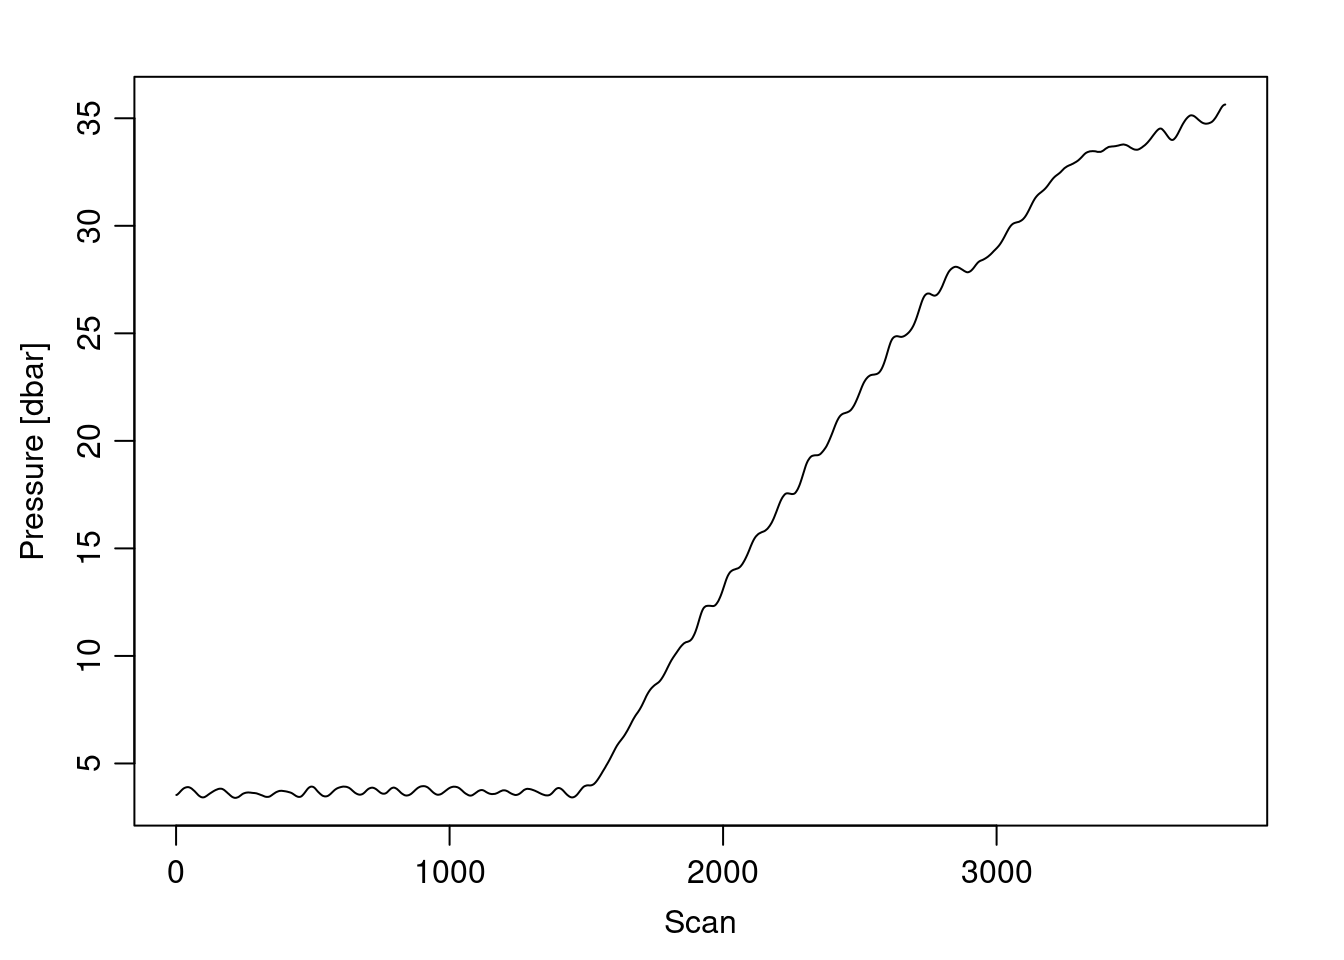
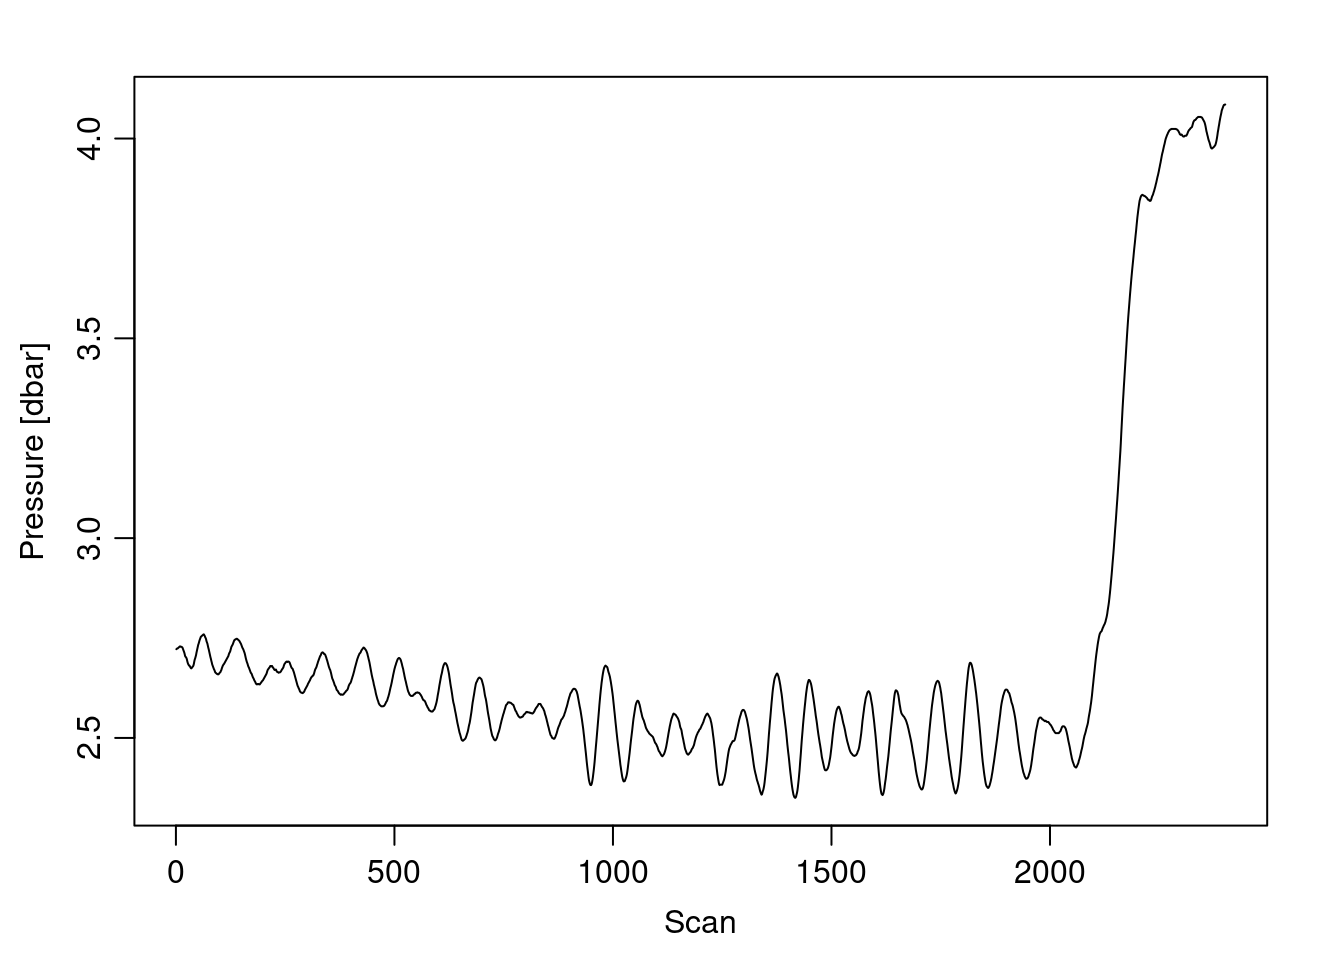
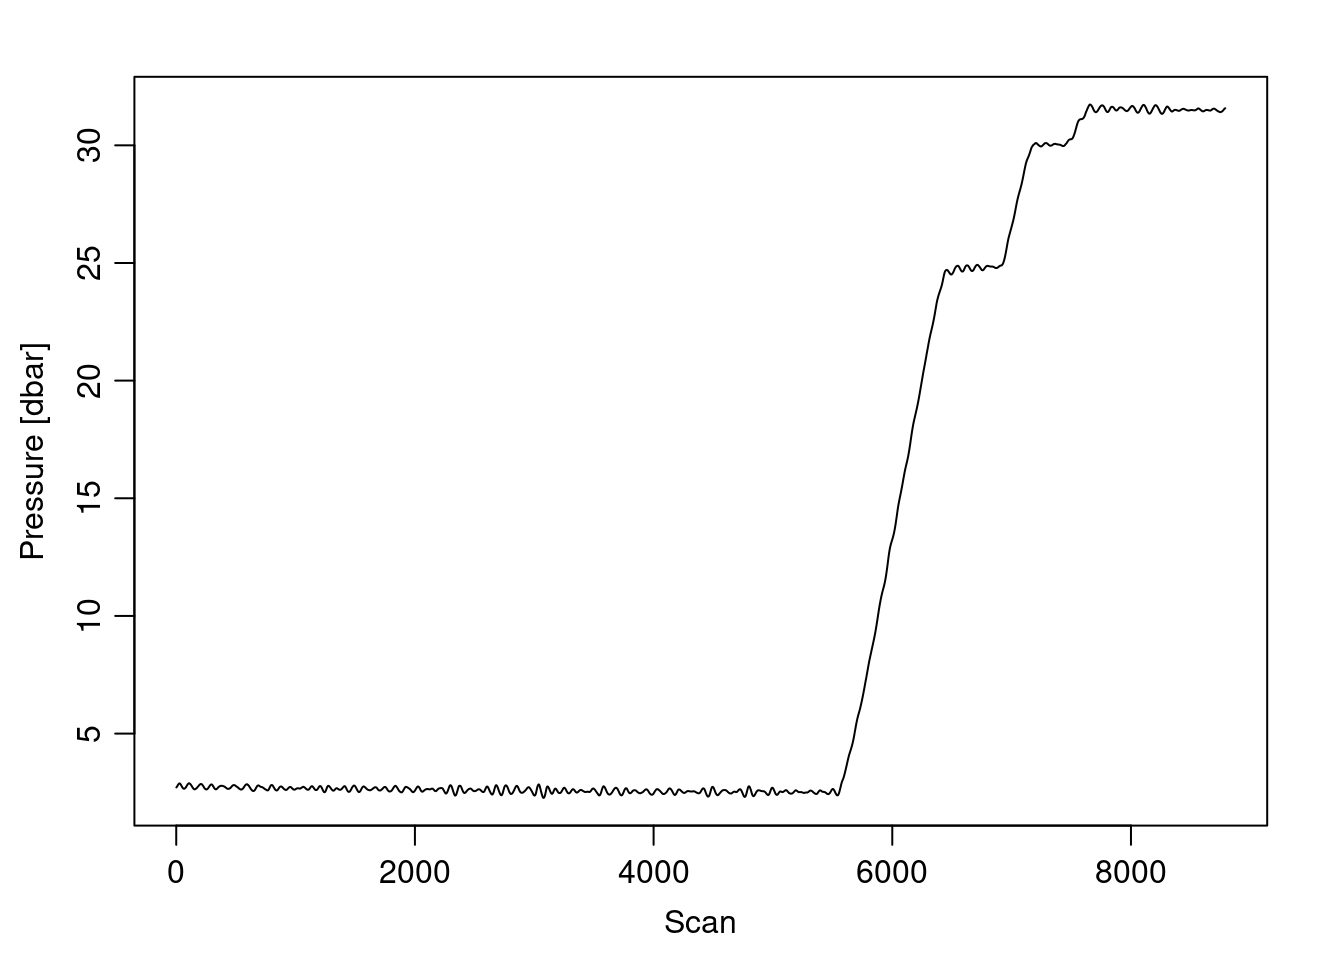
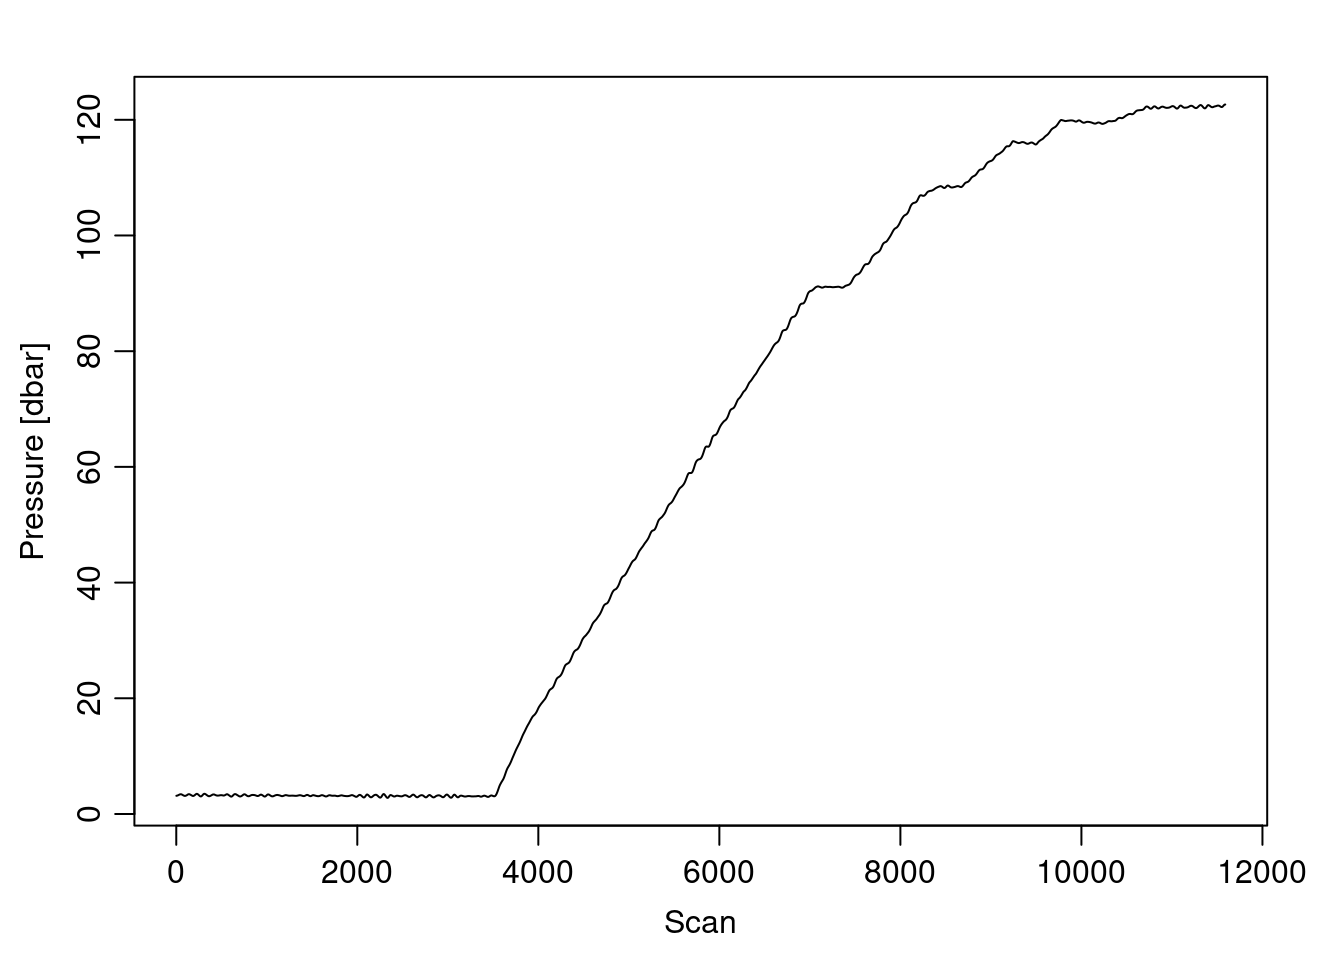
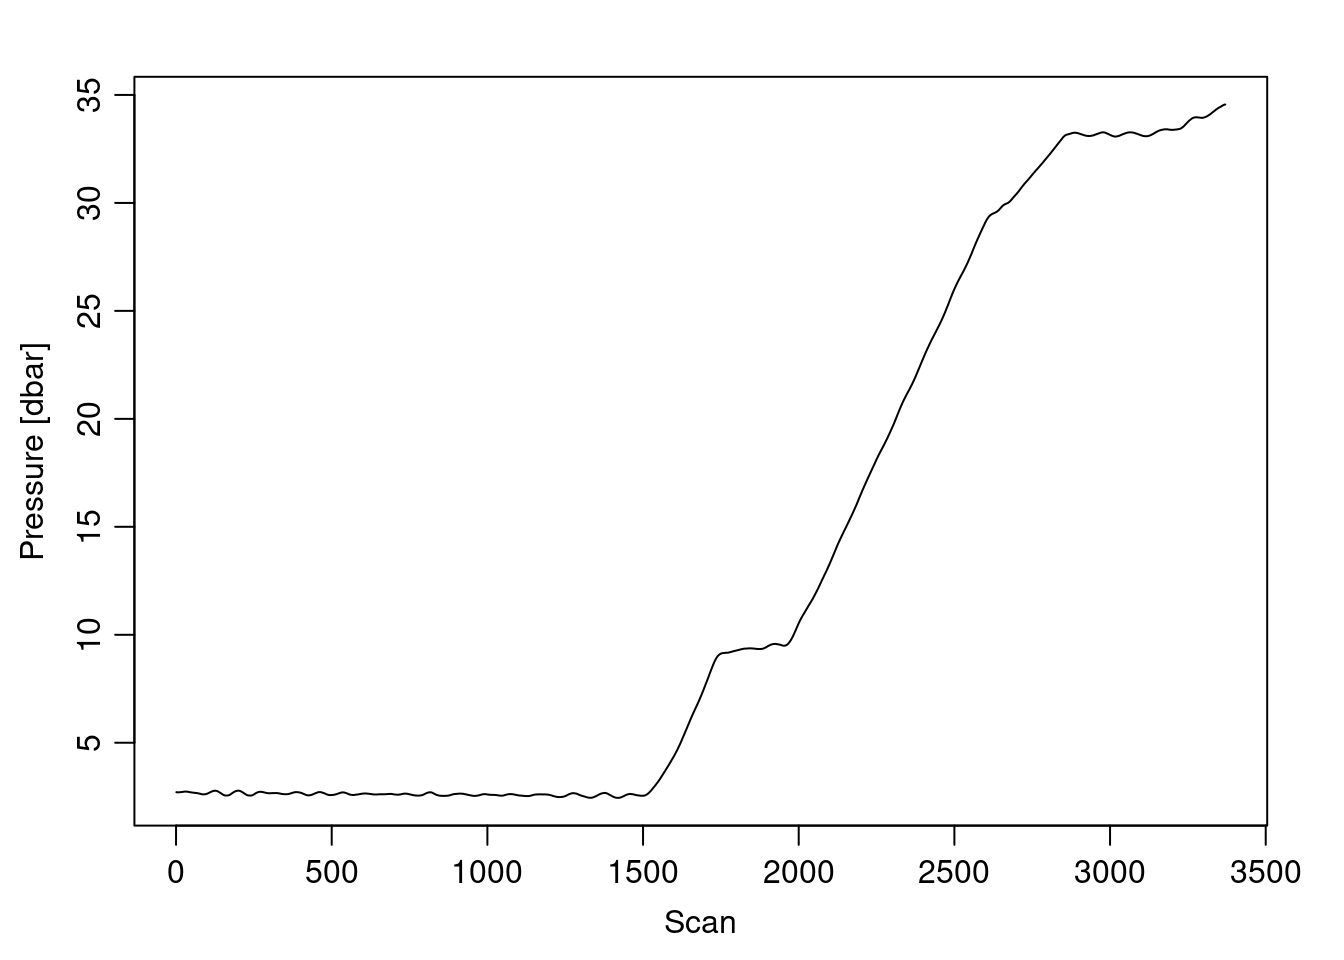
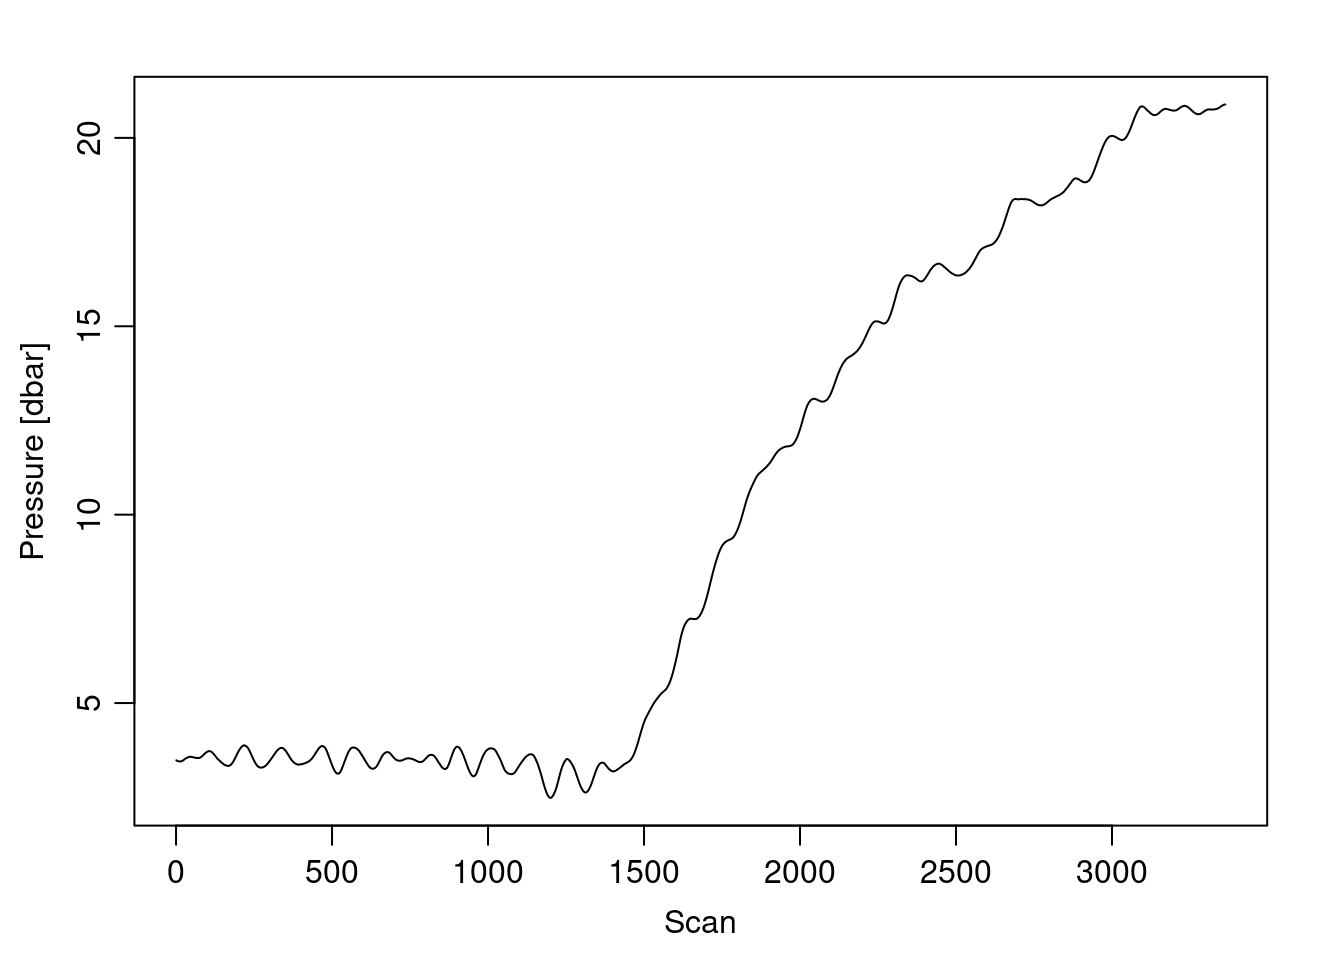
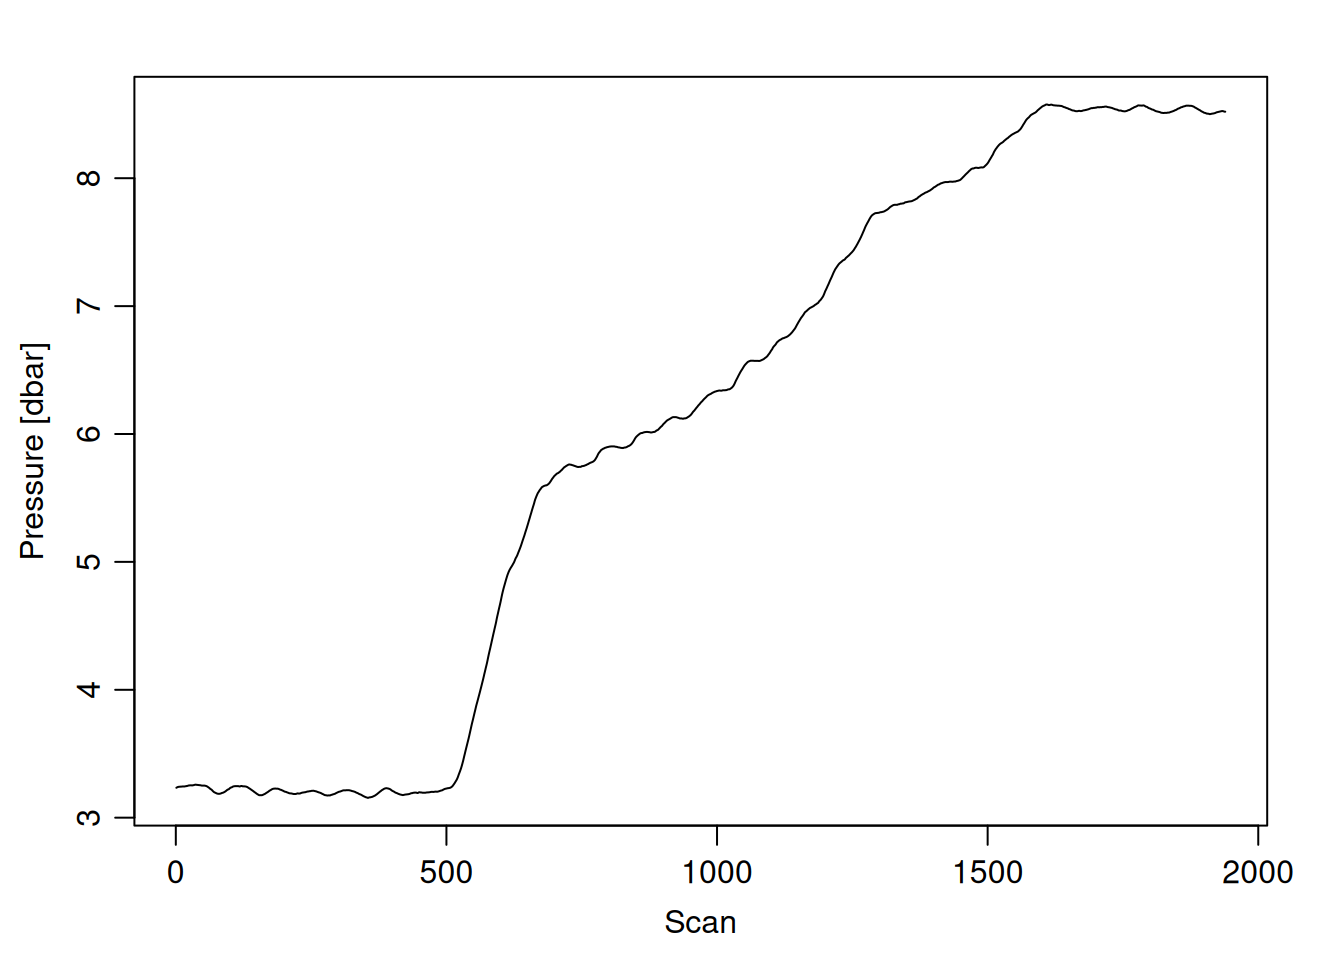
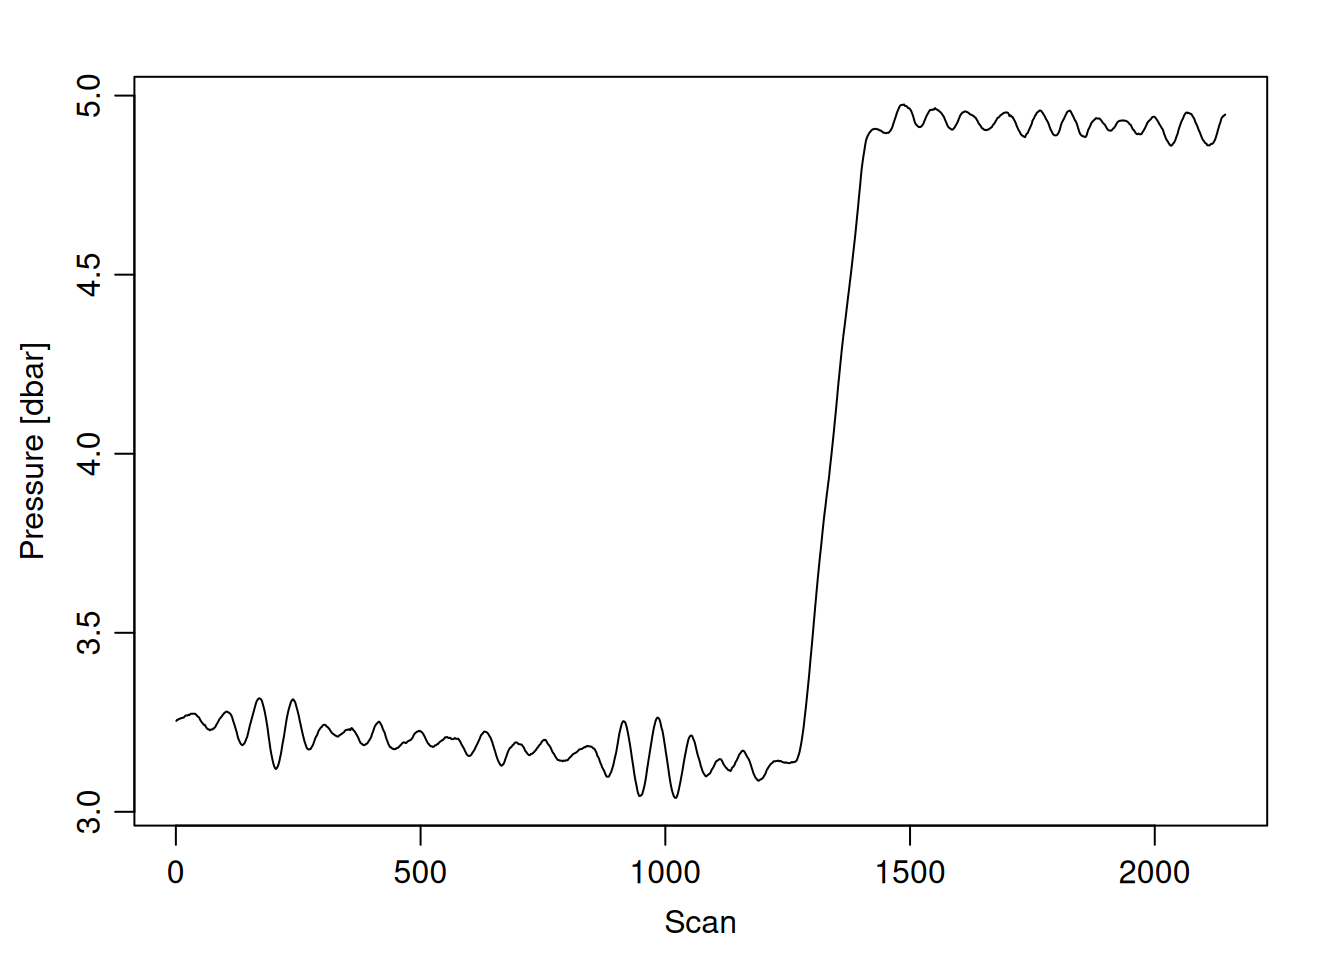
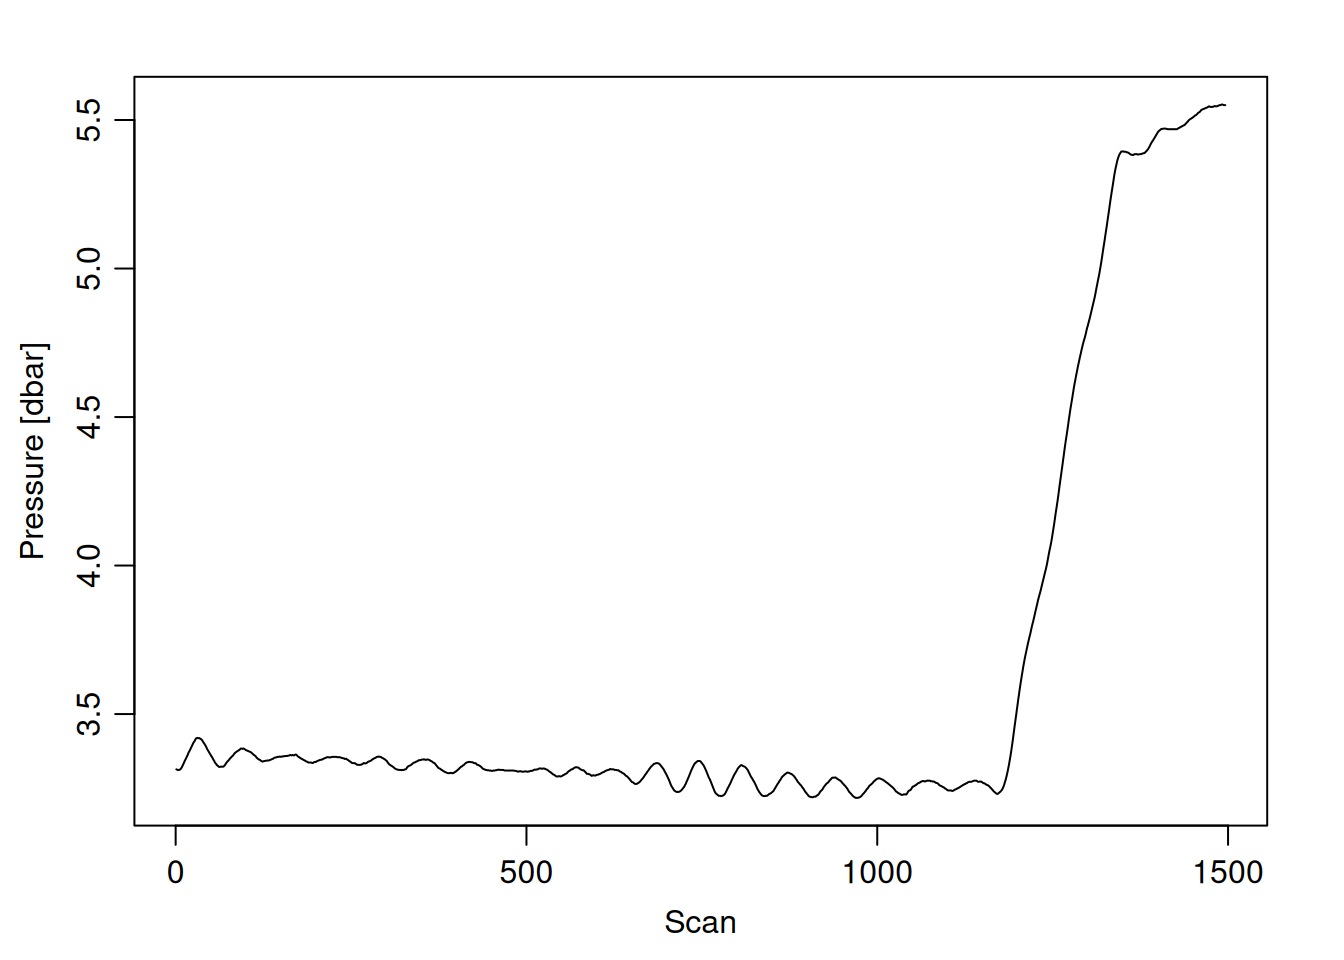
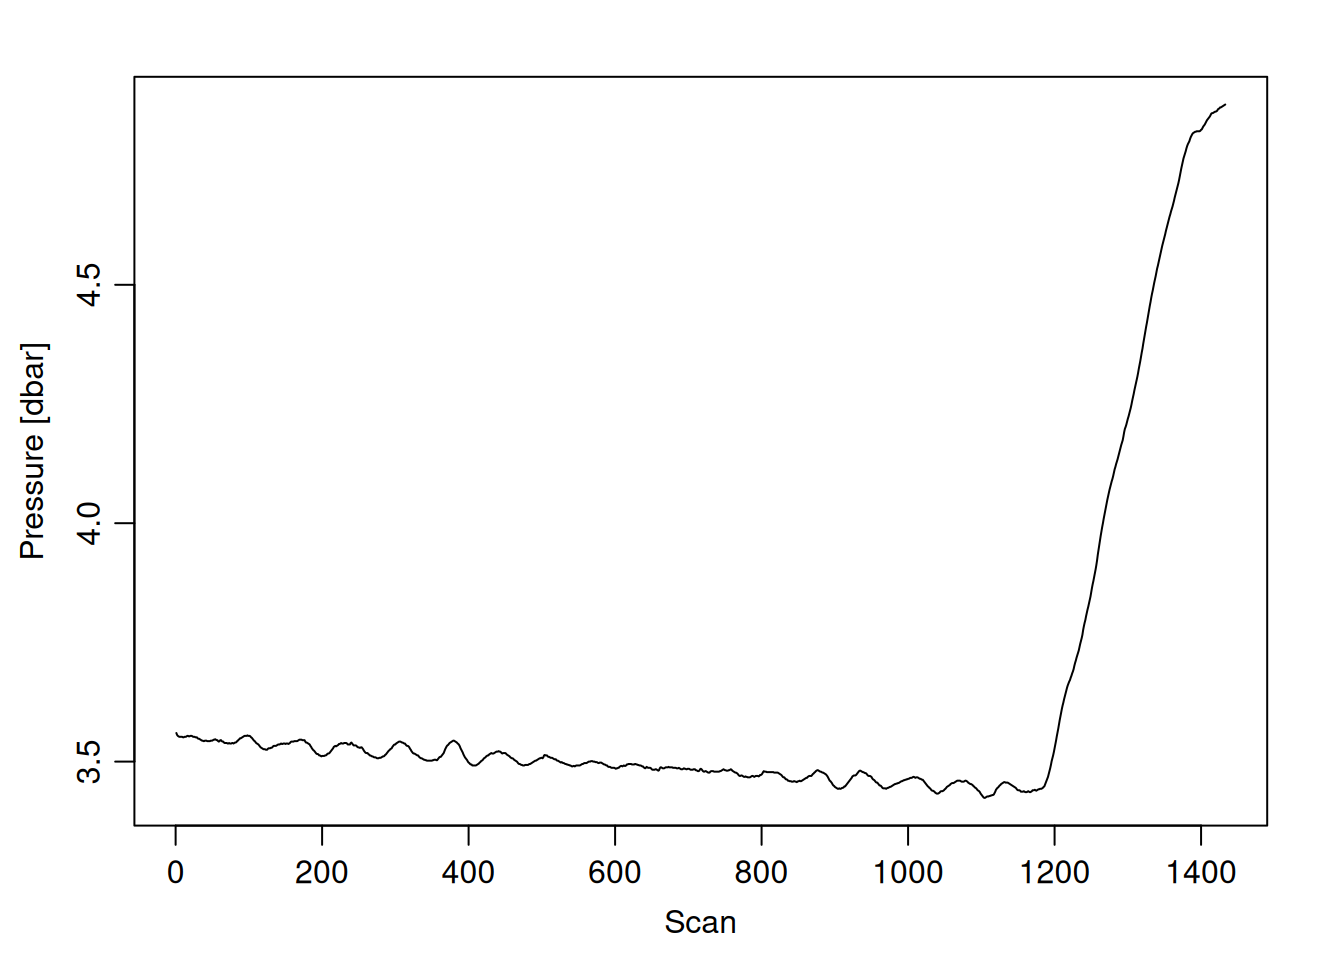
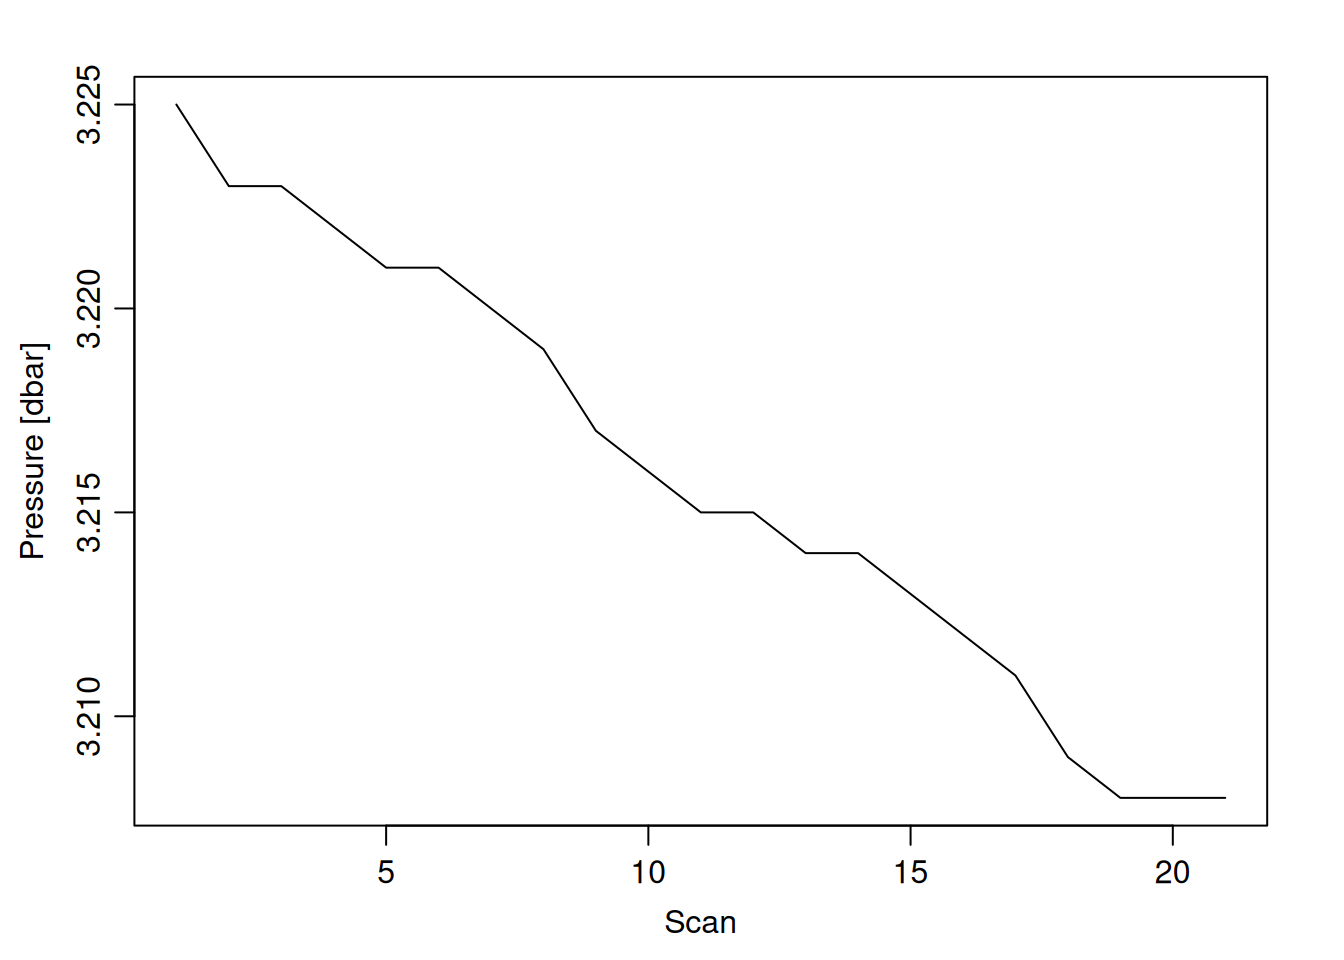
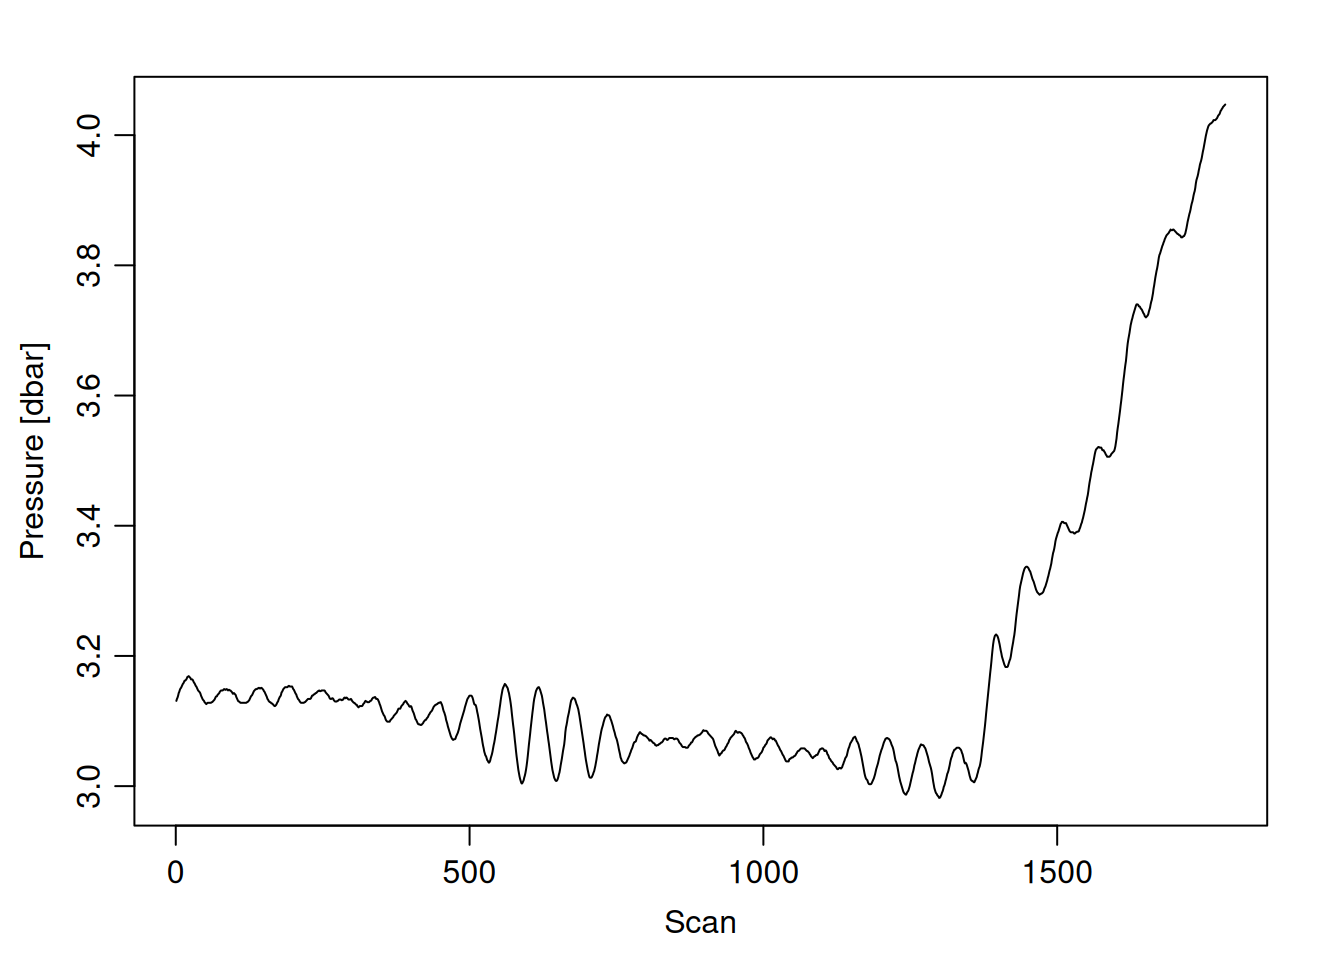
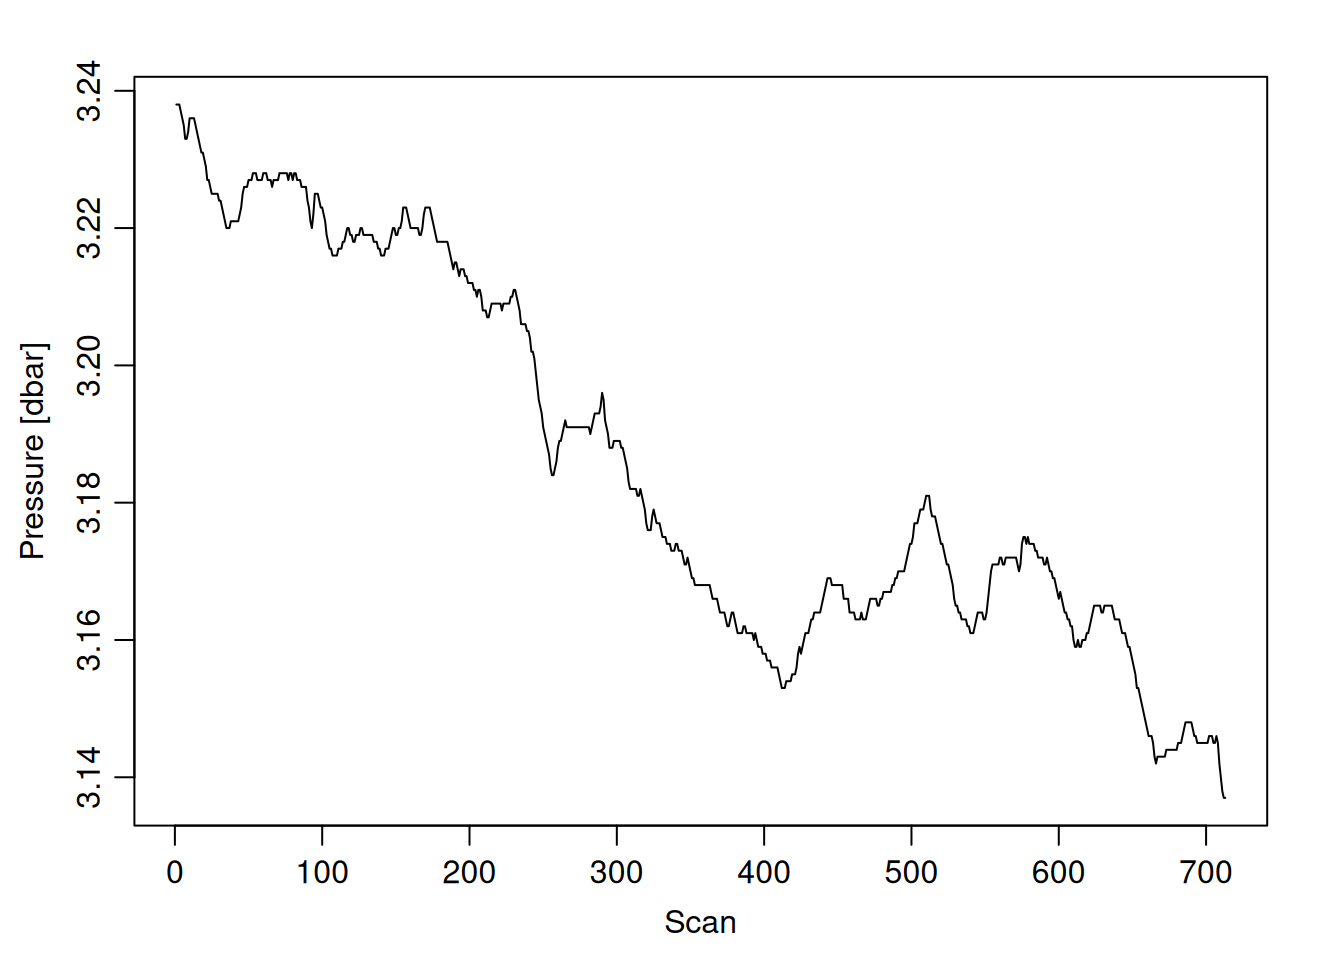
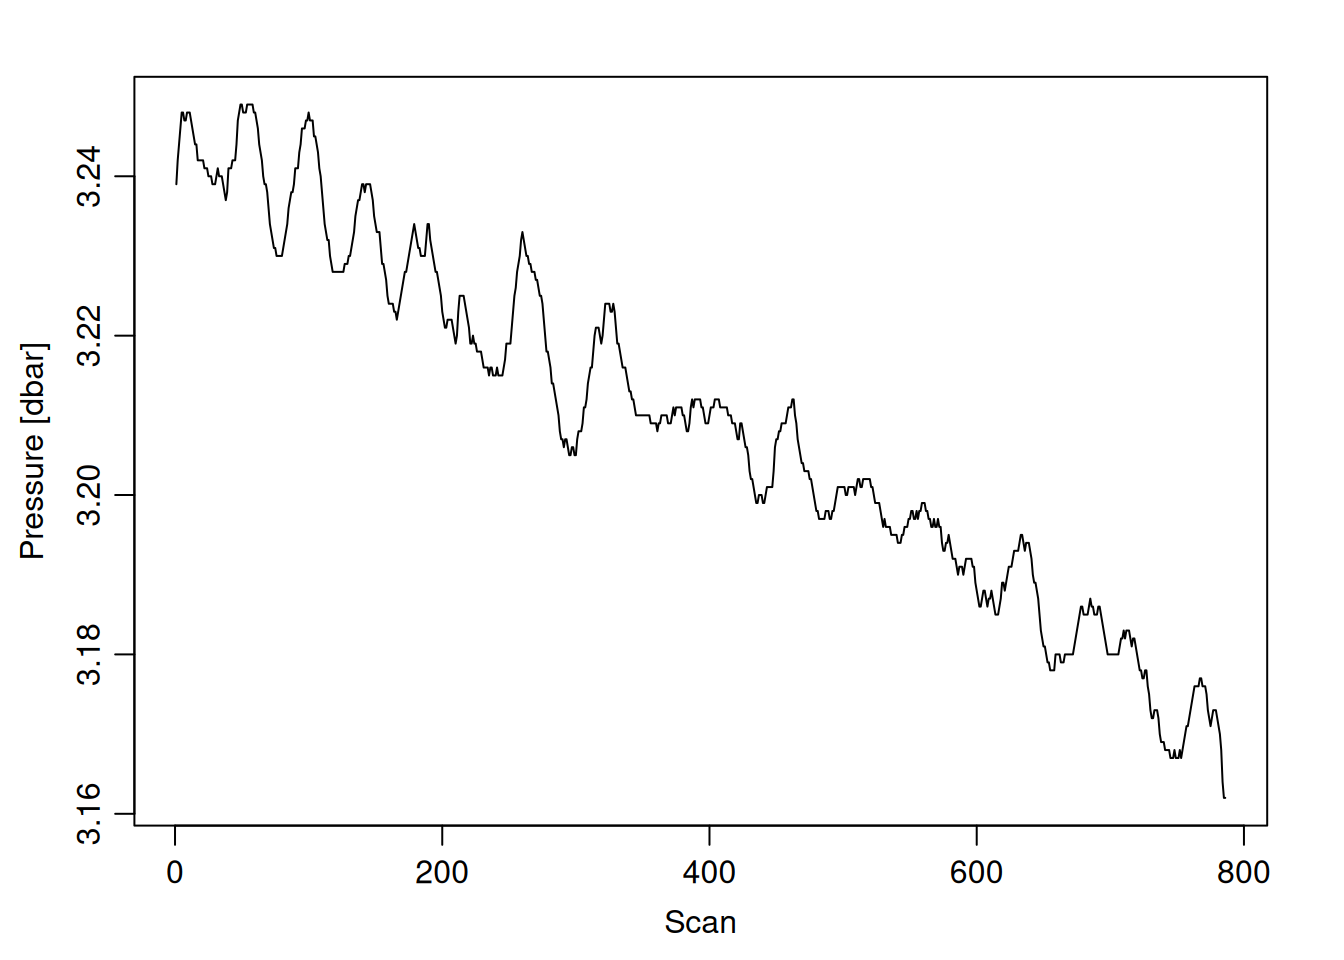
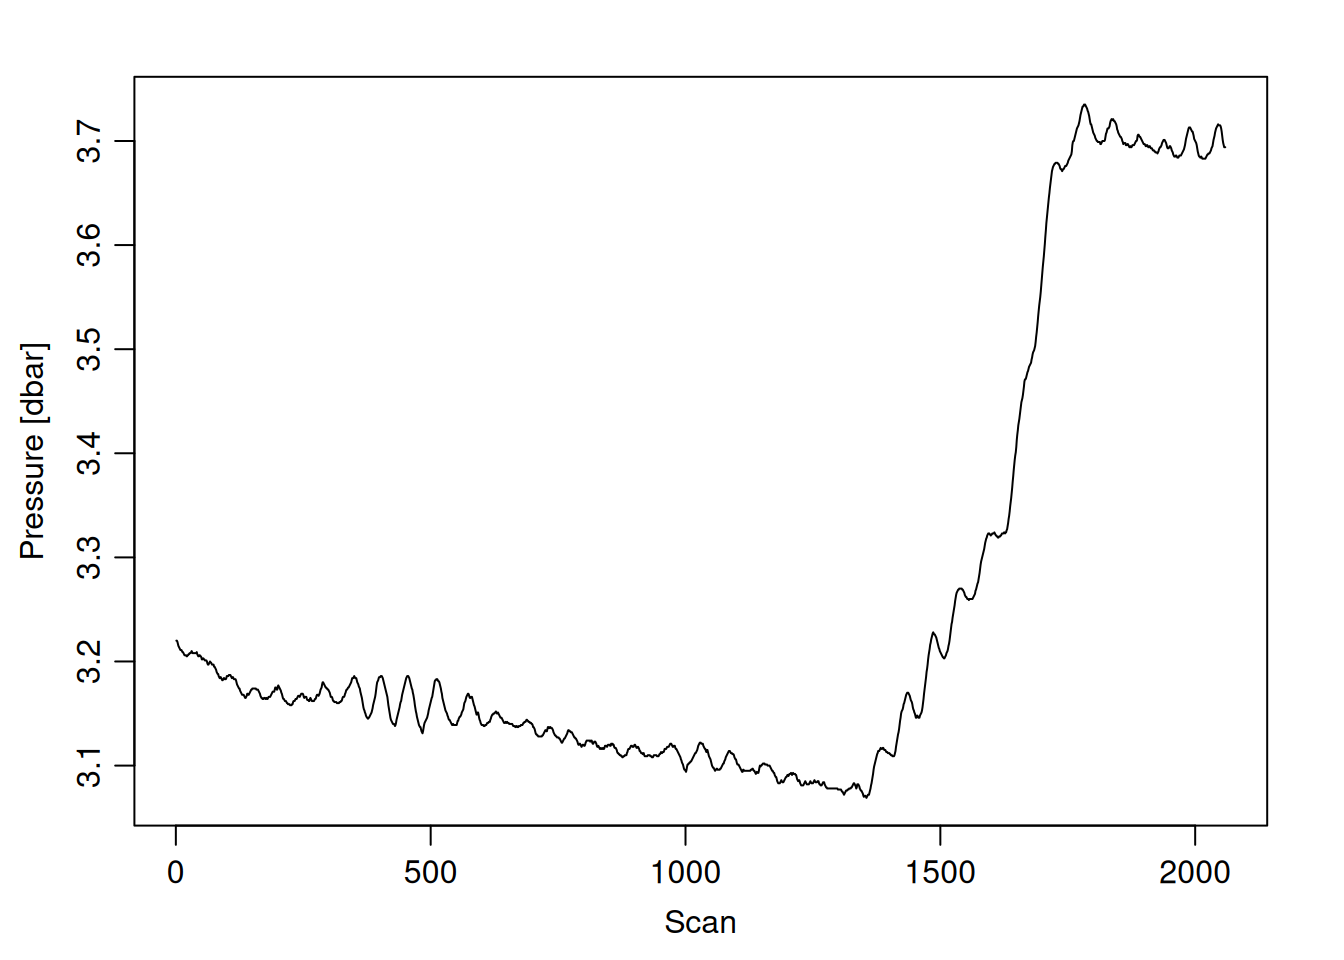
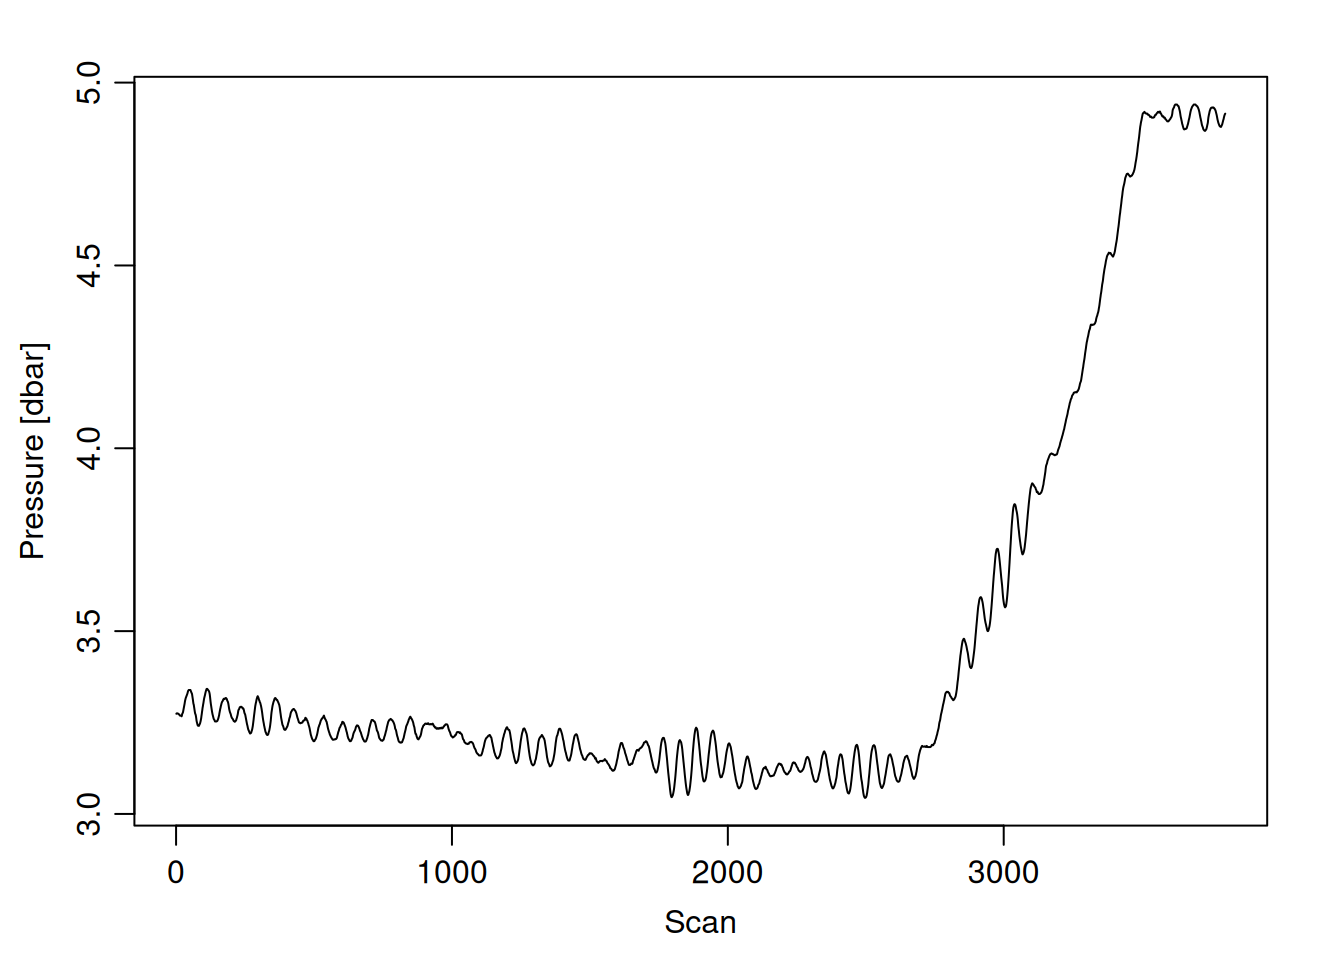
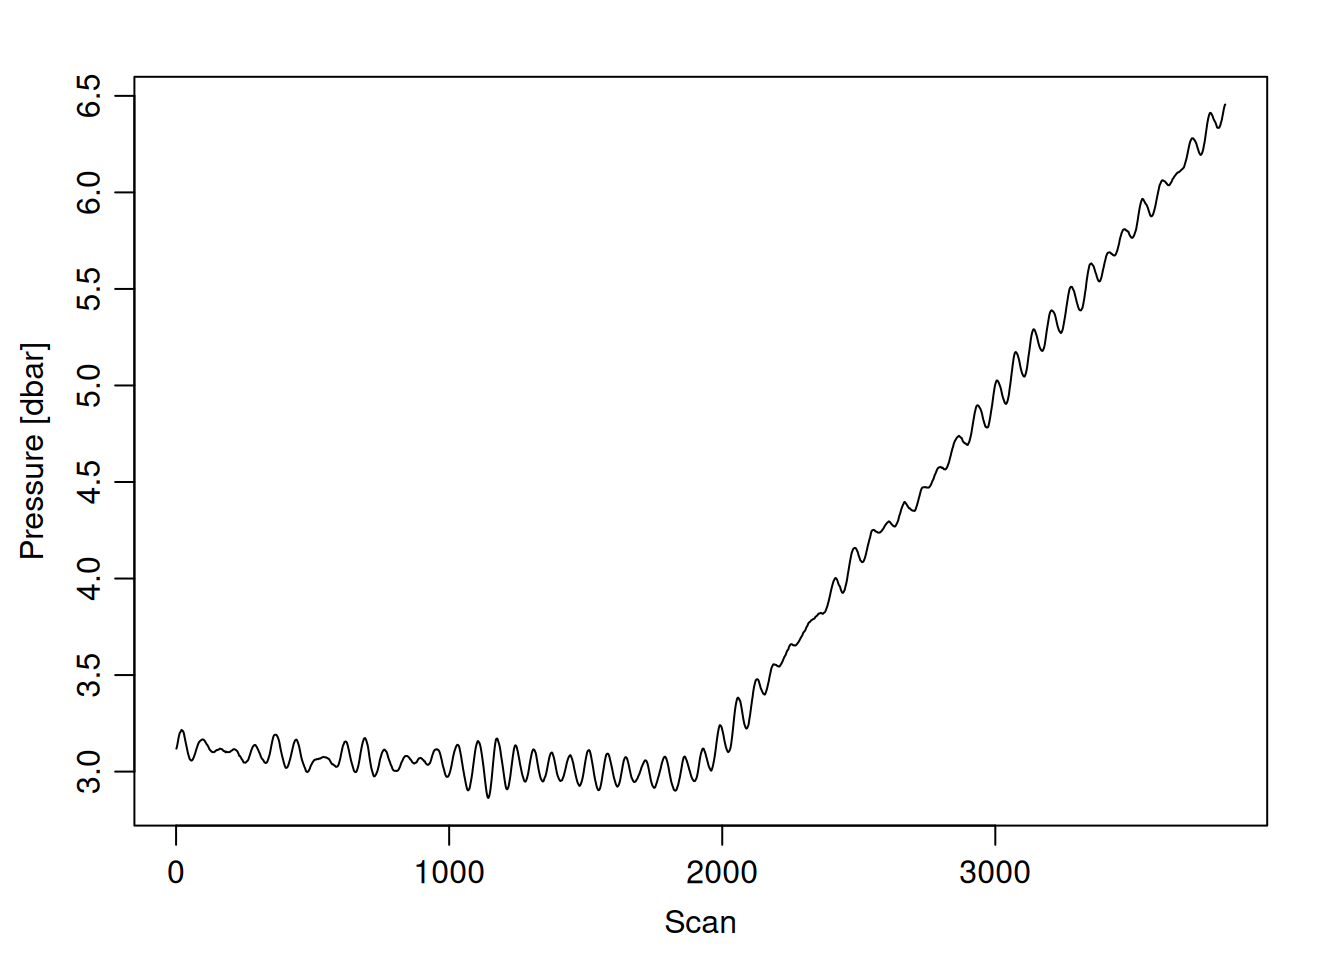
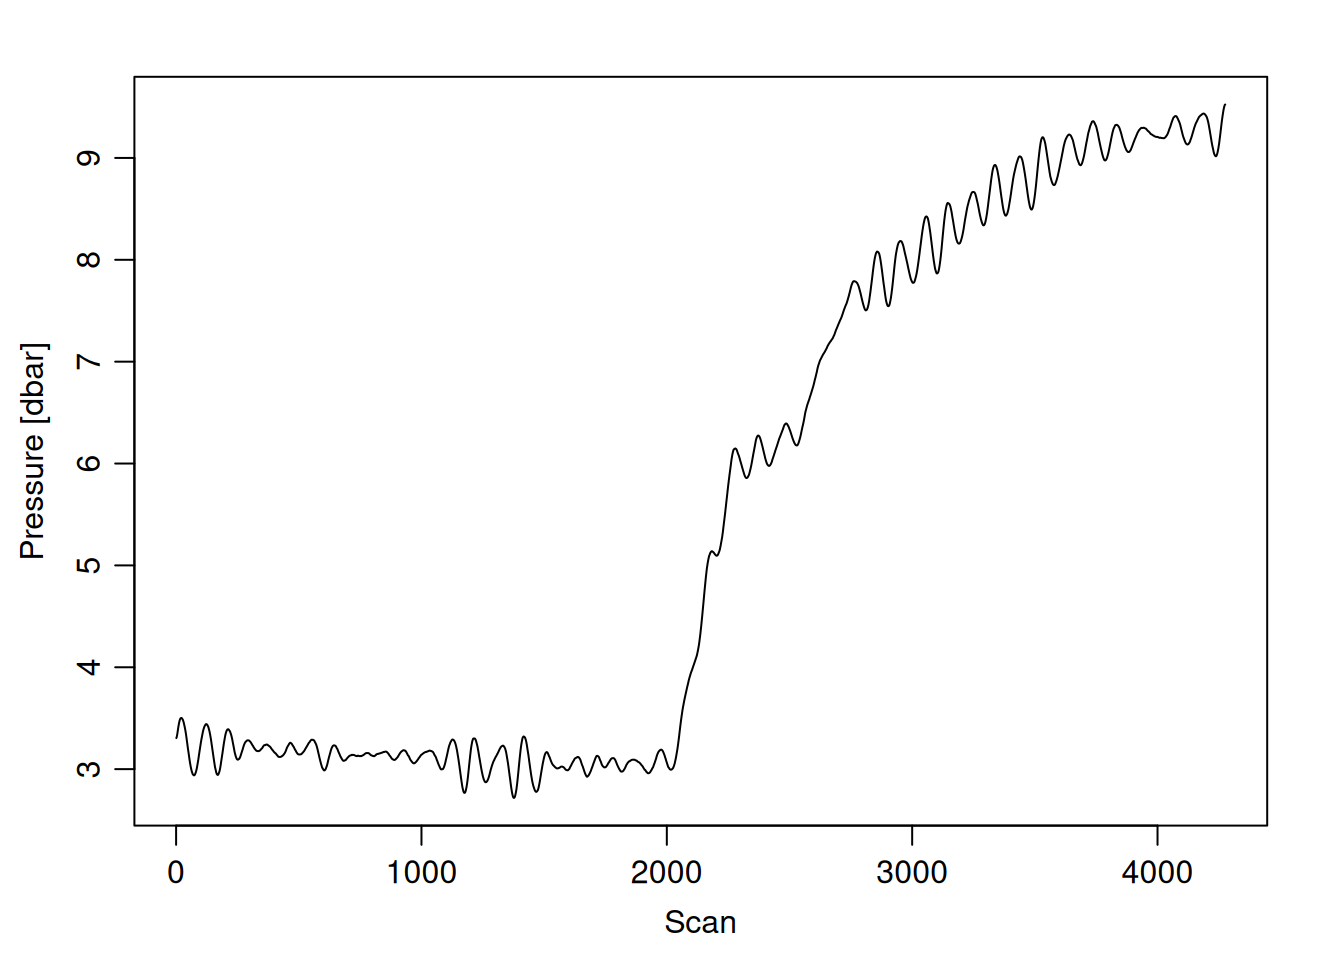
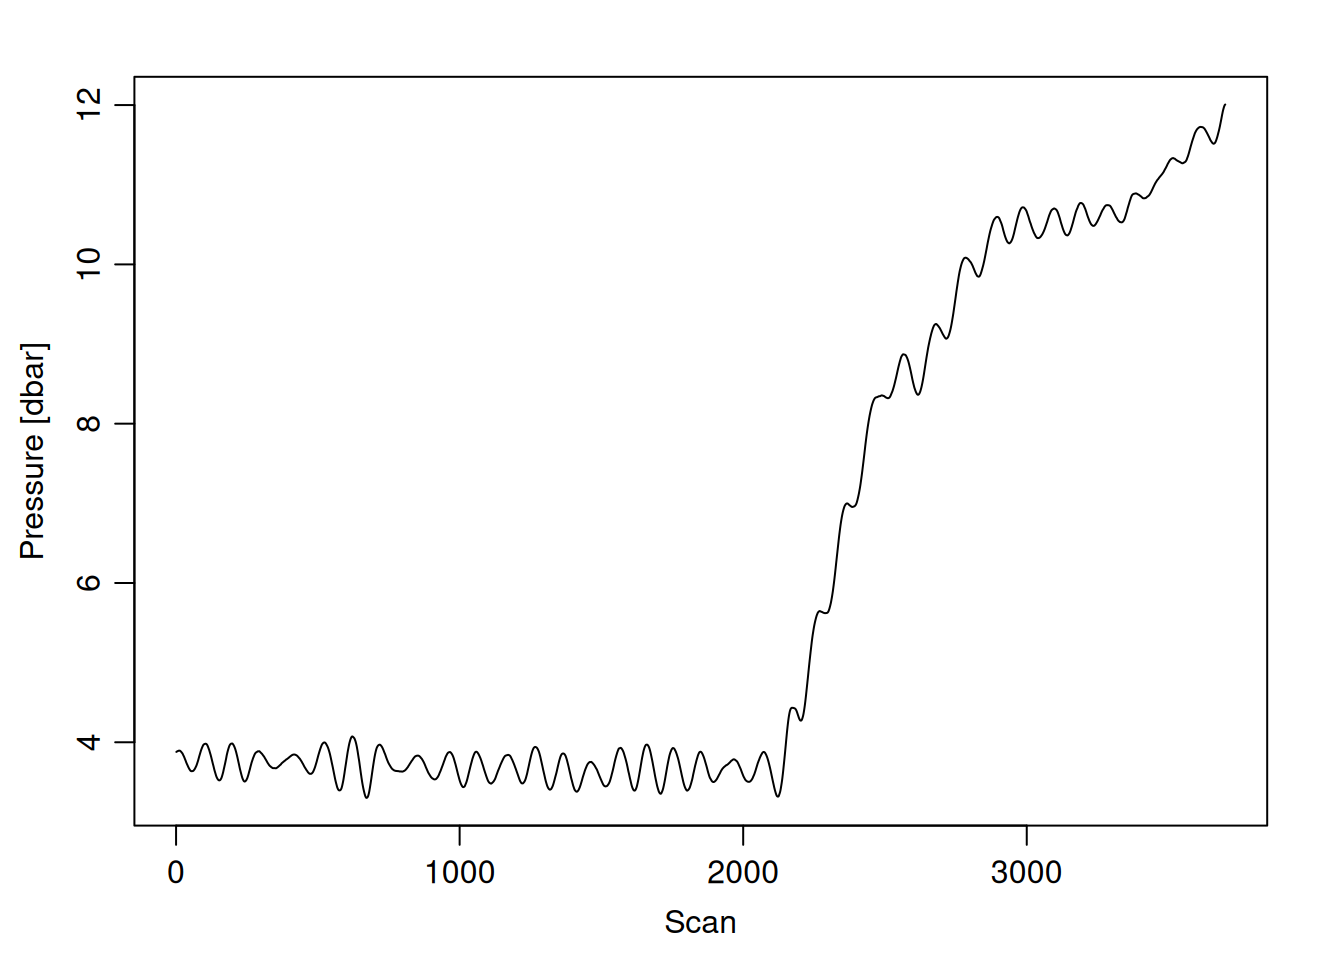
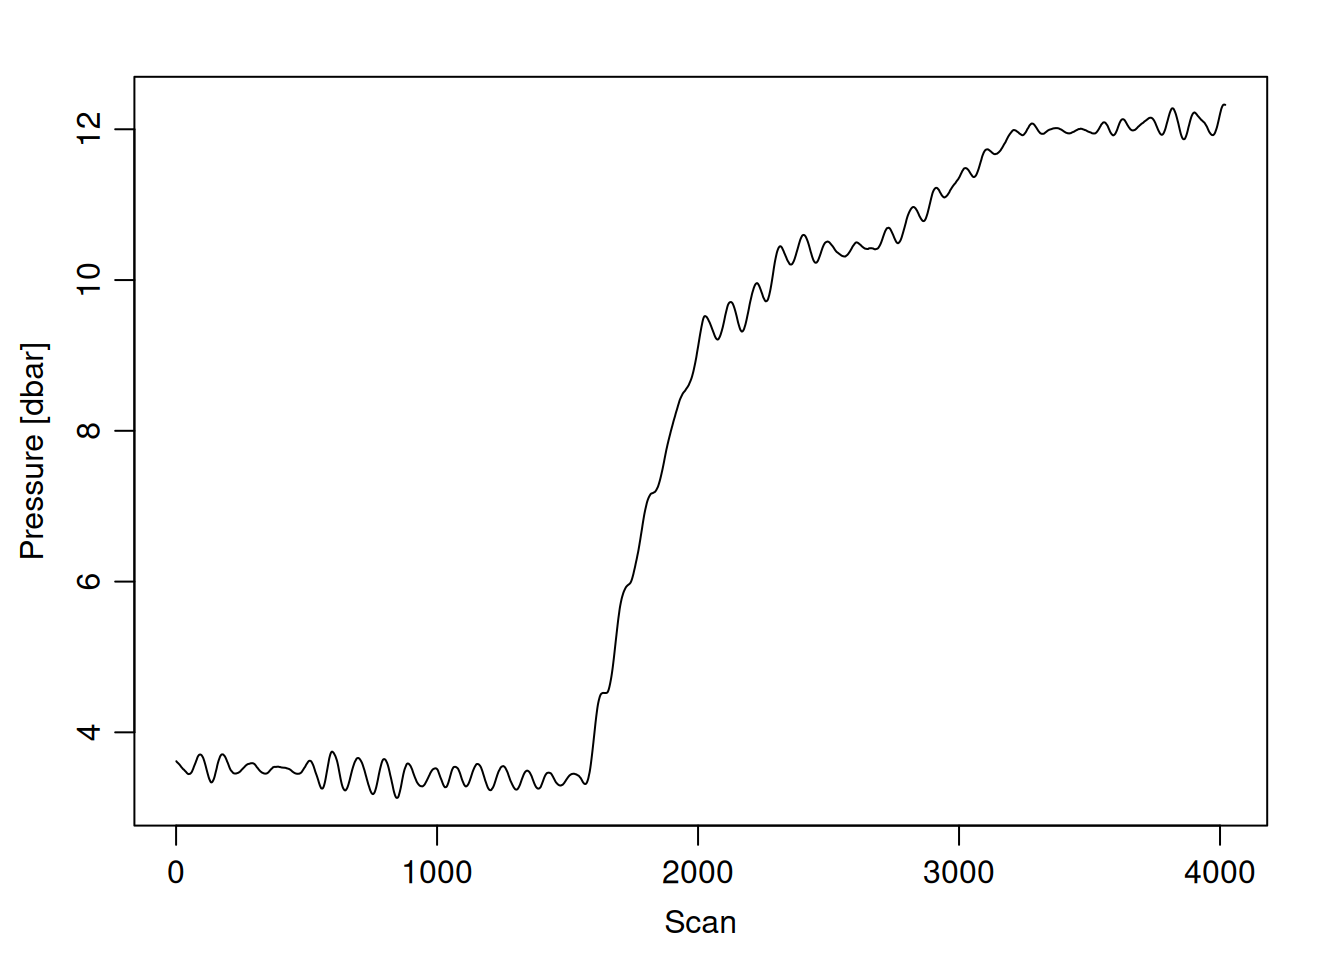
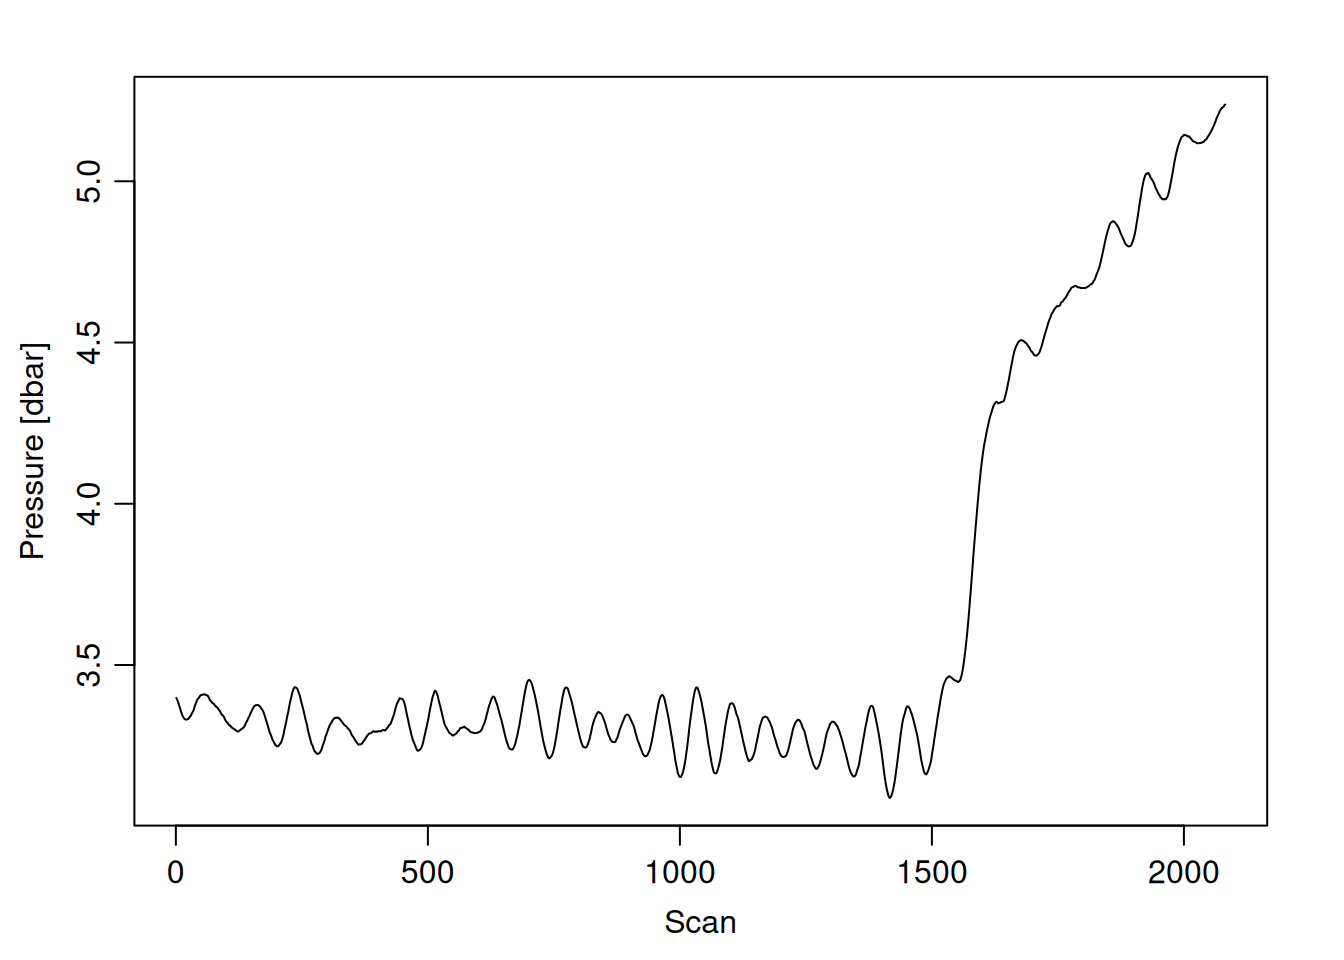
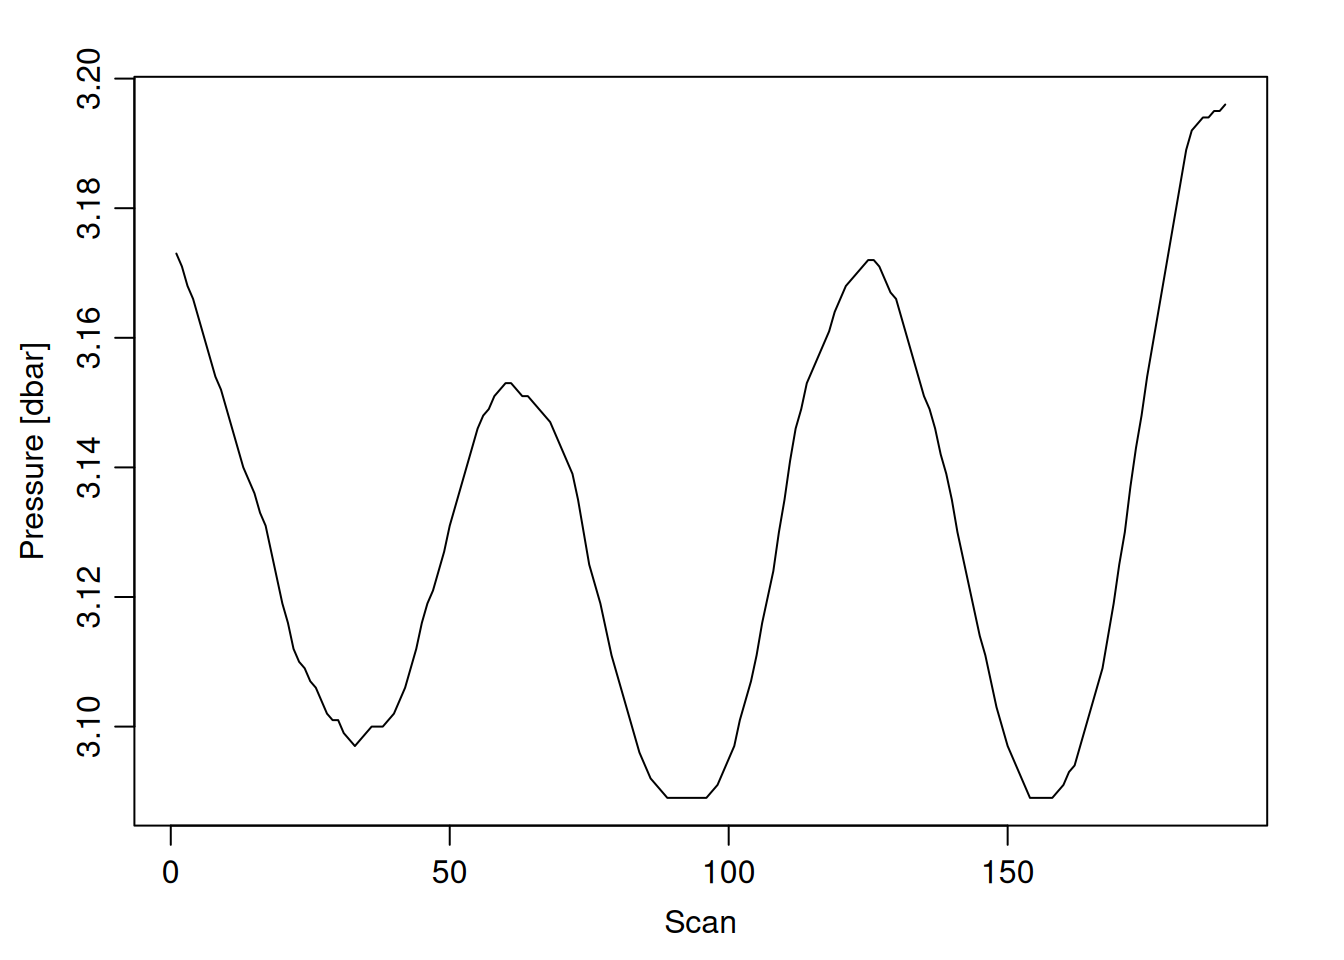
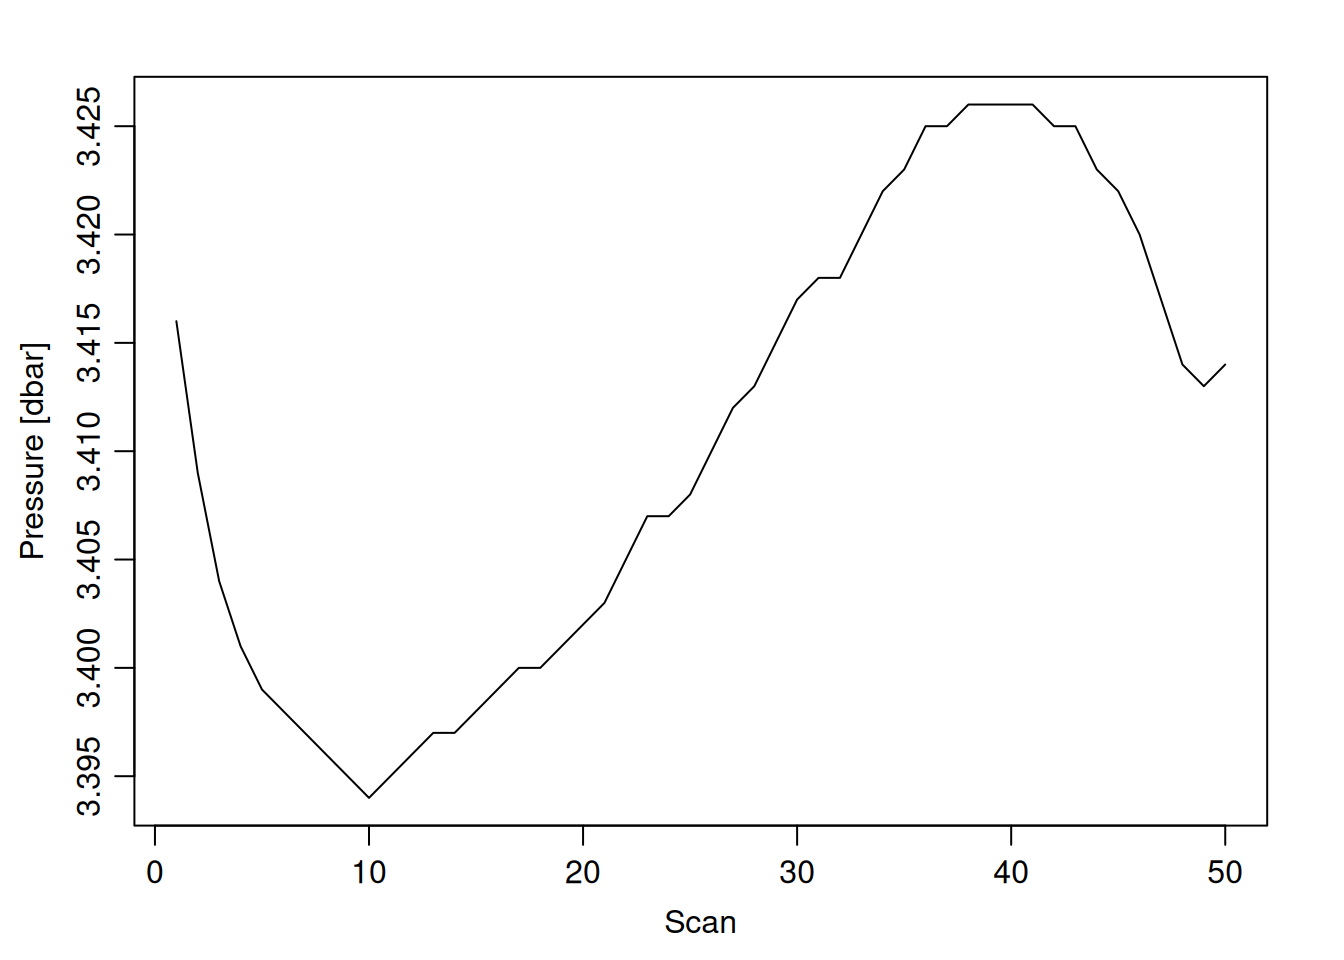
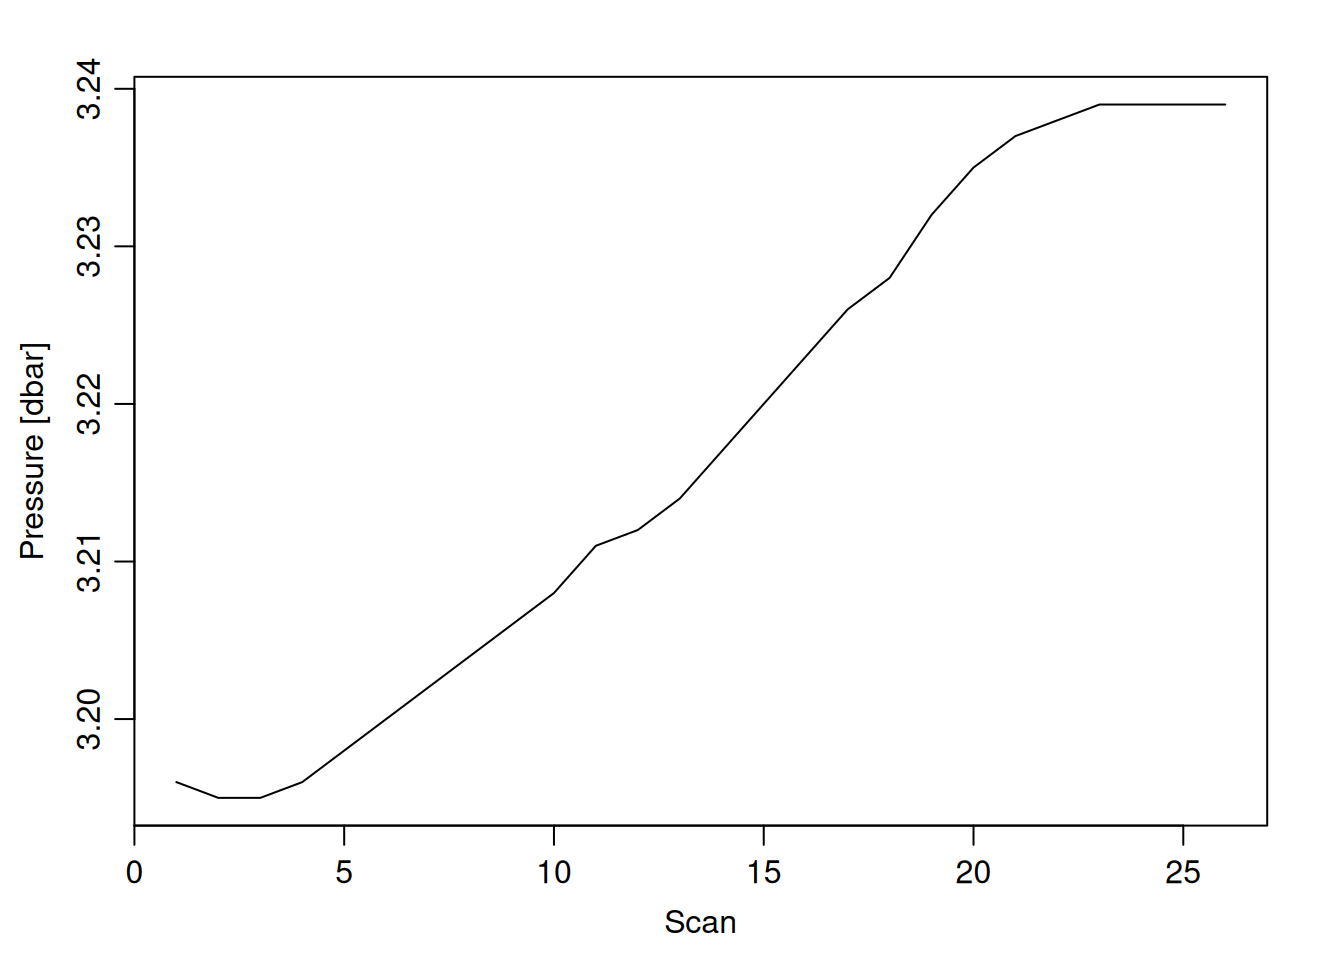
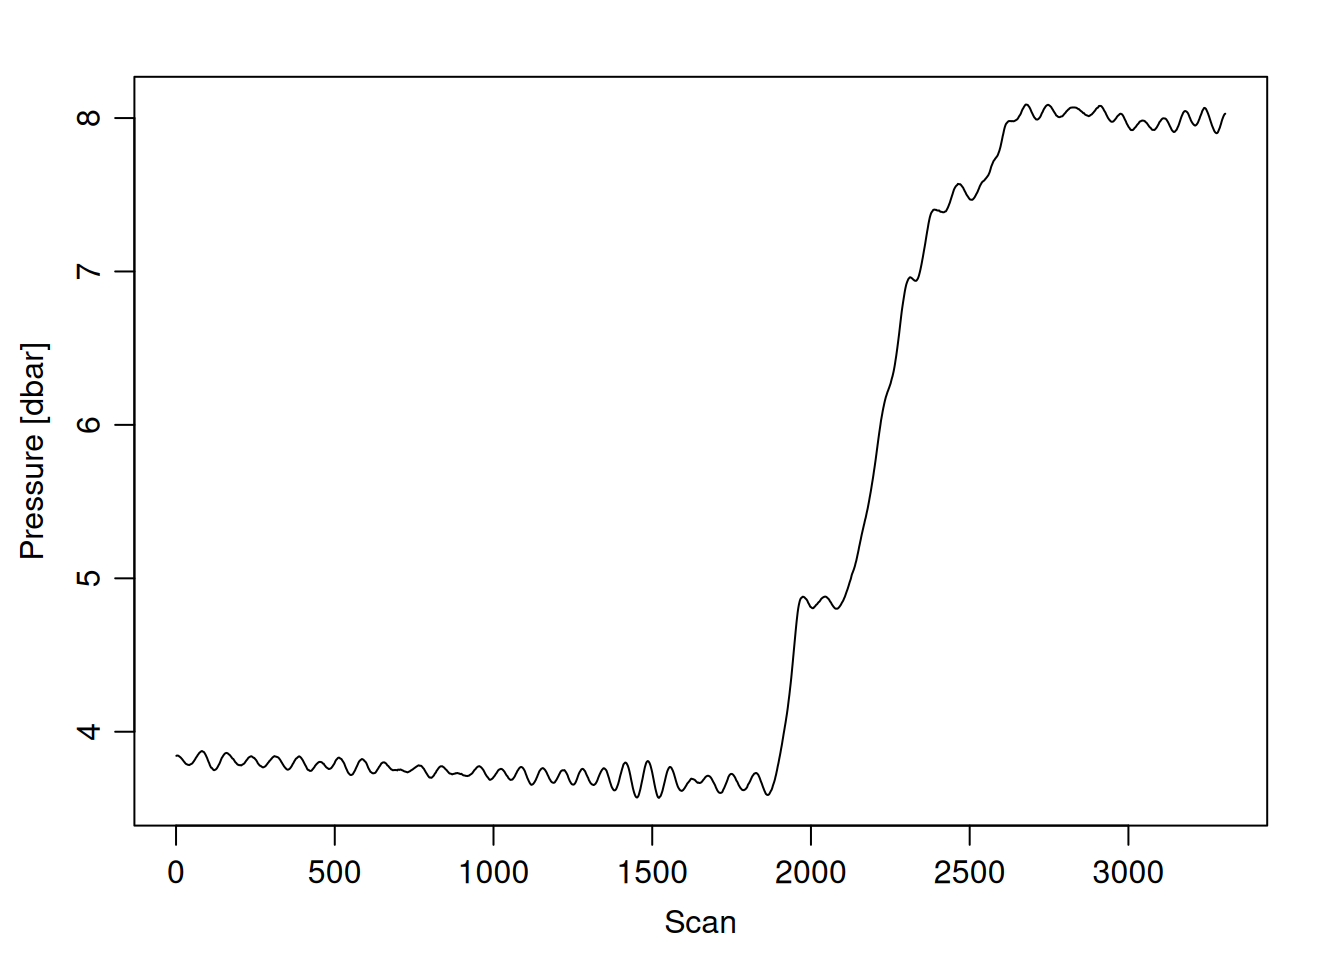
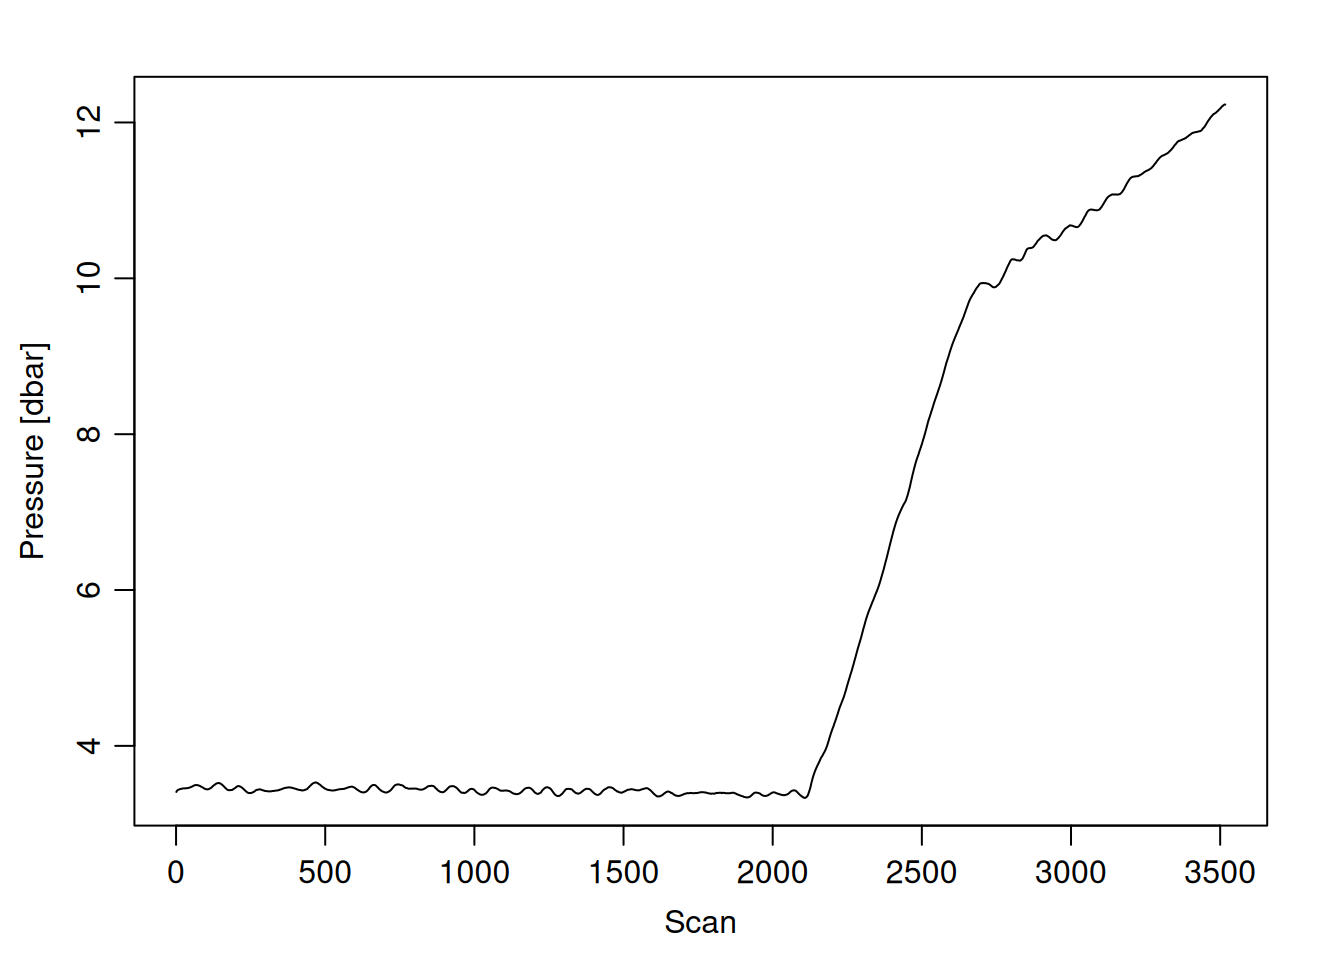
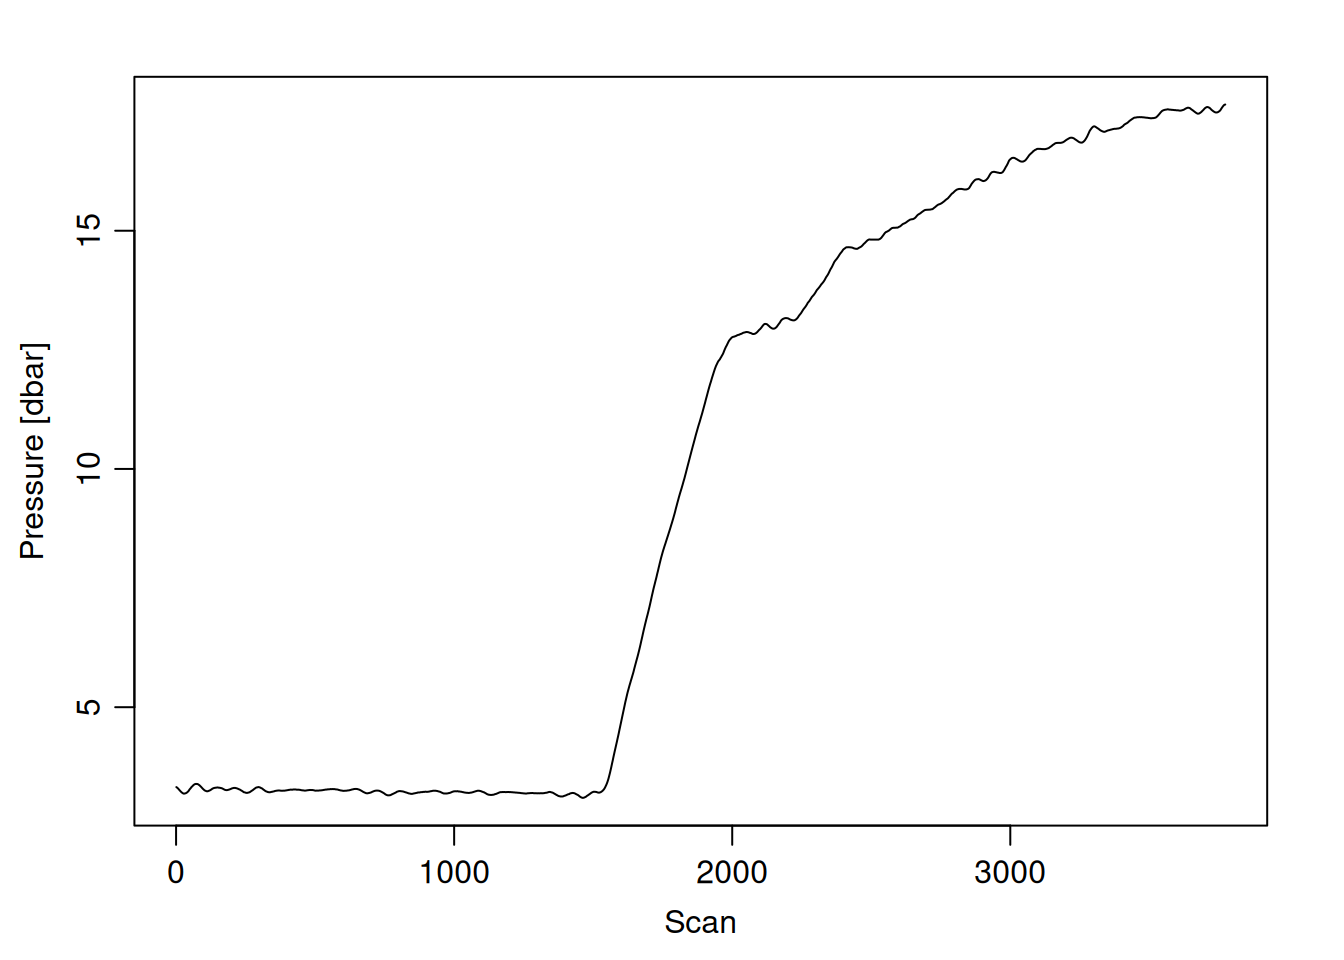
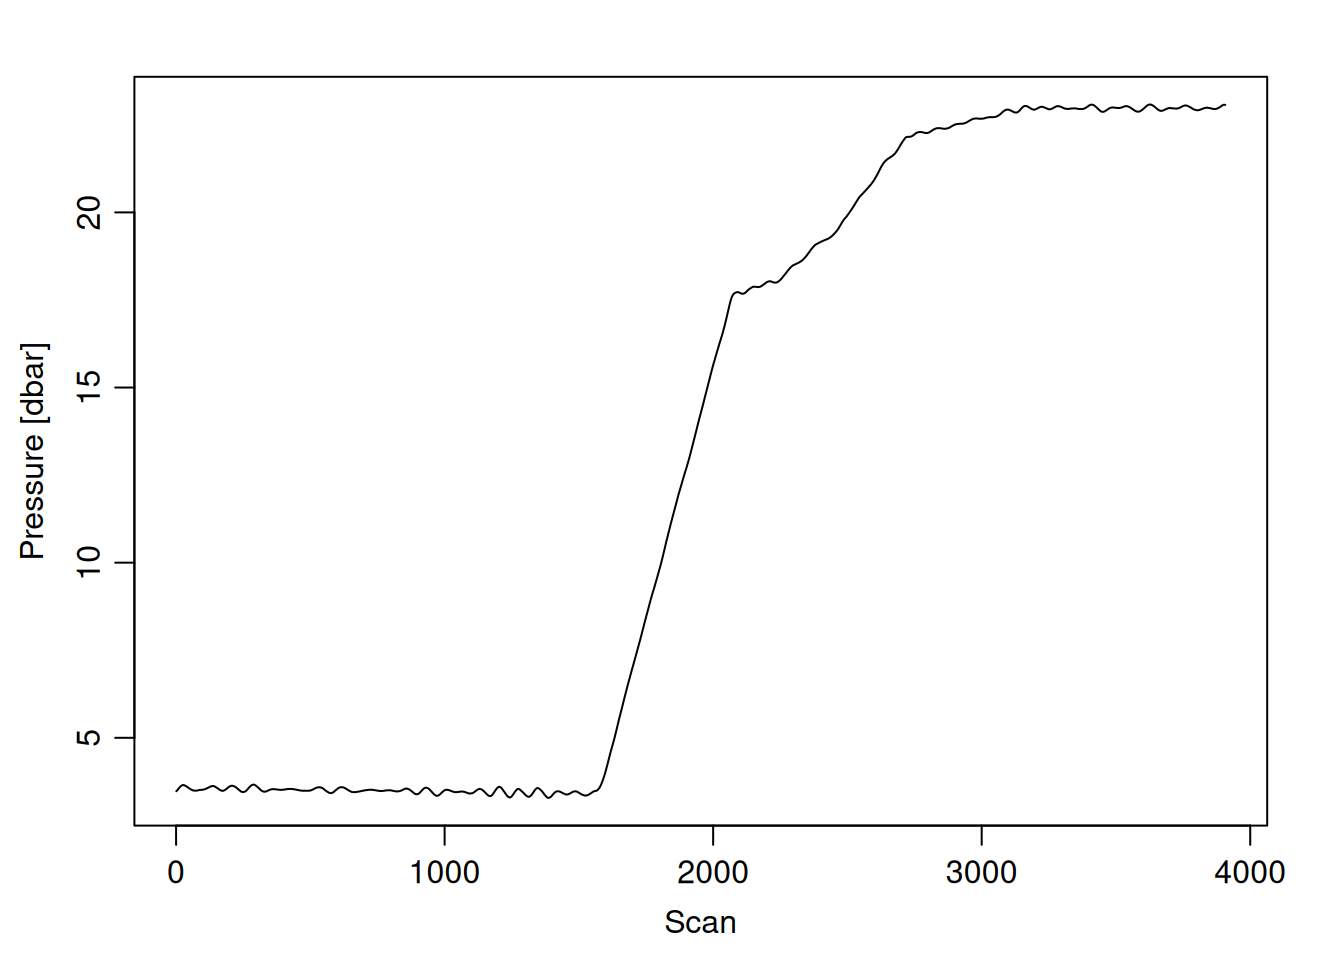
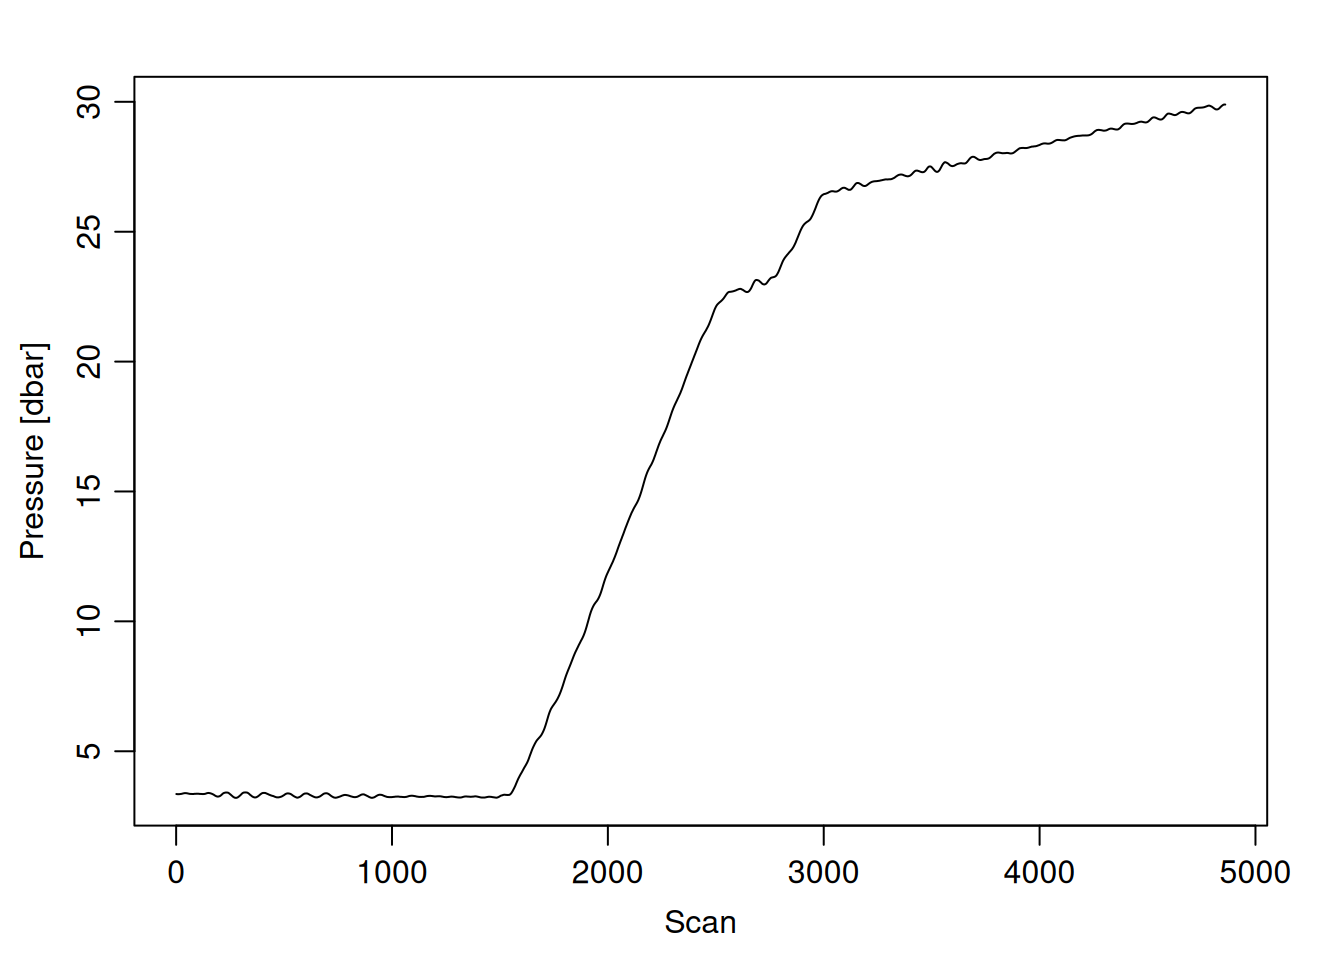
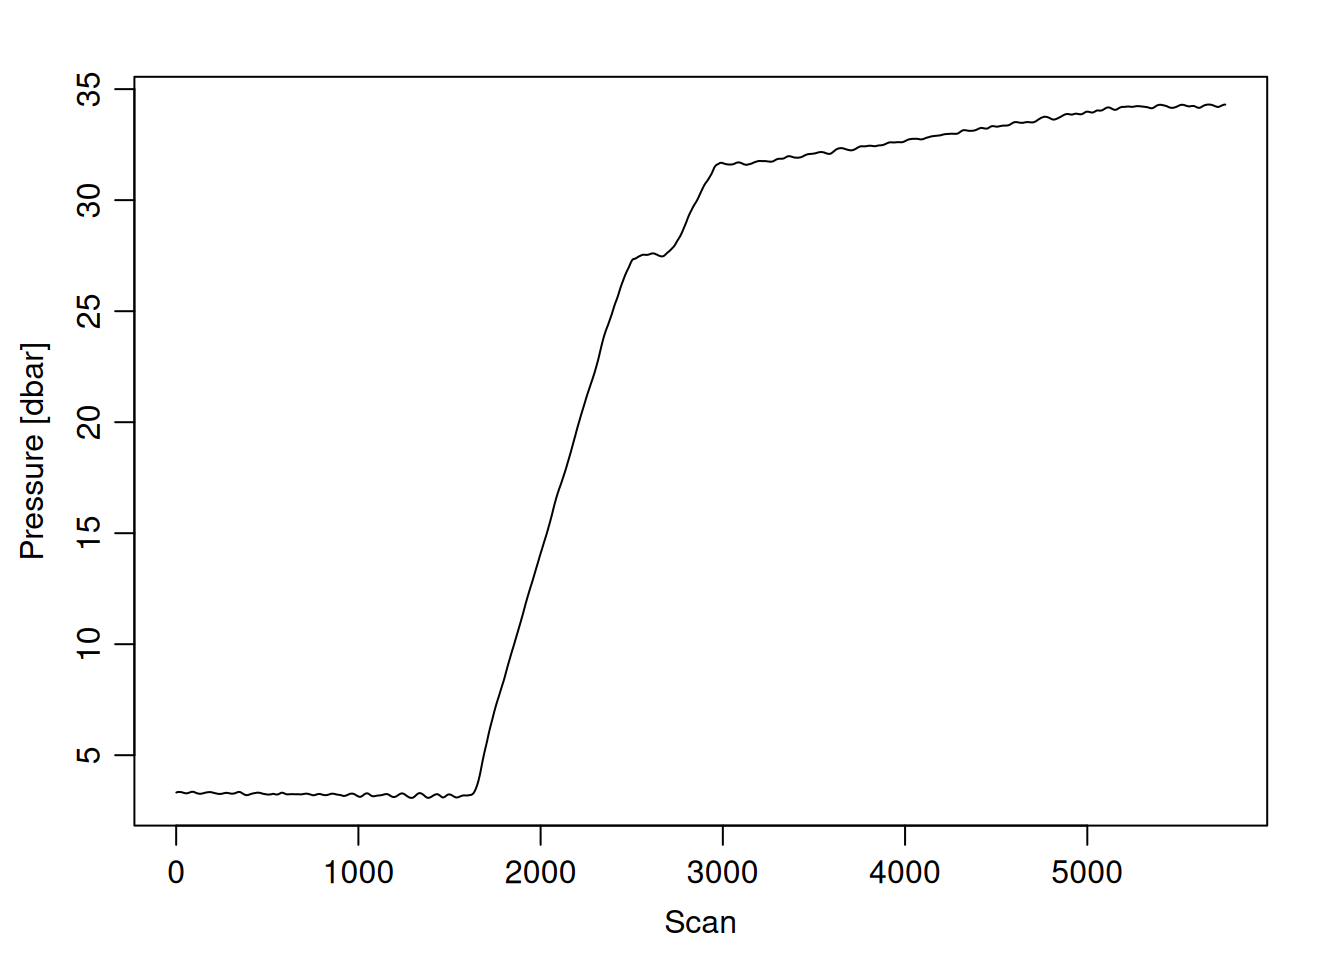
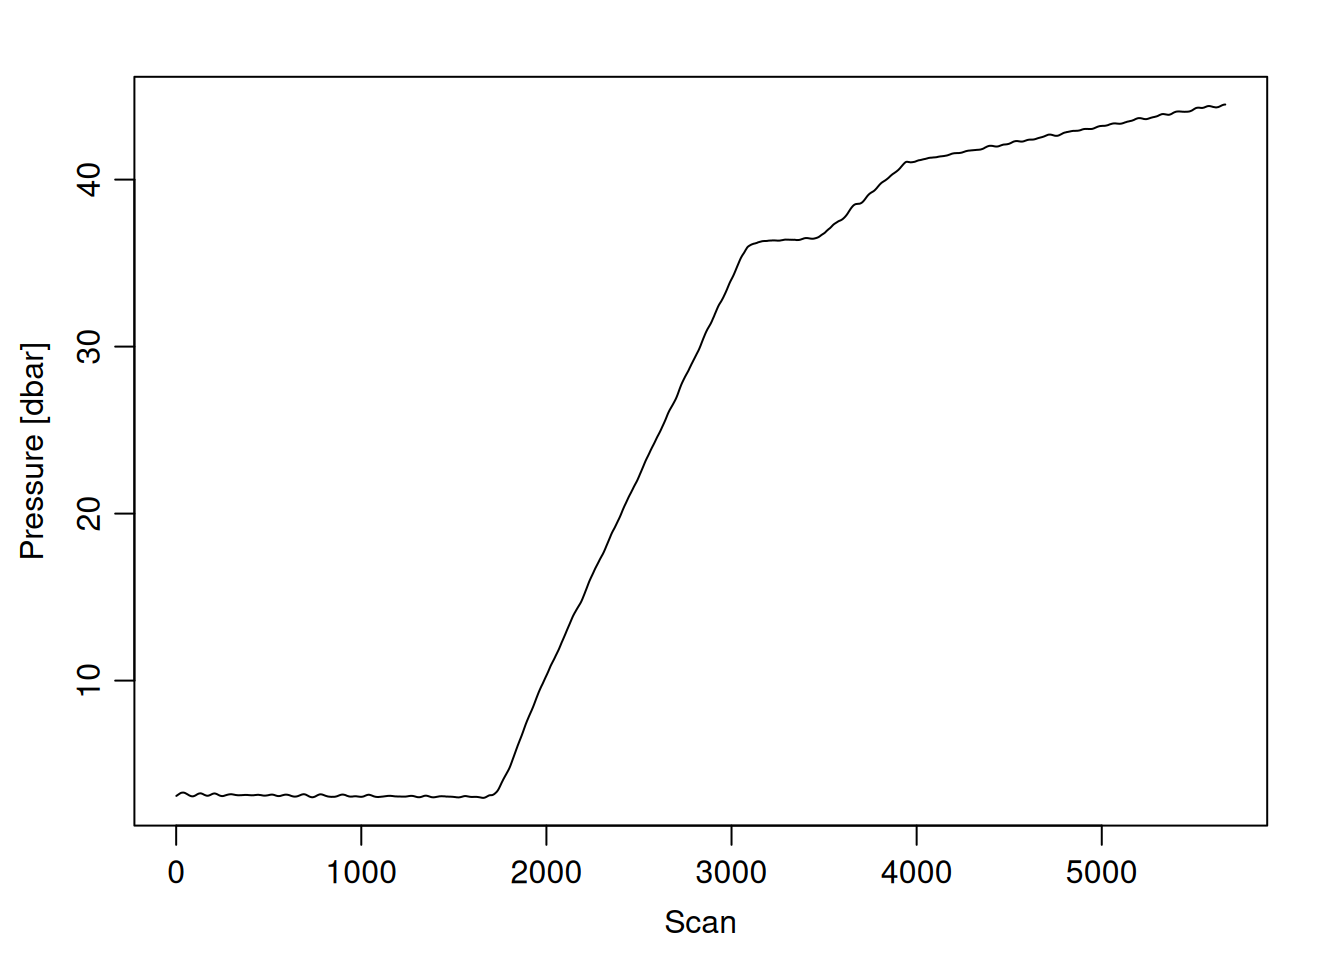
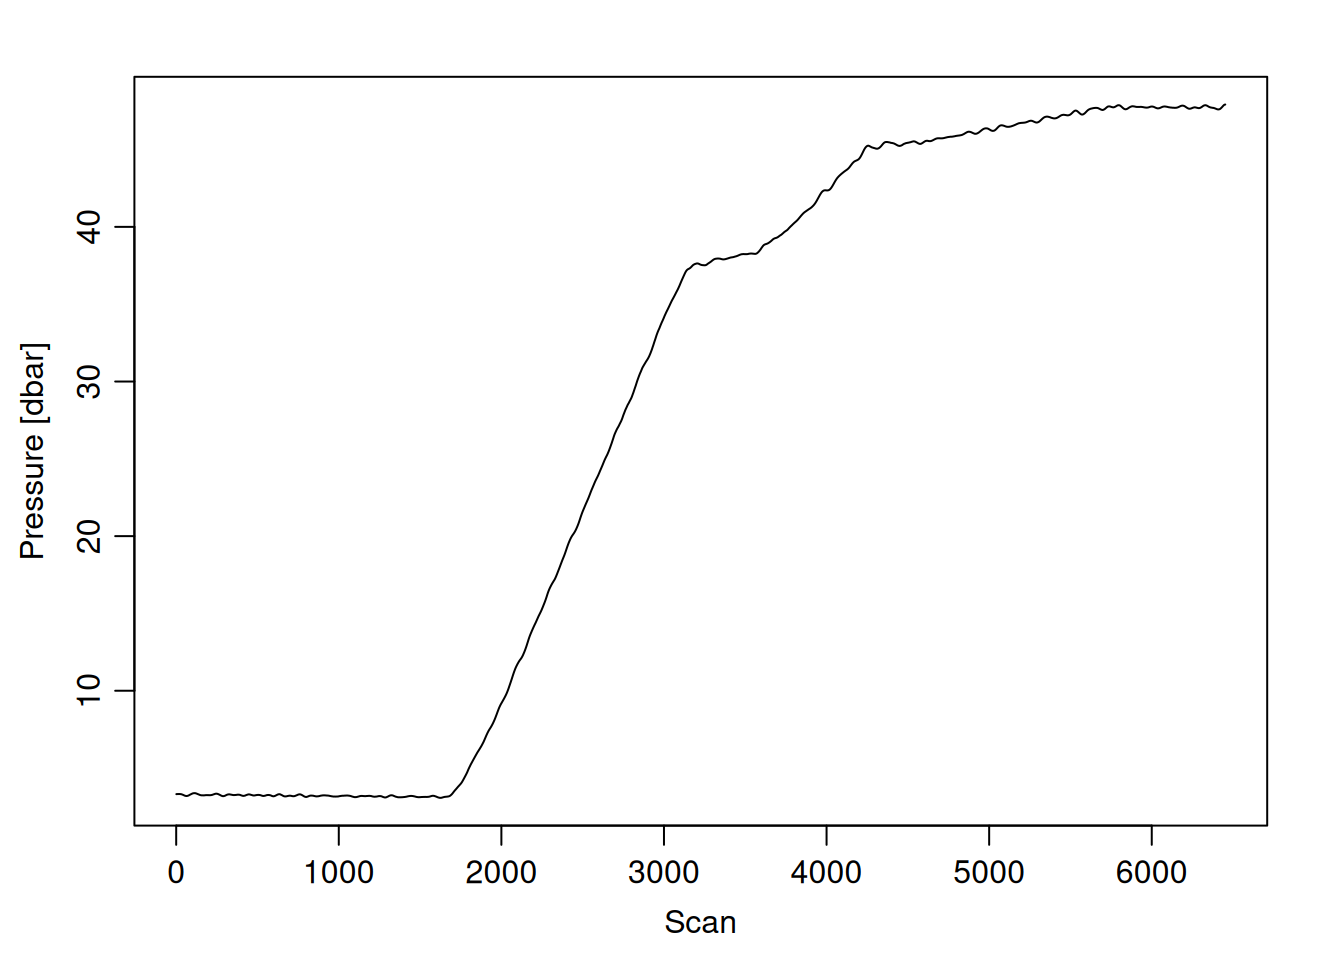
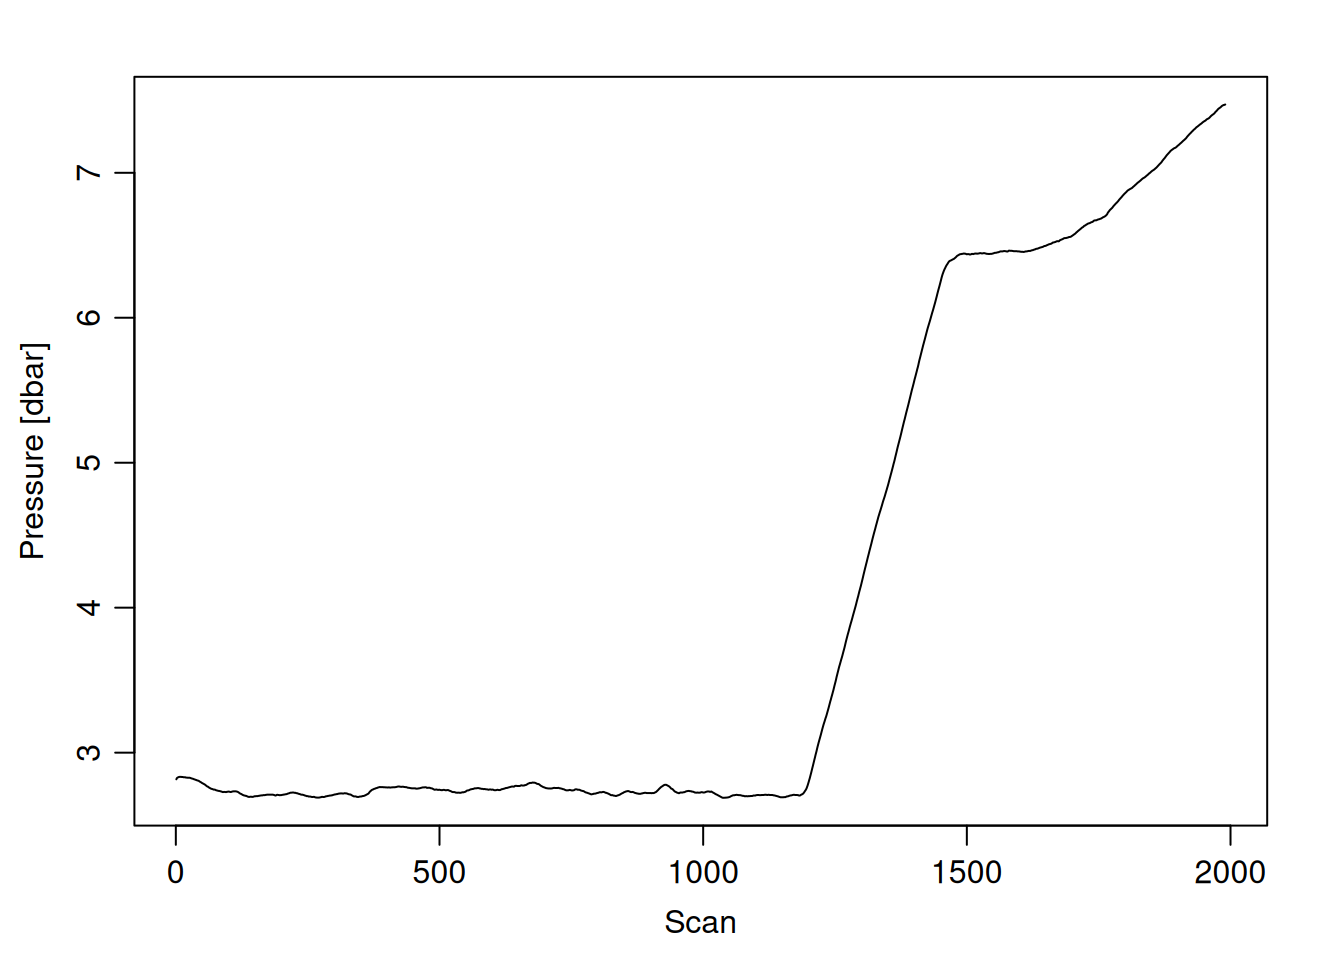
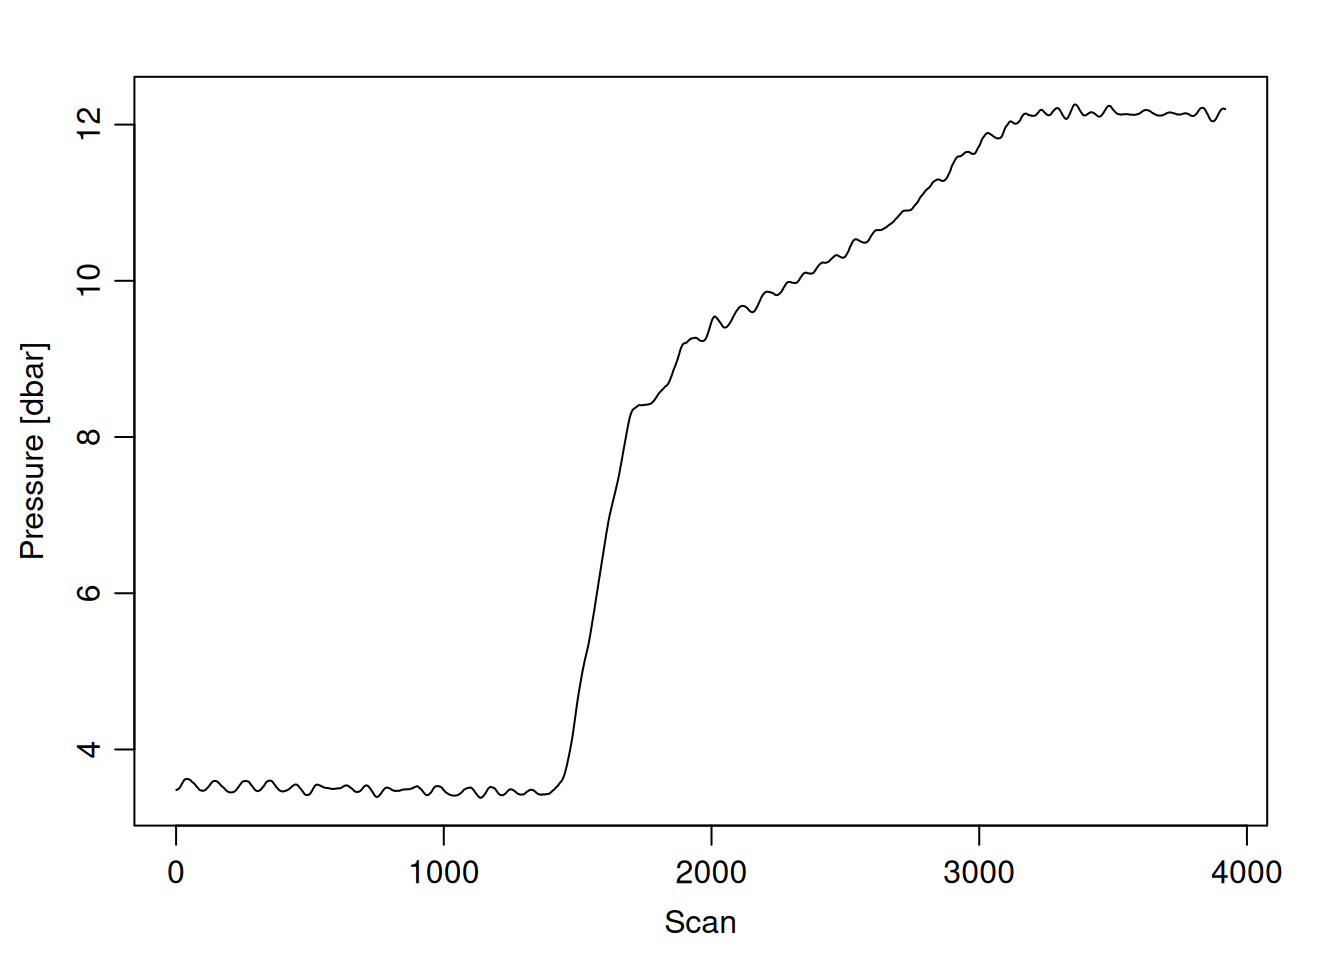
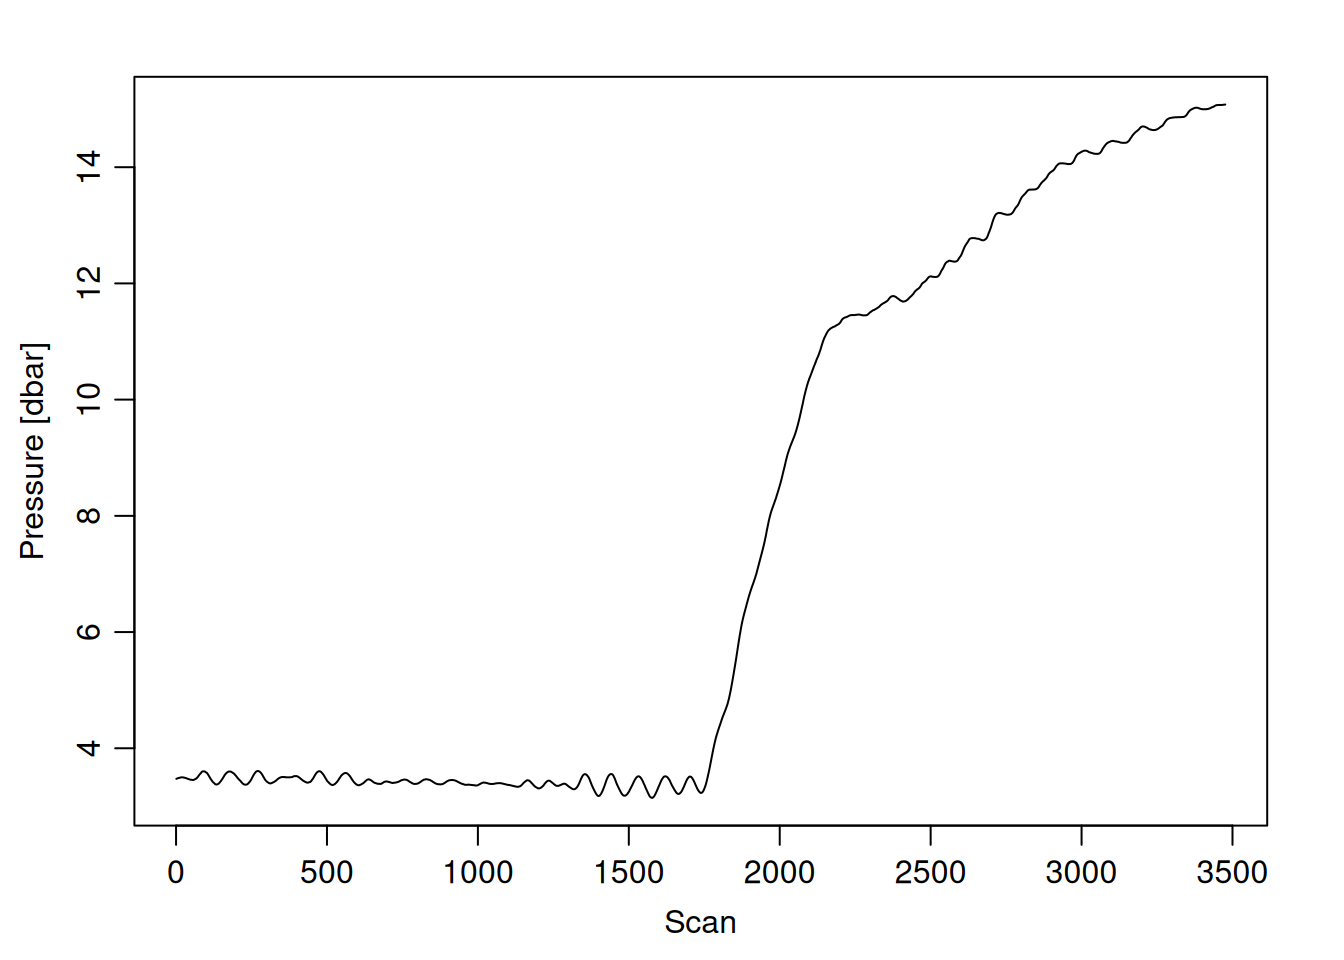
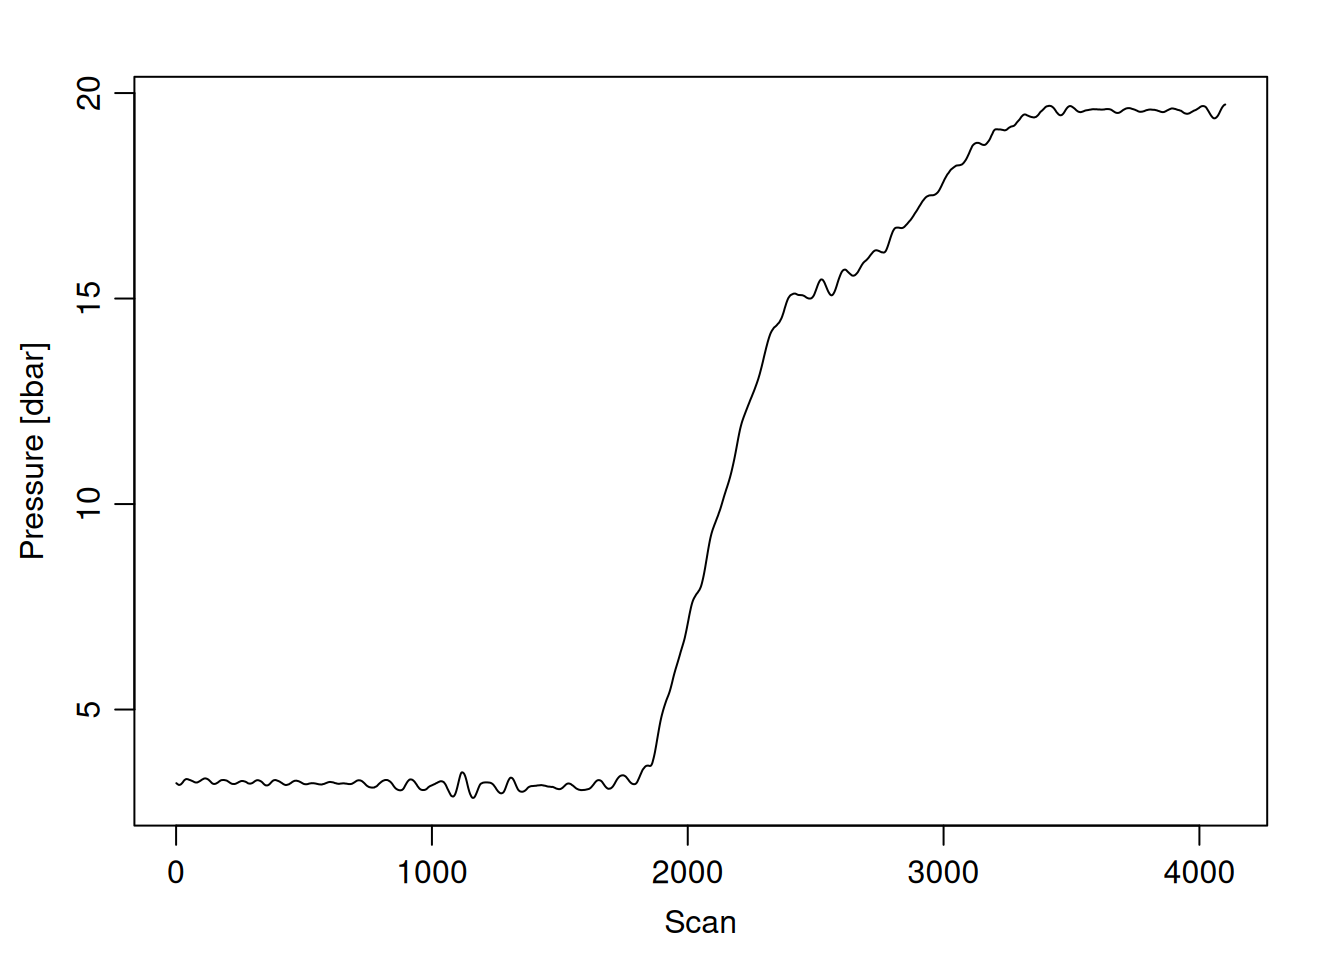
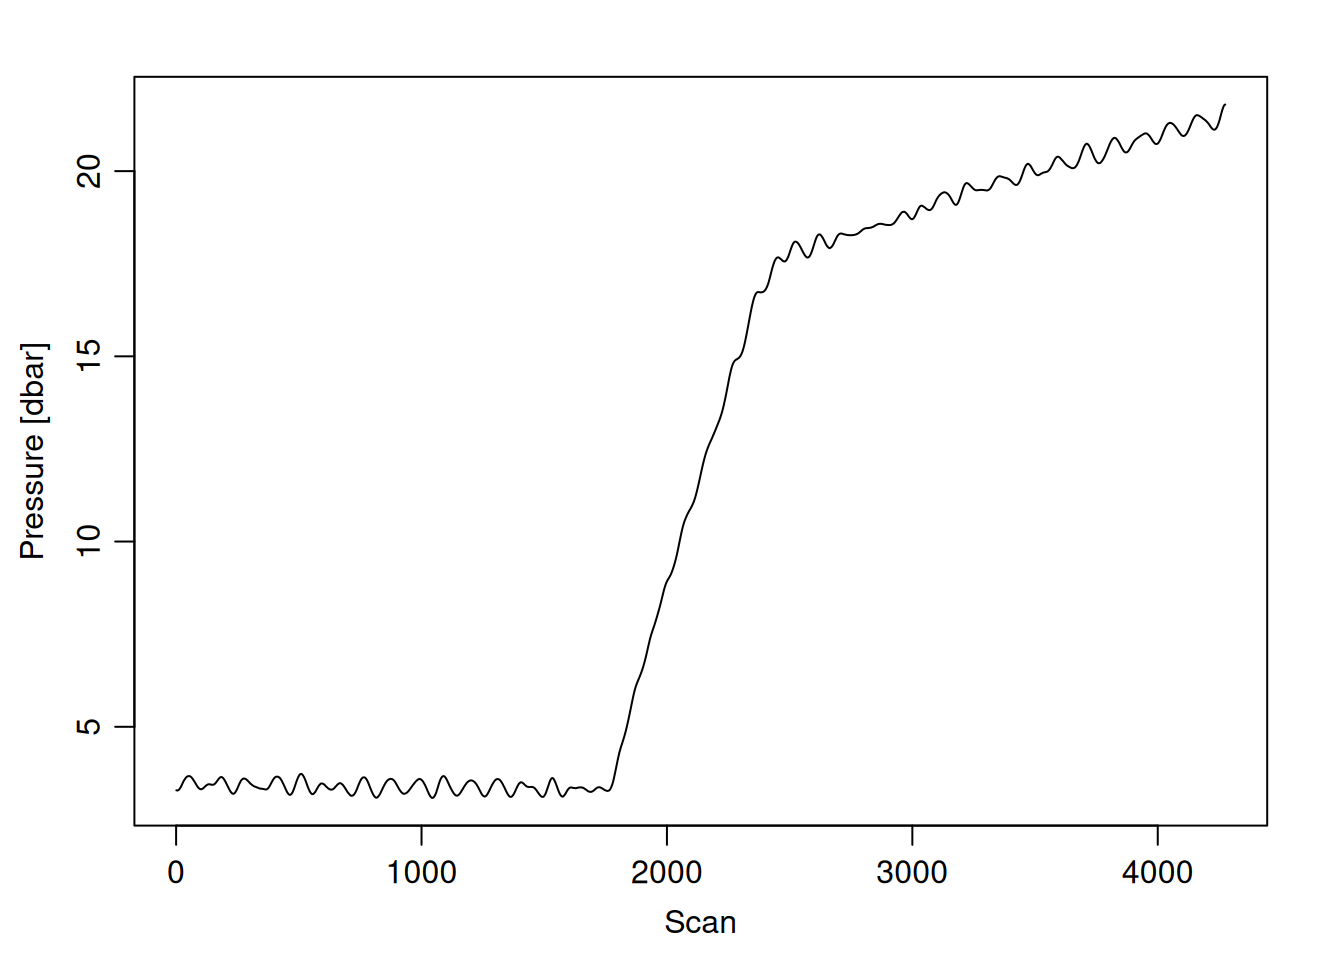
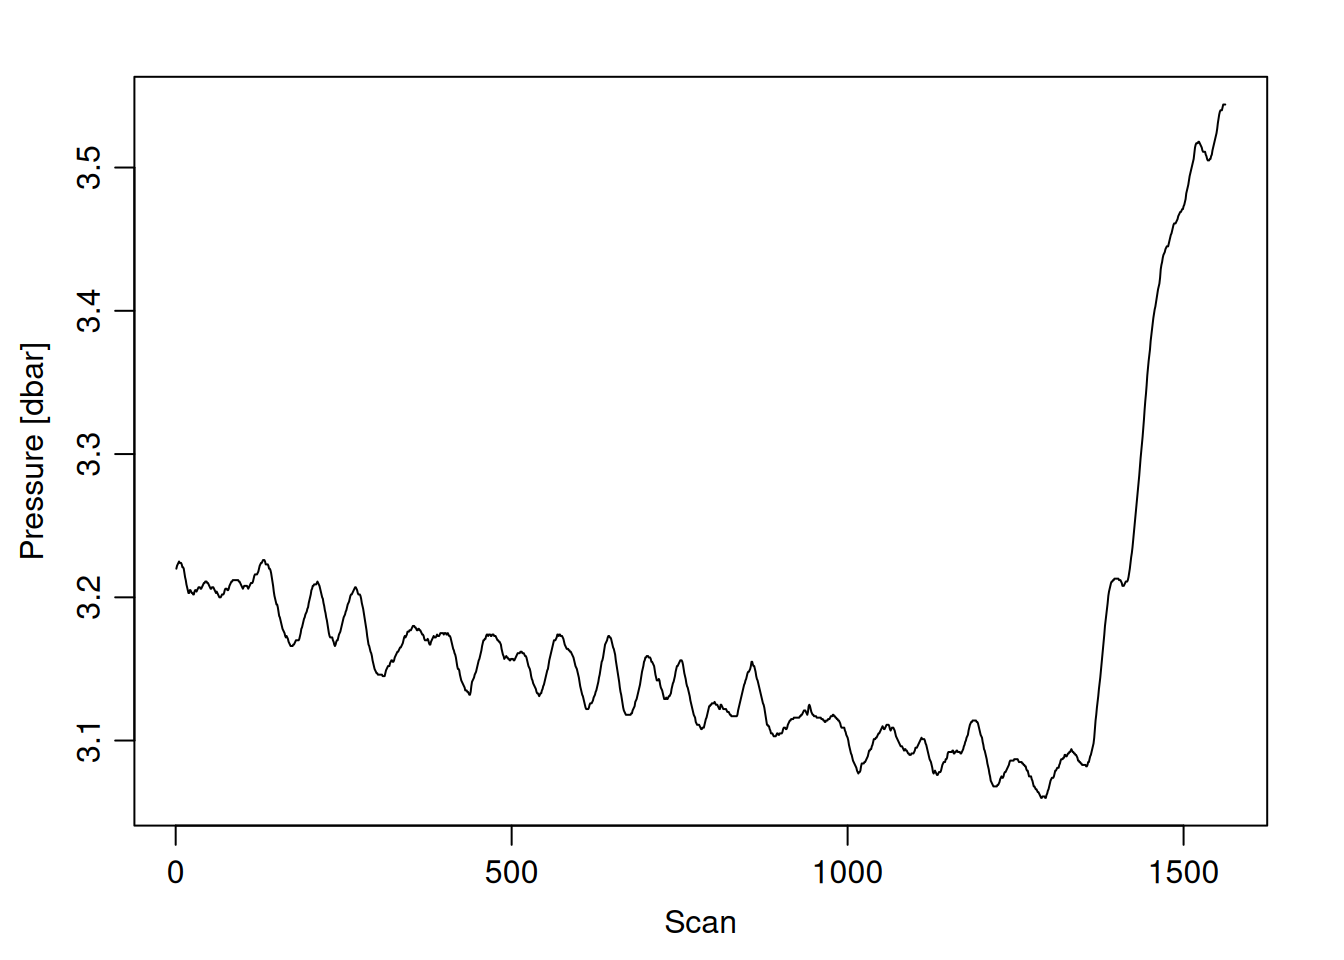
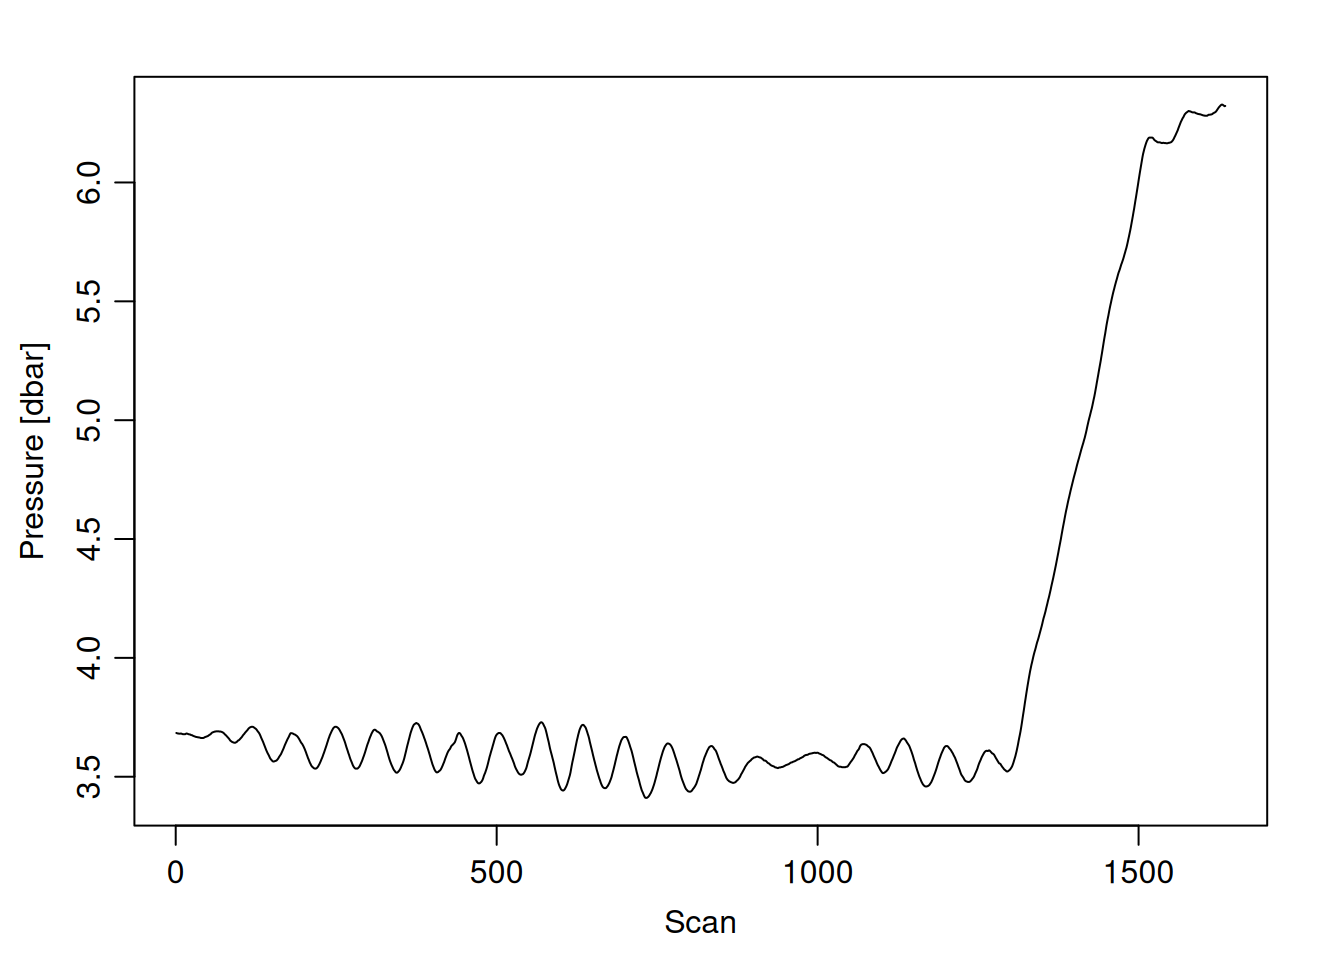
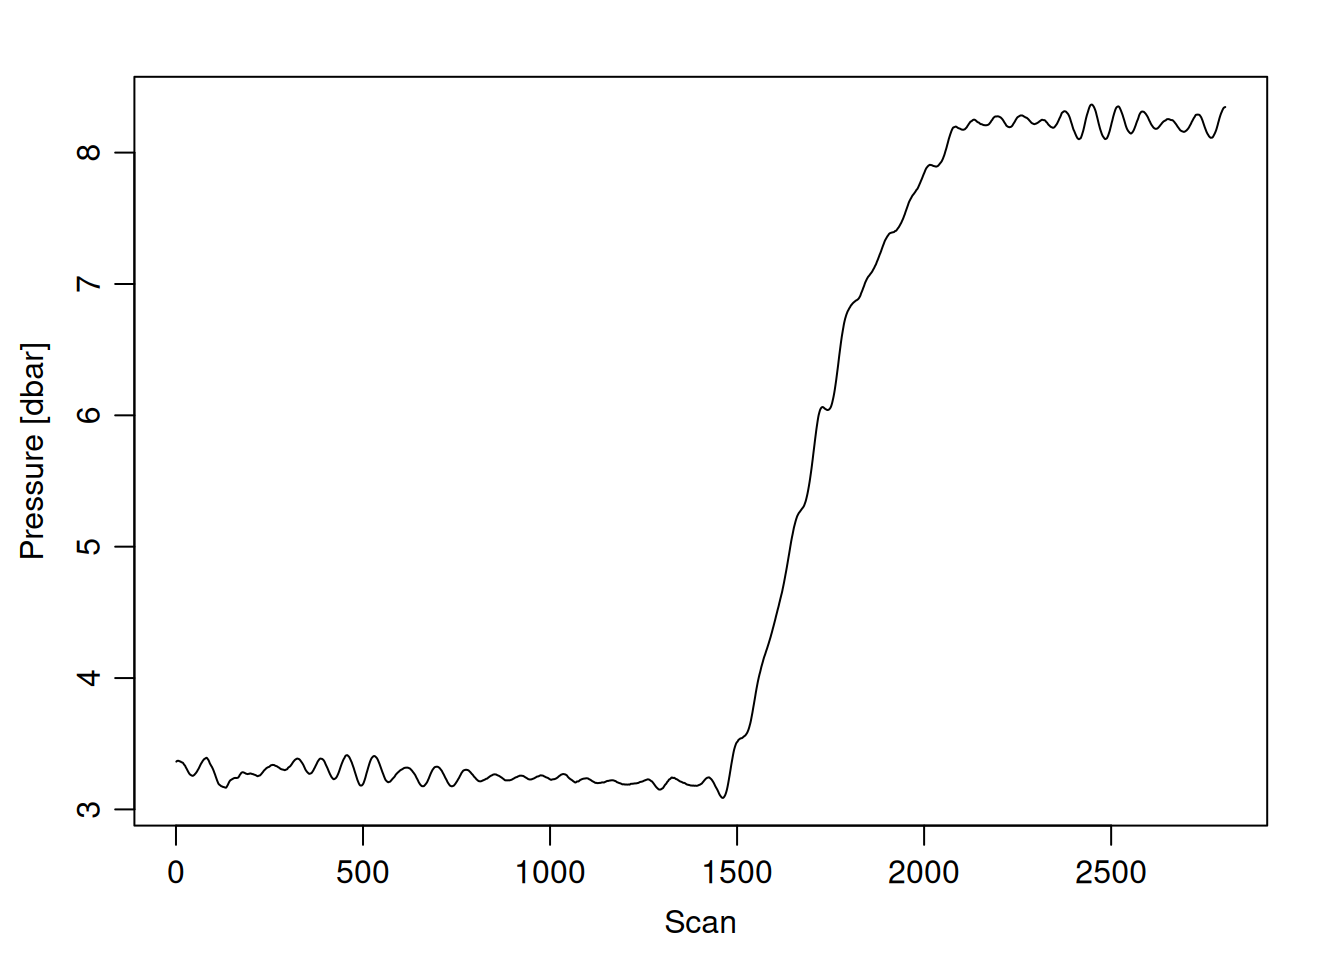
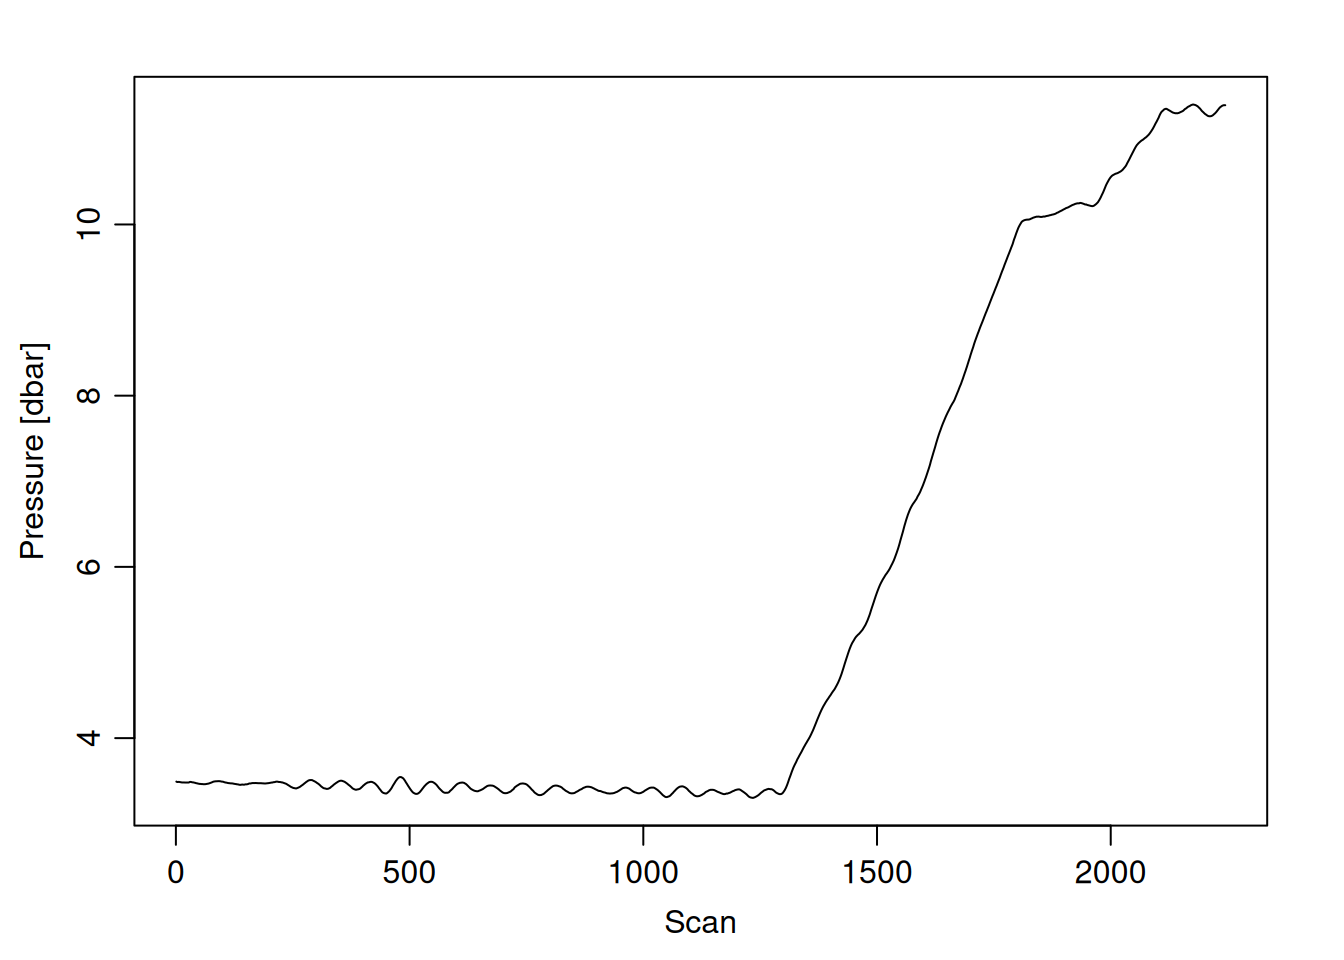
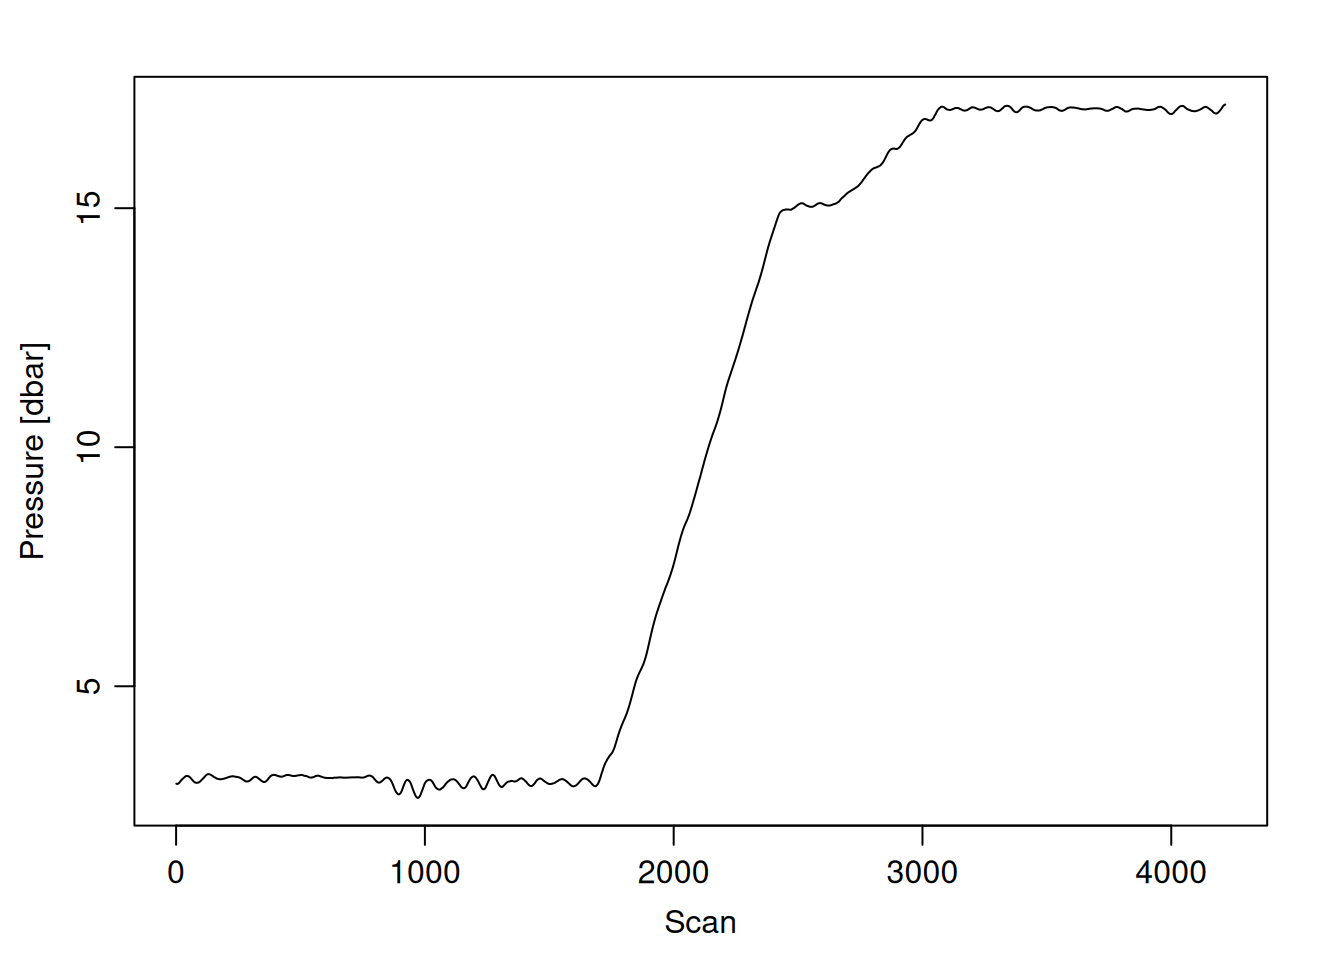
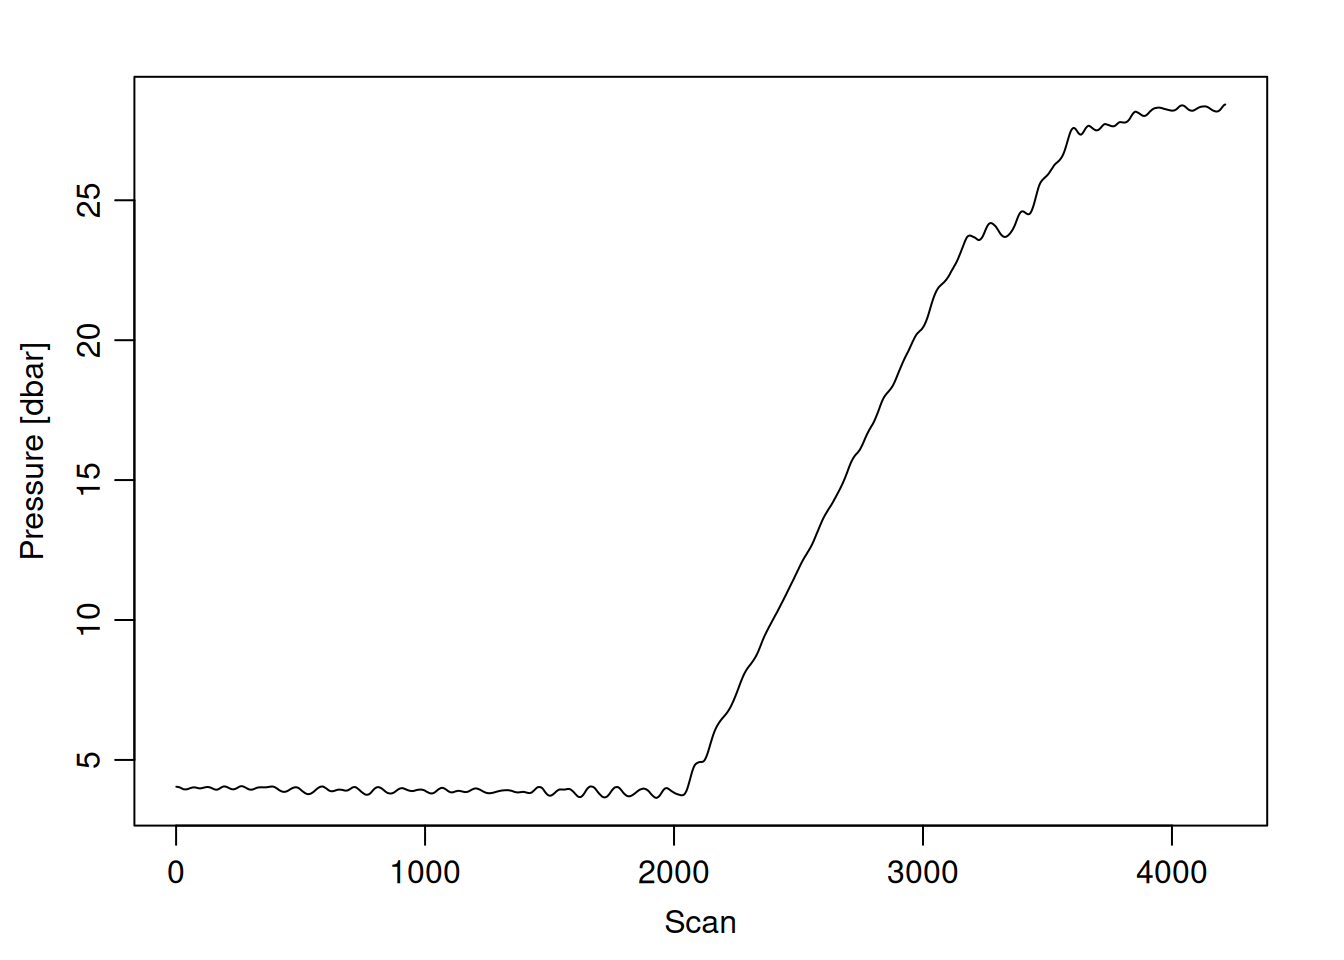
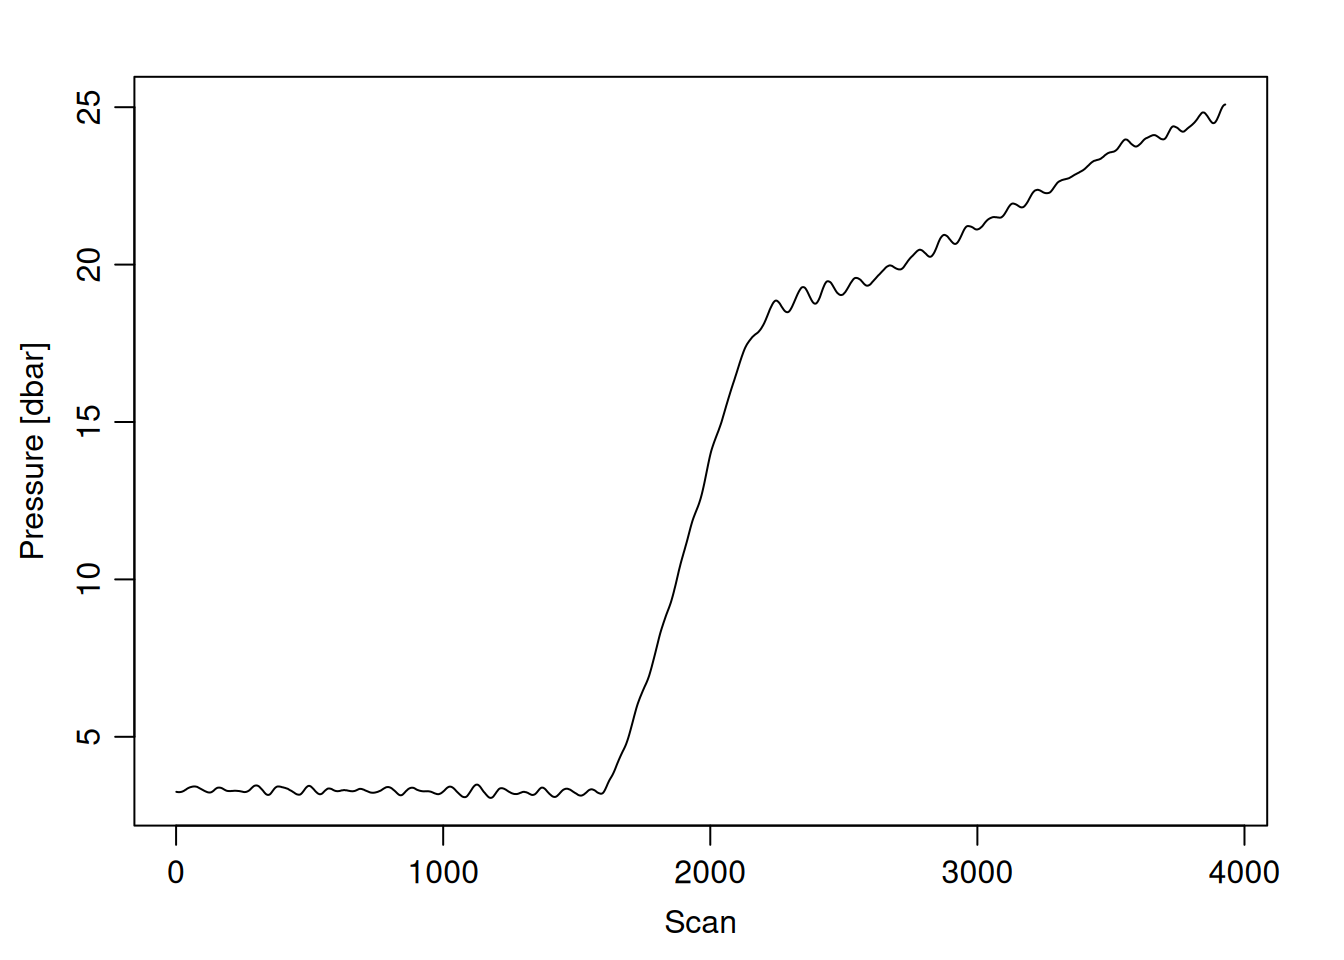
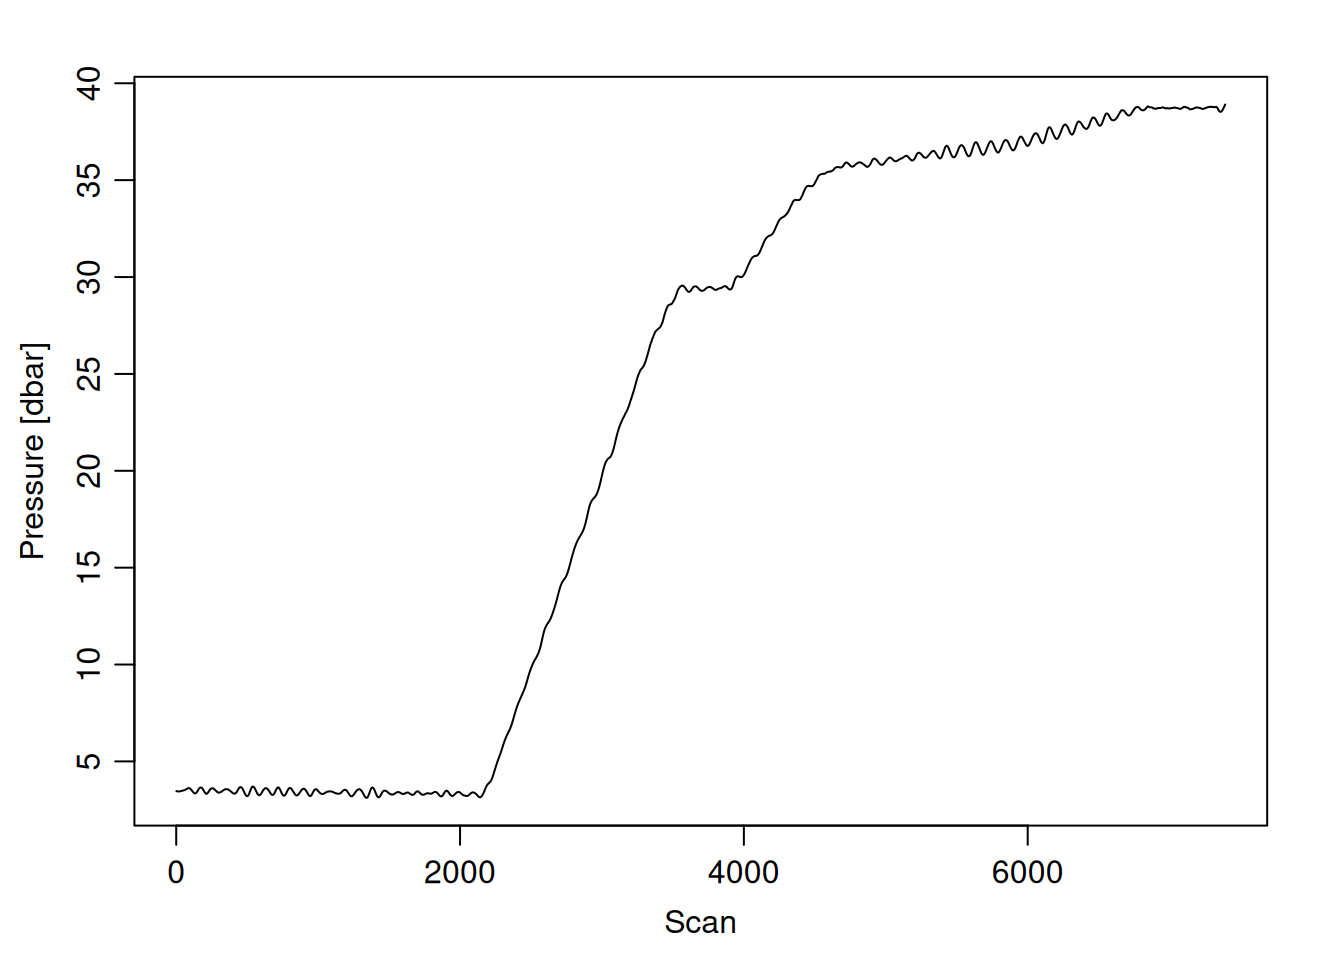
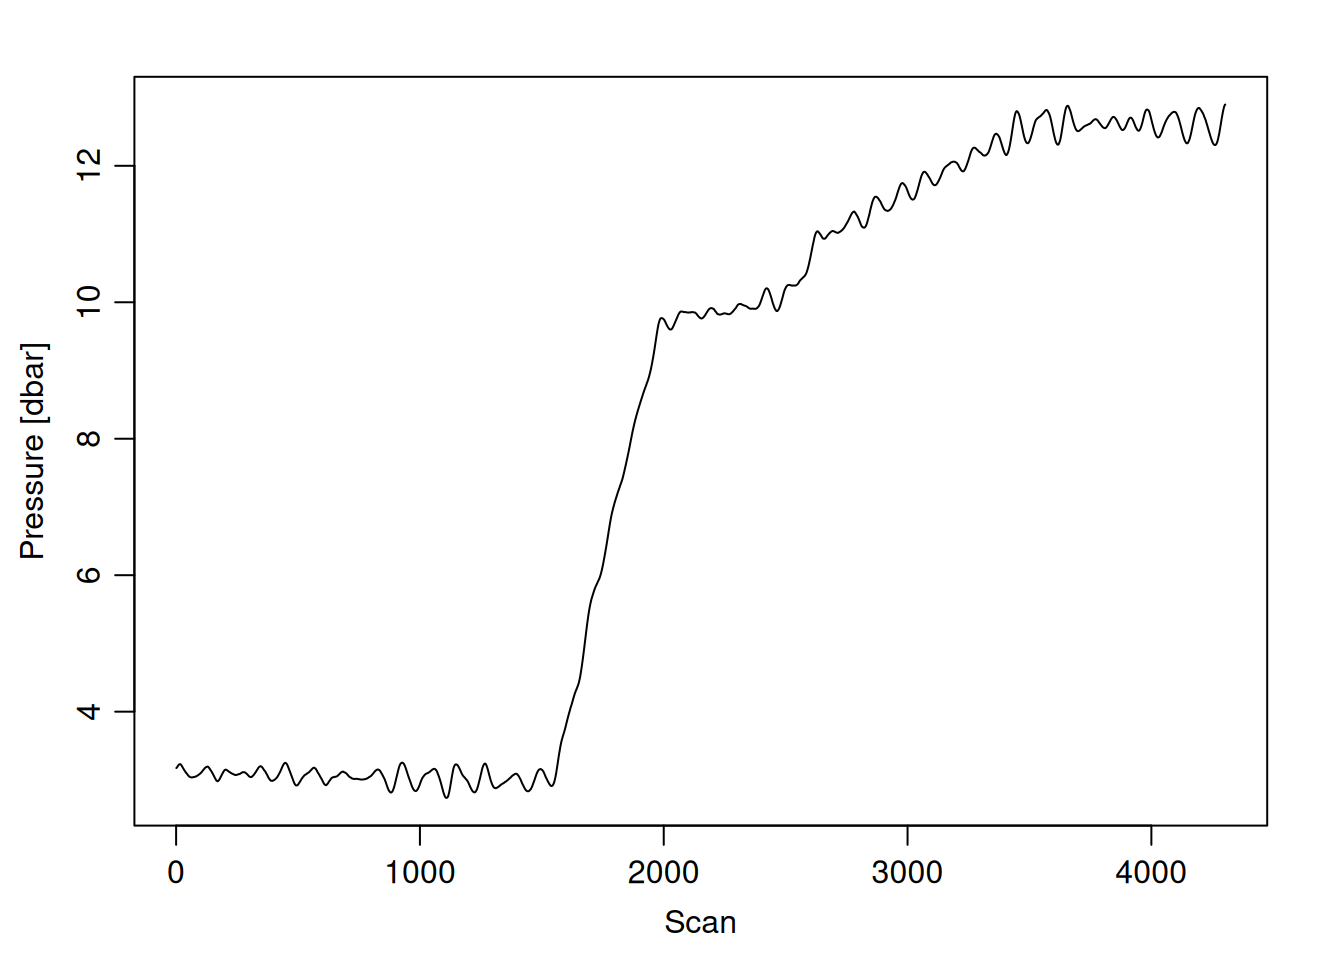
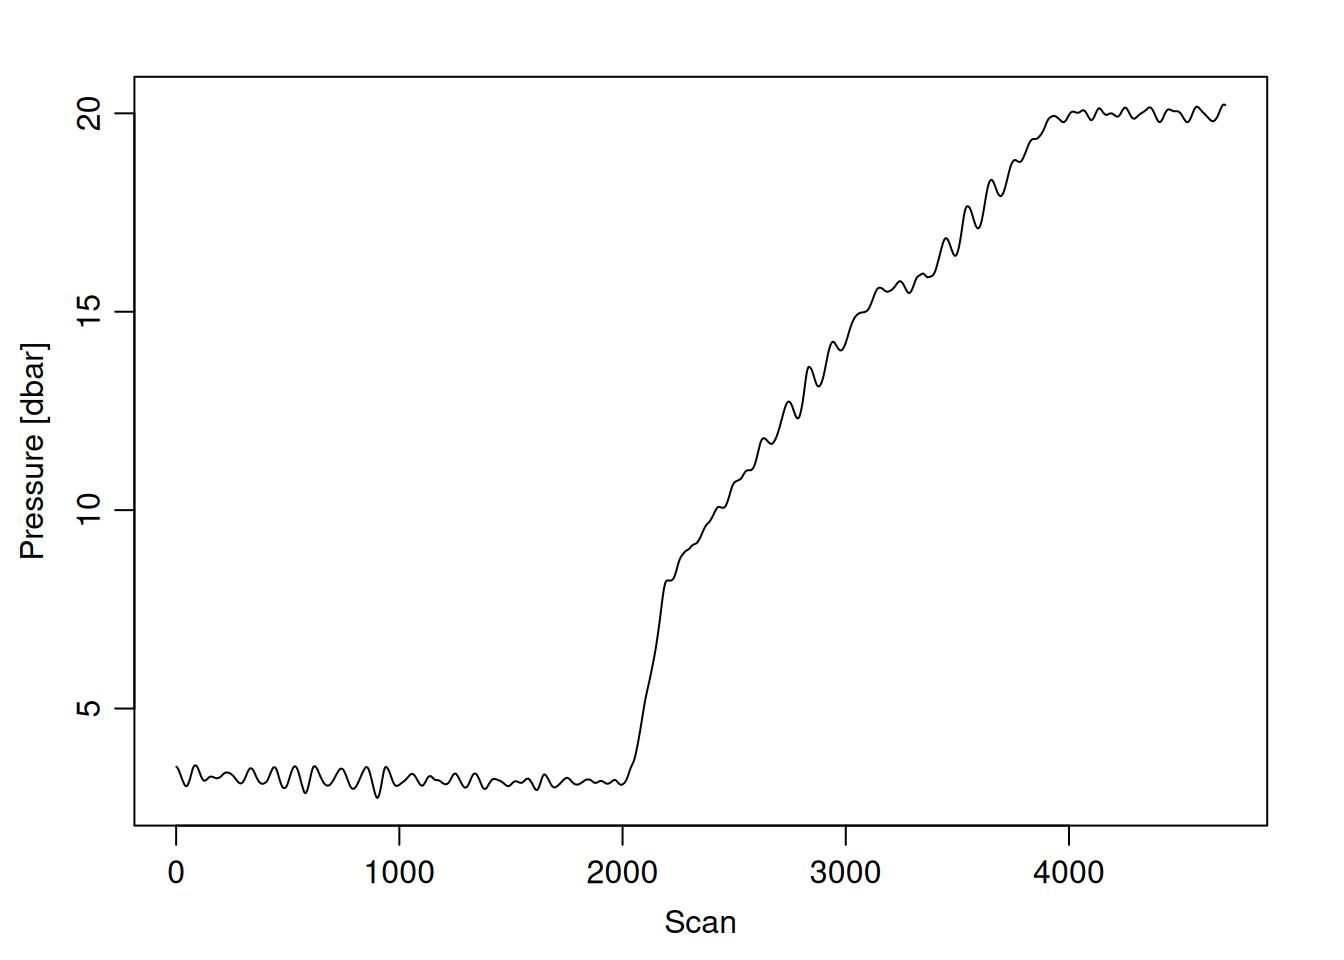
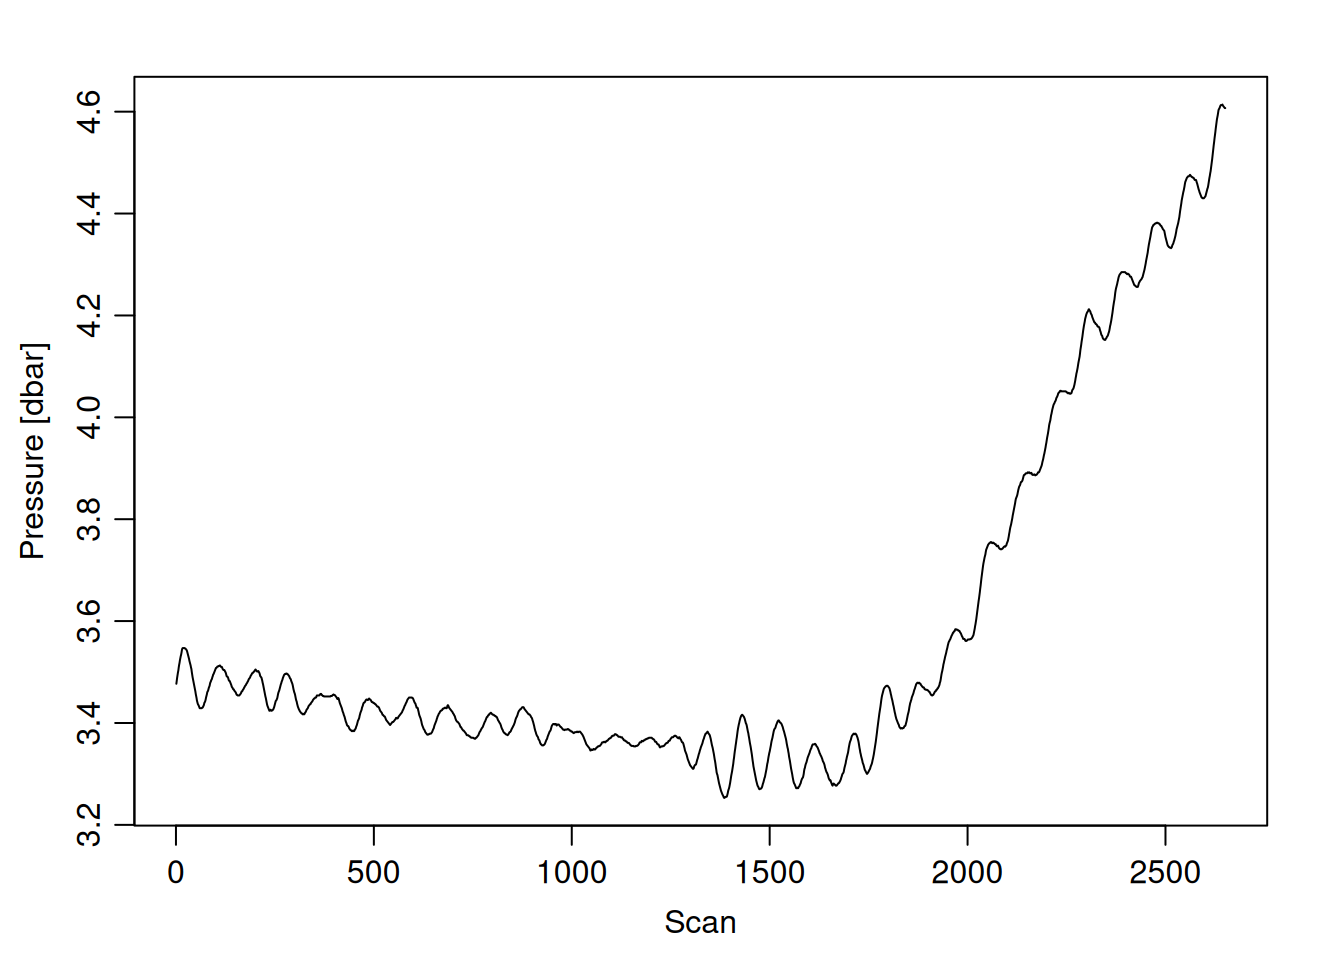
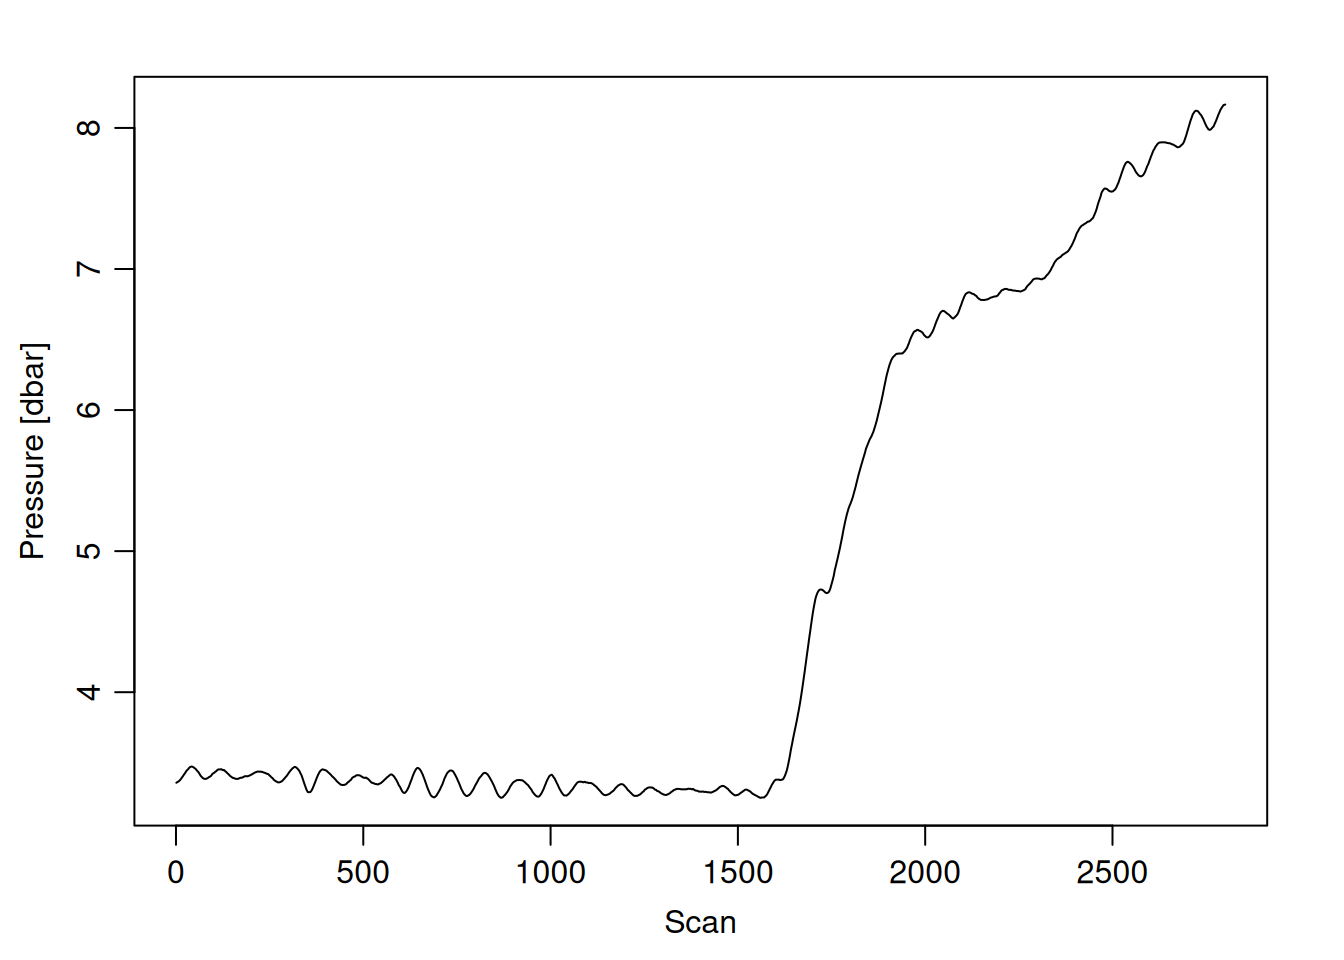
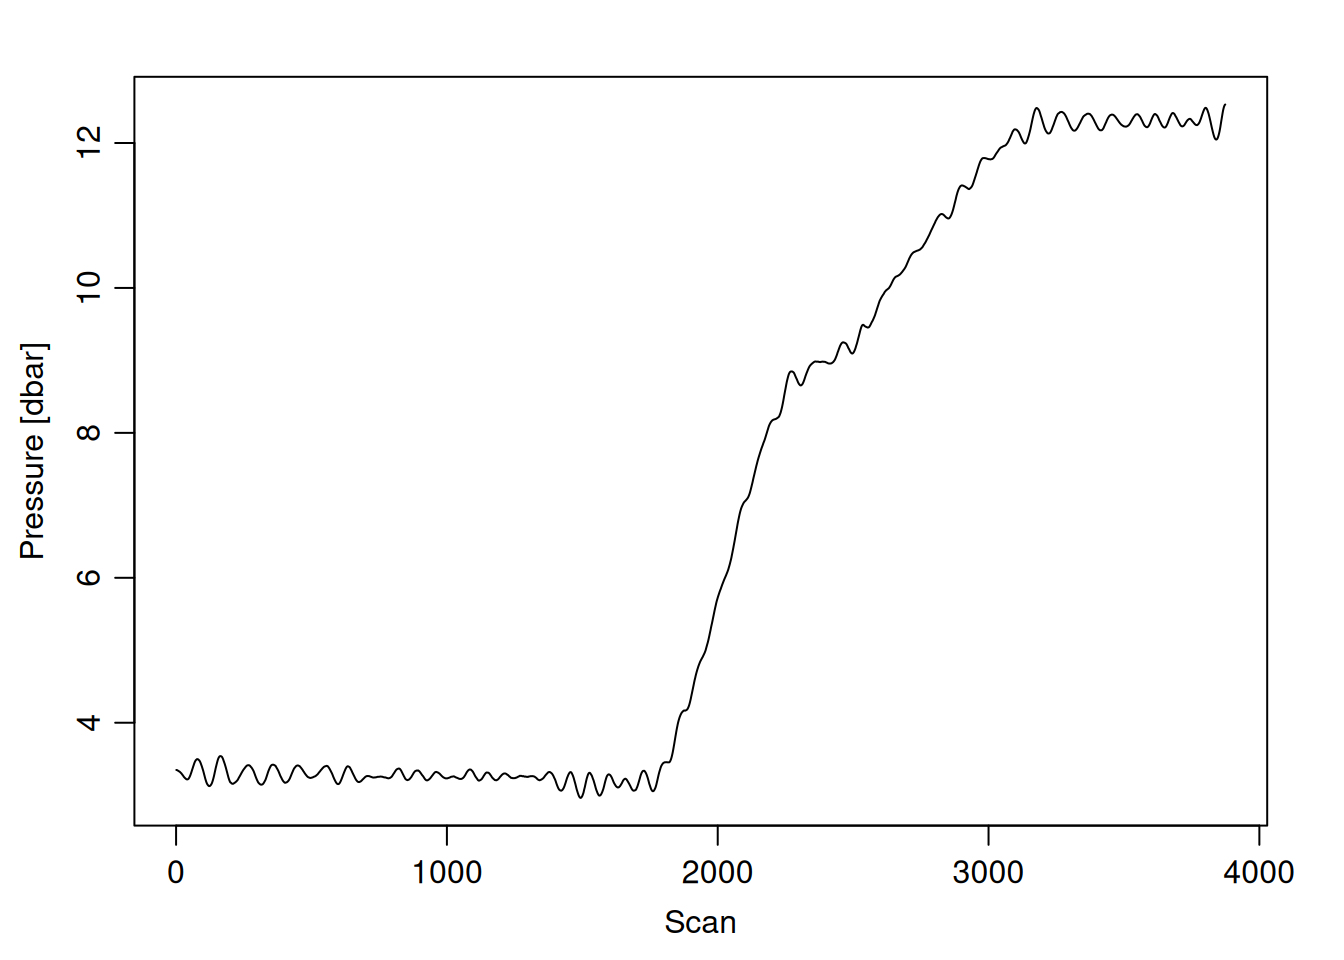
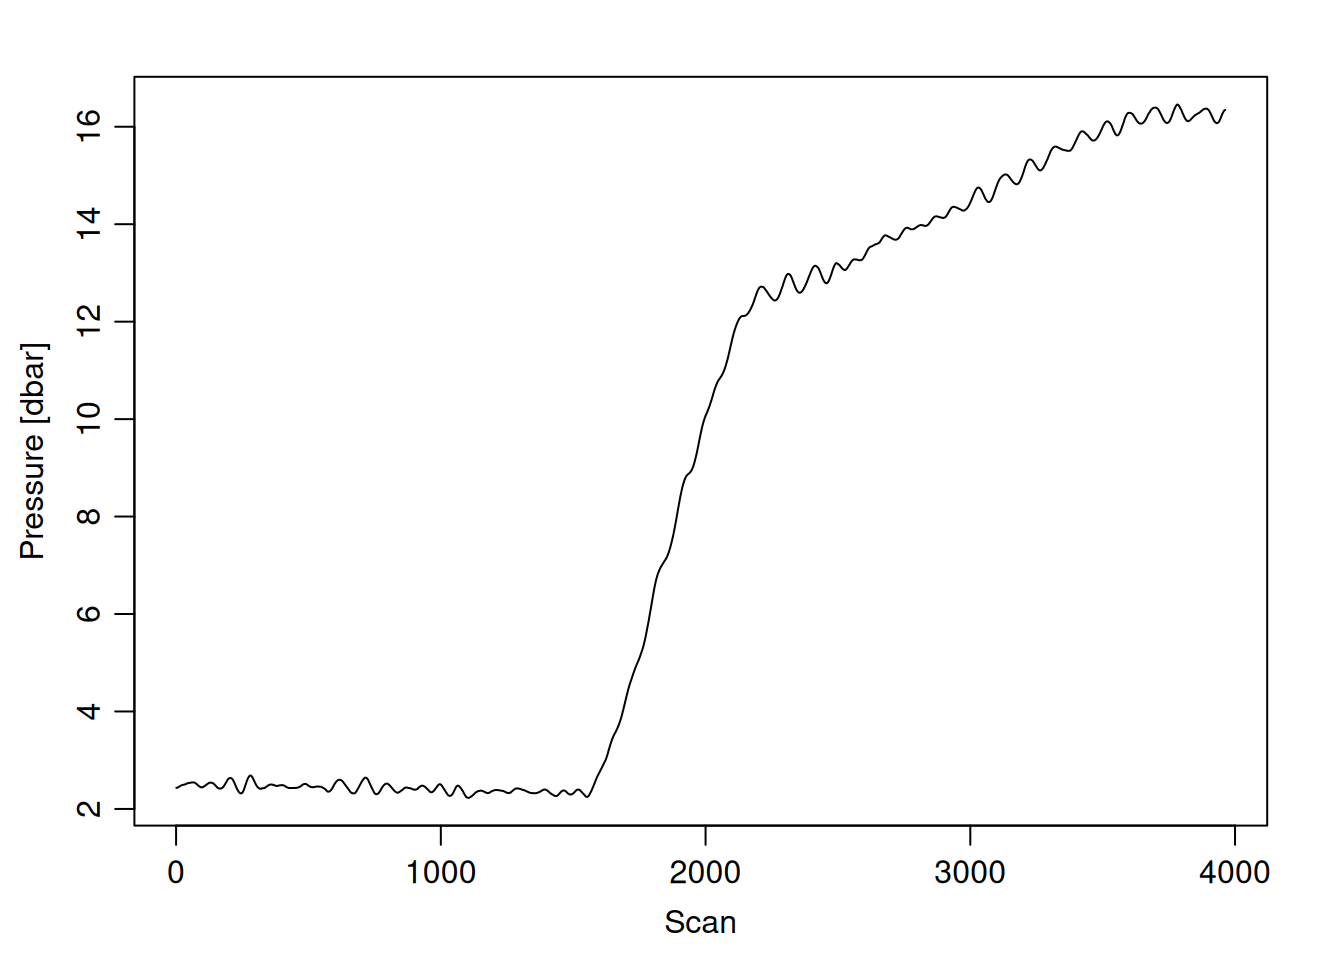
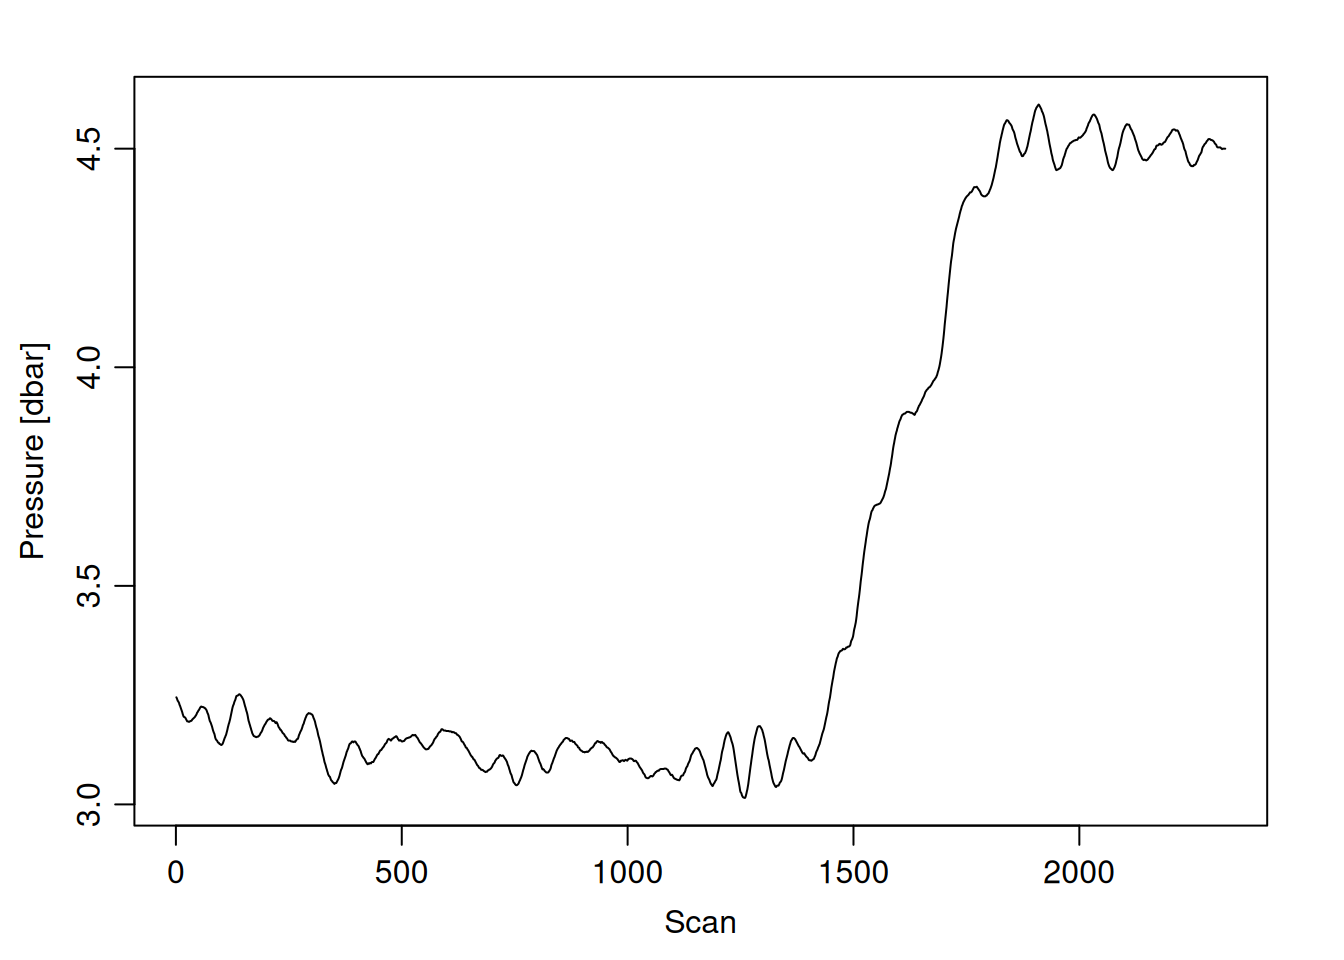
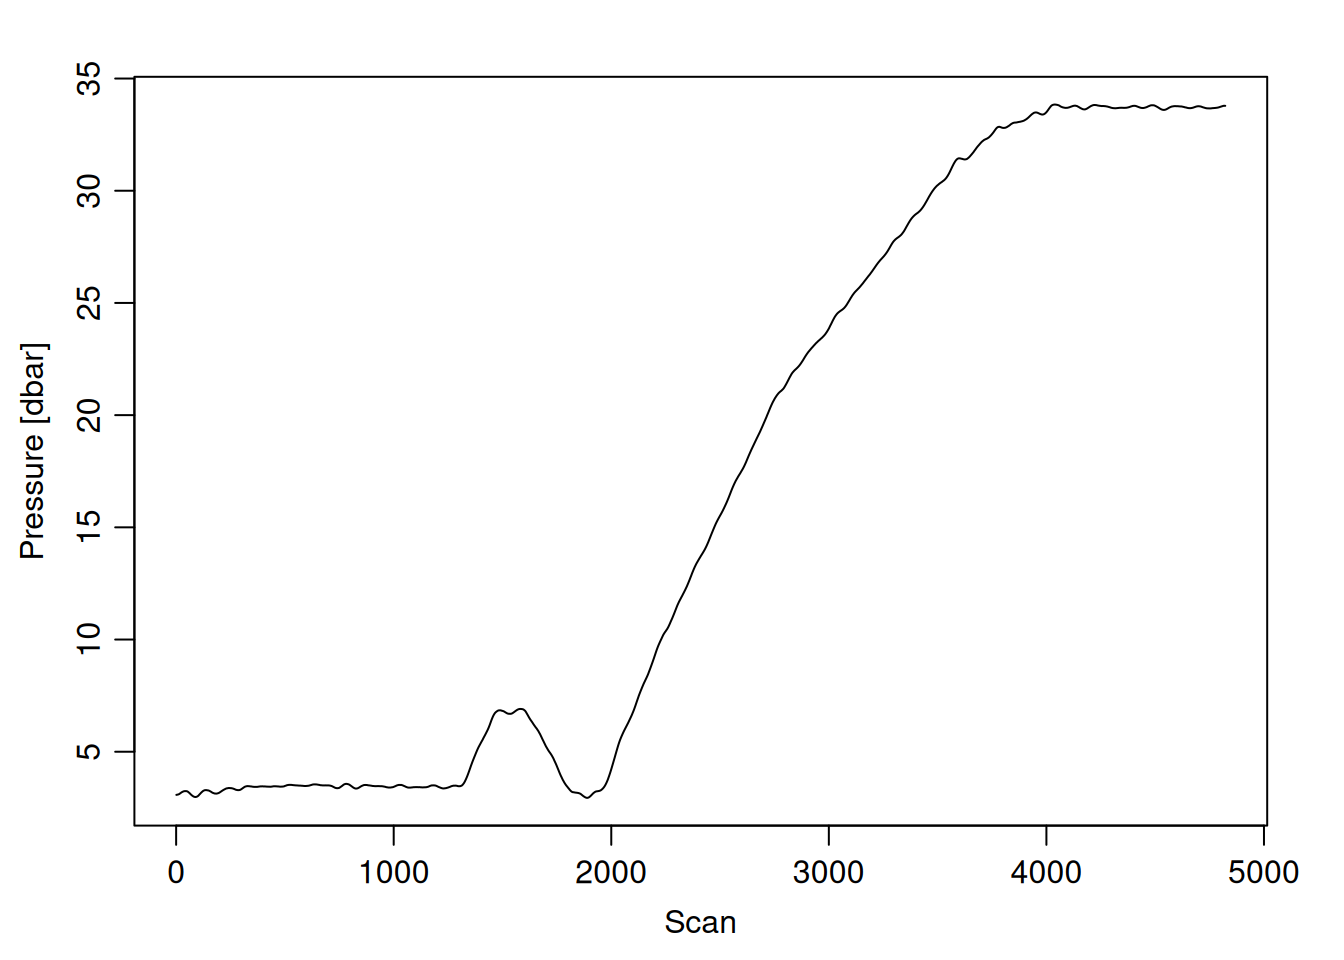
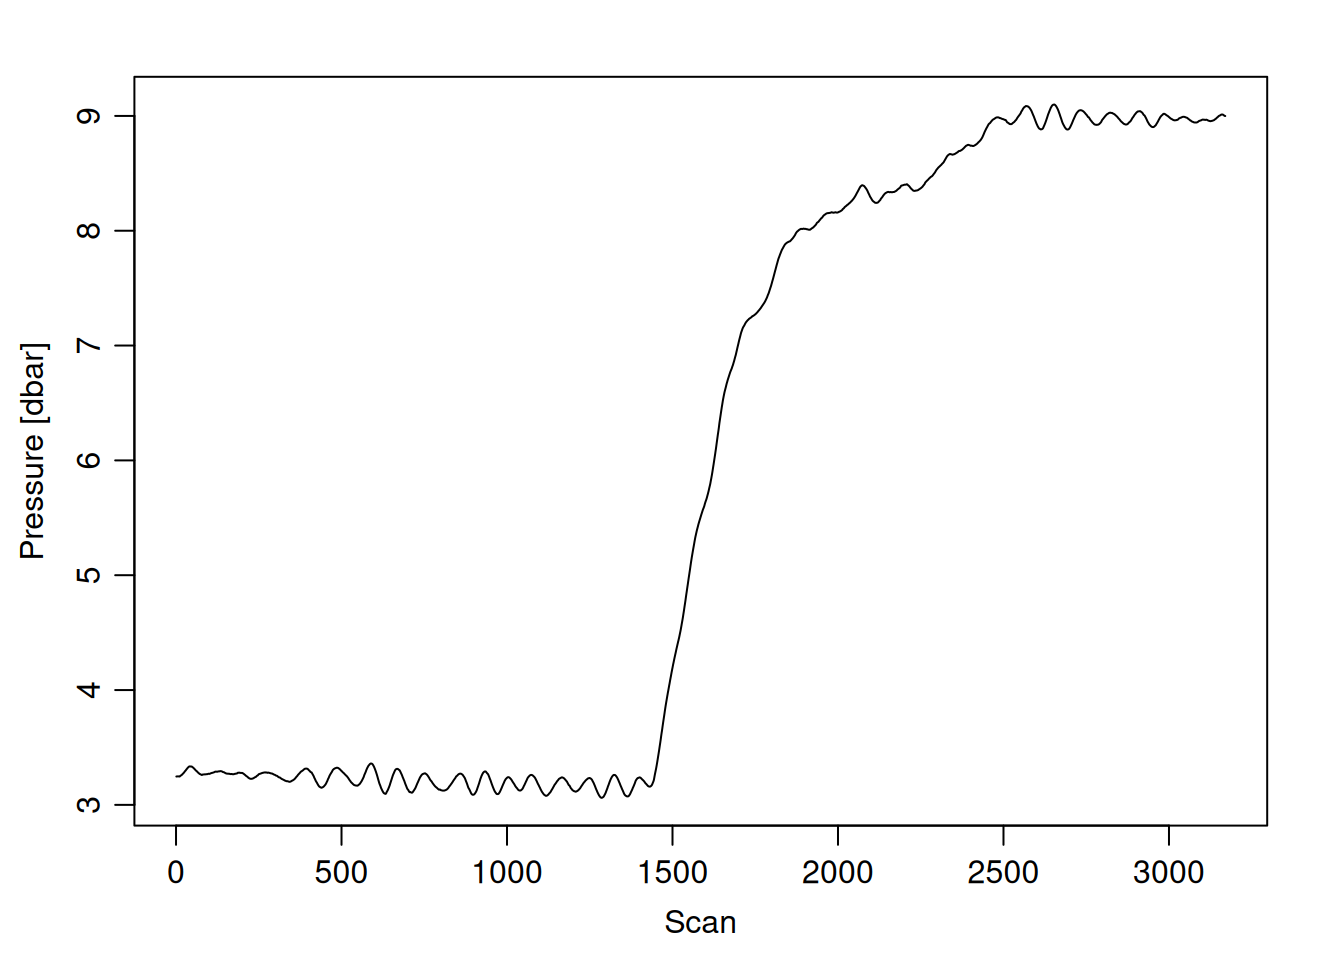
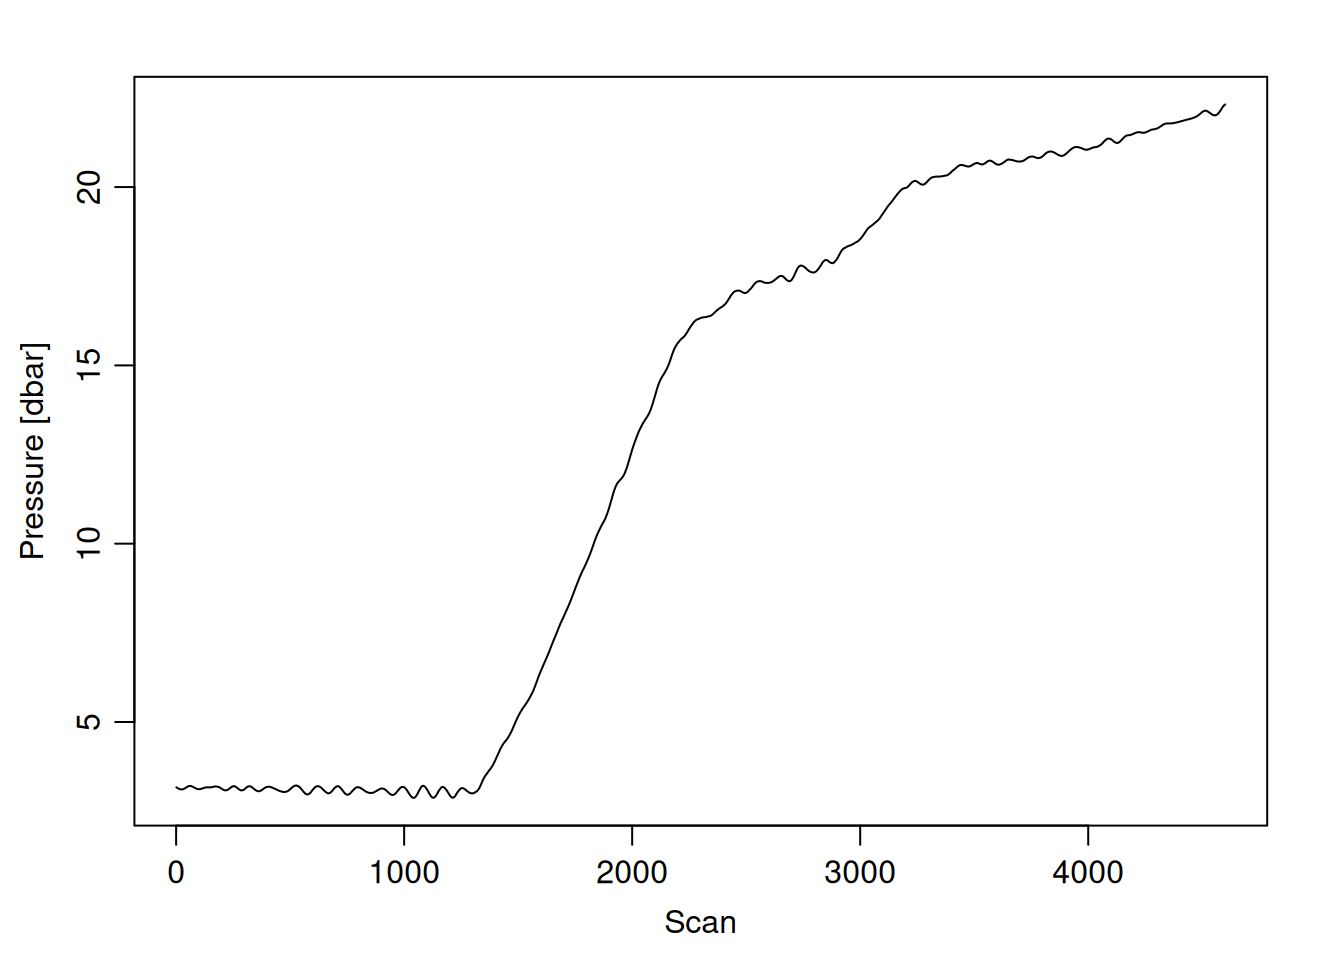
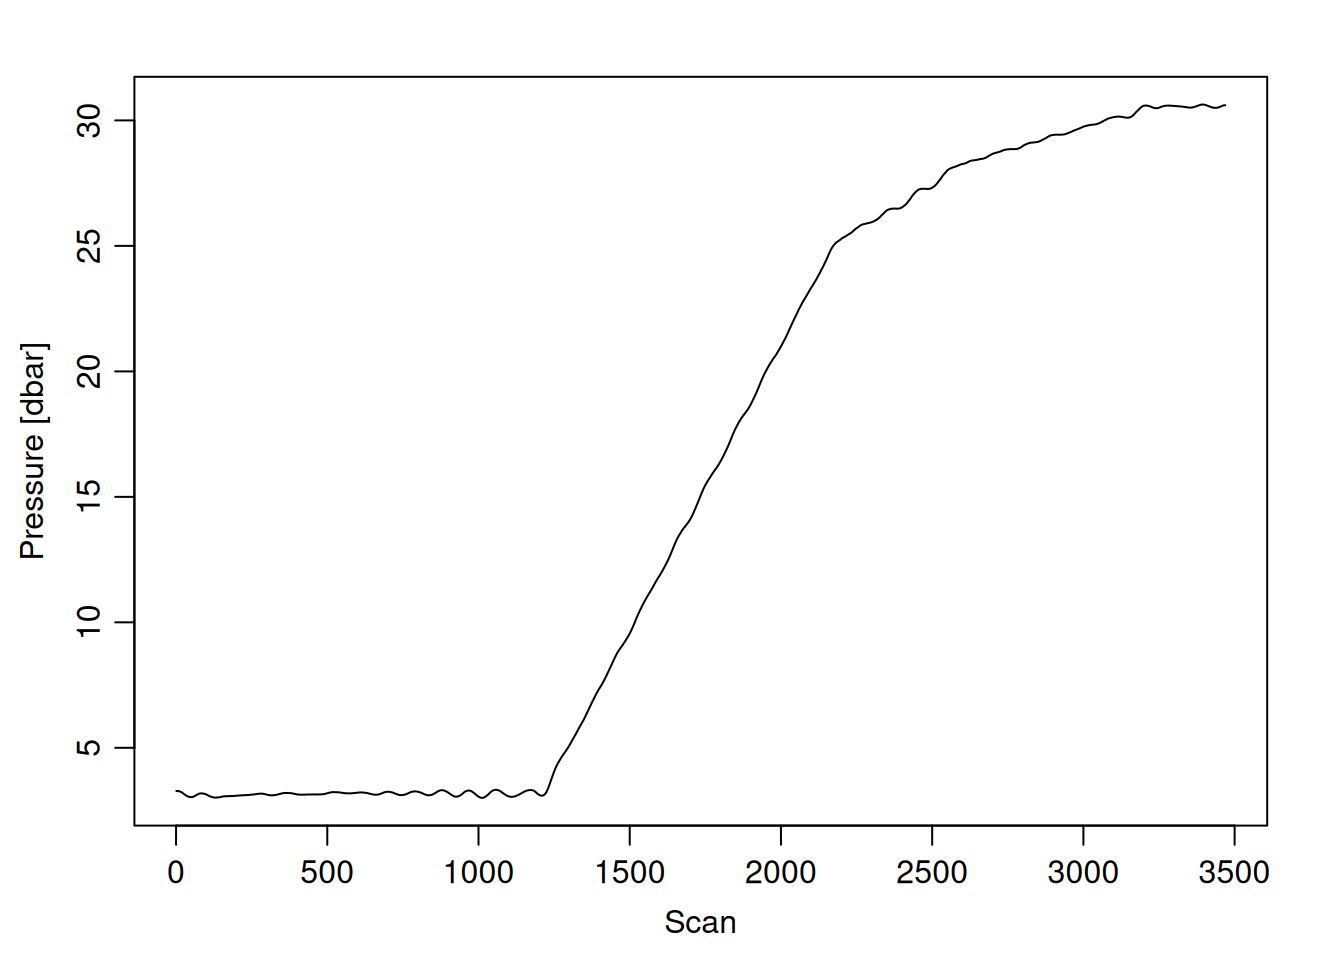
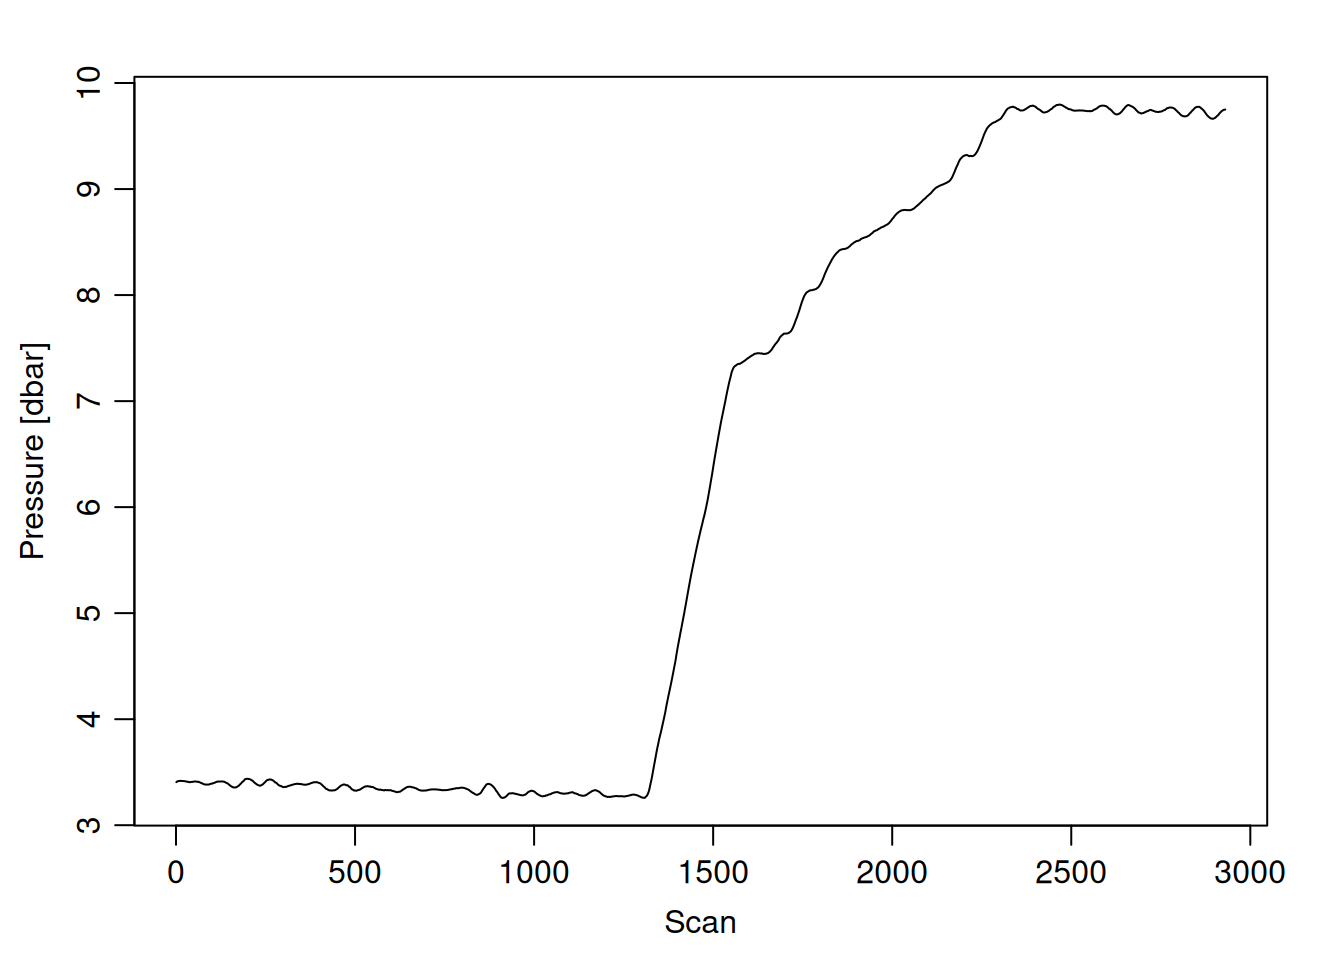
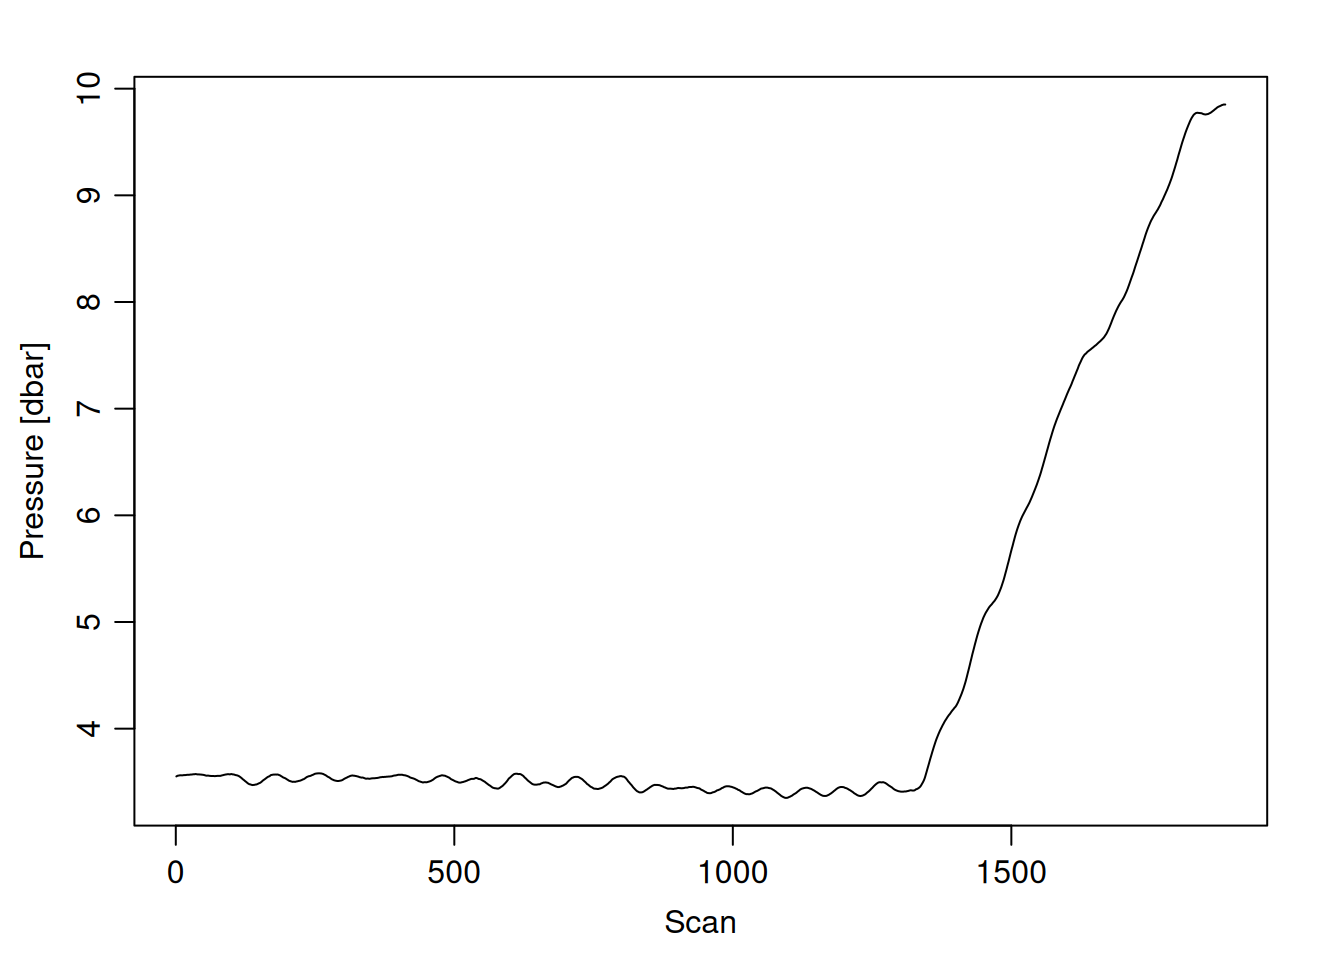
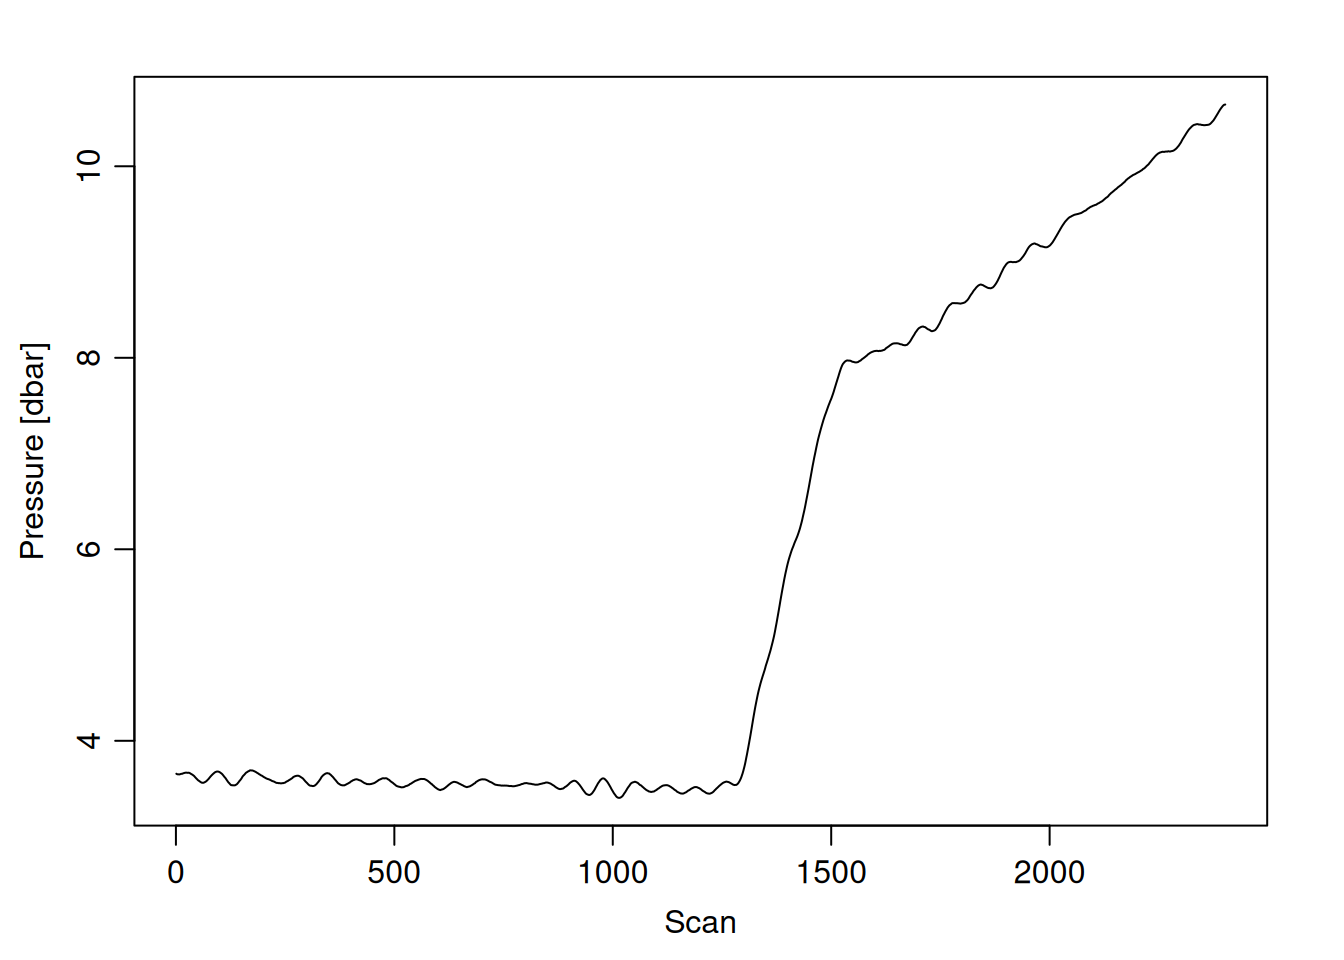
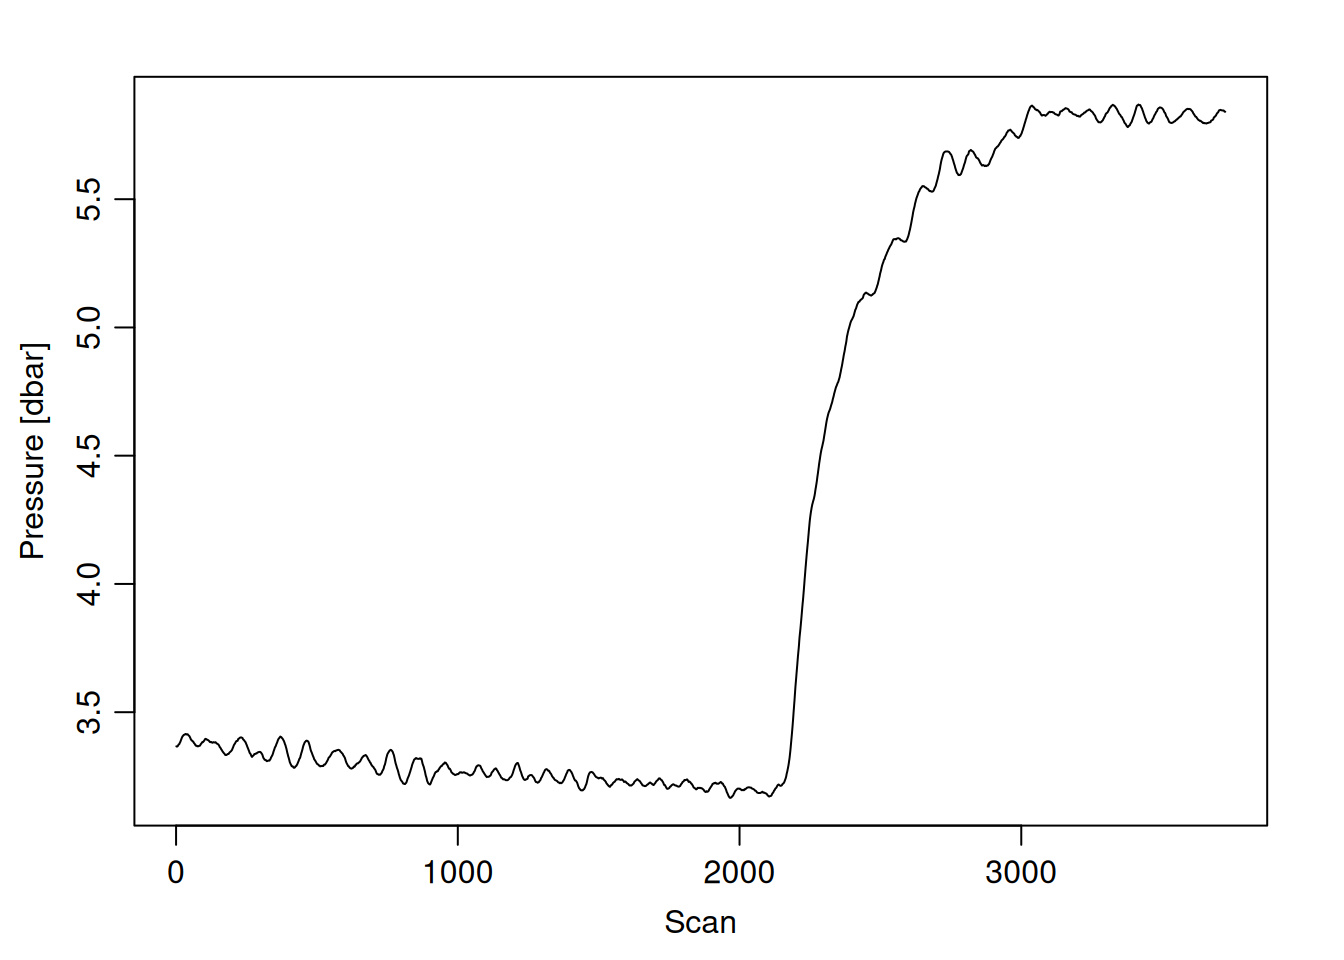
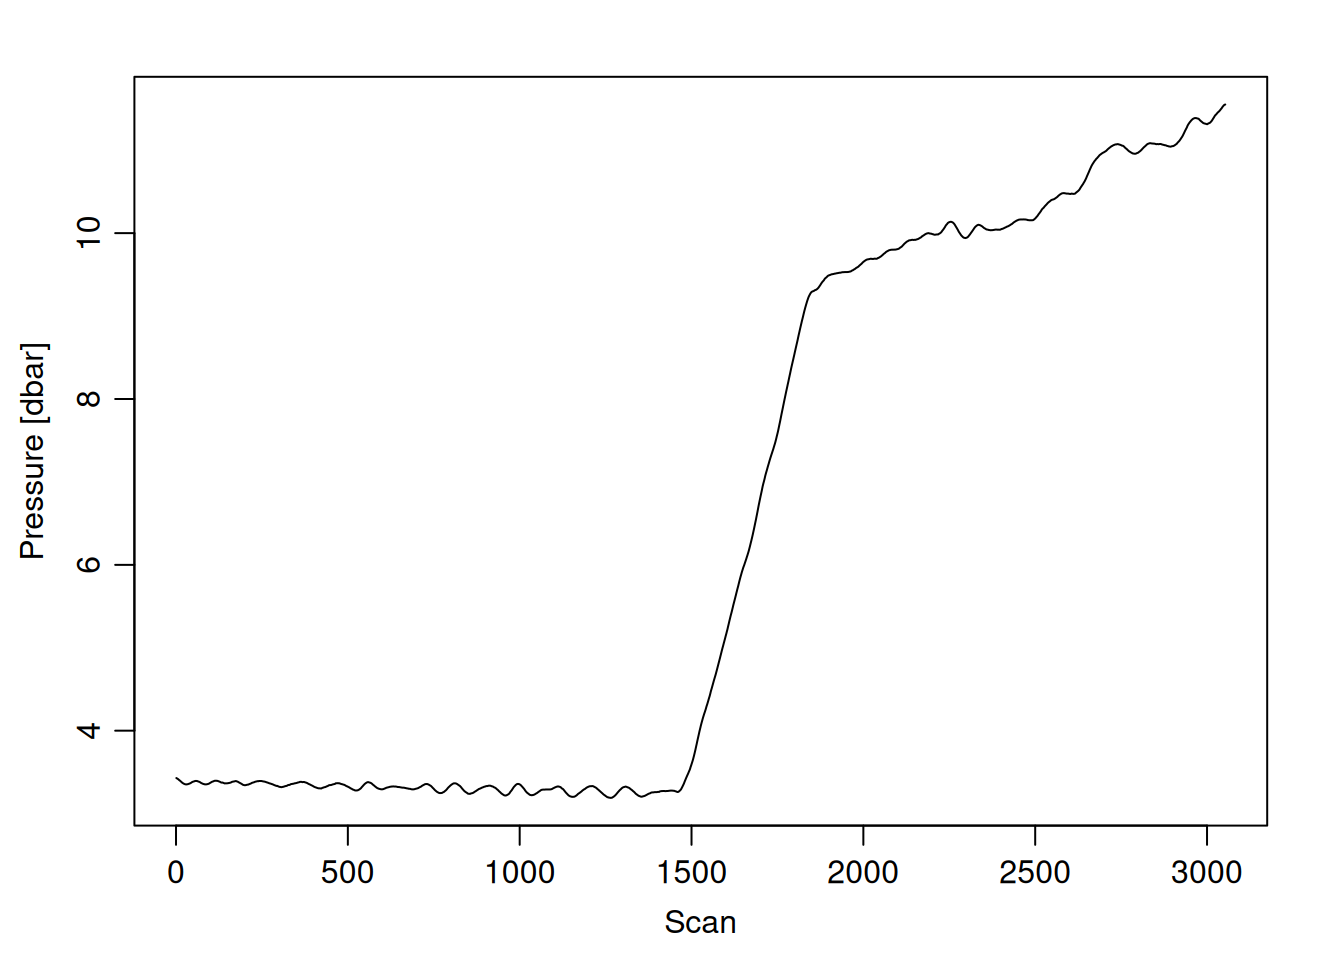
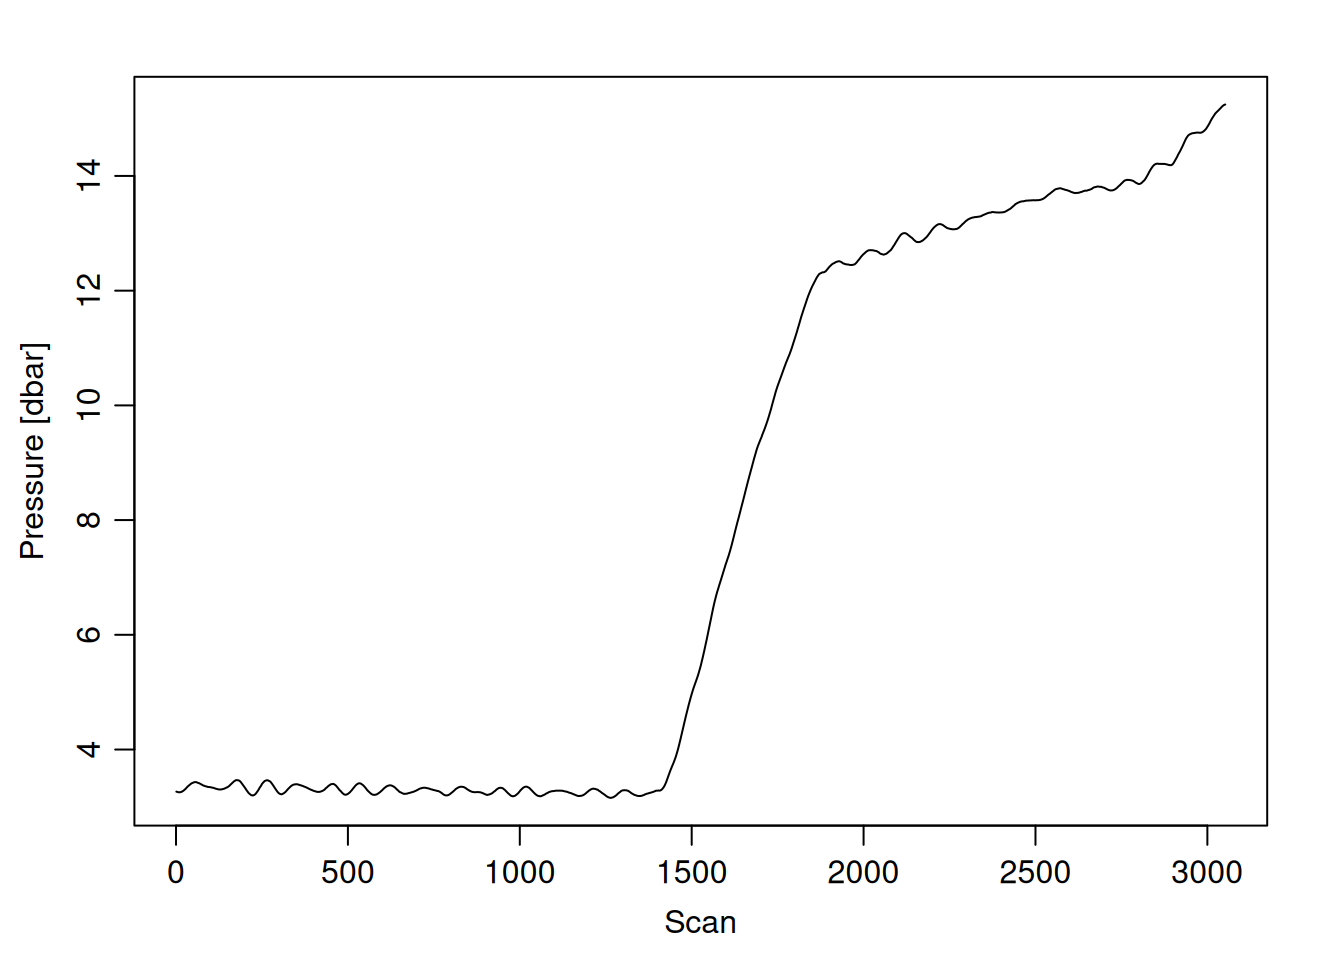
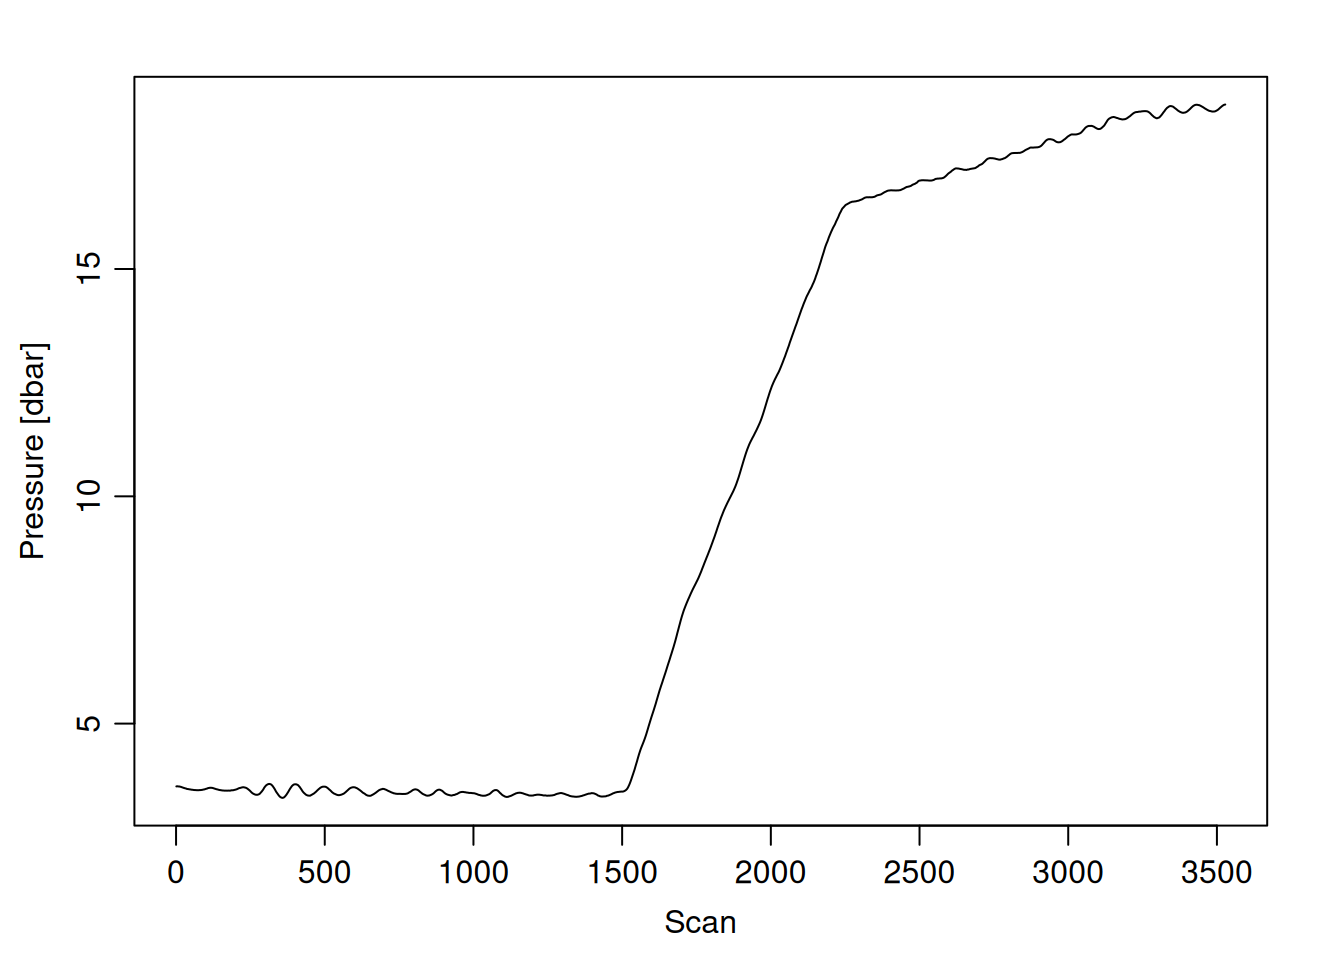
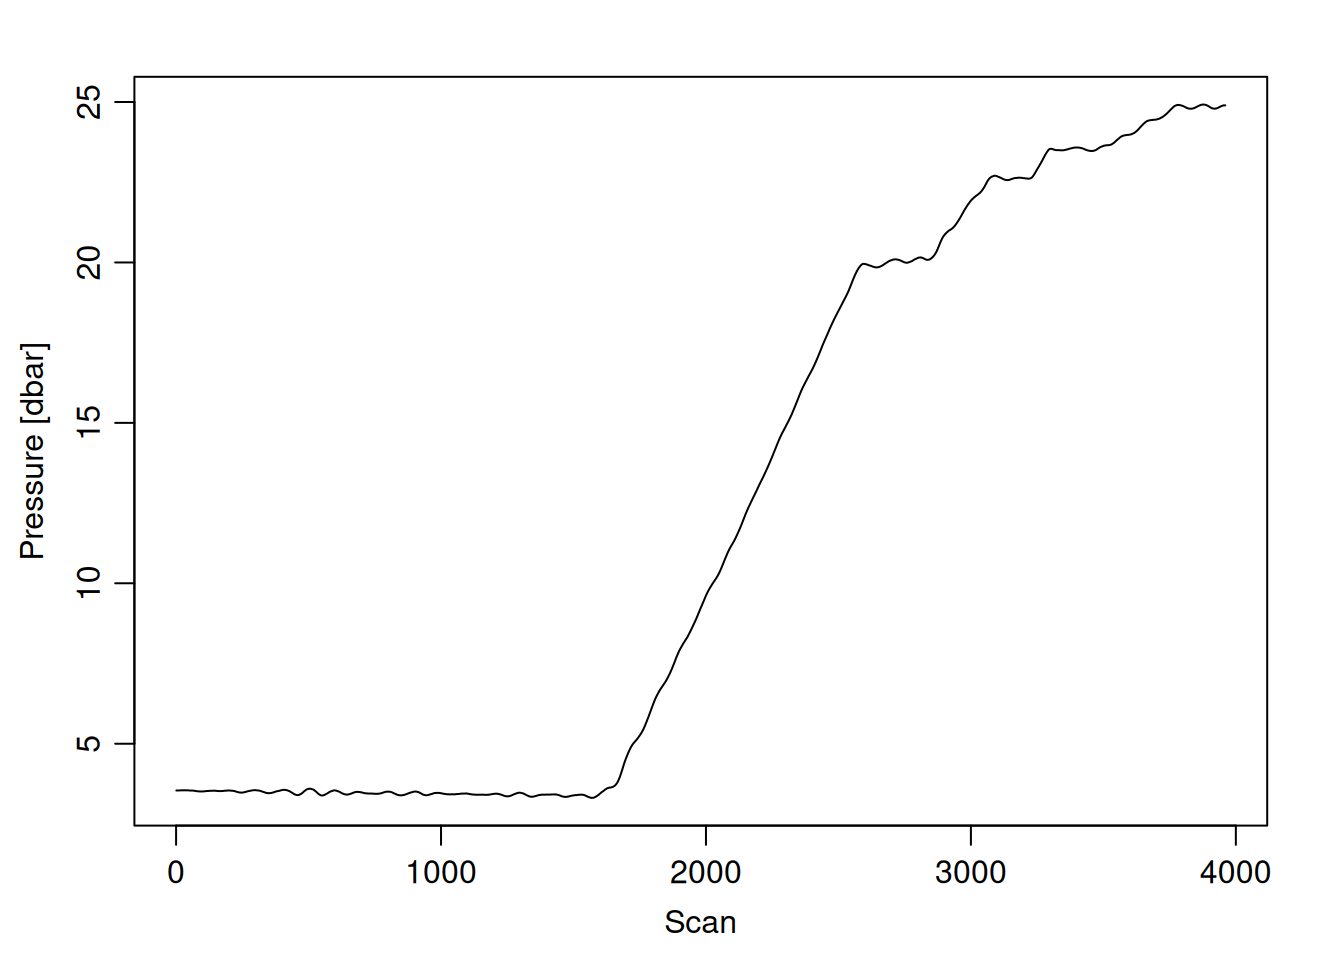
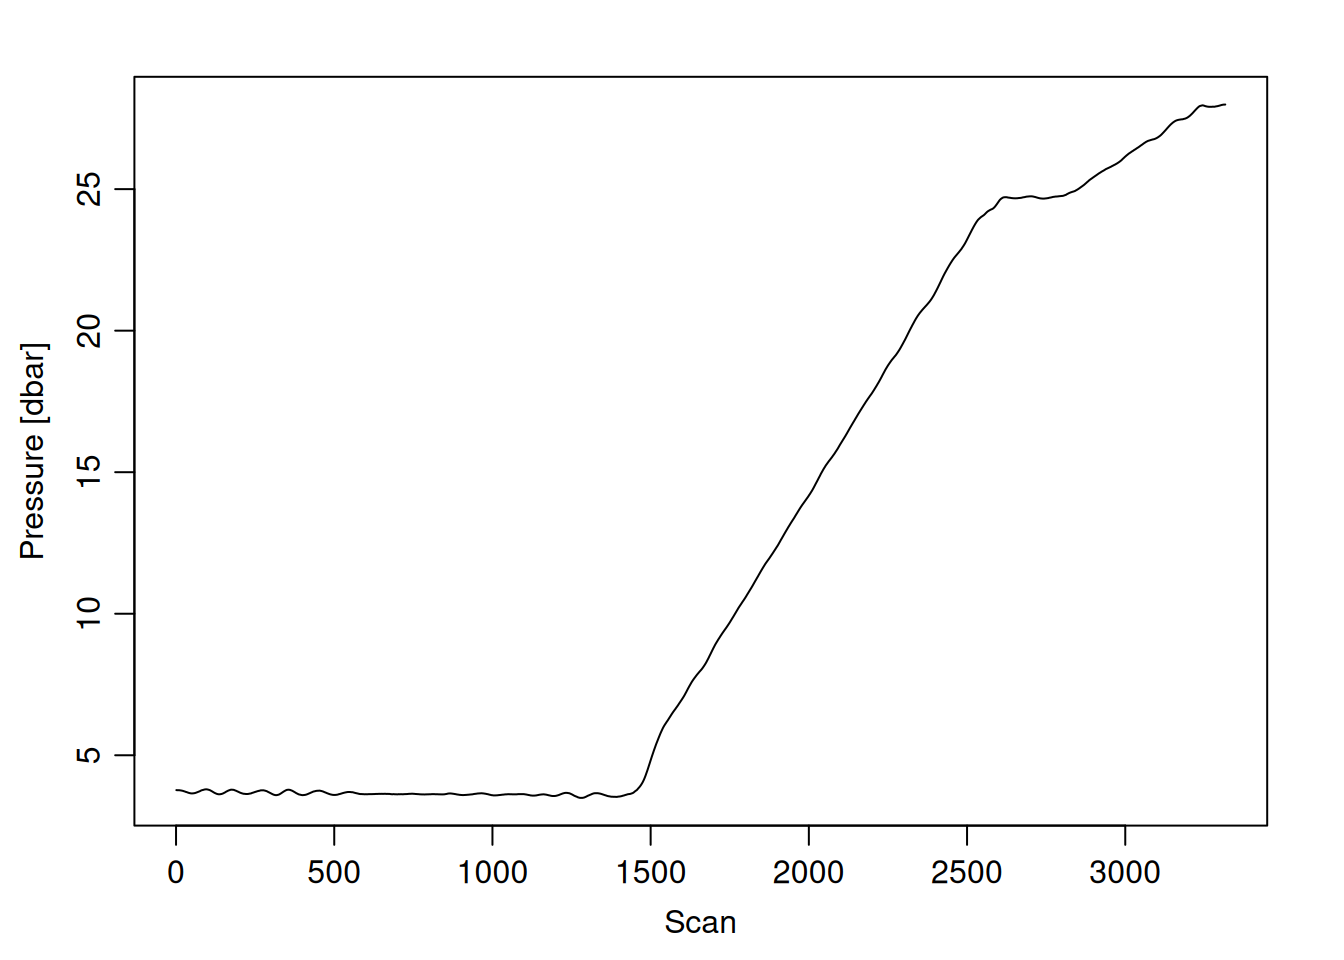
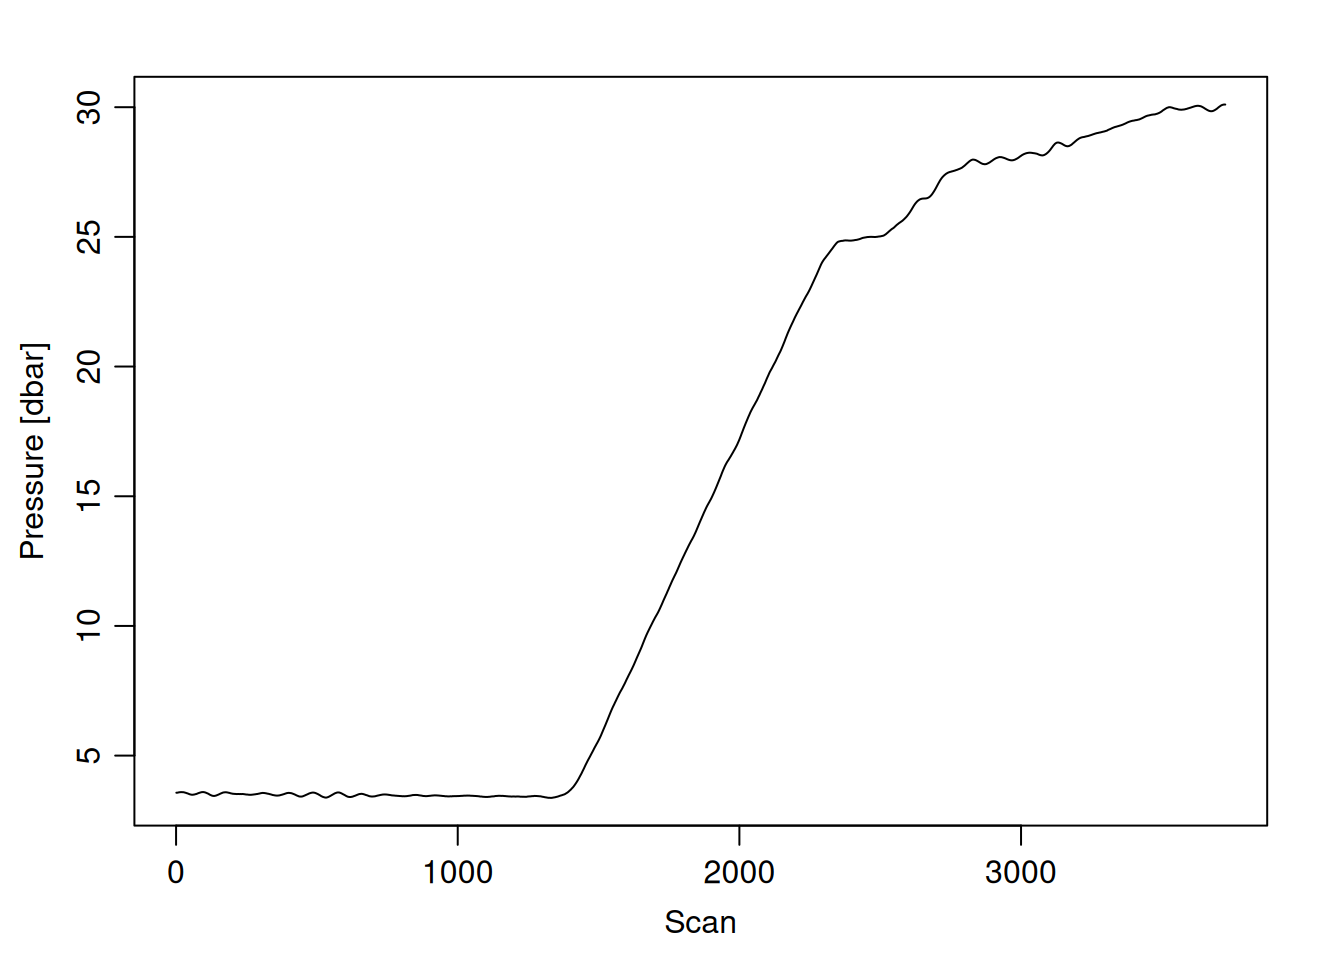
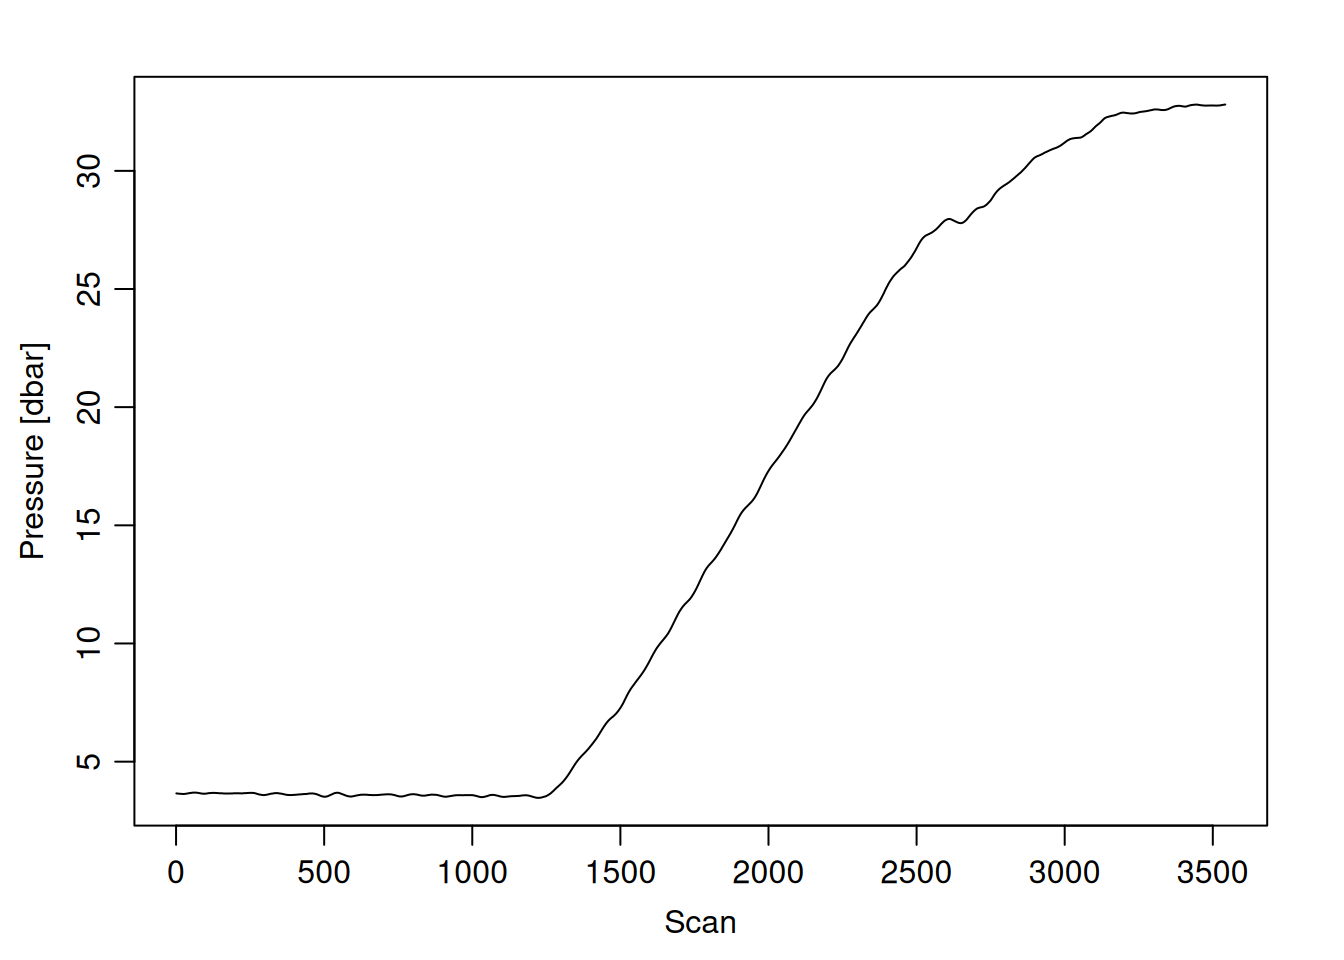
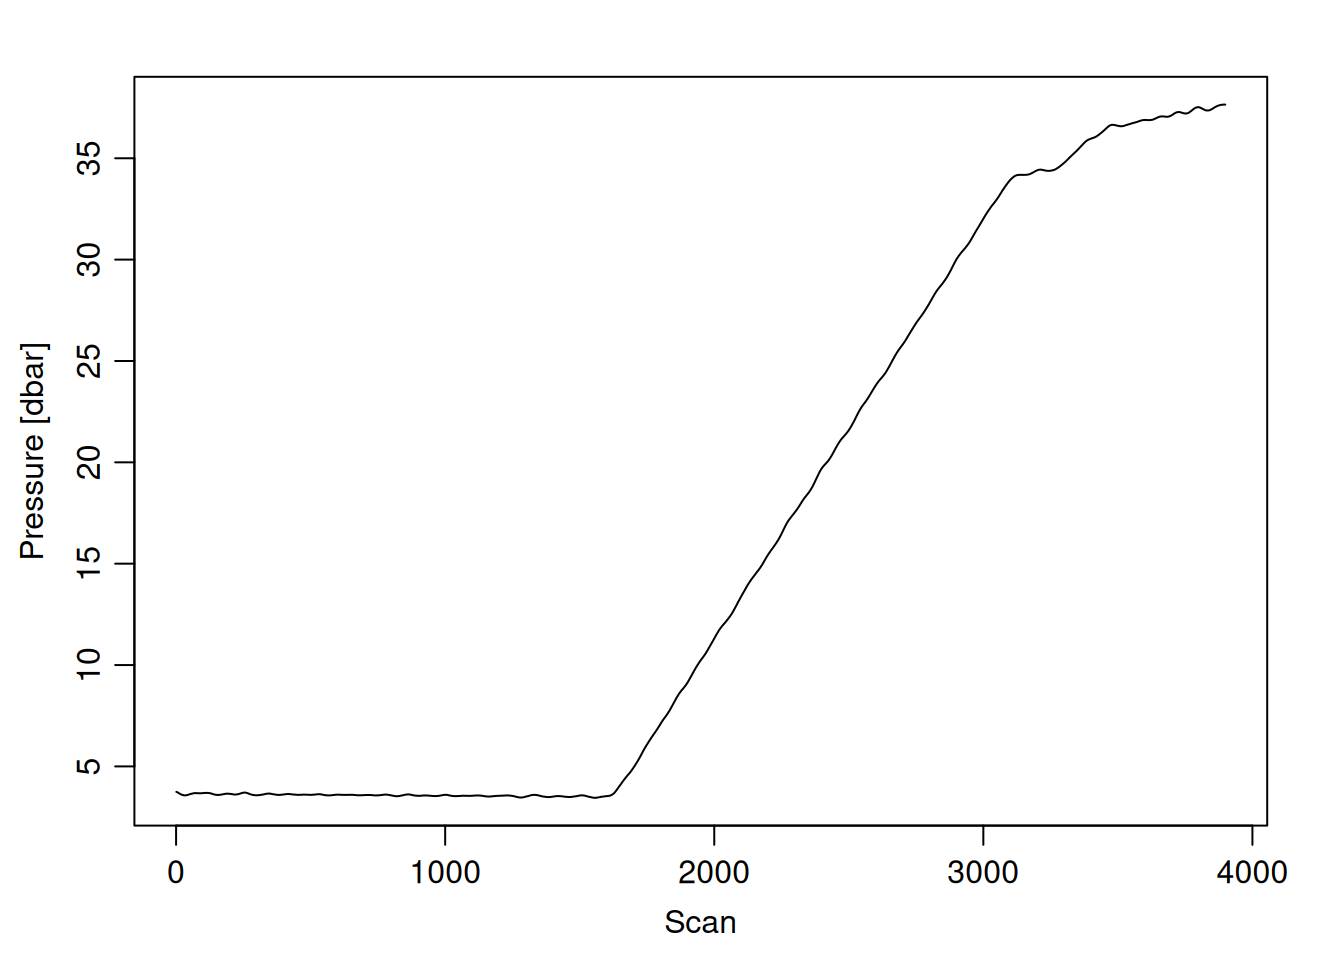
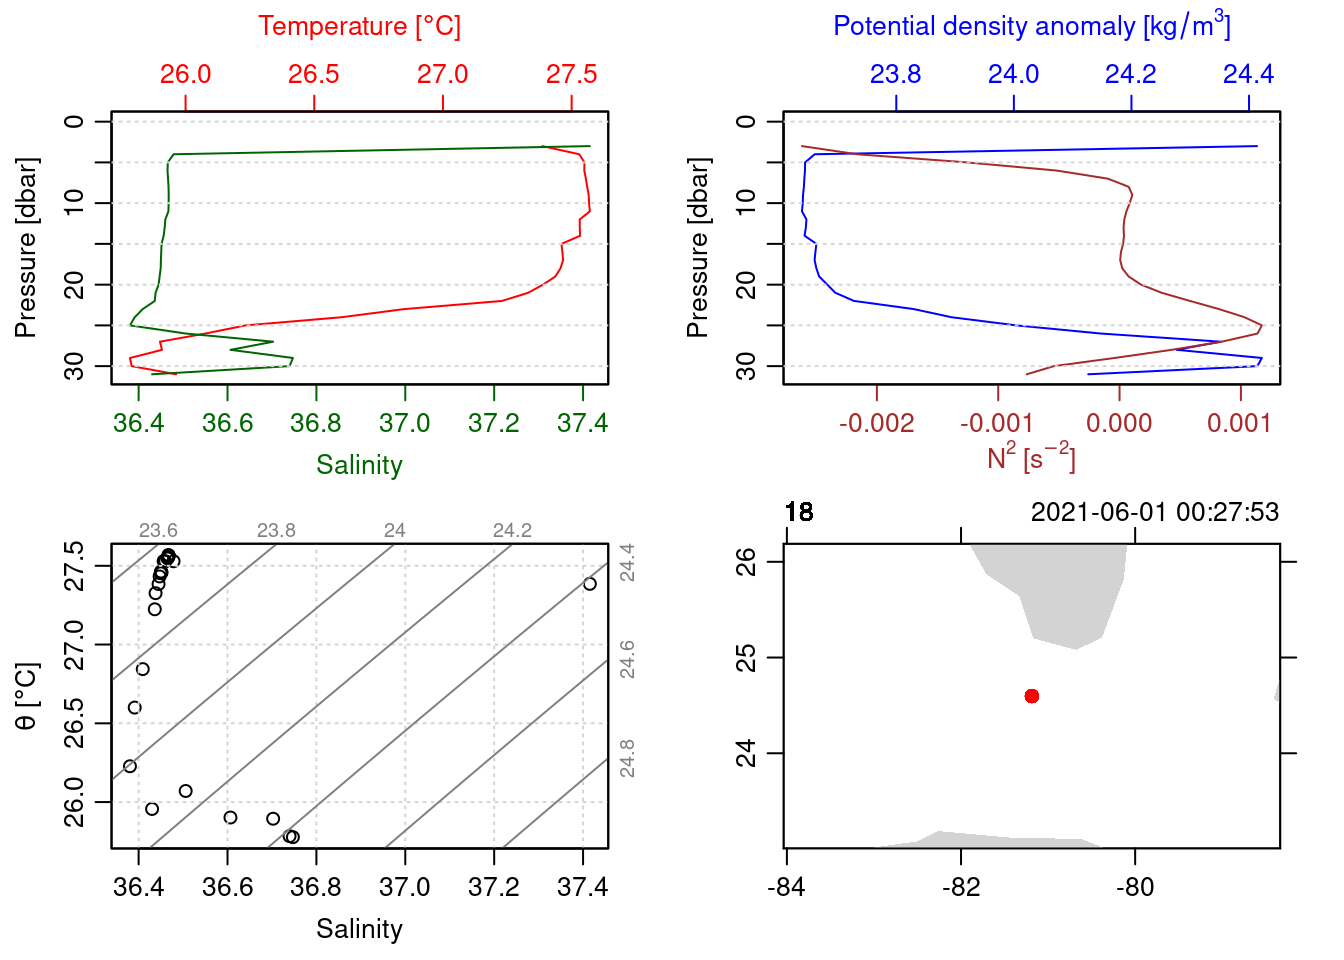
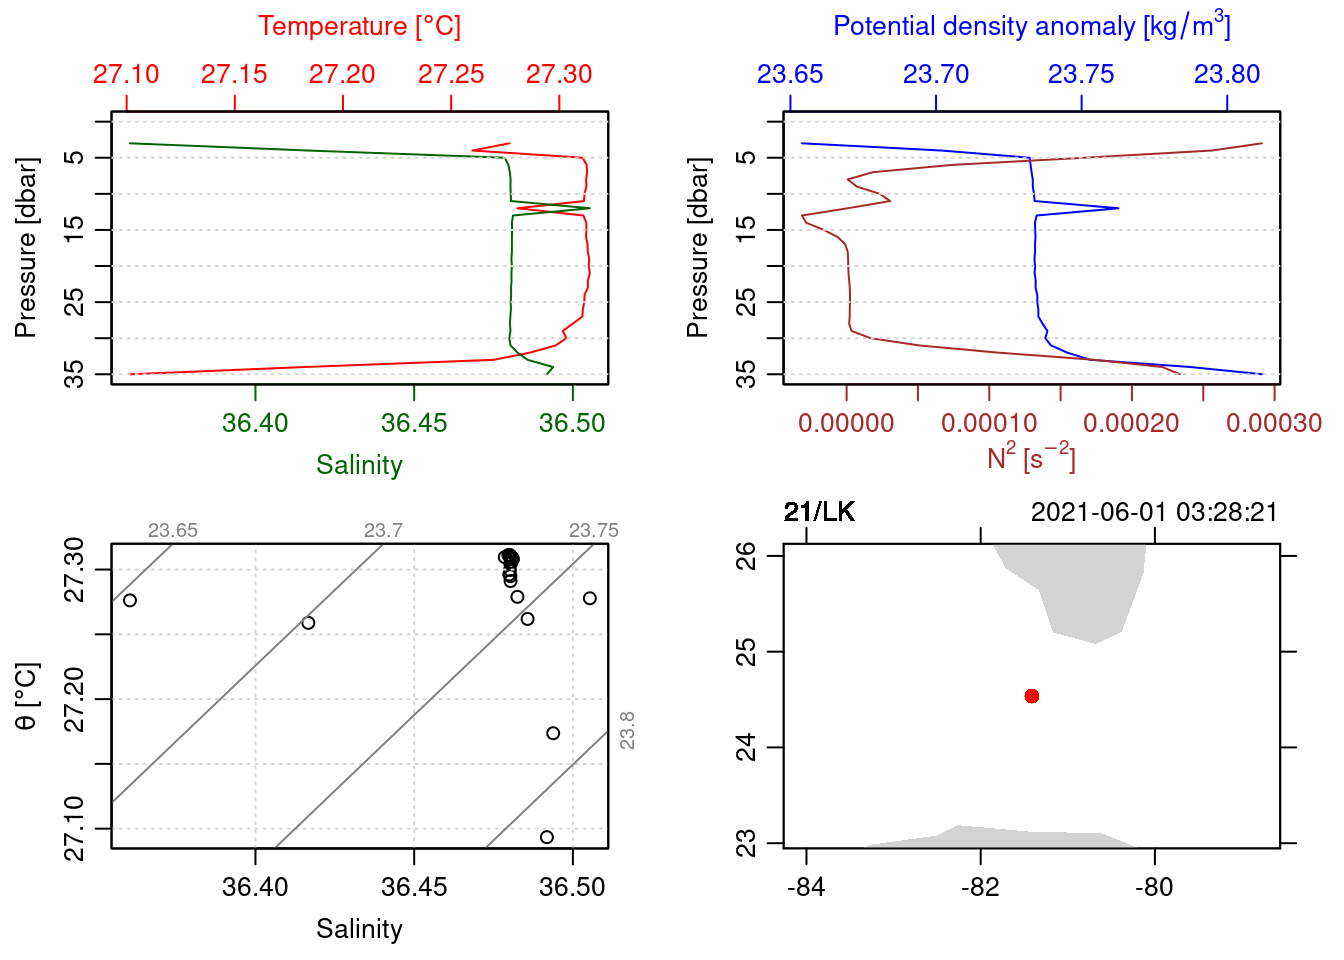
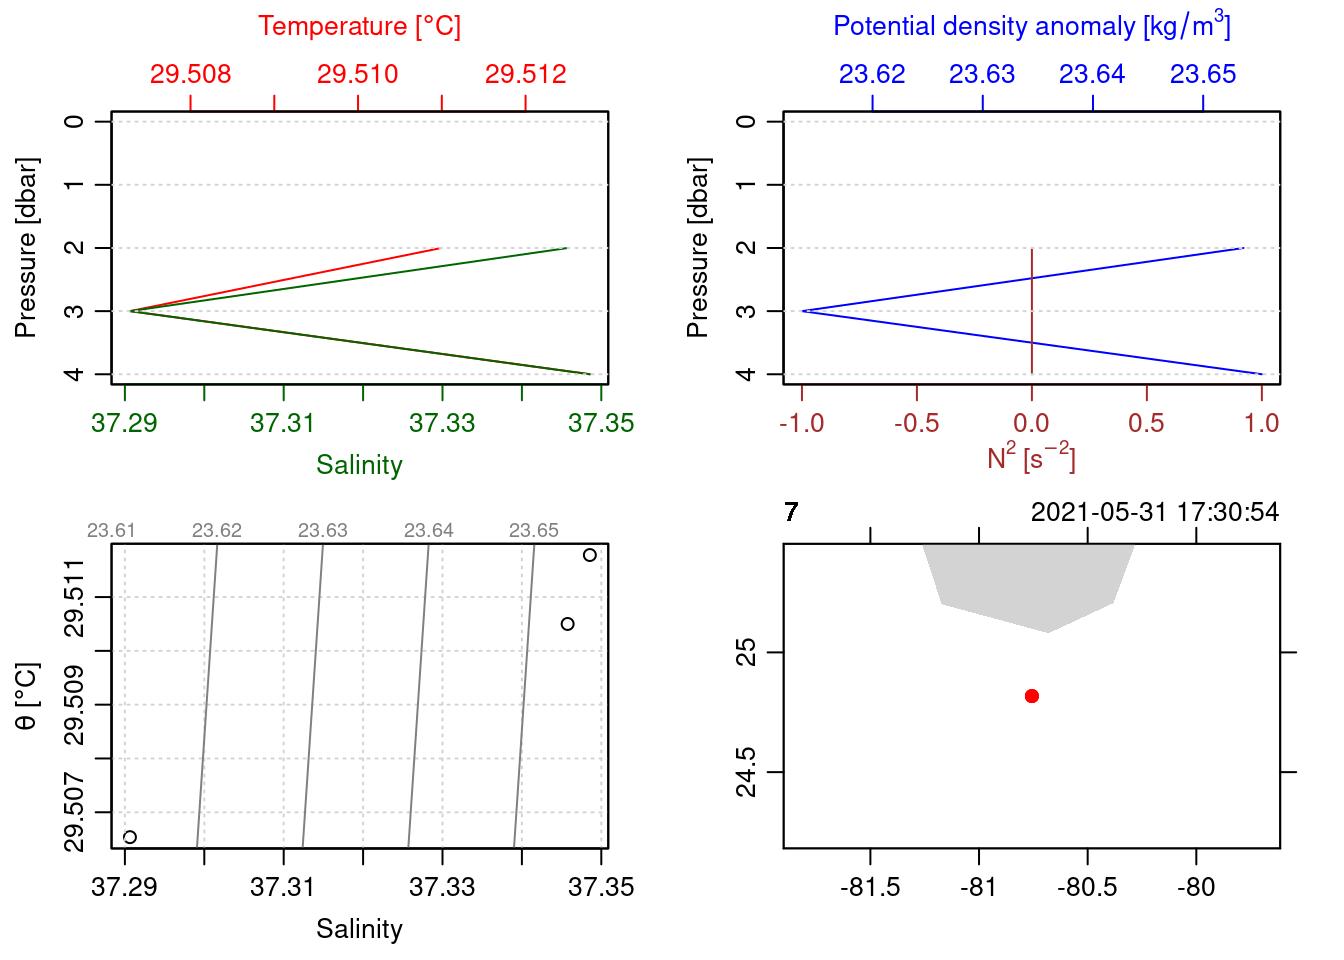
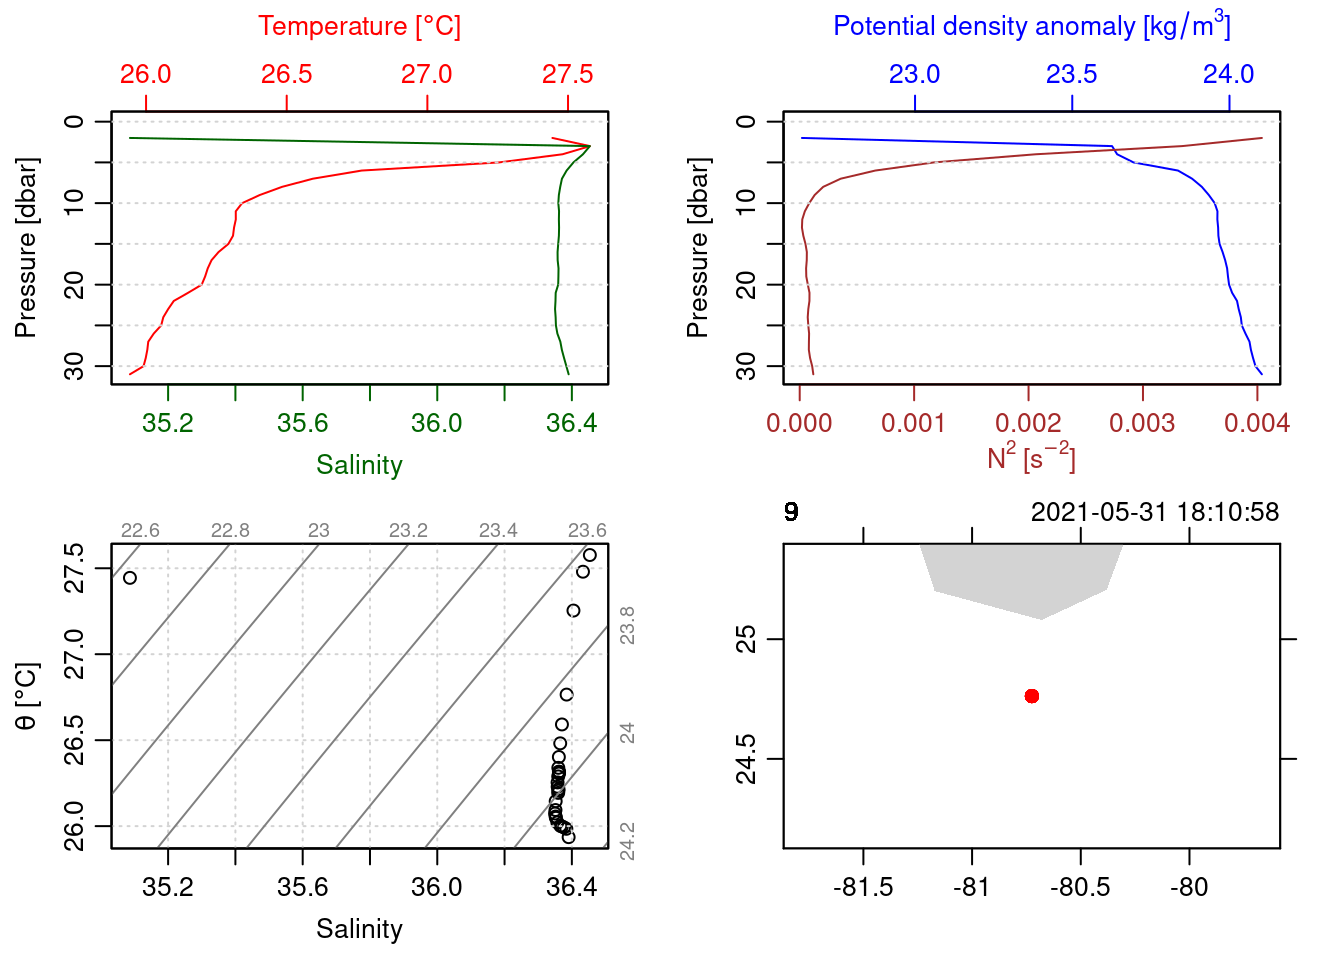
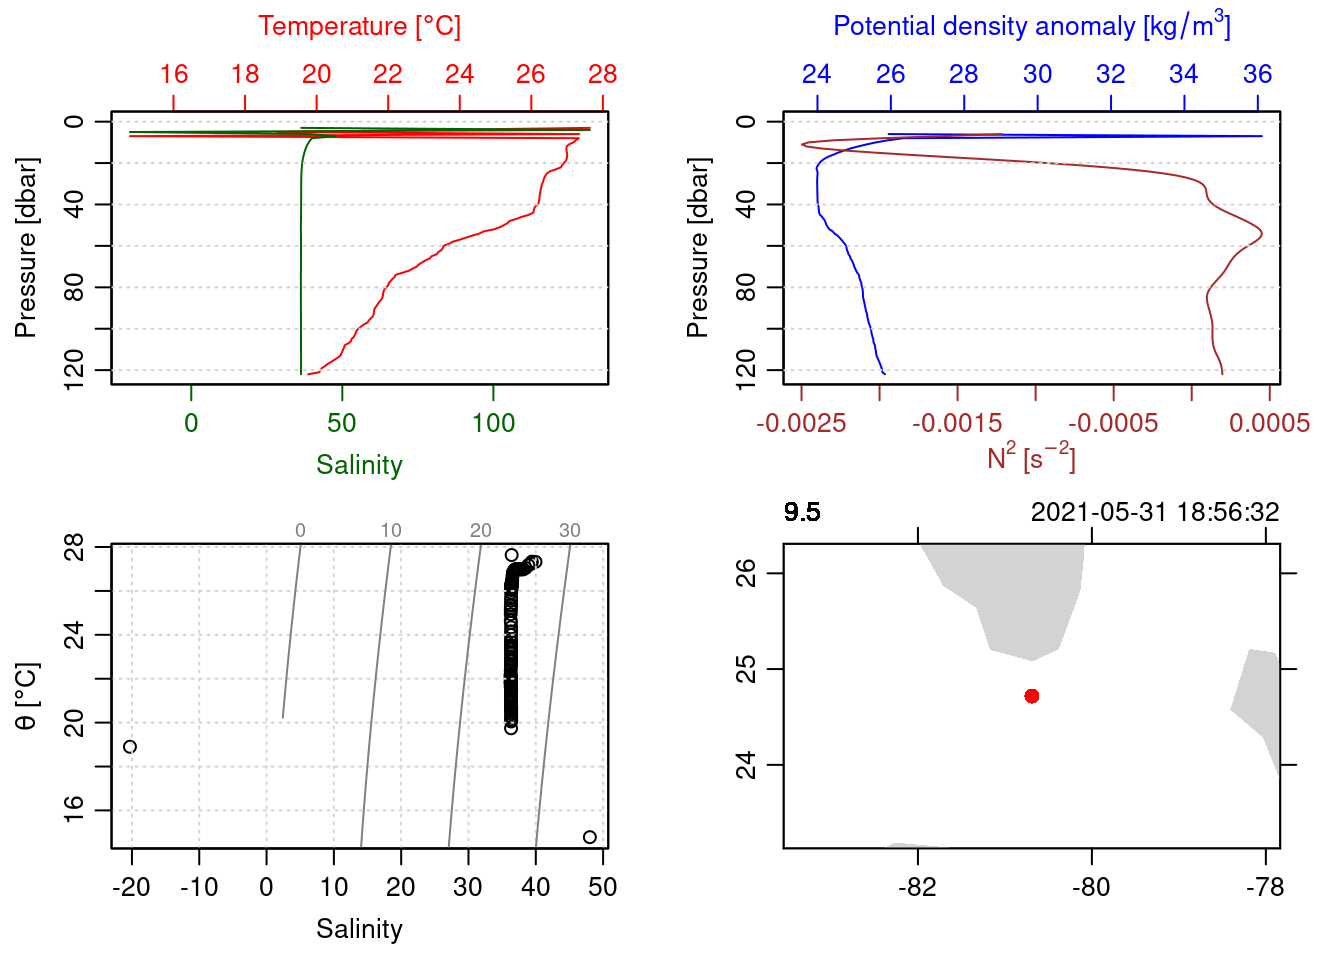
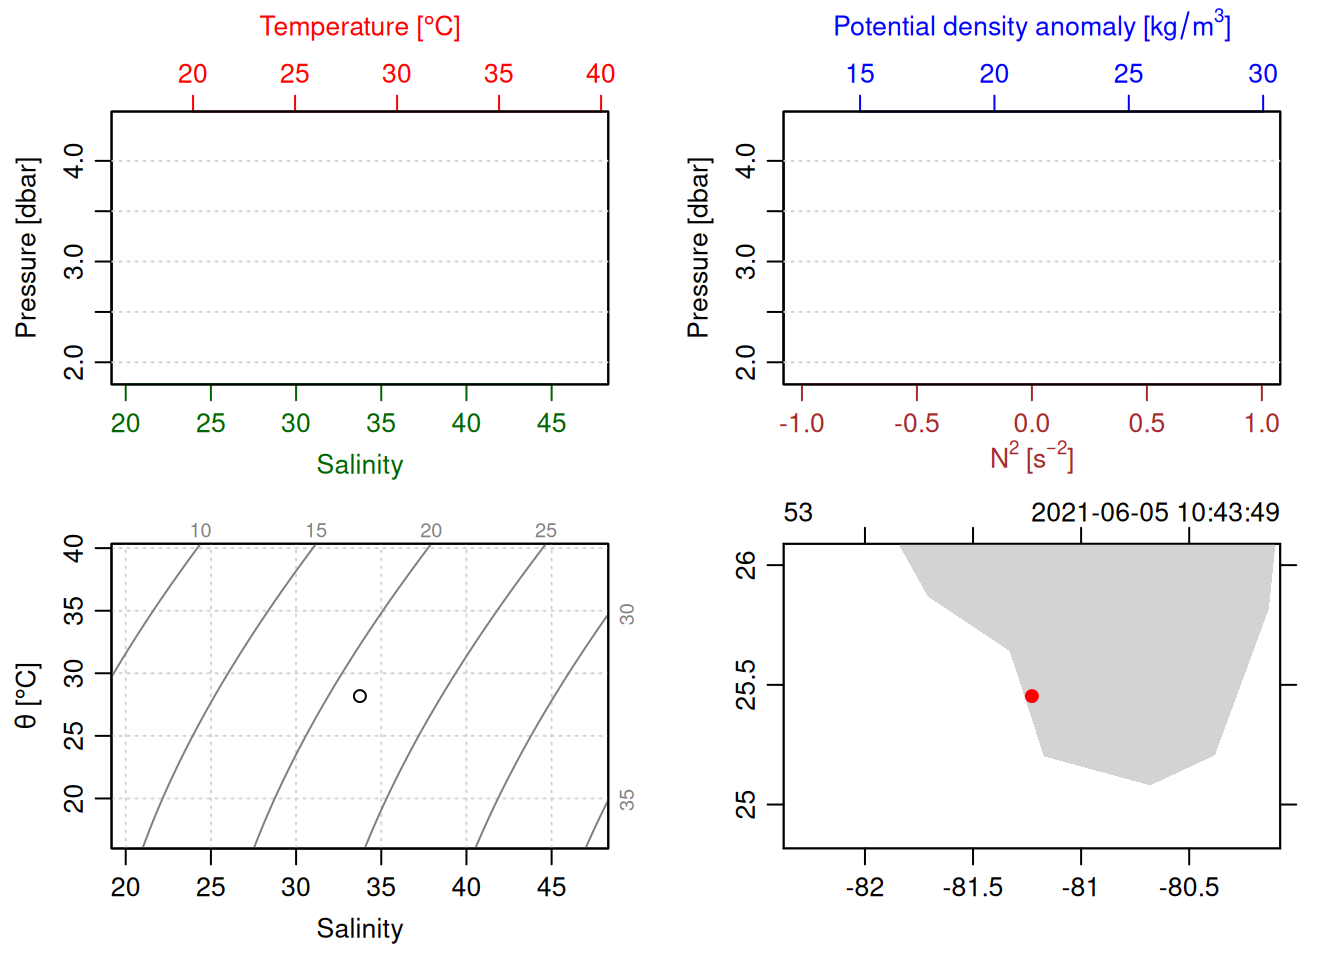
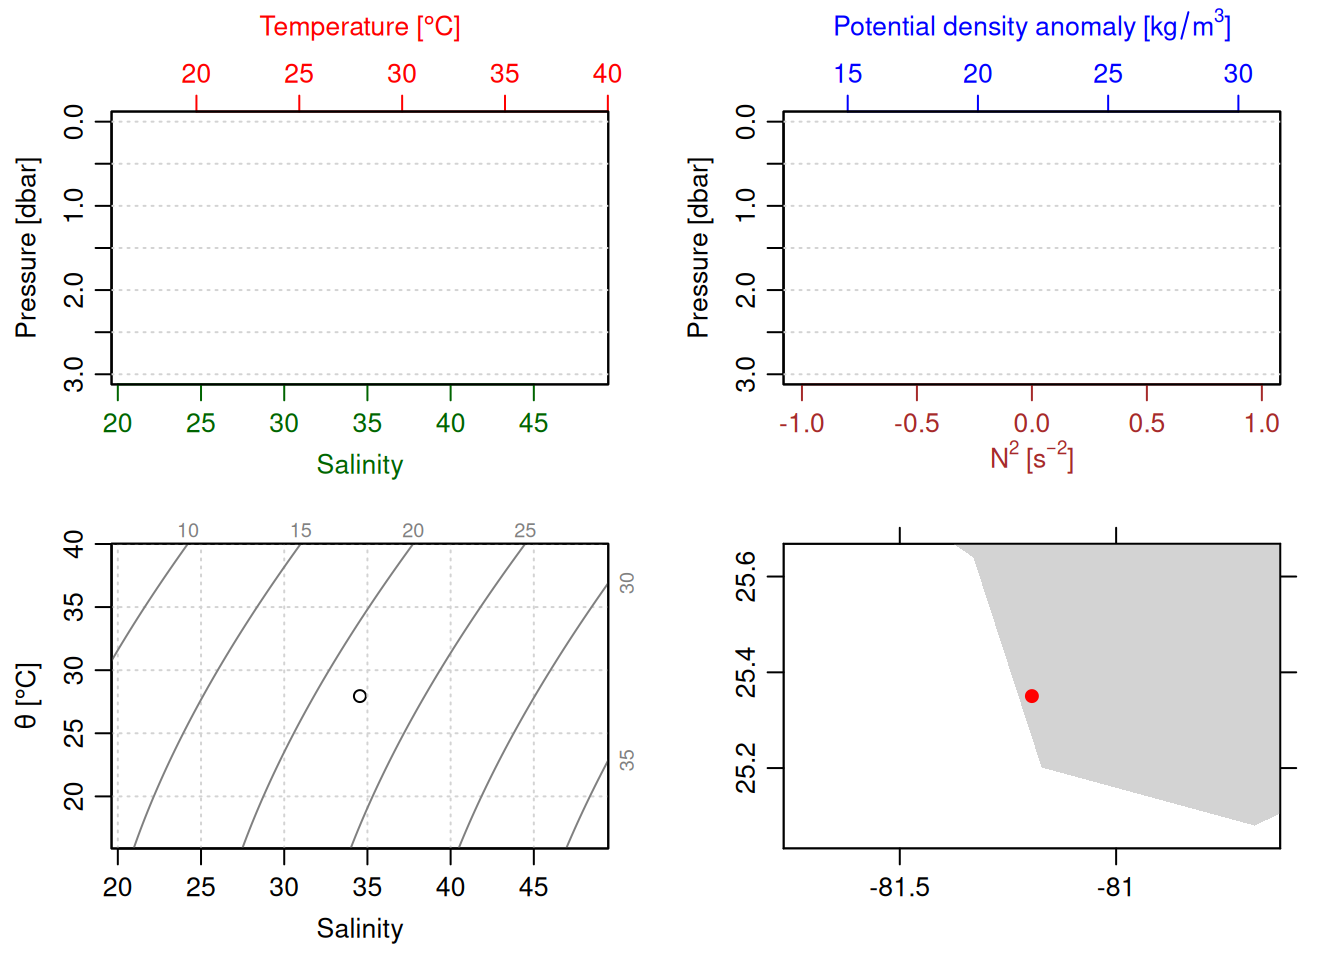
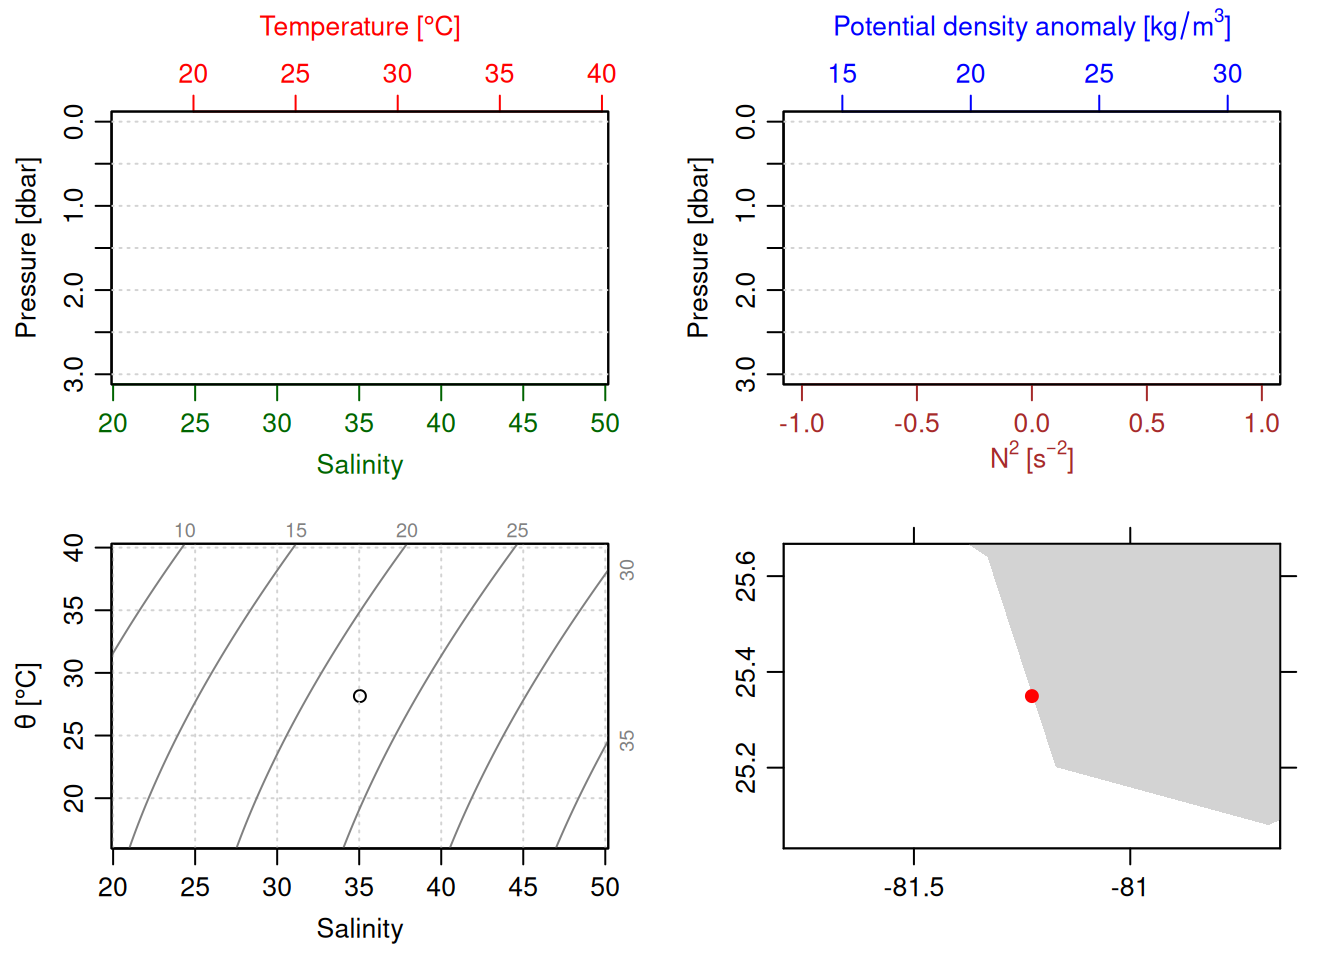
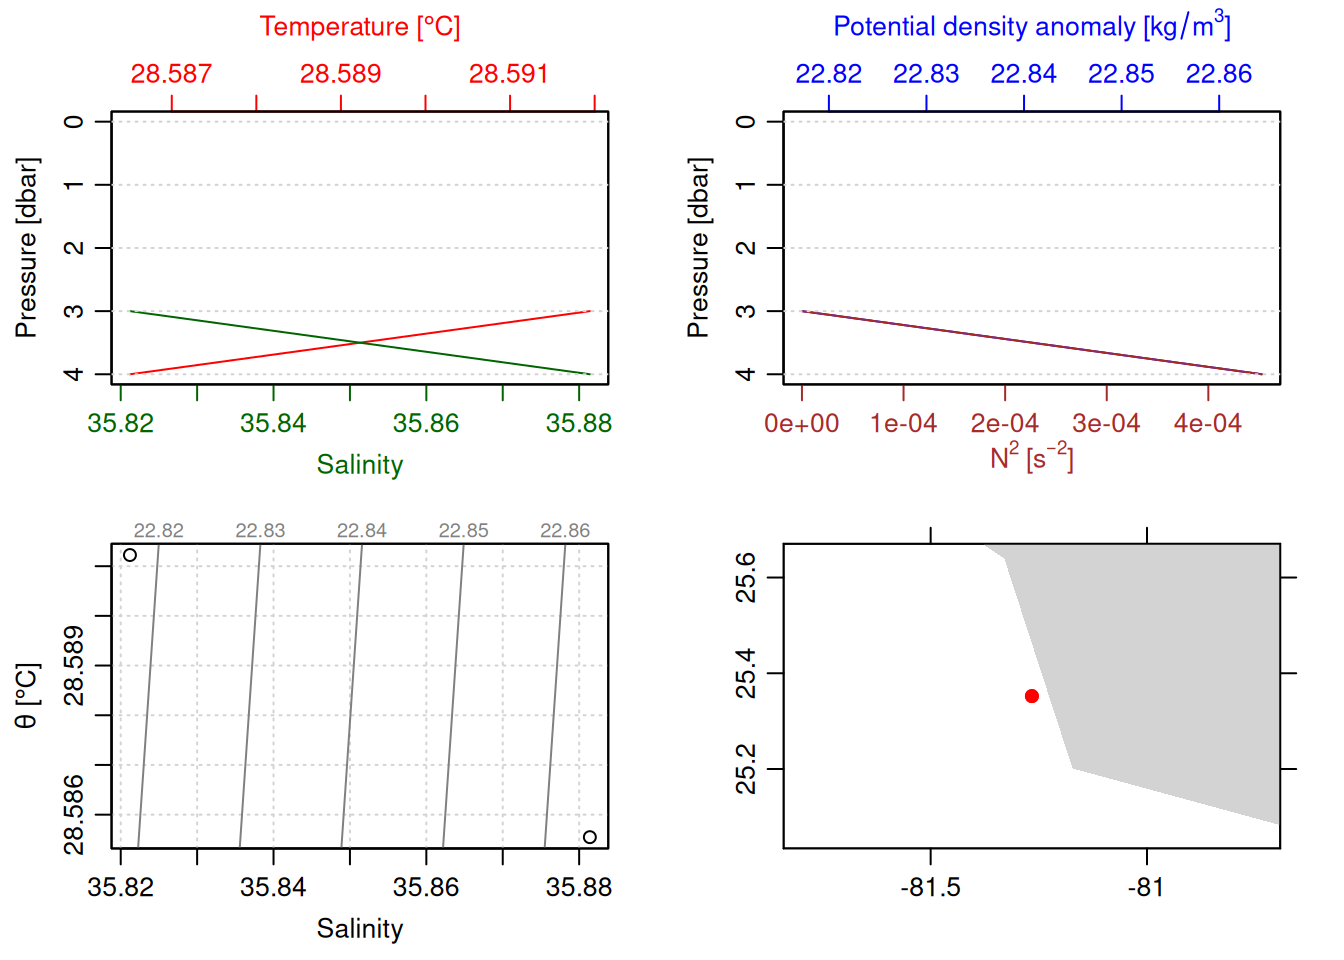
for (i inseq(ctd_FK)){ cast <- ctd_FK[[i]] # 1 is selecting only the first sublist# print(i)print(glue("=== station: {cast@metadata$station[1]}"))print(glue("# scans: {length(cast@data$scan)}"))plotScan(cast)}
=== station: 001
# scans: 4083
=== station: 007
# scans: 2401
=== station: 009
# scans: 8790
=== station: 009.5
# scans: 11589
=== station: 010
# scans: 3495
=== station: 012
# scans: 4989
=== station: 016
# scans: 2068
=== station: 018
# scans: 4476
=== station: 21LK
# scans: 3836
=== station: 30
# scans: 4127
=== station: 31
# scans: 3503
=== station: 33
# scans: 1939
=== station: 41
# scans: 2144
=== station: 45
# scans: 1496
=== station: 47
# scans: 1433
=== station: 49
# scans: 21
=== station: 51
# scans: 1786
=== station: 53
# scans: 1
=== station: 54
# scans: 713
=== station: 55
# scans: 786
=== station: 56
# scans: 2059
=== station: 57
# scans: 3803
=== station: 57.1
# scans: 3842
=== station: 57.2
# scans: 4276
=== station: 57.3
# scans: 3700
=== station: 58
# scans: 4020
=== station: 60
# scans: 2082
=== station: 64
# scans: 189
=== station: 65
# scans: 50
=== station: 68
# scans: 26
=== station: AMI1
# scans: 3305
=== station: AMI2
# scans: 3517
=== station: AMI3
# scans: 3773
=== station: AMI4
# scans: 3907
=== station: AMI5
# scans: 4860
=== station: AMI6
# scans: 5757
=== station: AMI7
# scans: 5406
=== station: AMI8
# scans: 5667
=== station: AMI9
# scans: 6452
=== station: BG1
# scans: 1990
=== station: BG2
# scans: 3919
=== station: BG3
# scans: 3476
=== station: BG4
# scans: 4101
=== station: CAL.A
# scans: 4275
=== station: CAL1
# scans: 1562
=== station: CAL2
# scans: 1635
=== station: CAL3
# scans: 2805
=== station: CAL4
# scans: 2245
=== station: CAL5
# scans: 4217
=== station: CAL6
# scans: 4214
=== station: GP5
# scans: 3928
=== station: GS
# scans: 7392
=== station: KW1
# scans: 3121
=== station: KW2
# scans: 4303
=== station: KW4
# scans: 4700
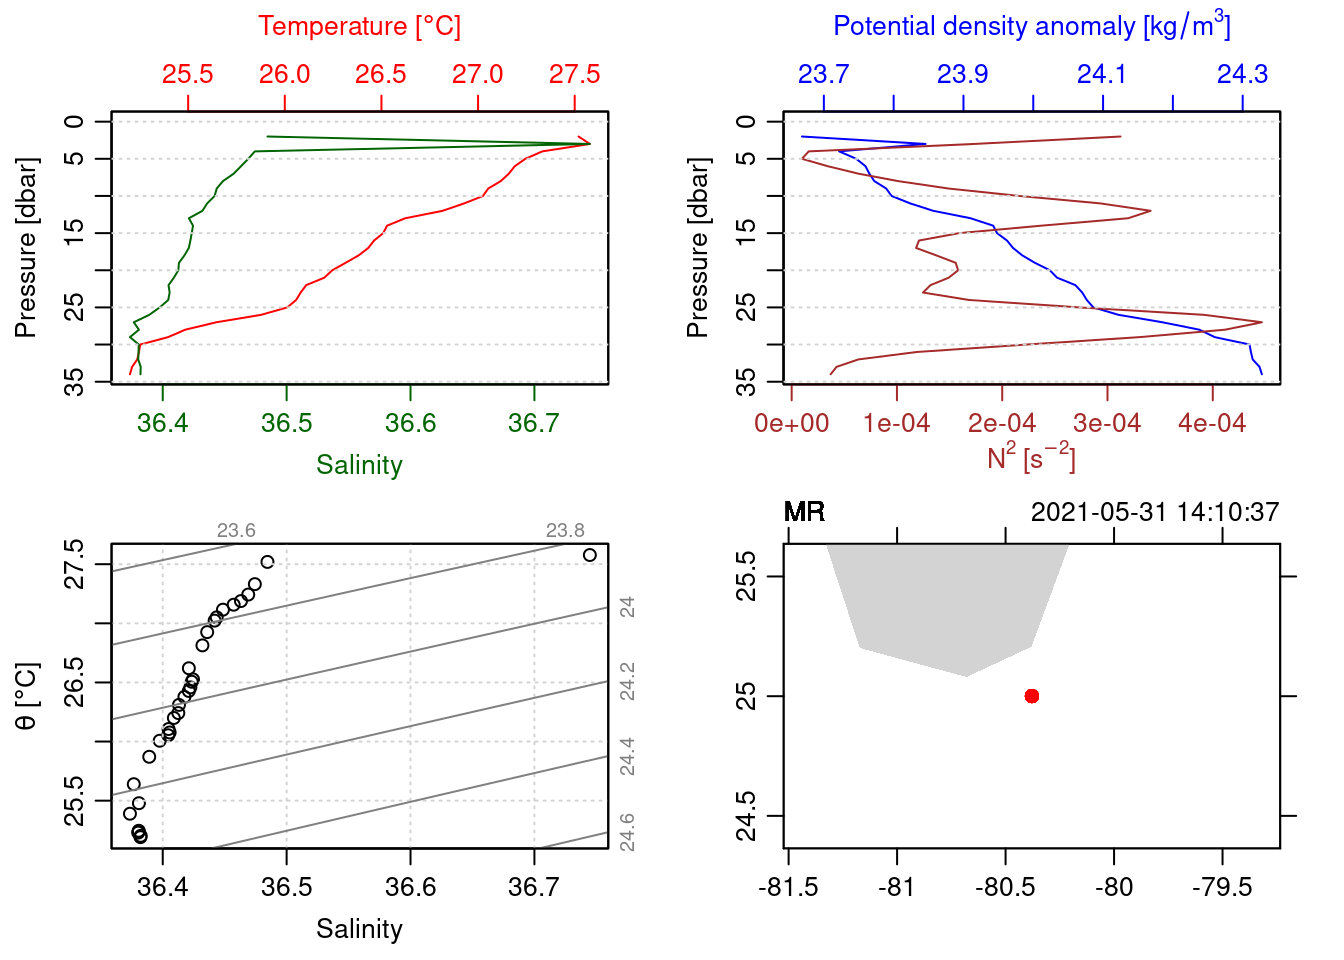
=== station: MR
# scans: 3370
=== station: RP1
# scans: 2651
=== station: RP2
# scans: 2801
=== station: RP3
# scans: 3874
=== station: RP4
# scans: 3963
=== station: TB1
# scans: 2323
=== station: TB10
# scans: 4822
=== station: TB2
# scans: 3170
=== station: TB3
# scans: 4540
=== station: TB4
# scans: 4601
=== station: TB5
# scans: 3469
=== station: TBA
# scans: 2930
=== station: TBB
# scans: 1884
=== station: TBC
# scans: 2402
=== station: V1
# scans: 3724
=== station: V2
# scans: 3053
=== station: V3
# scans: 3052
=== station: V4
# scans: 3528
=== station: V5
# scans: 3960
=== station: V6
# scans: 3316
=== station: V7
# scans: 3725
=== station: V8
# scans: 3542
=== station: V9
# scans: 3899
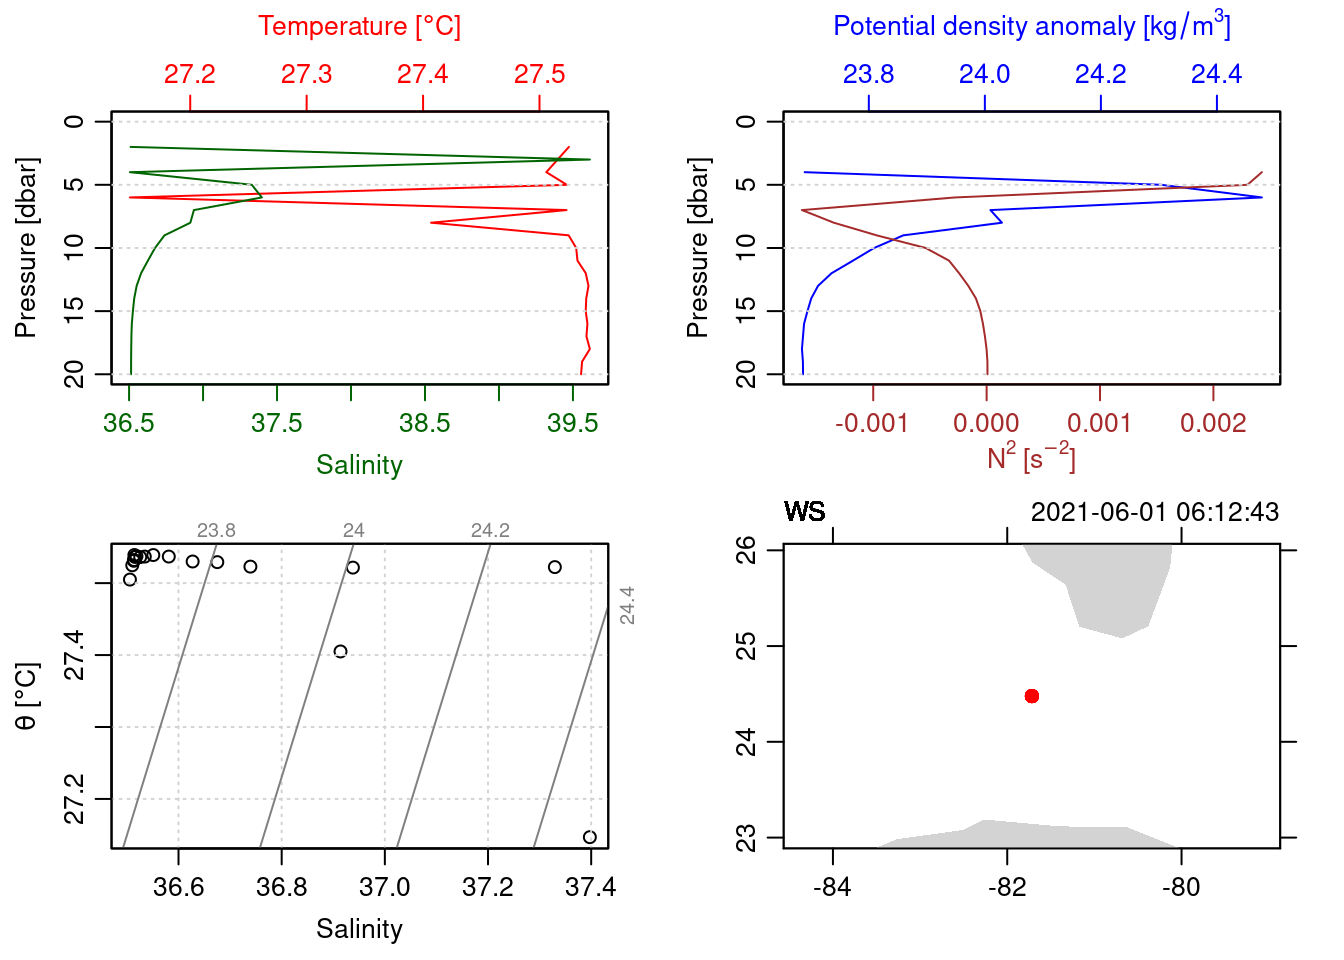
=== station: WS
# scans: 3363
plotting each cast in the first list
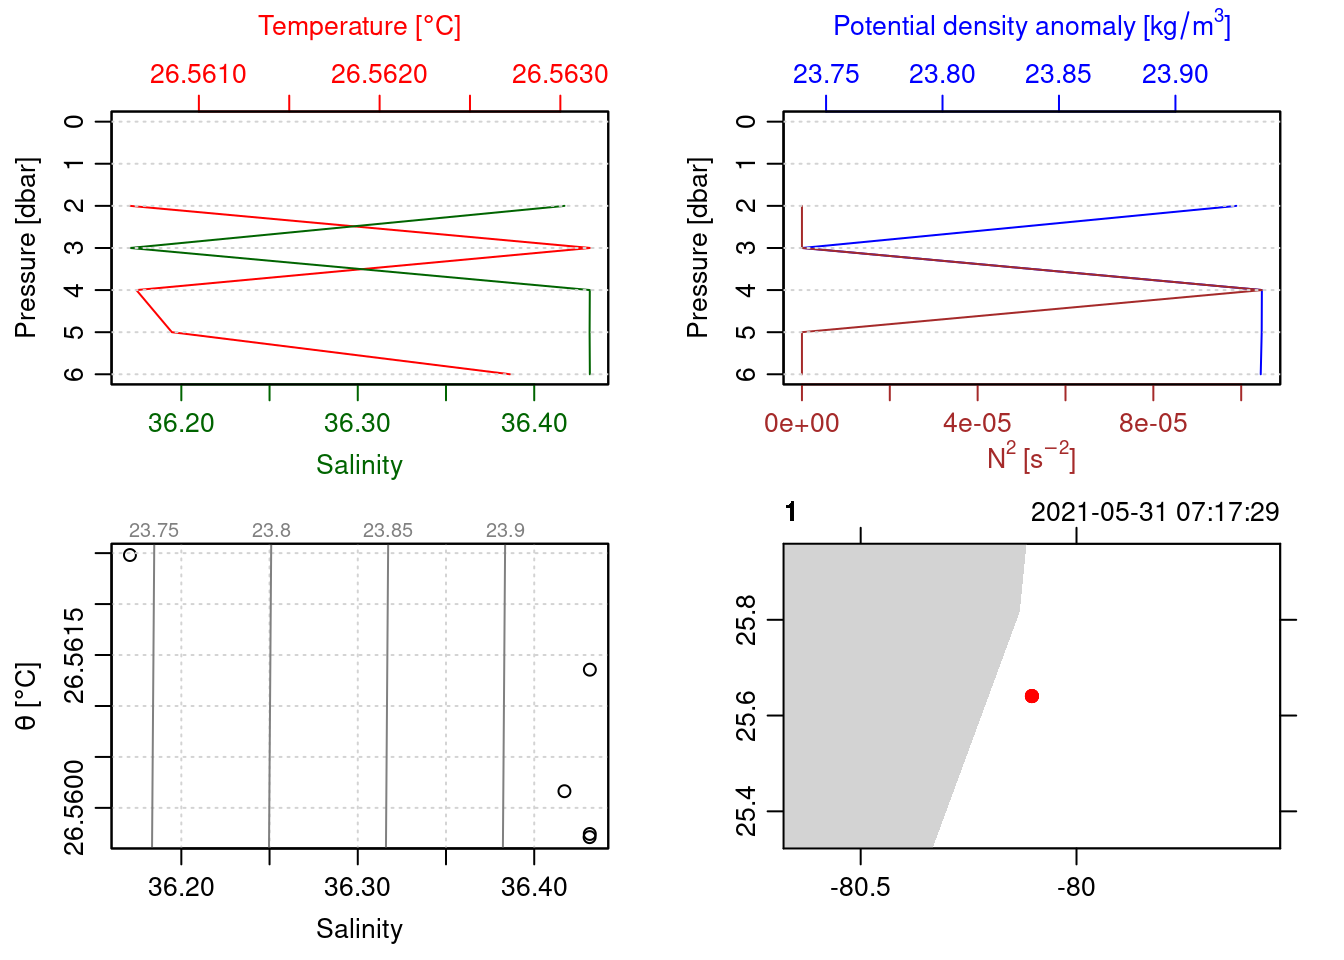
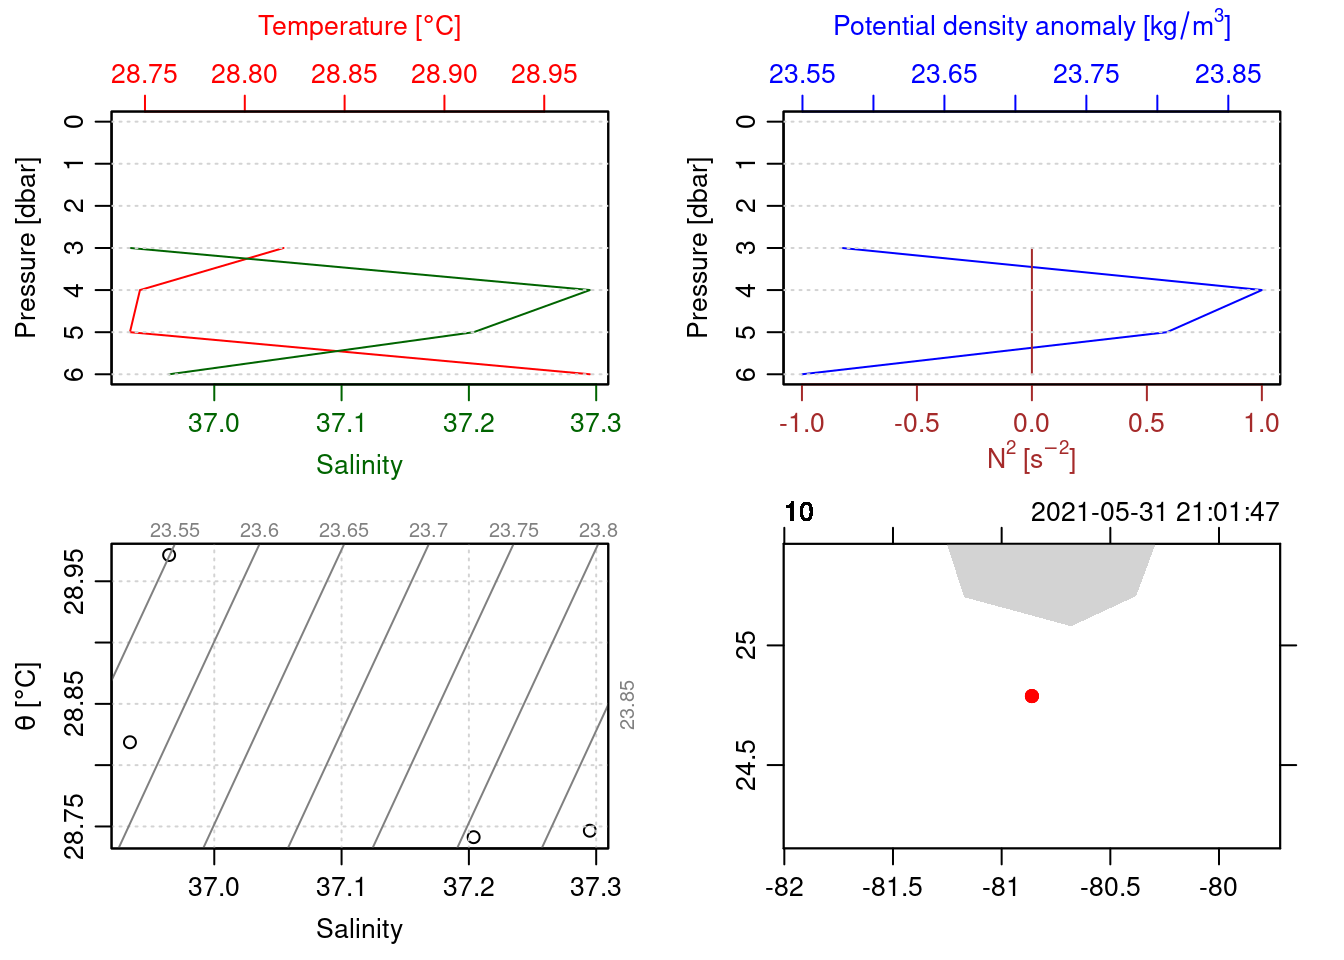
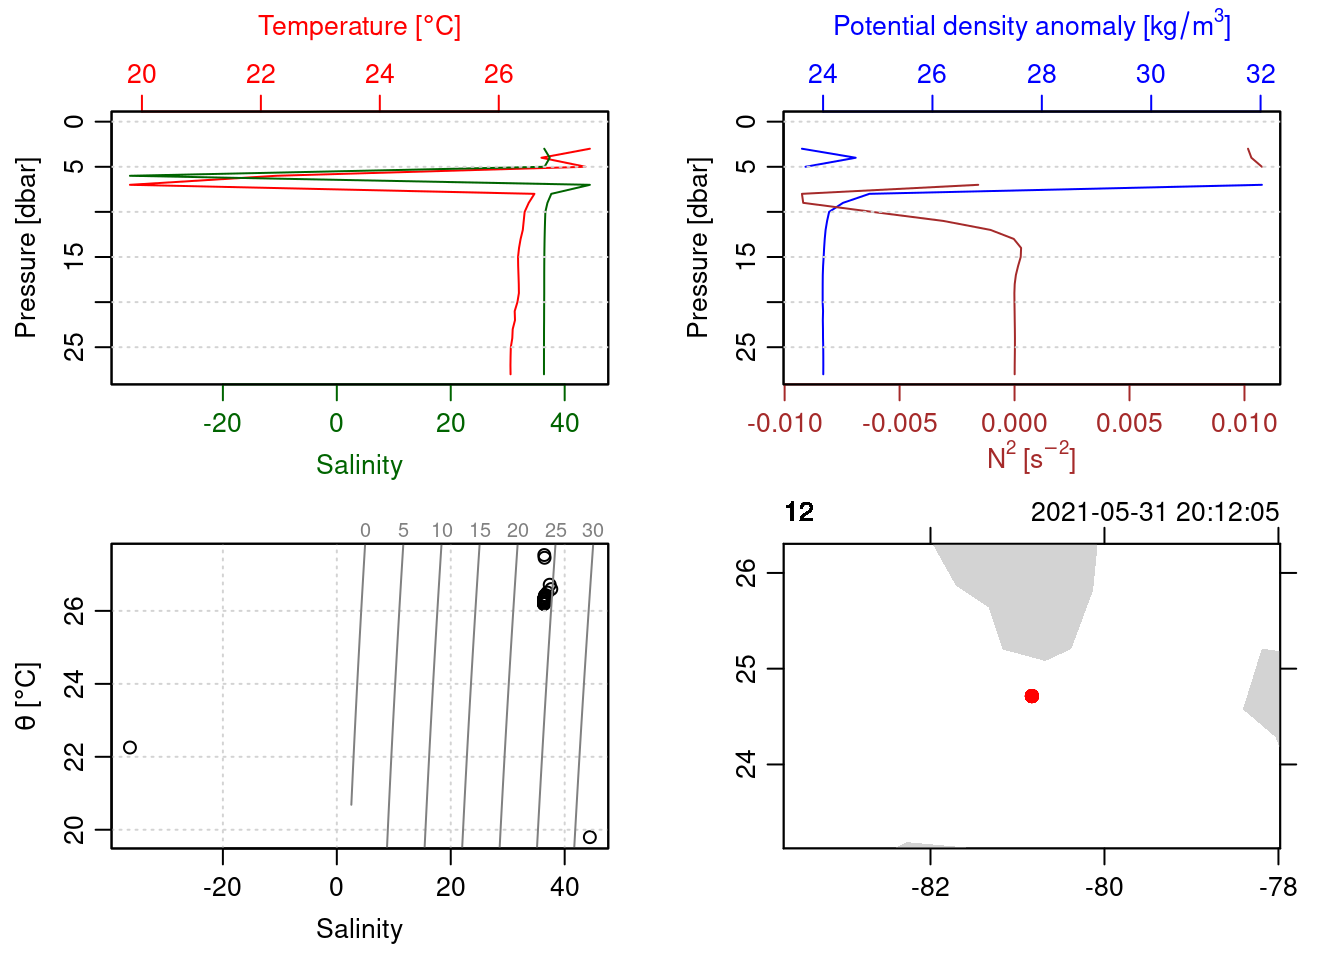
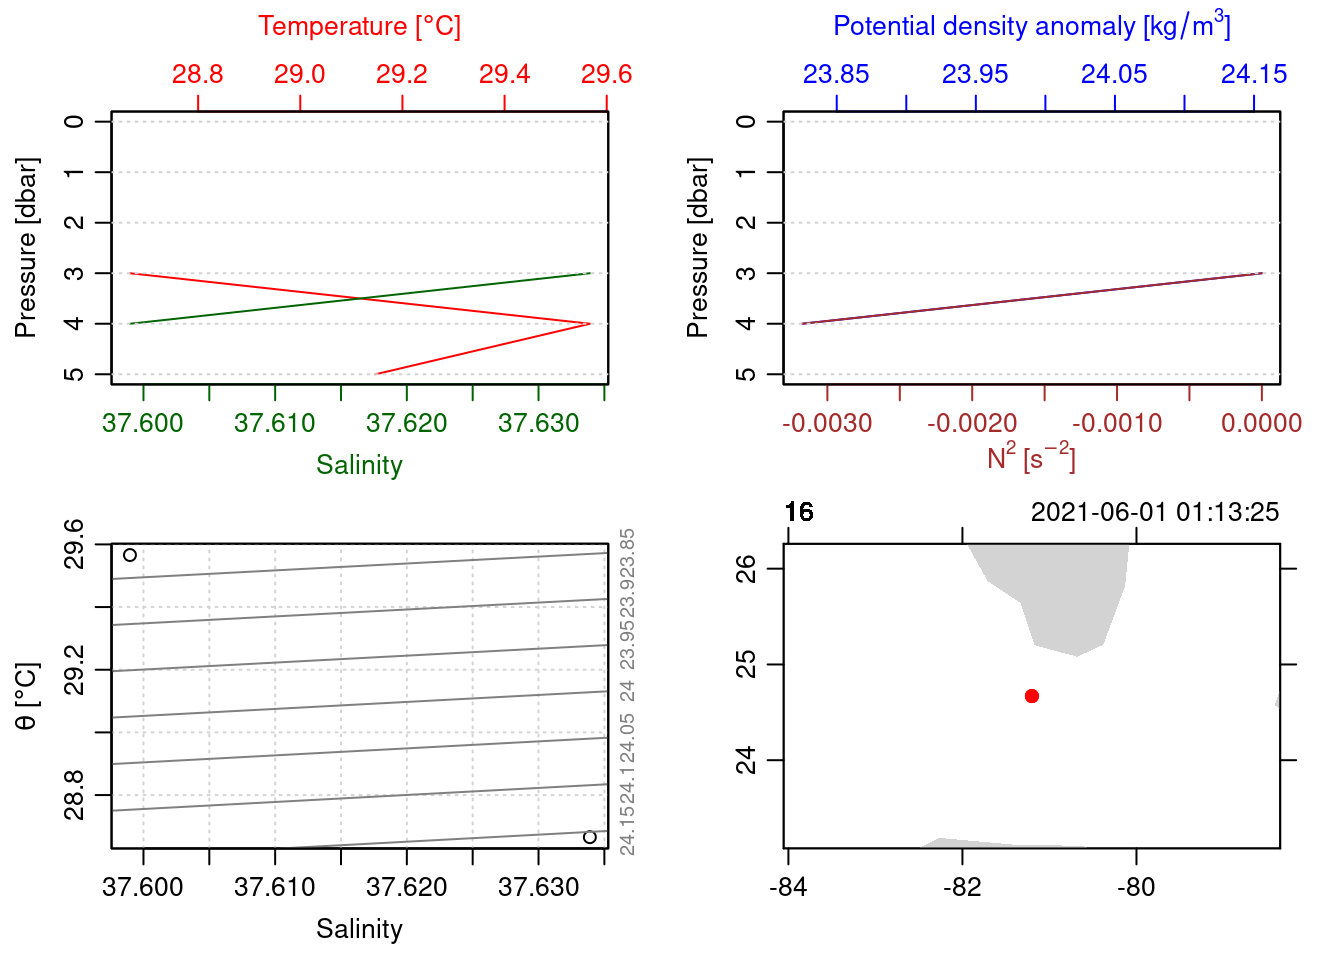
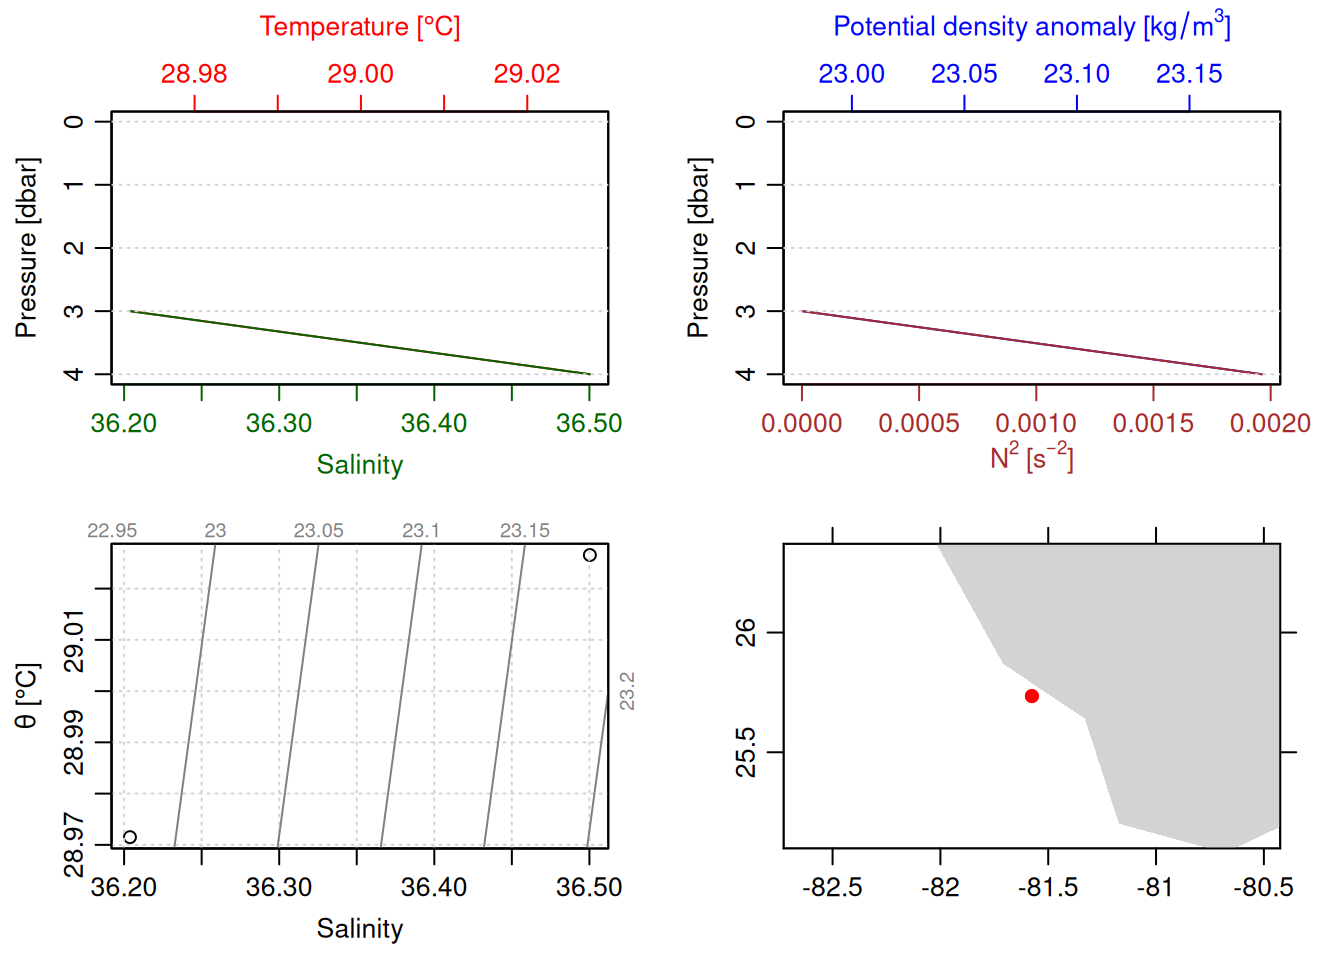
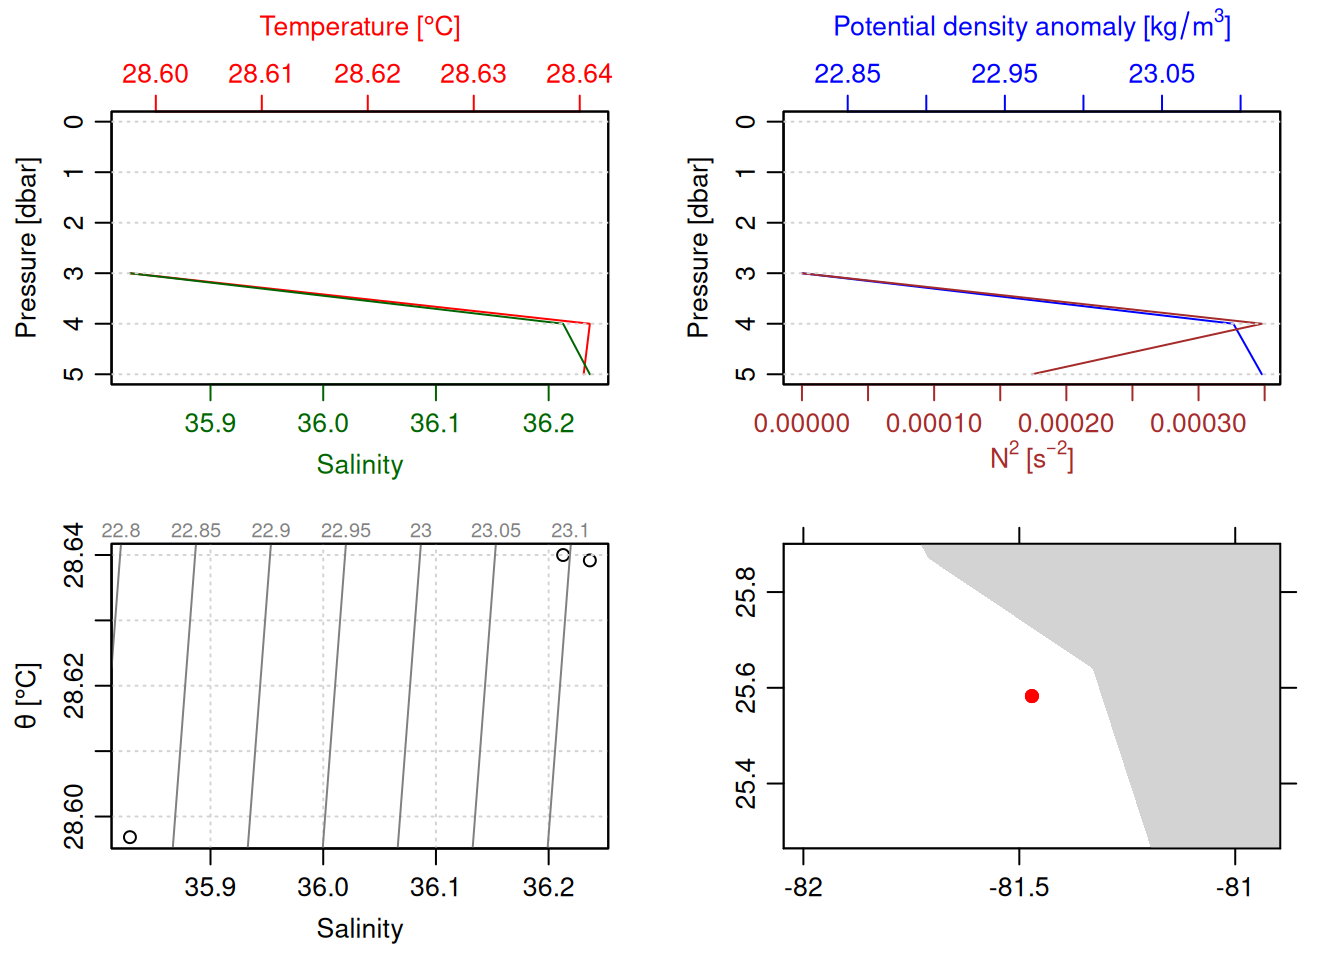
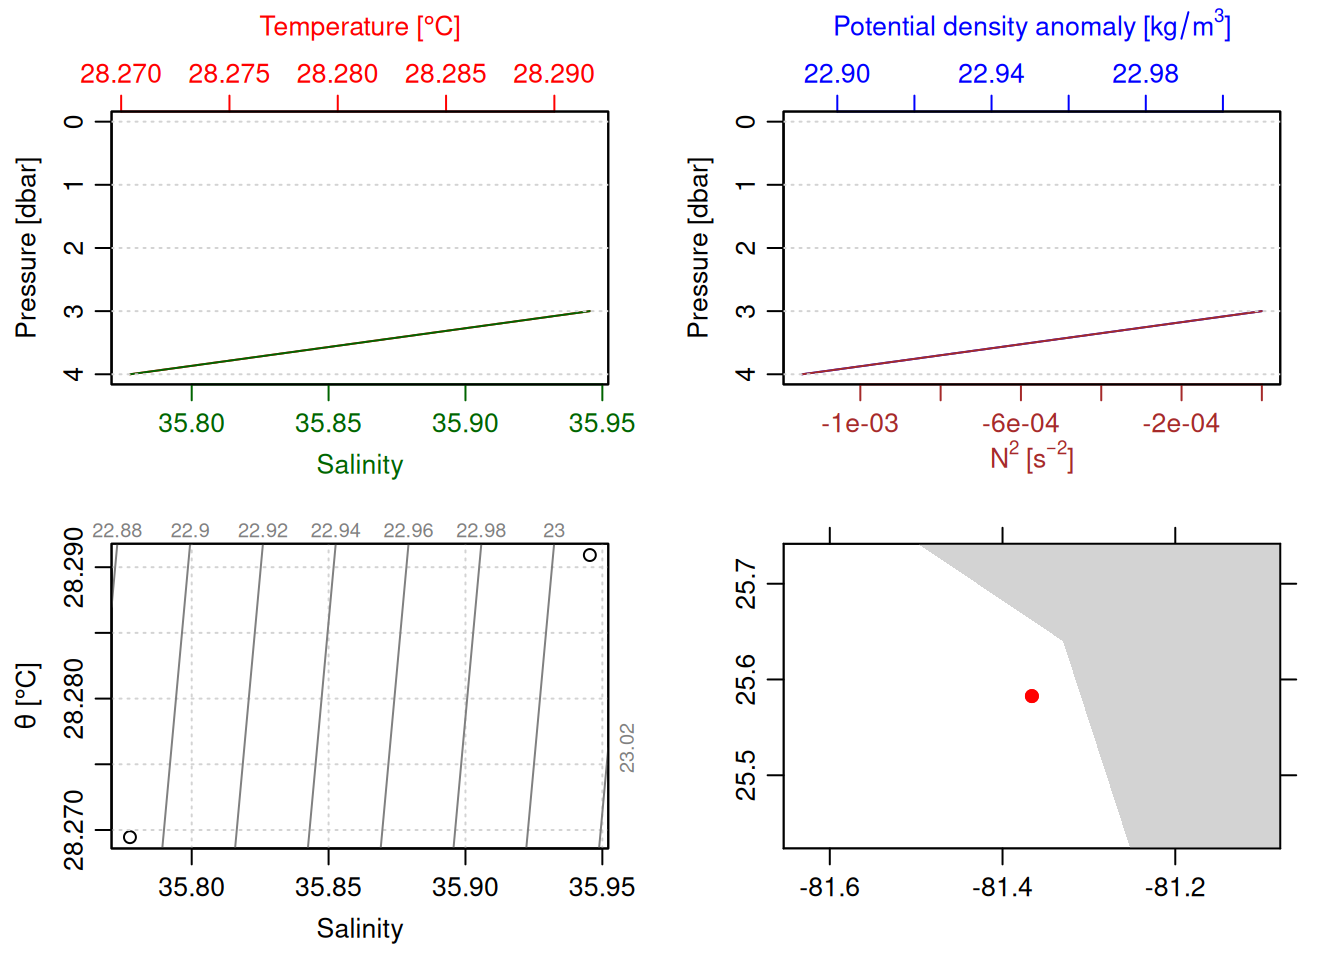
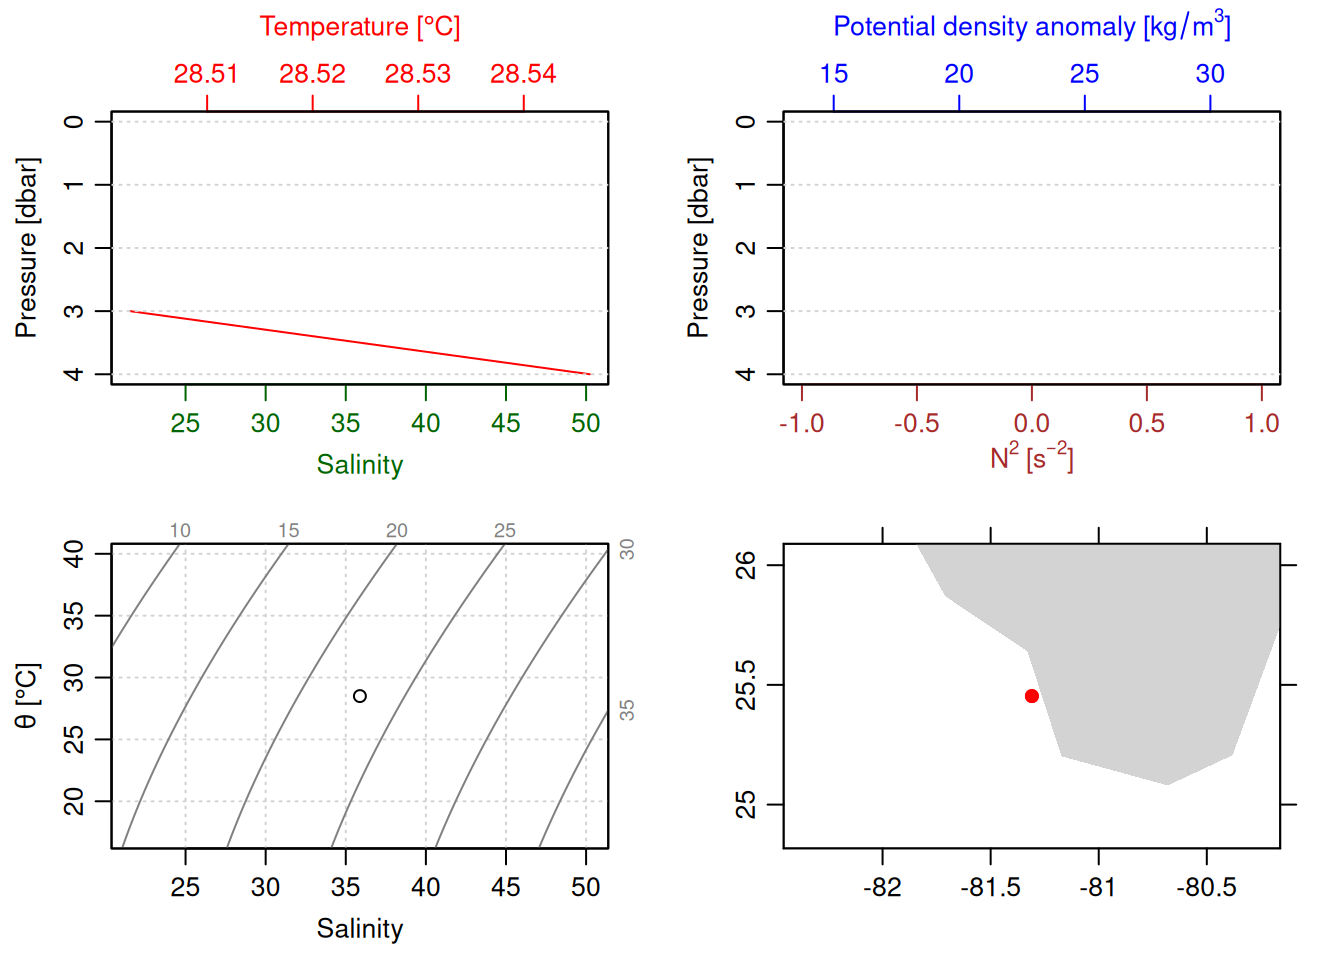
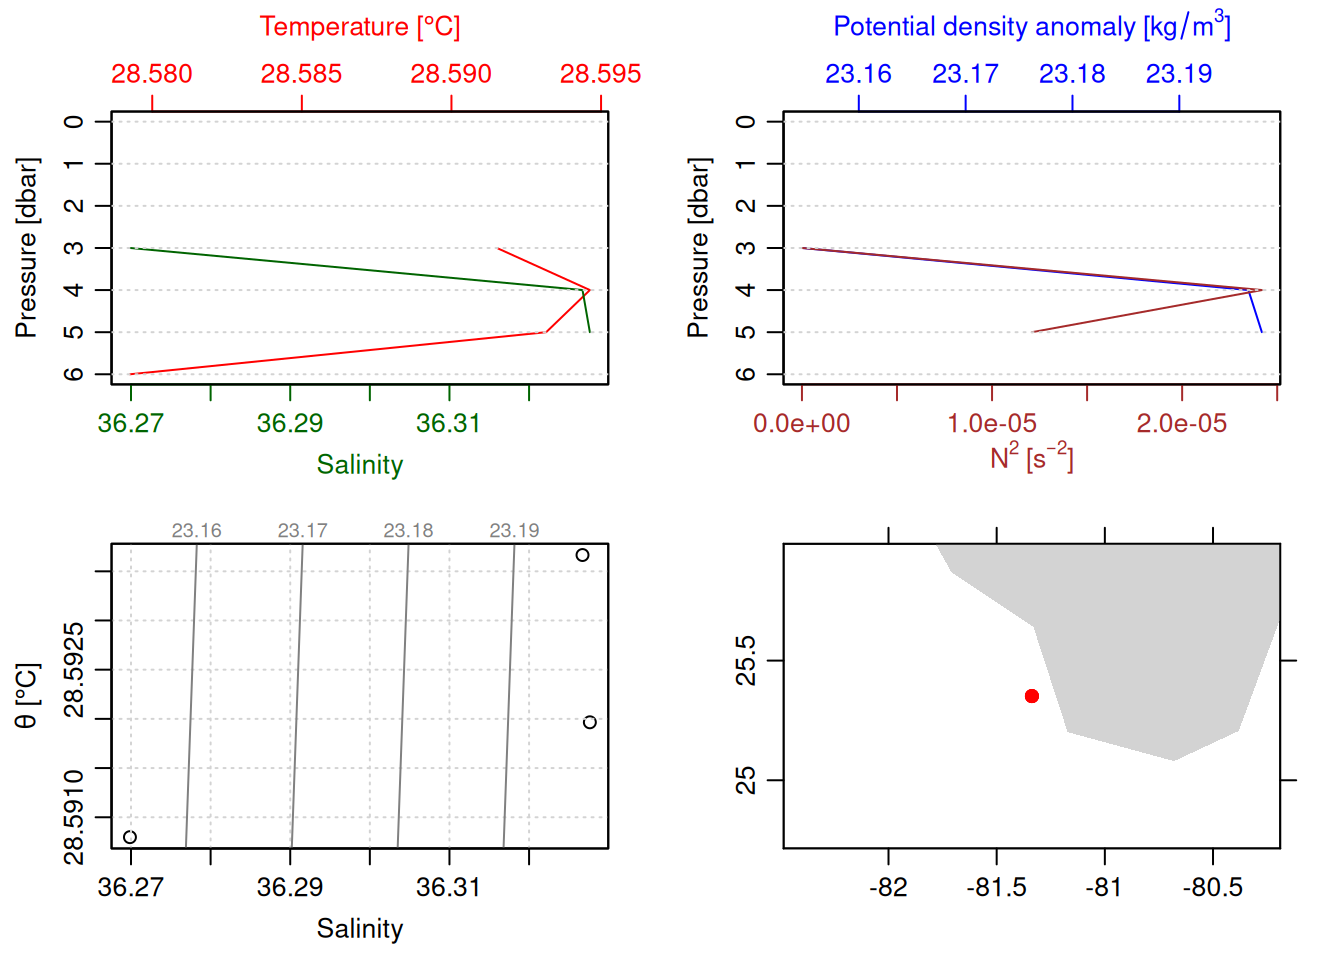
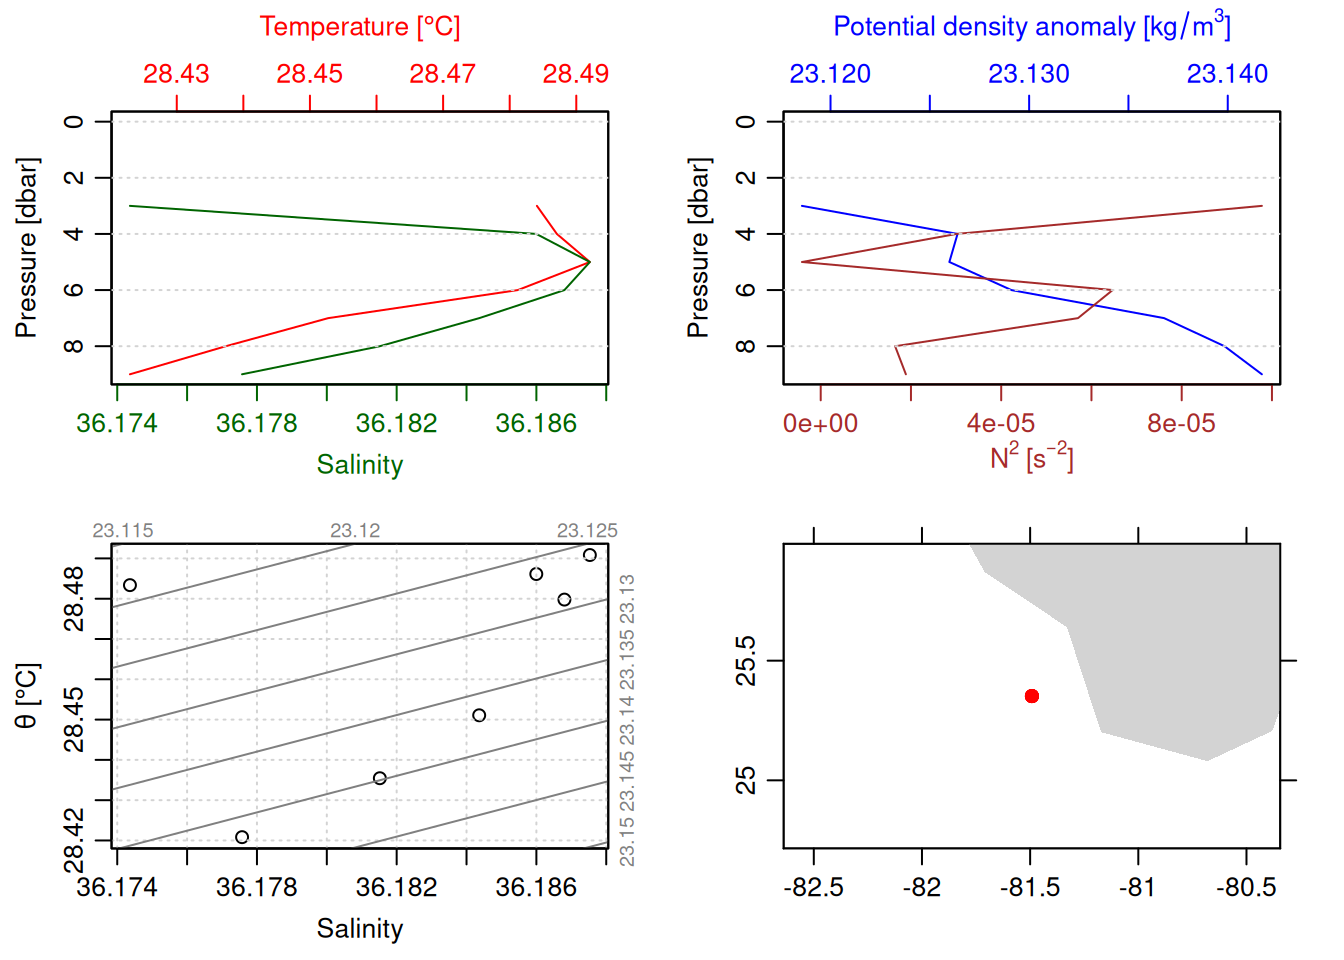
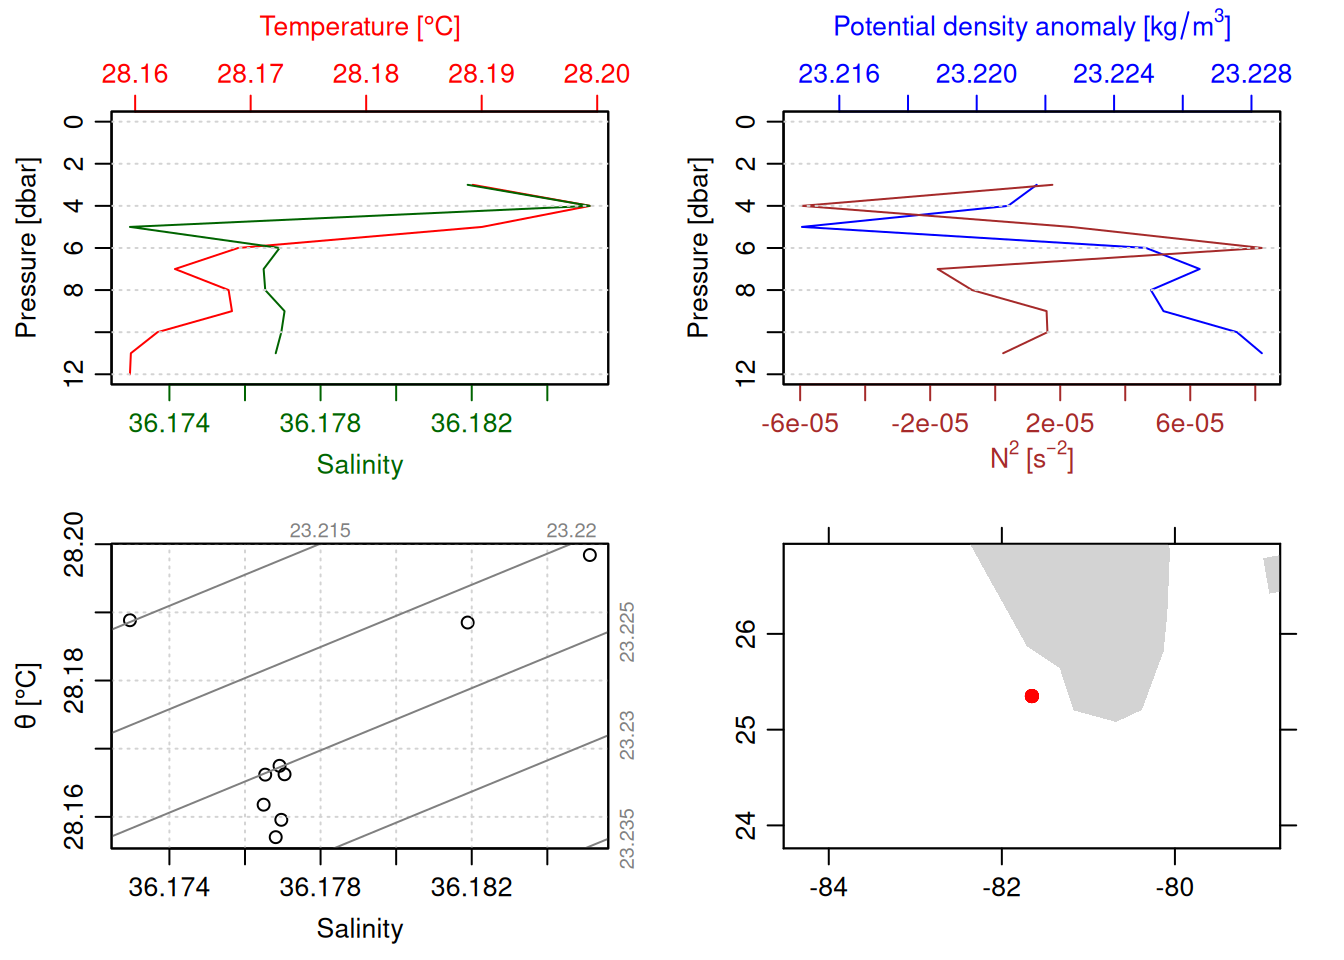
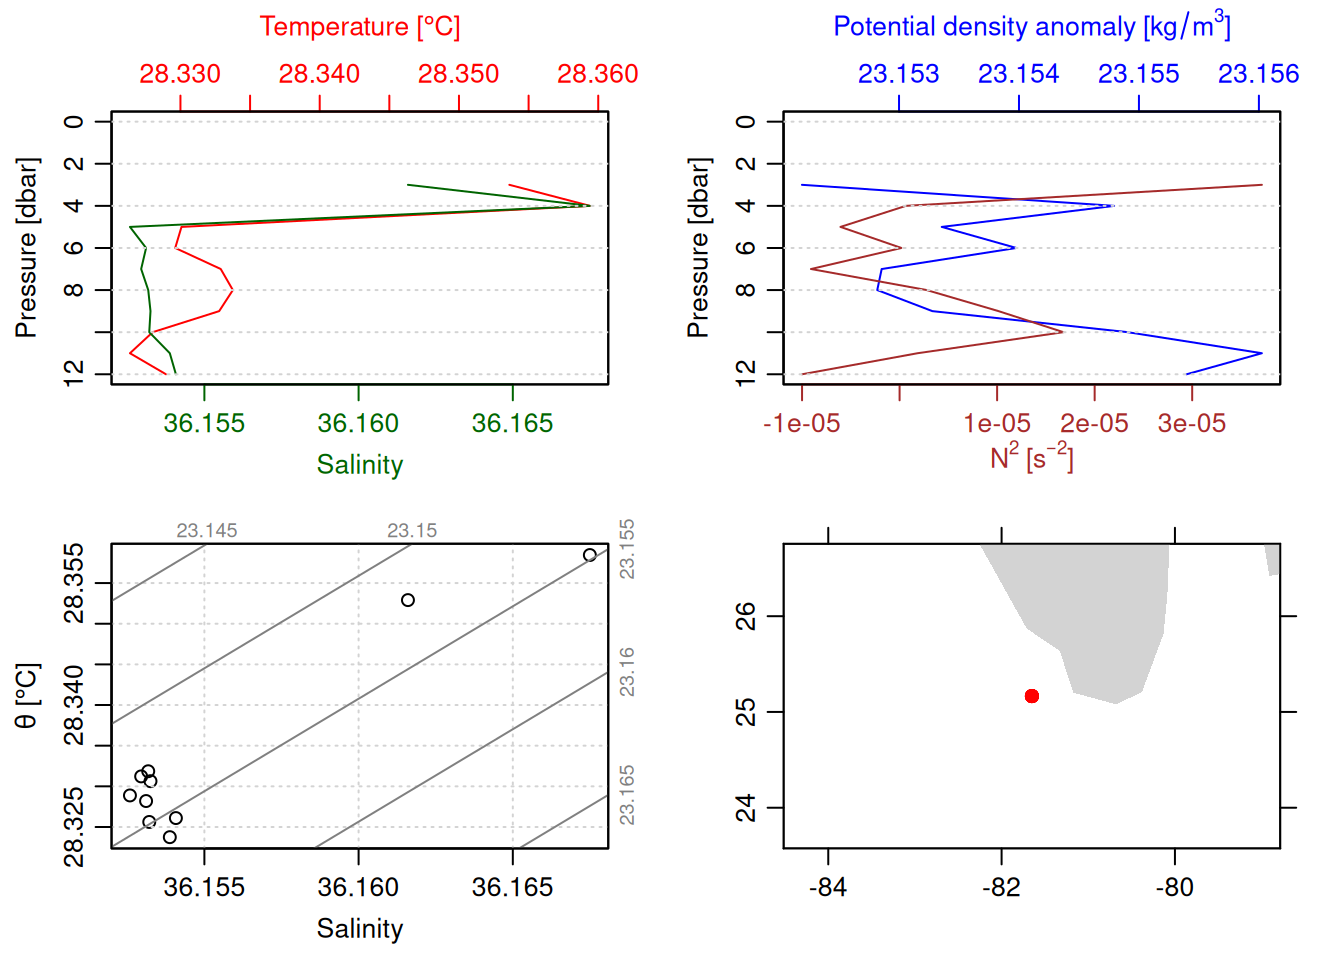
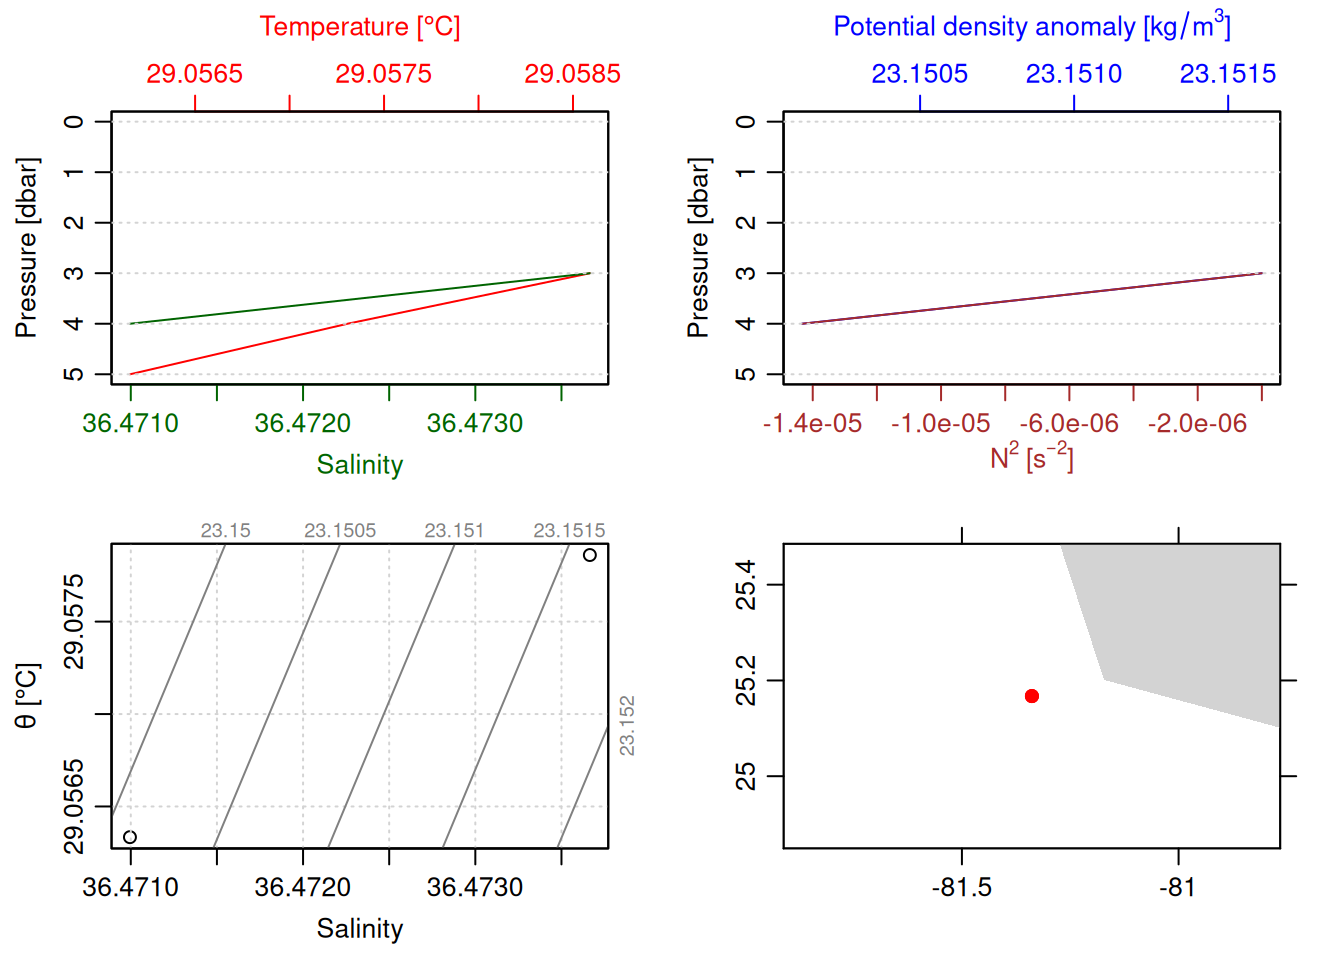
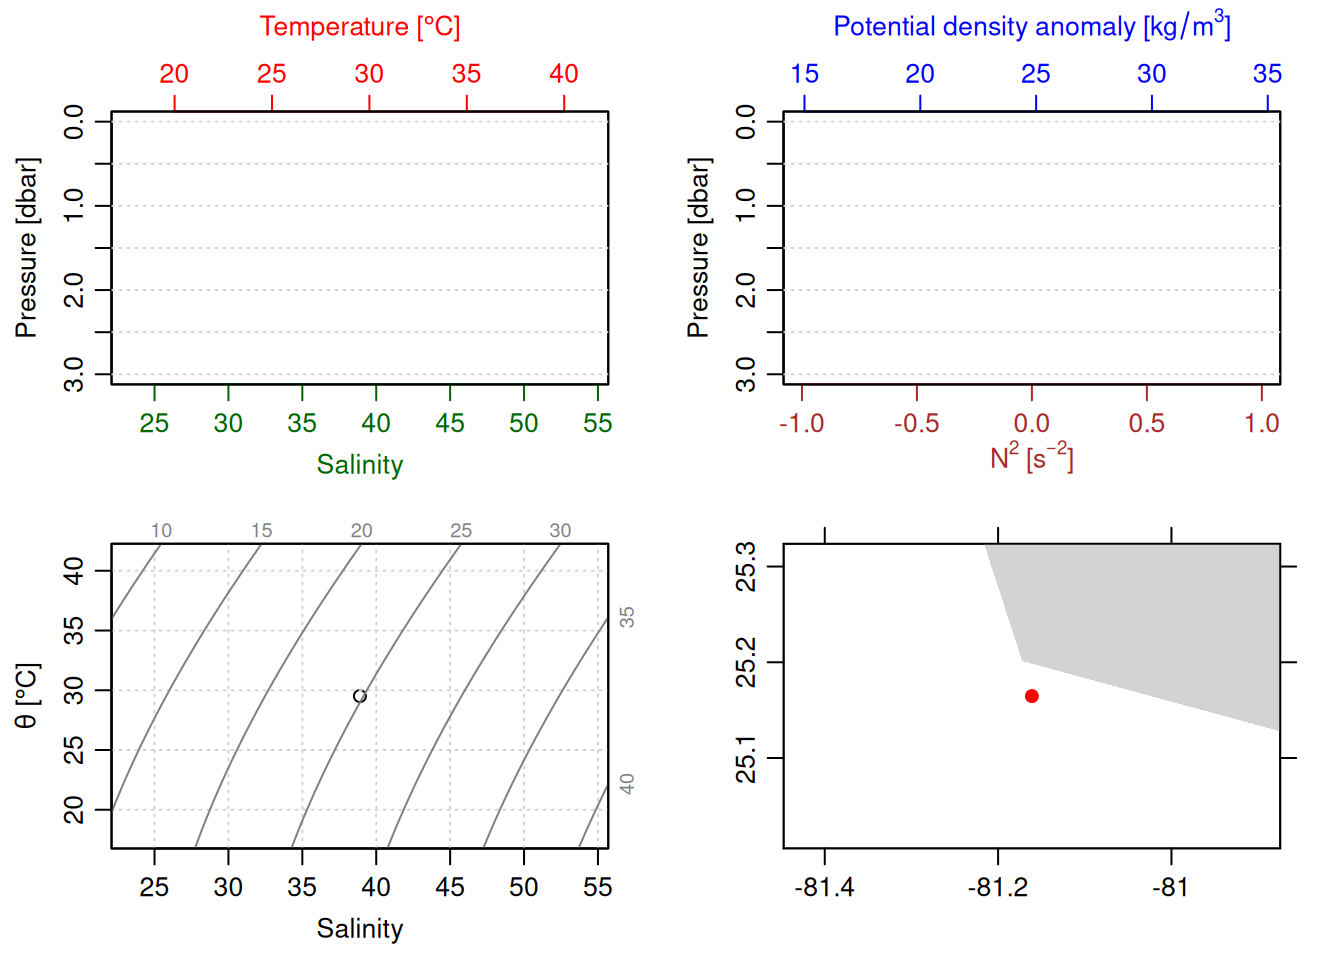
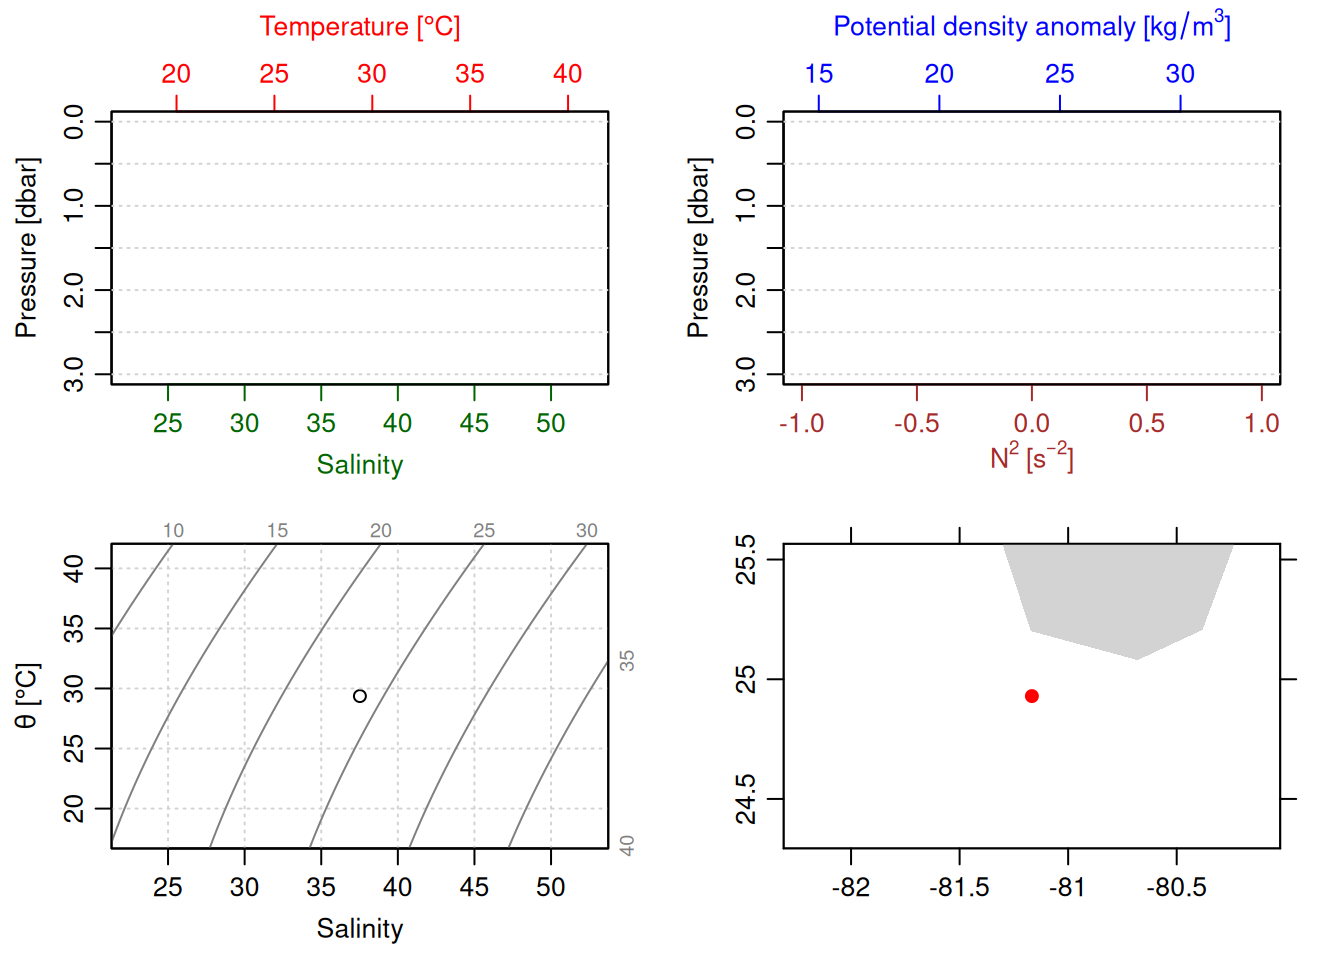
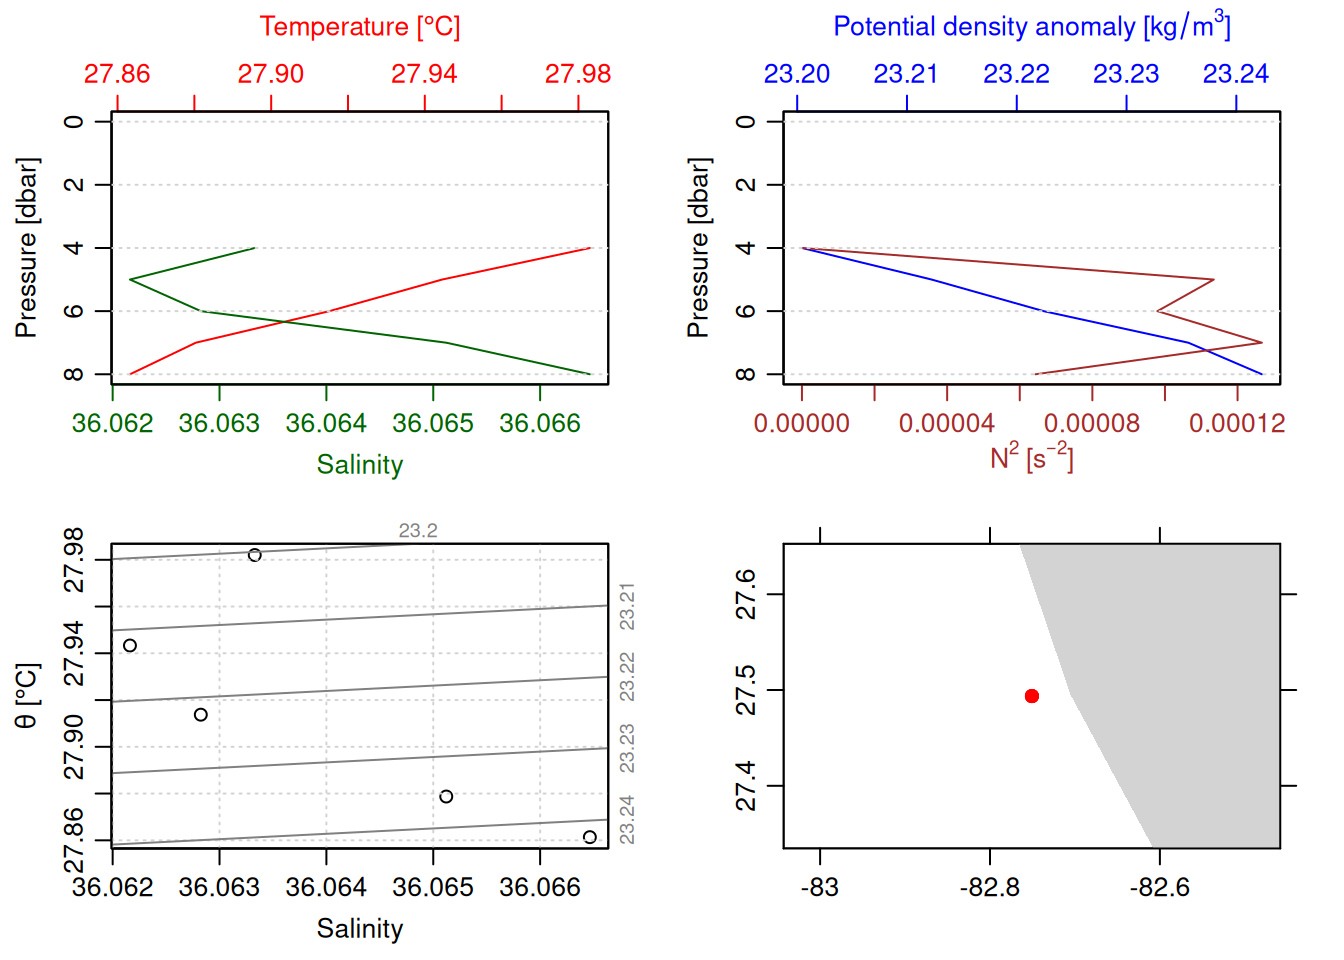
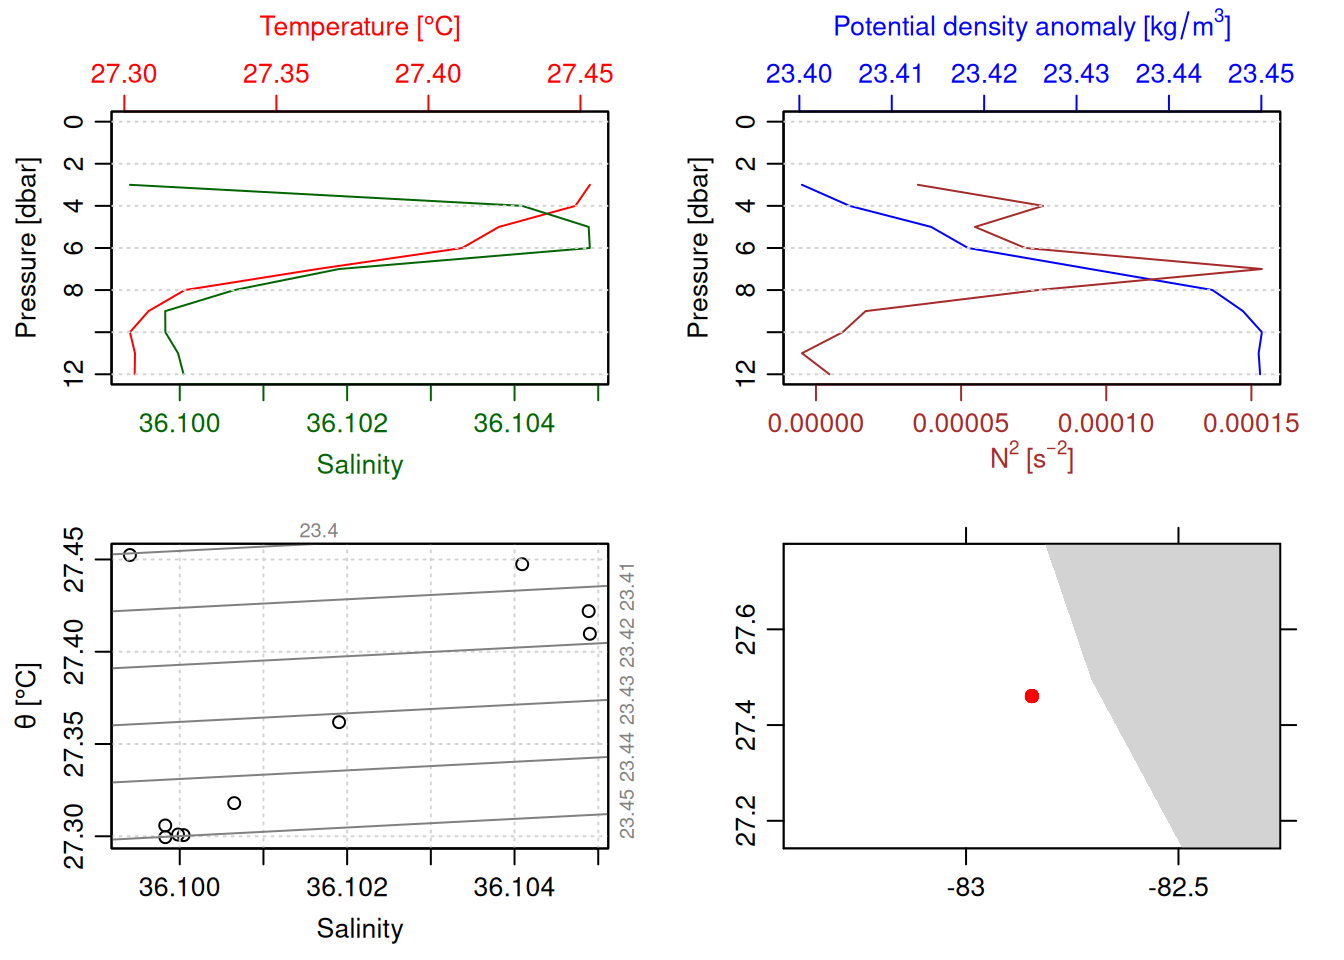
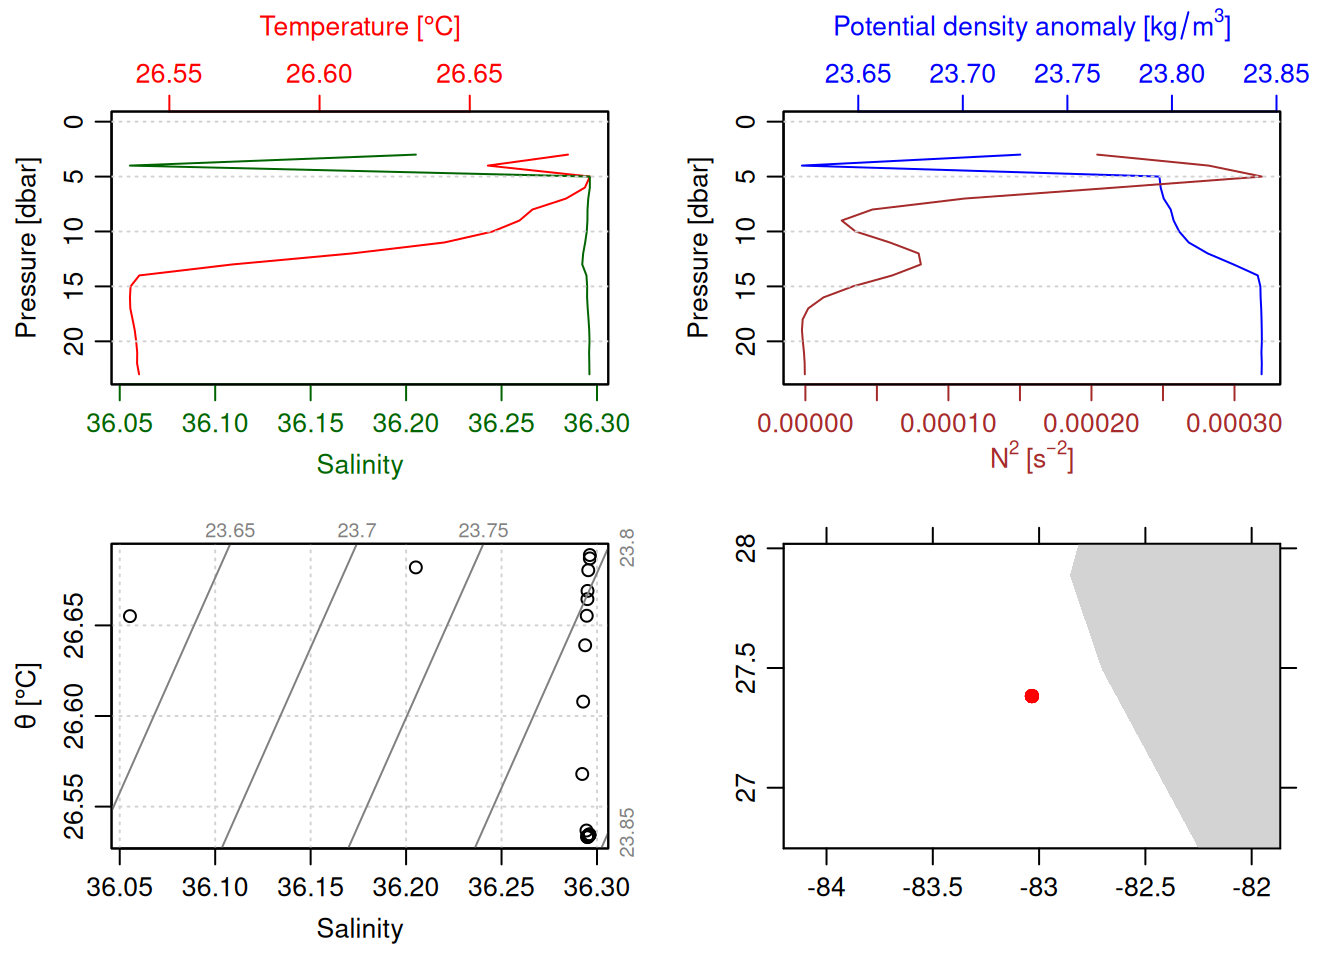
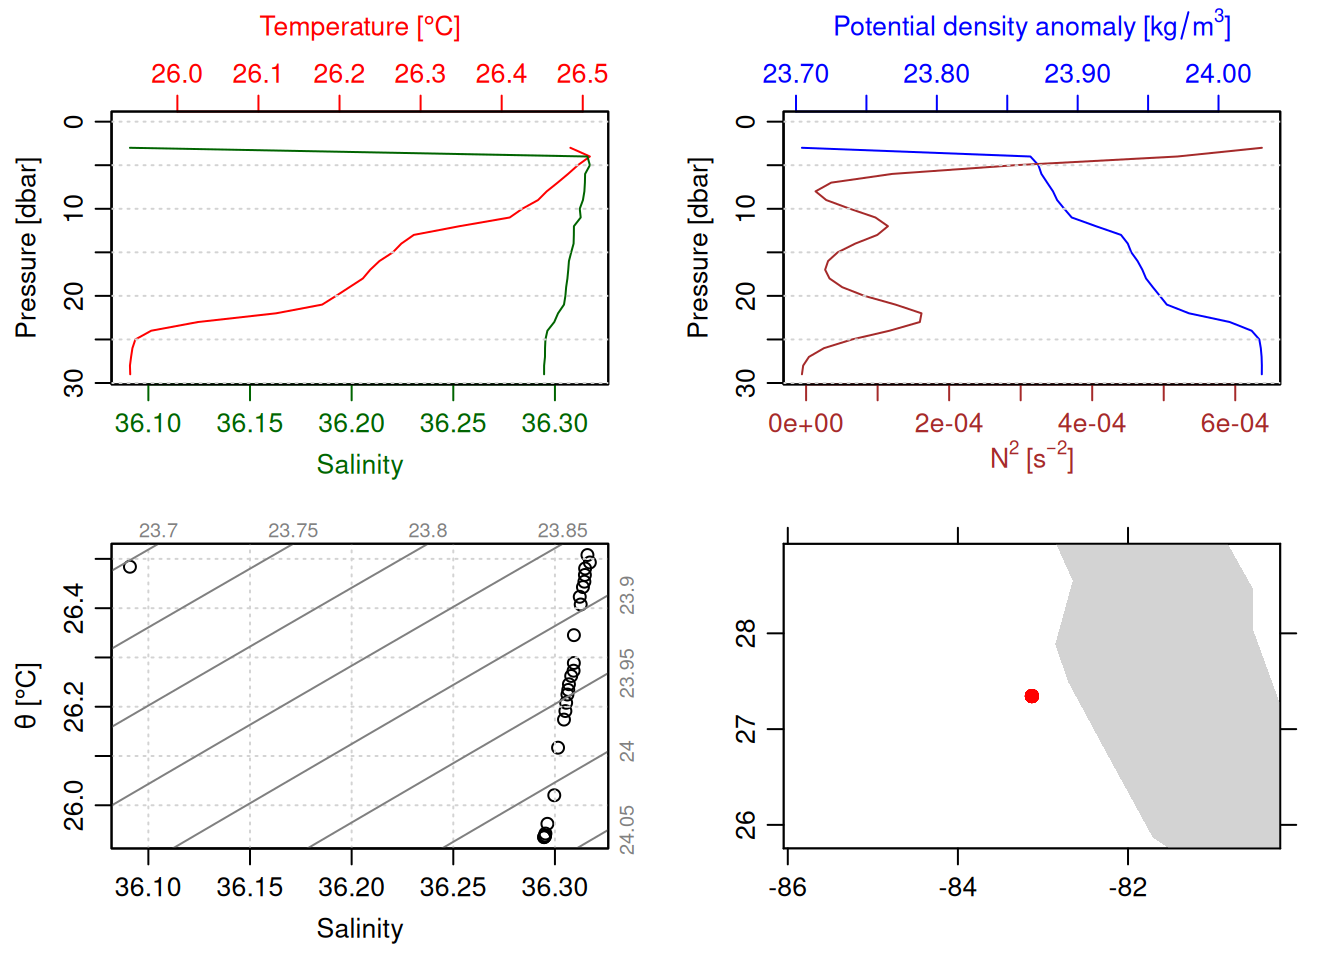
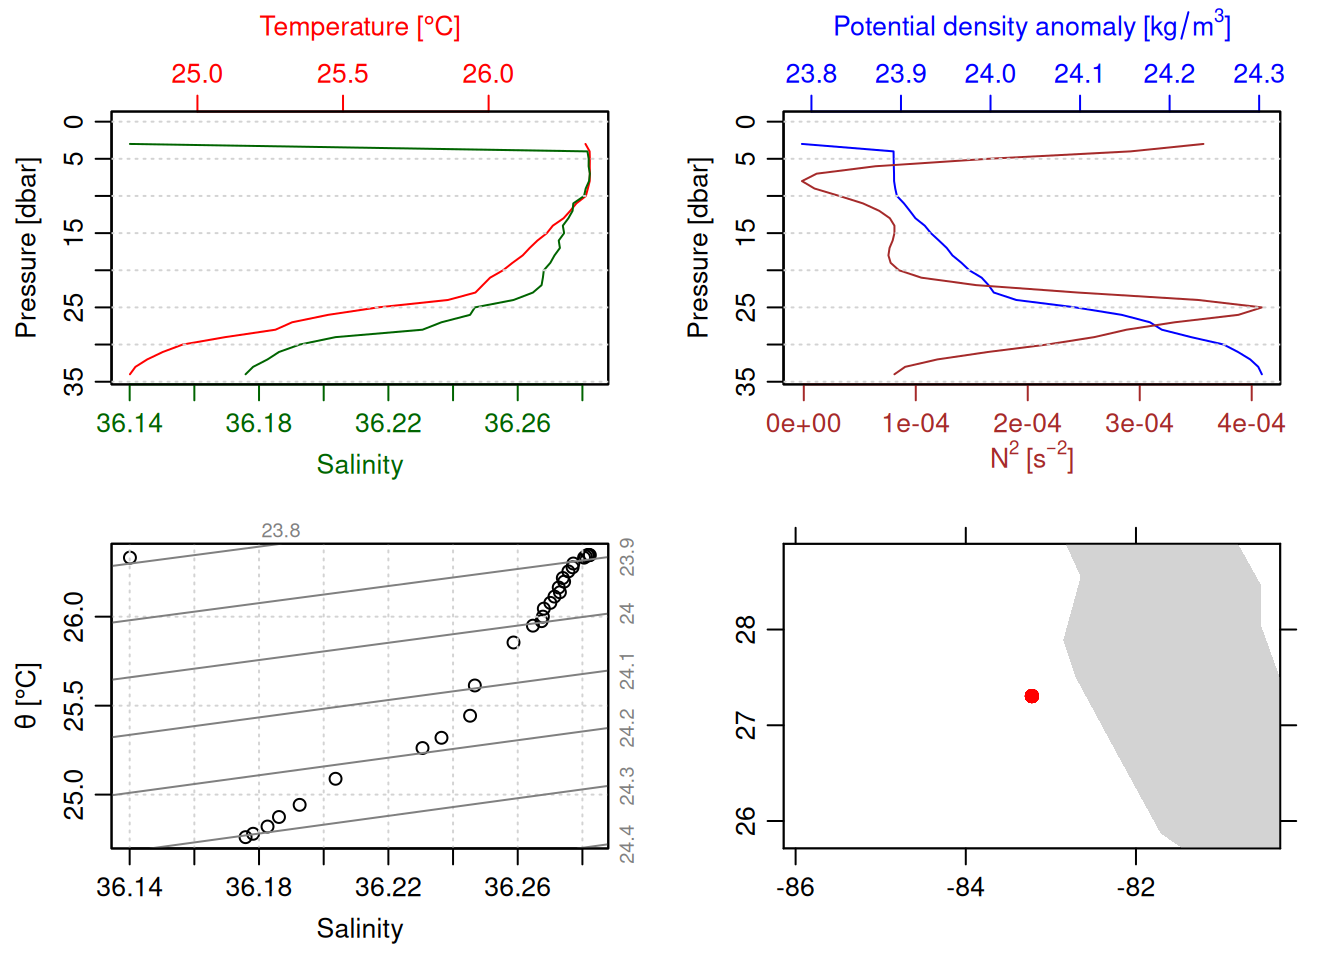
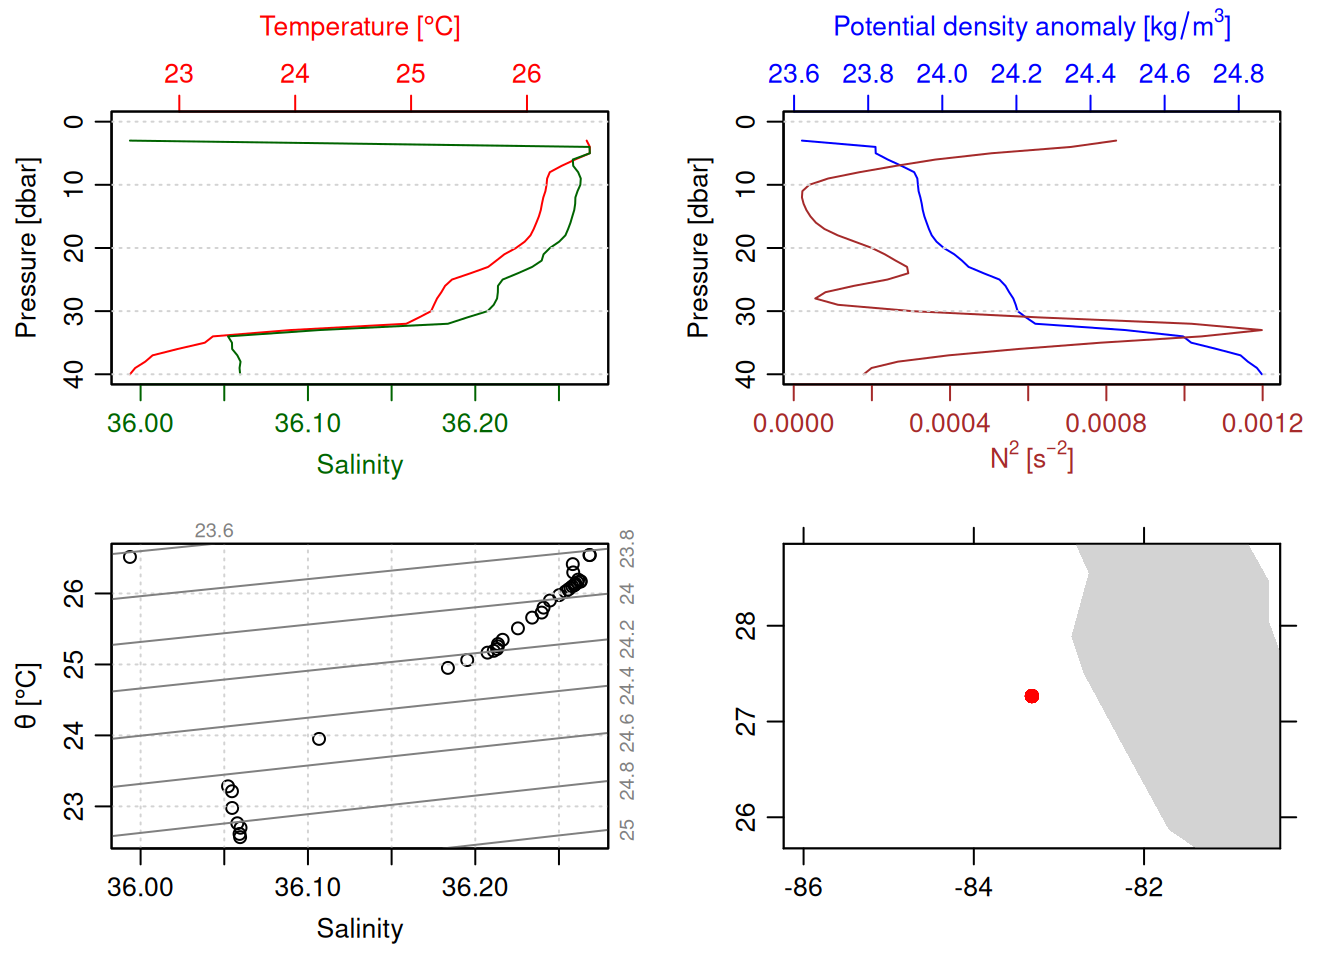
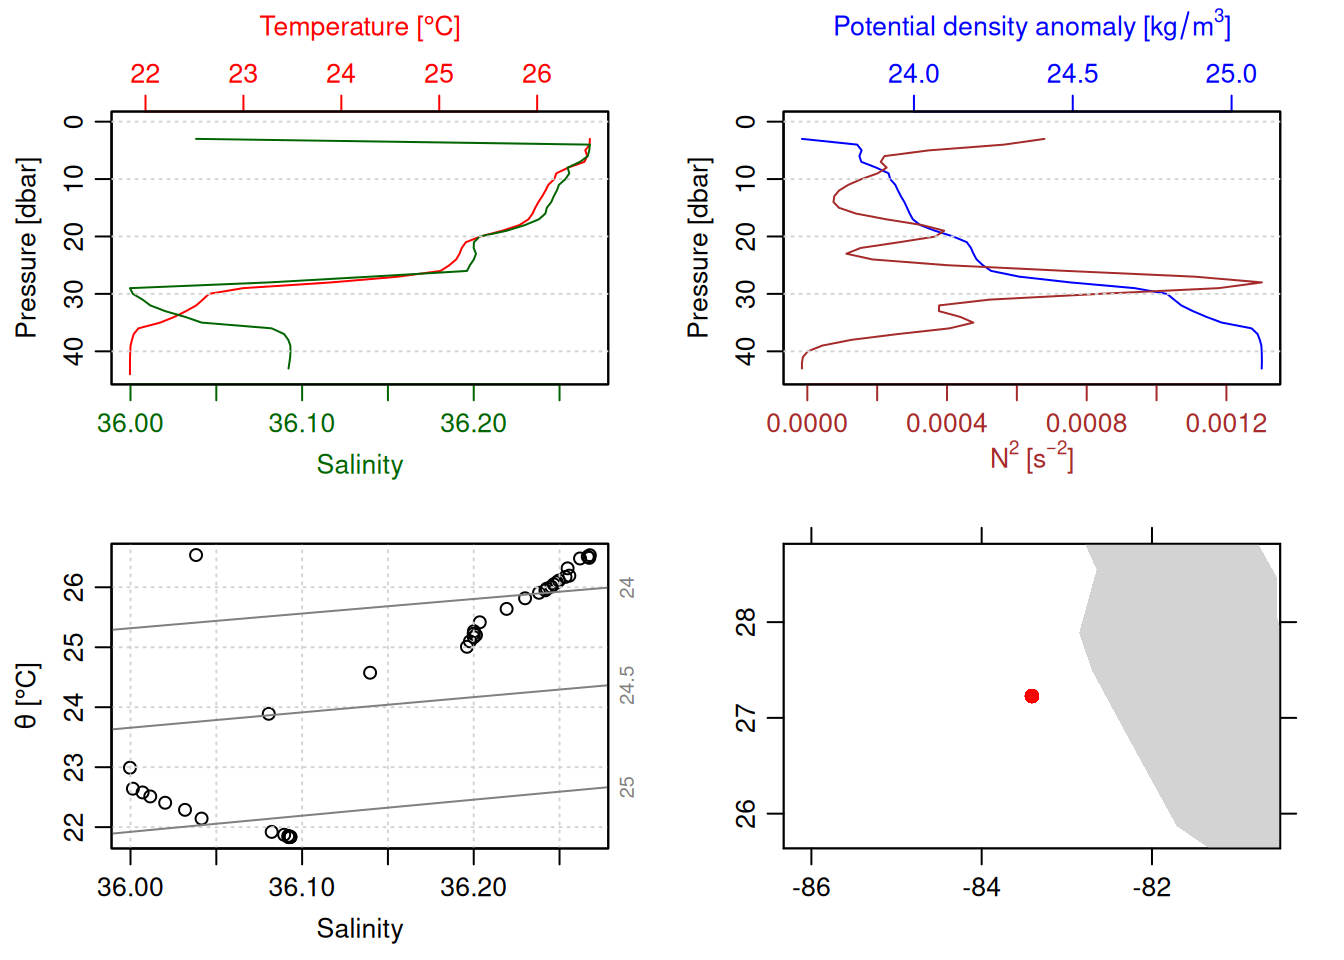
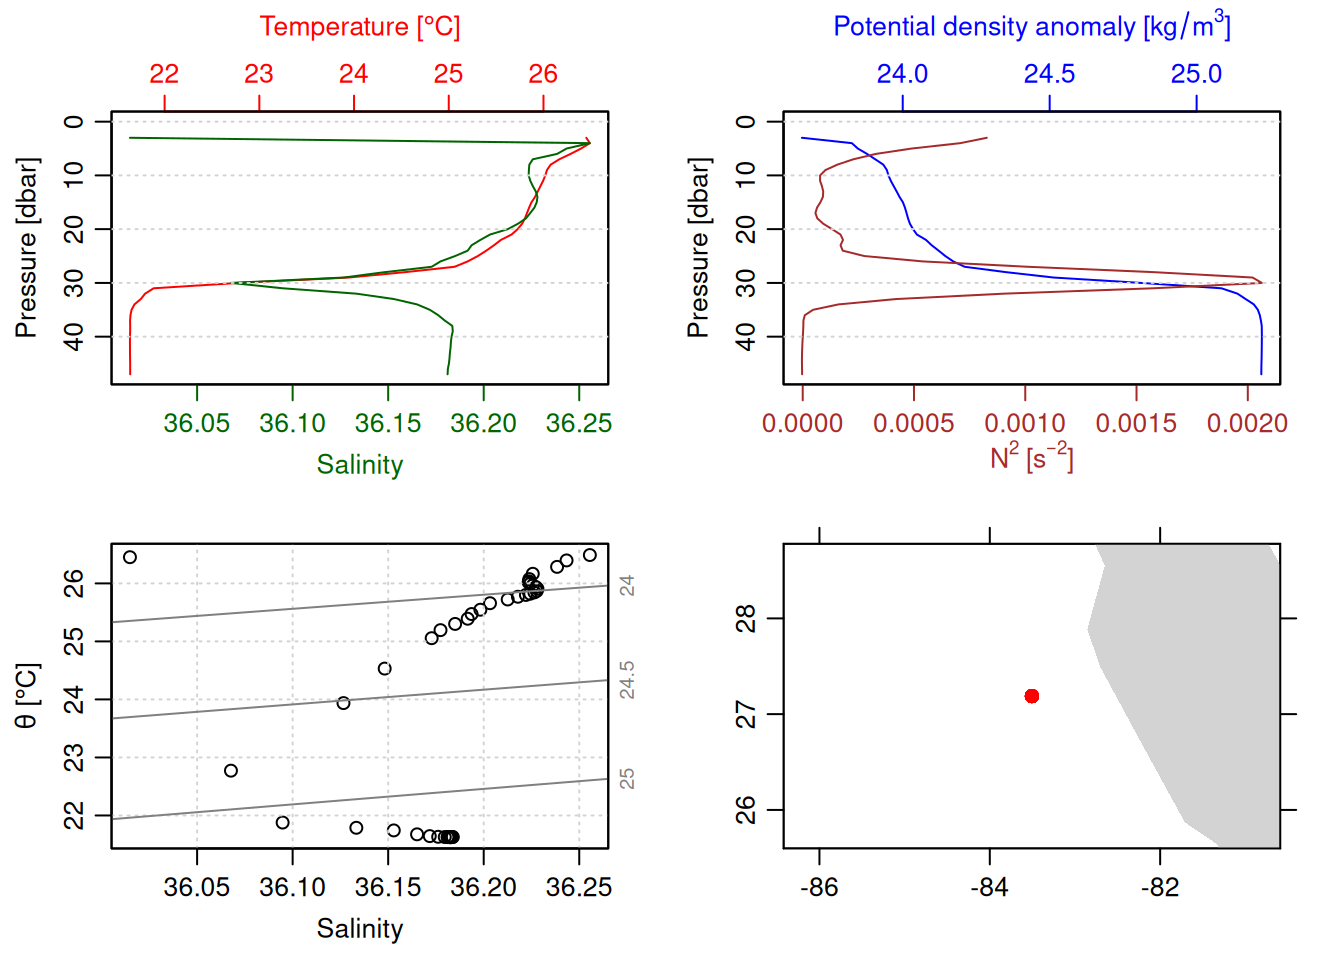
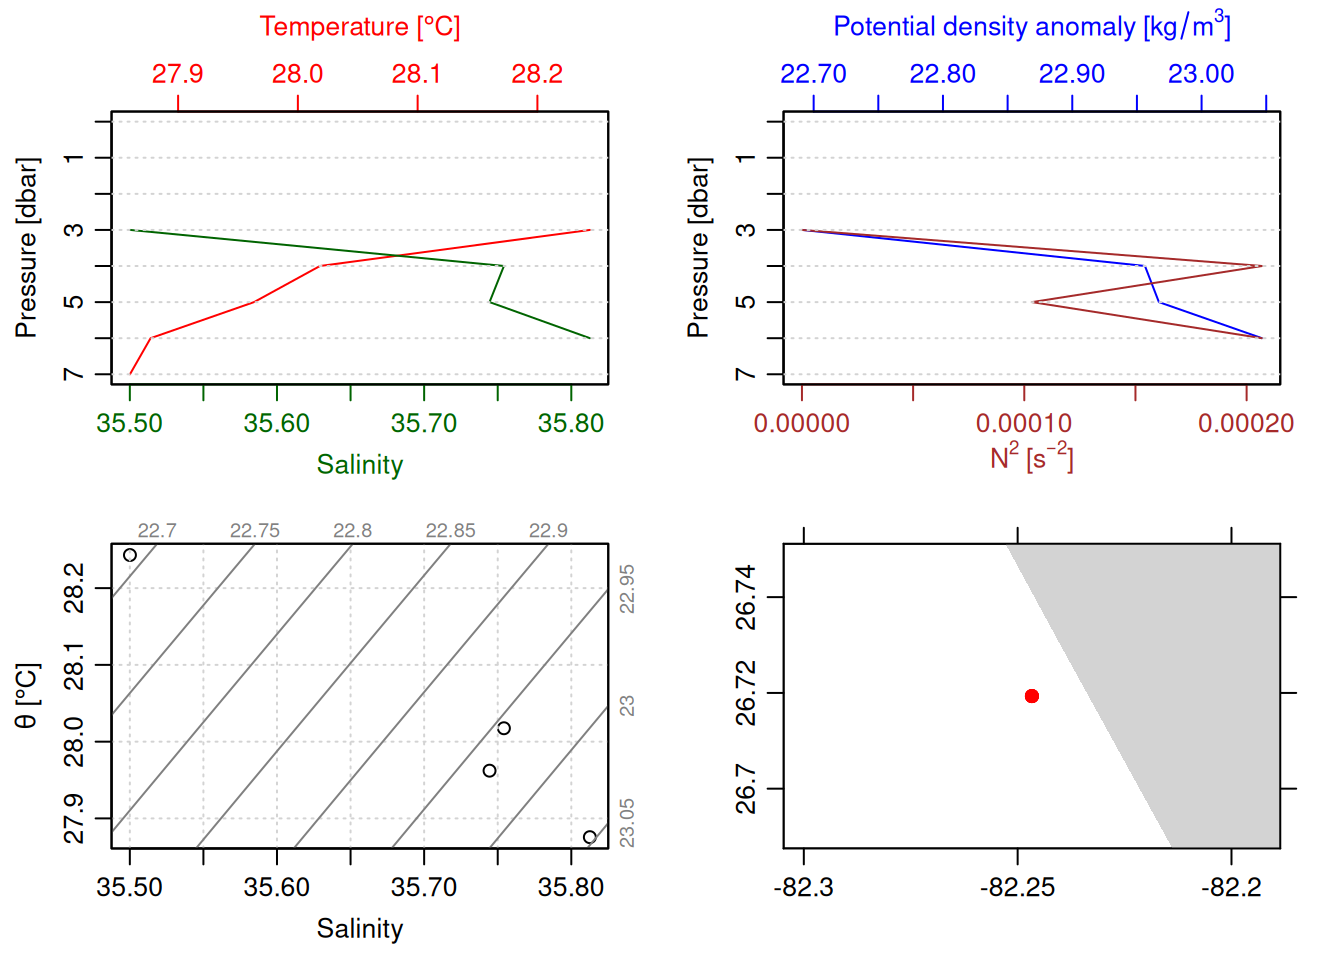
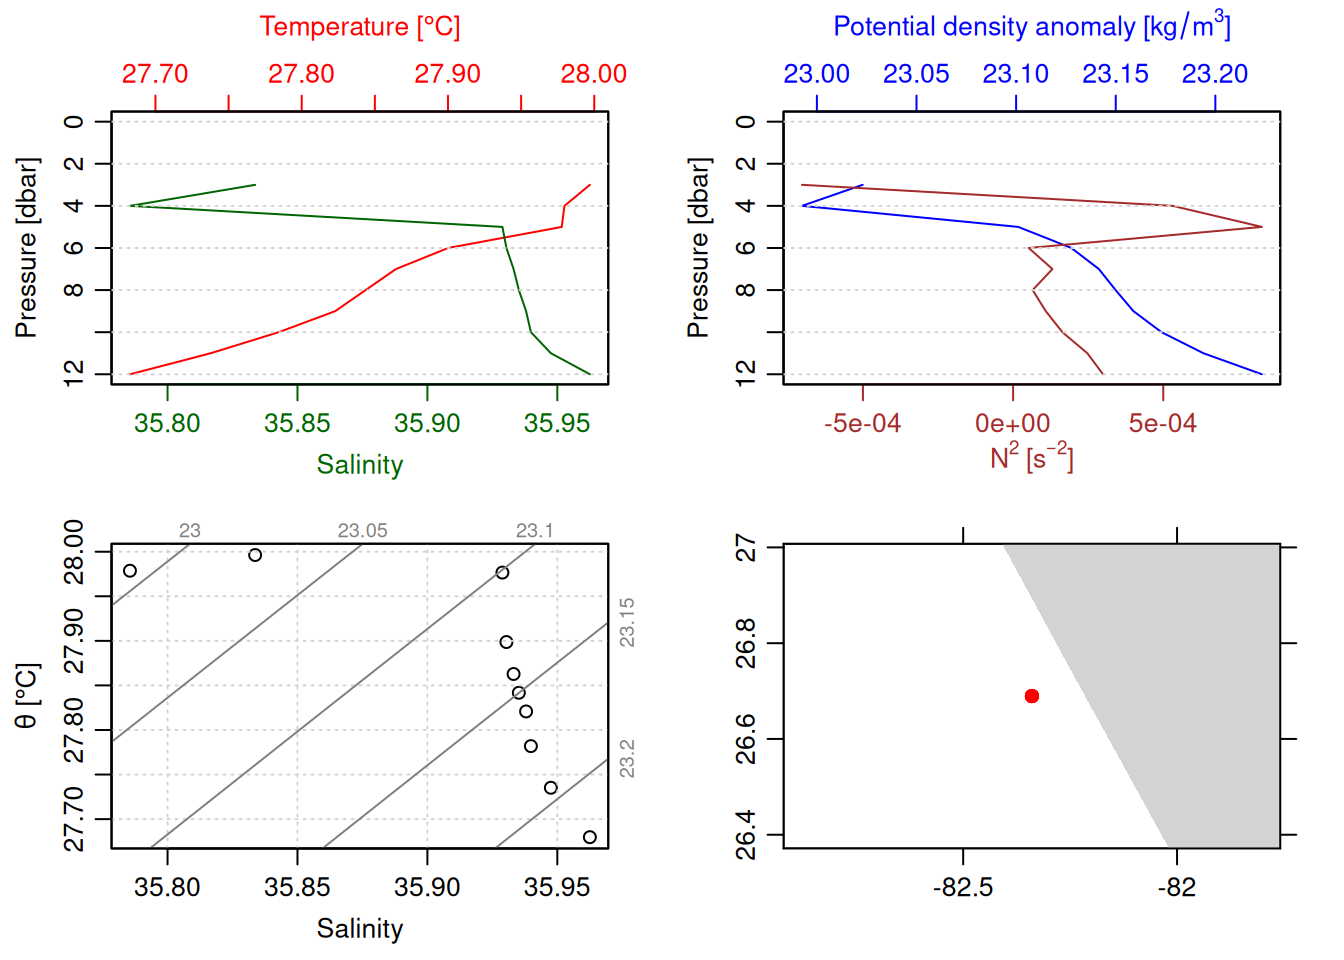
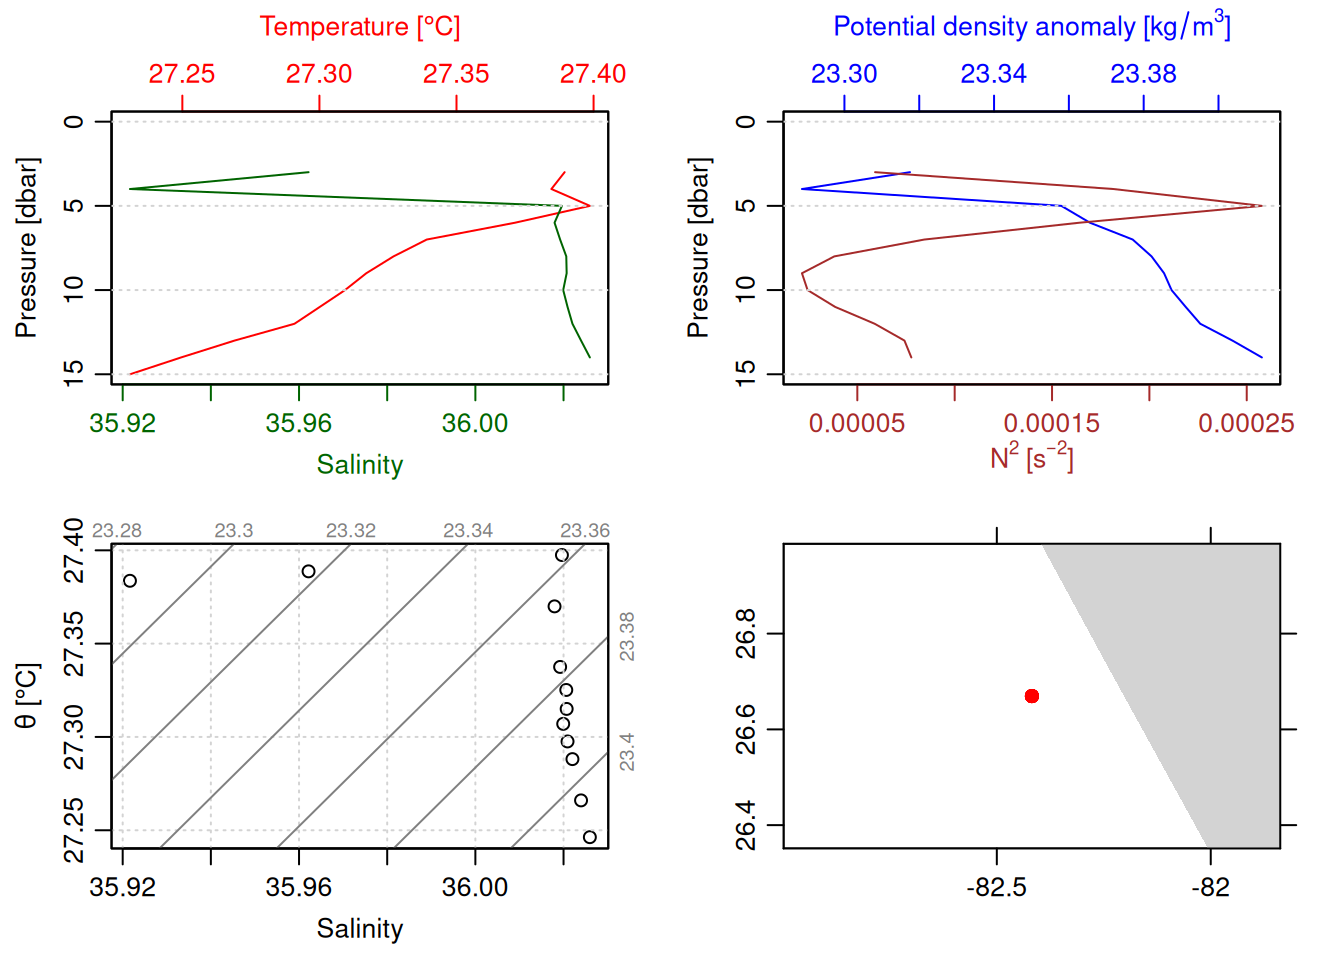
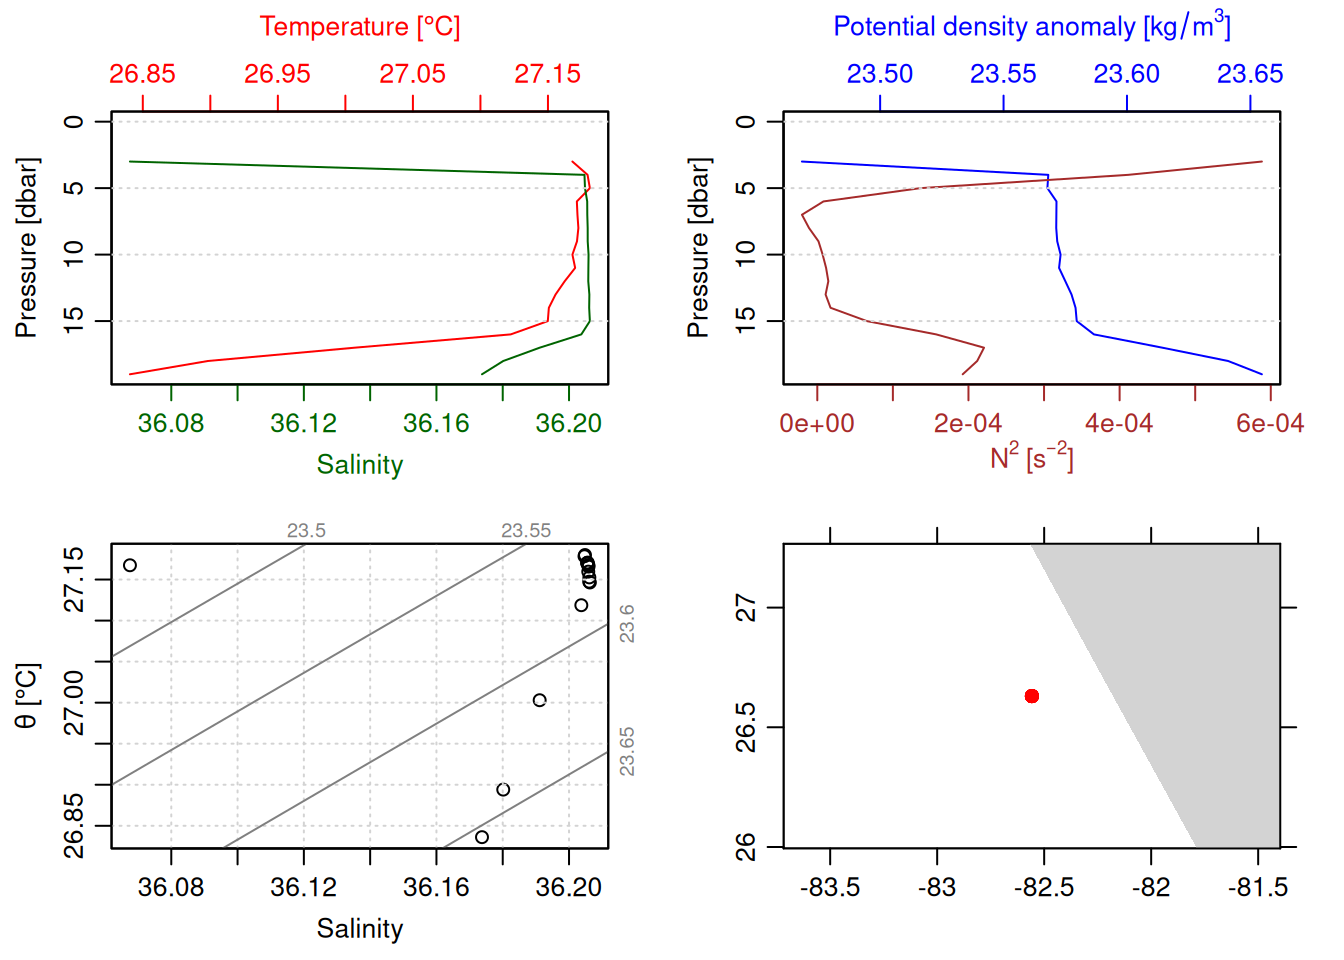
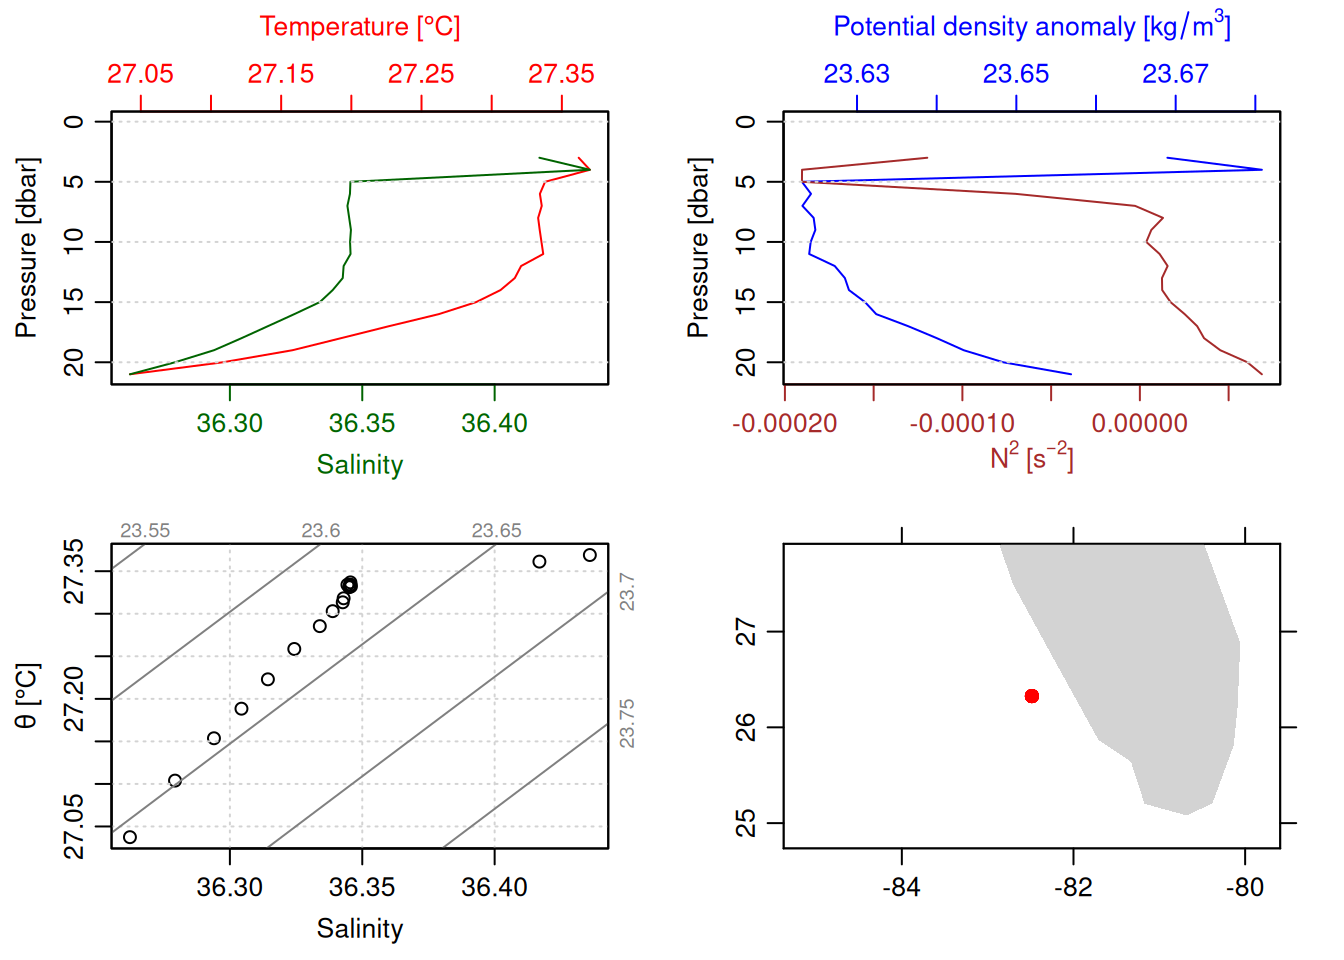
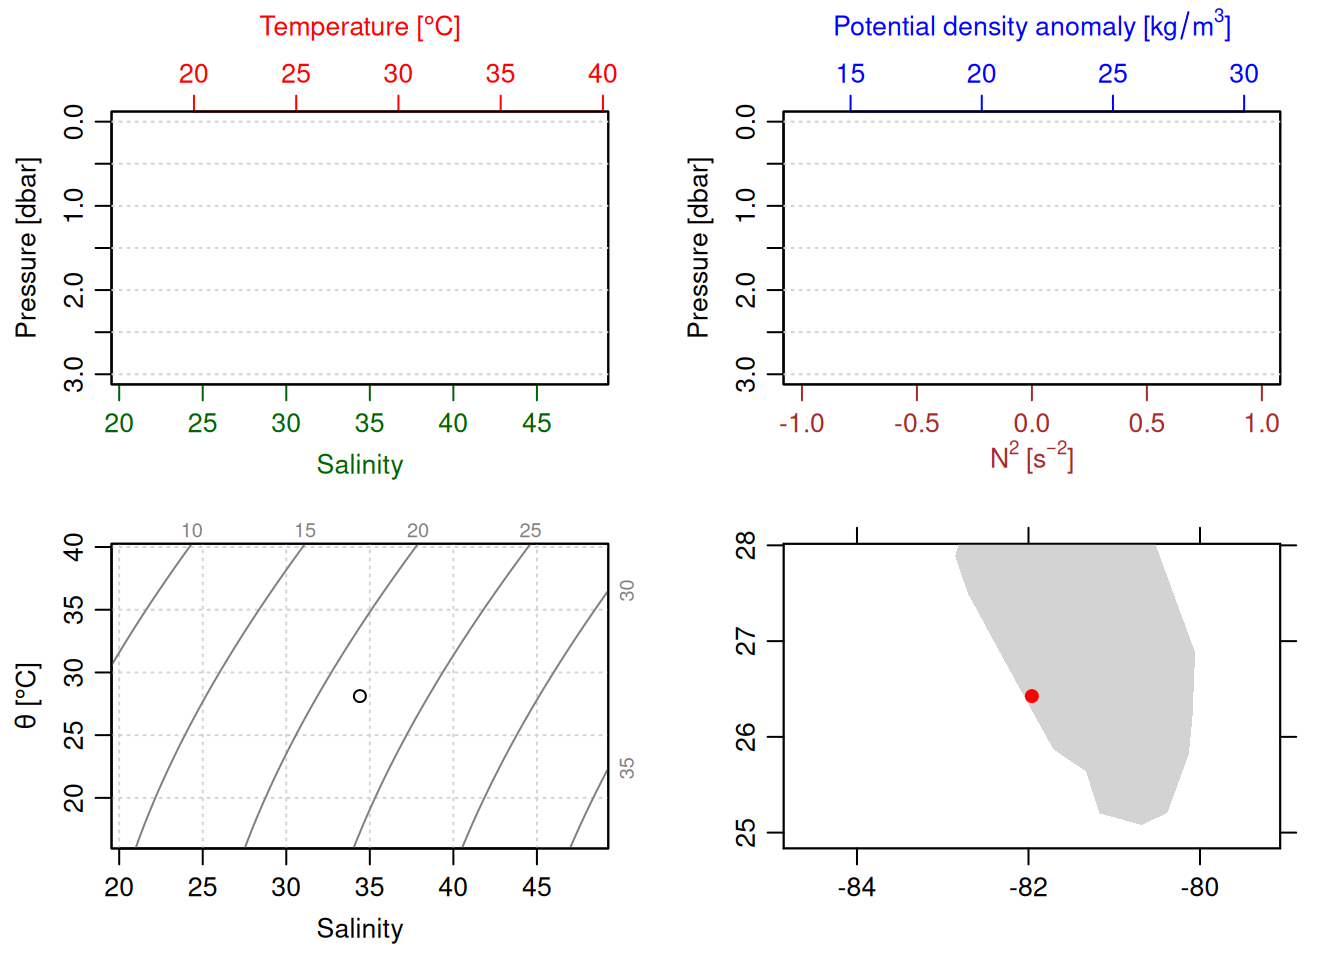
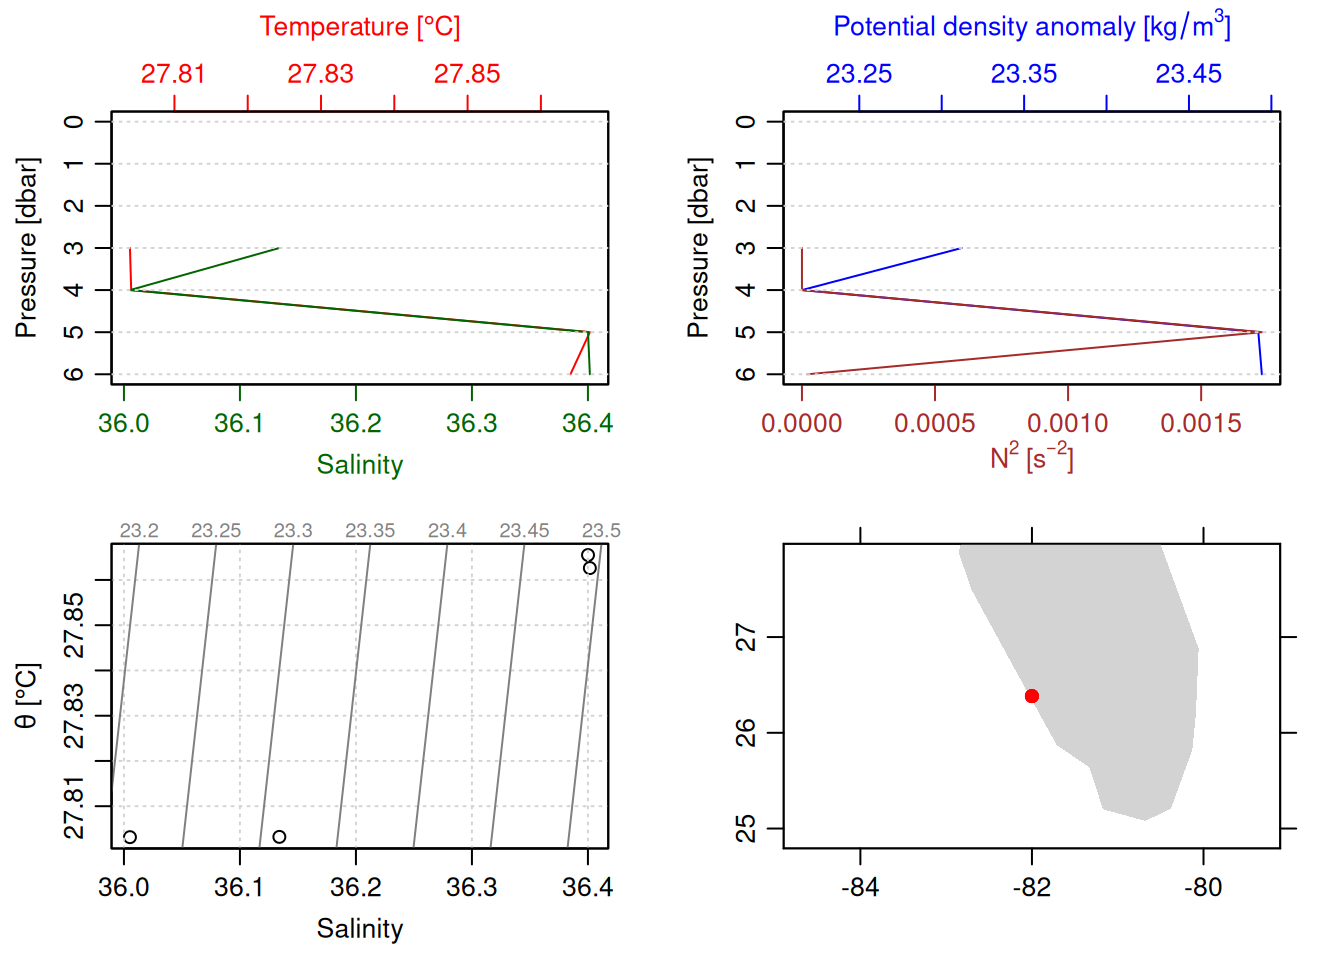
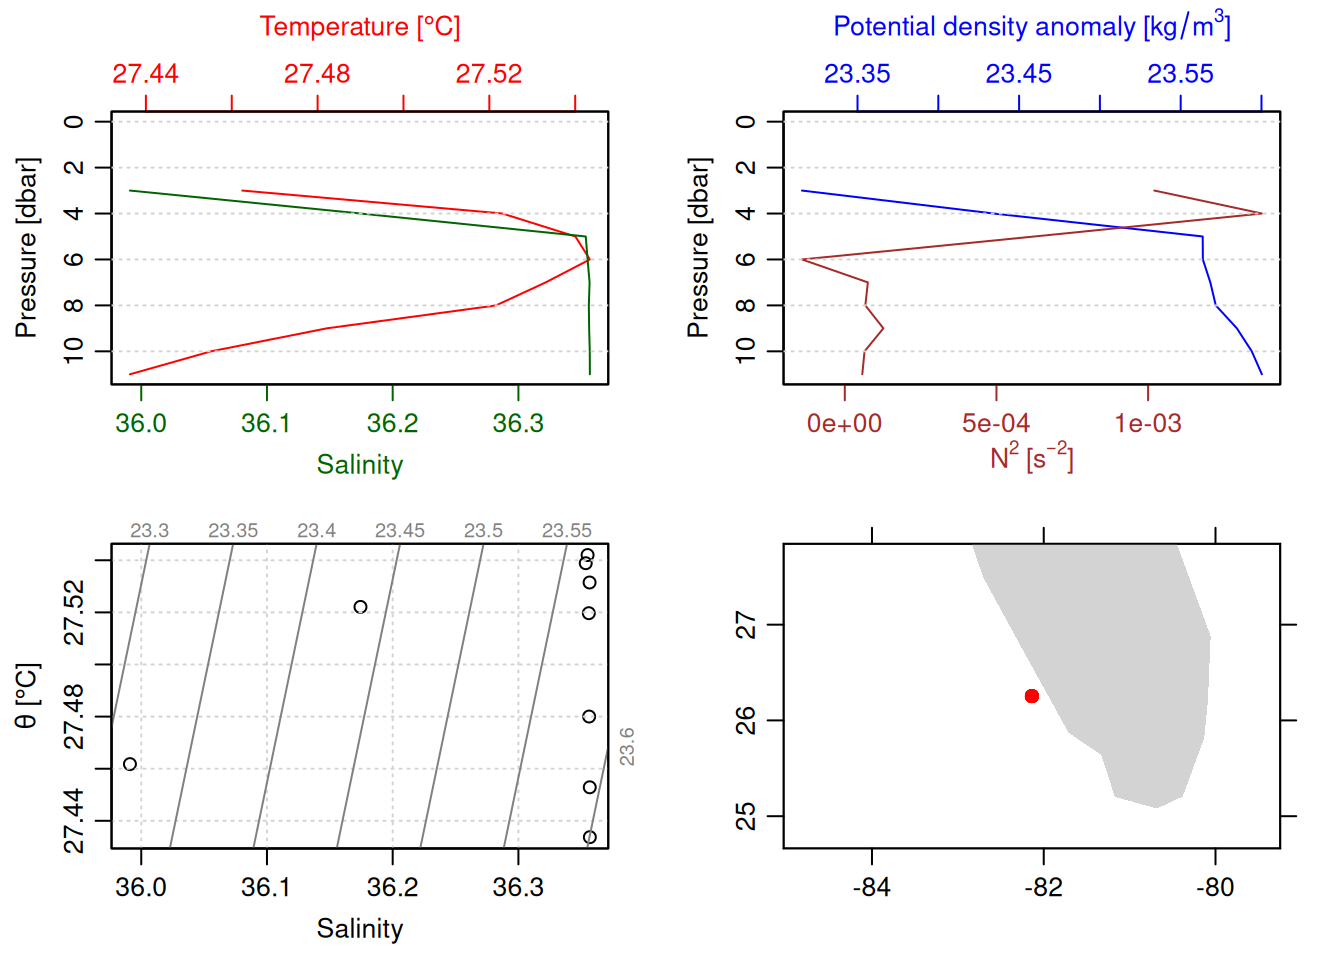
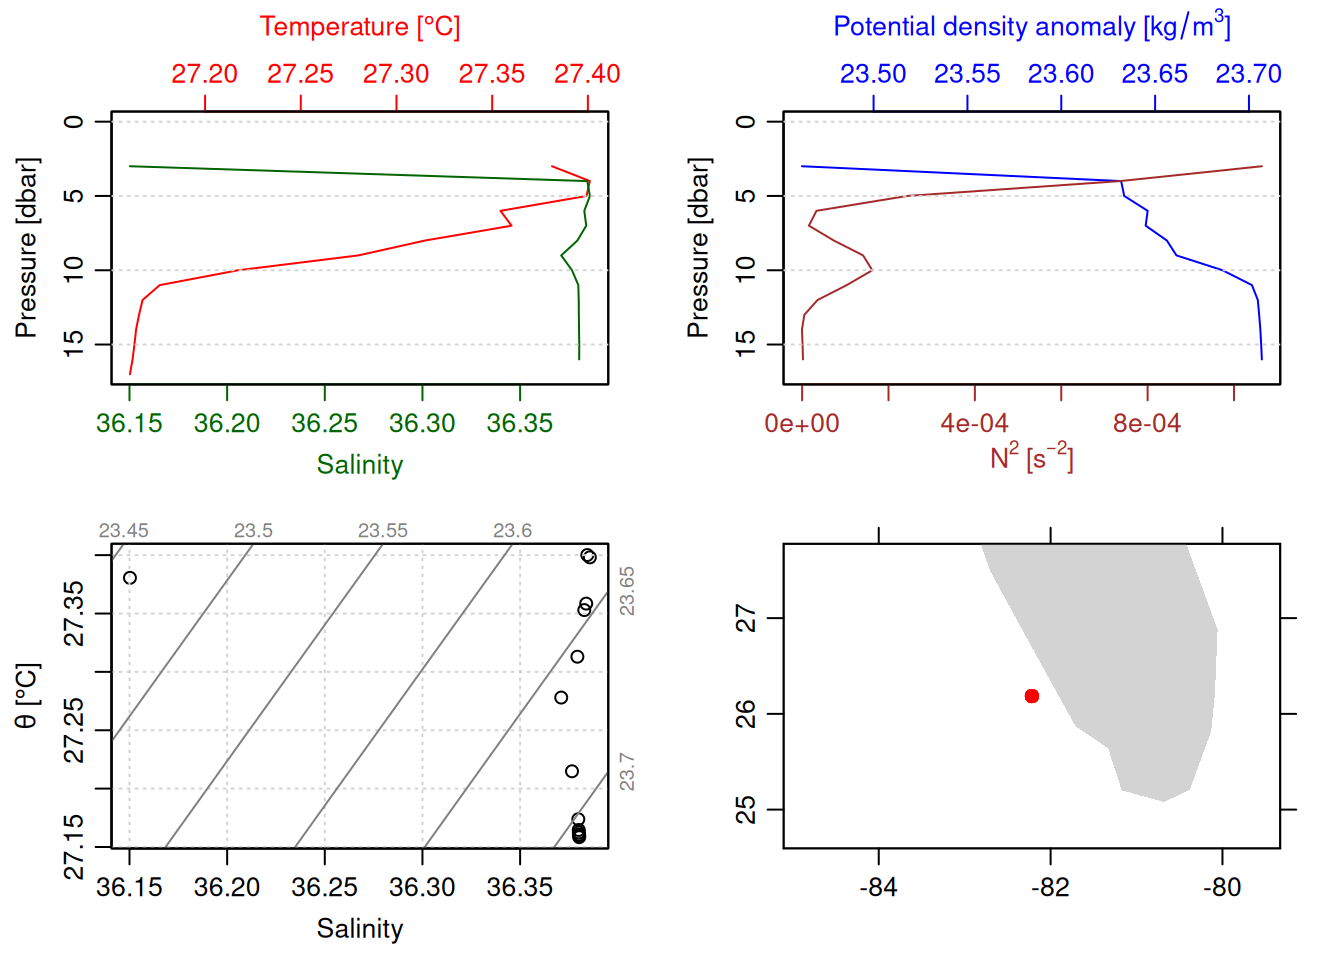
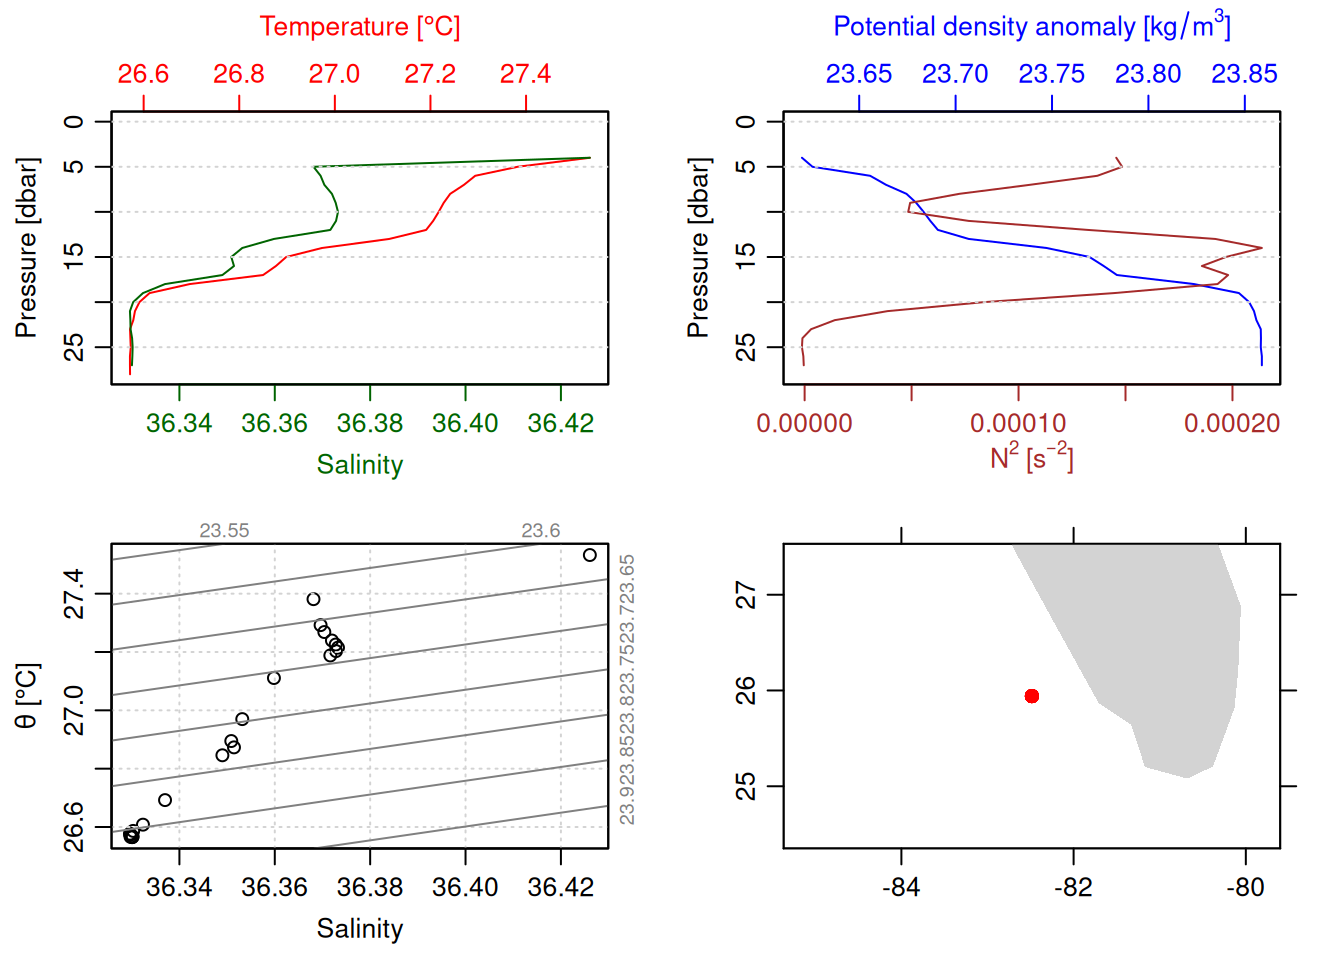
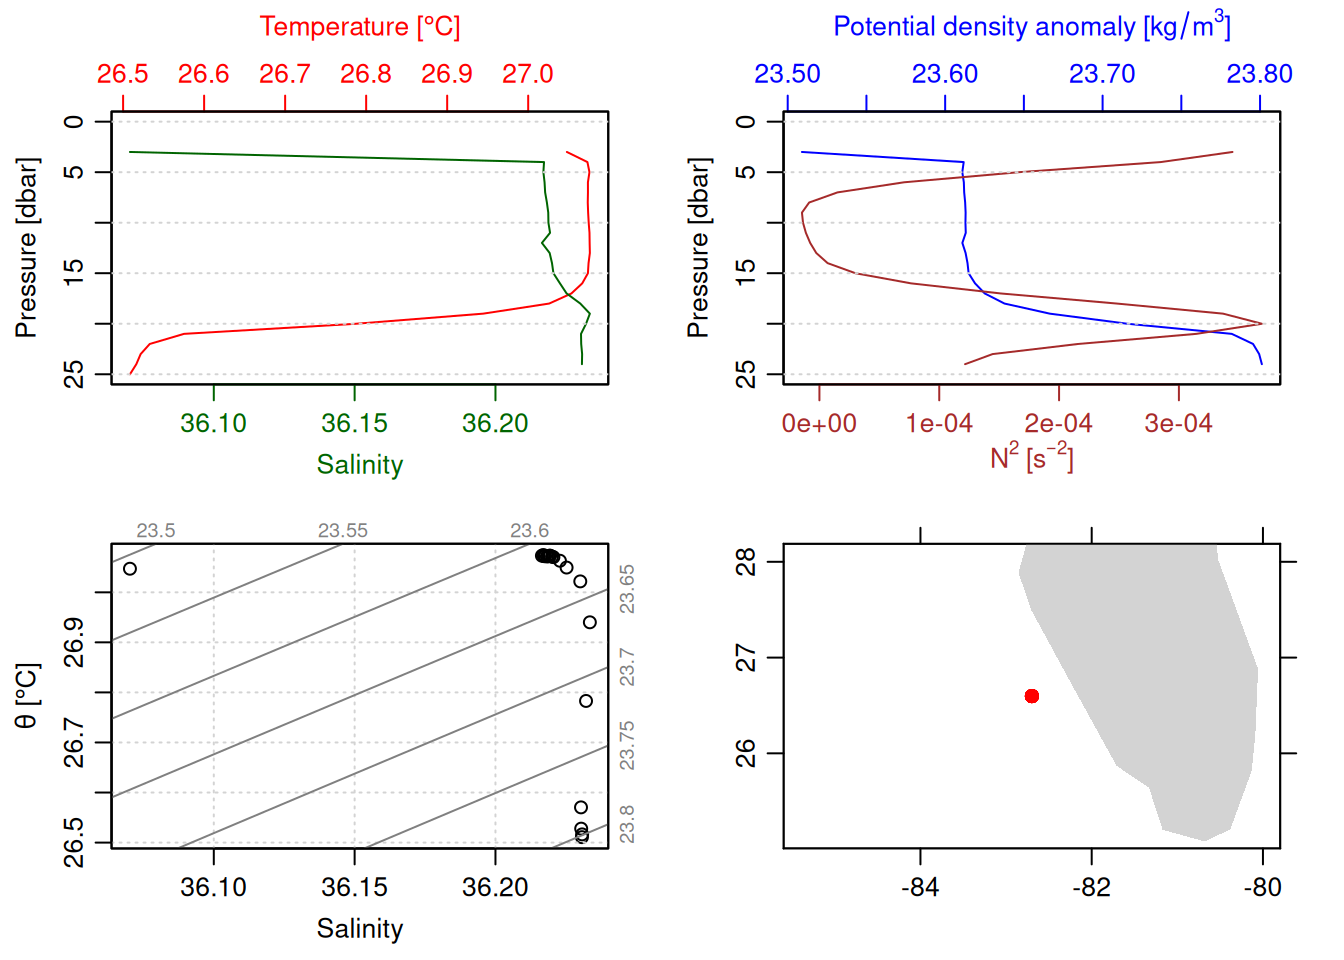
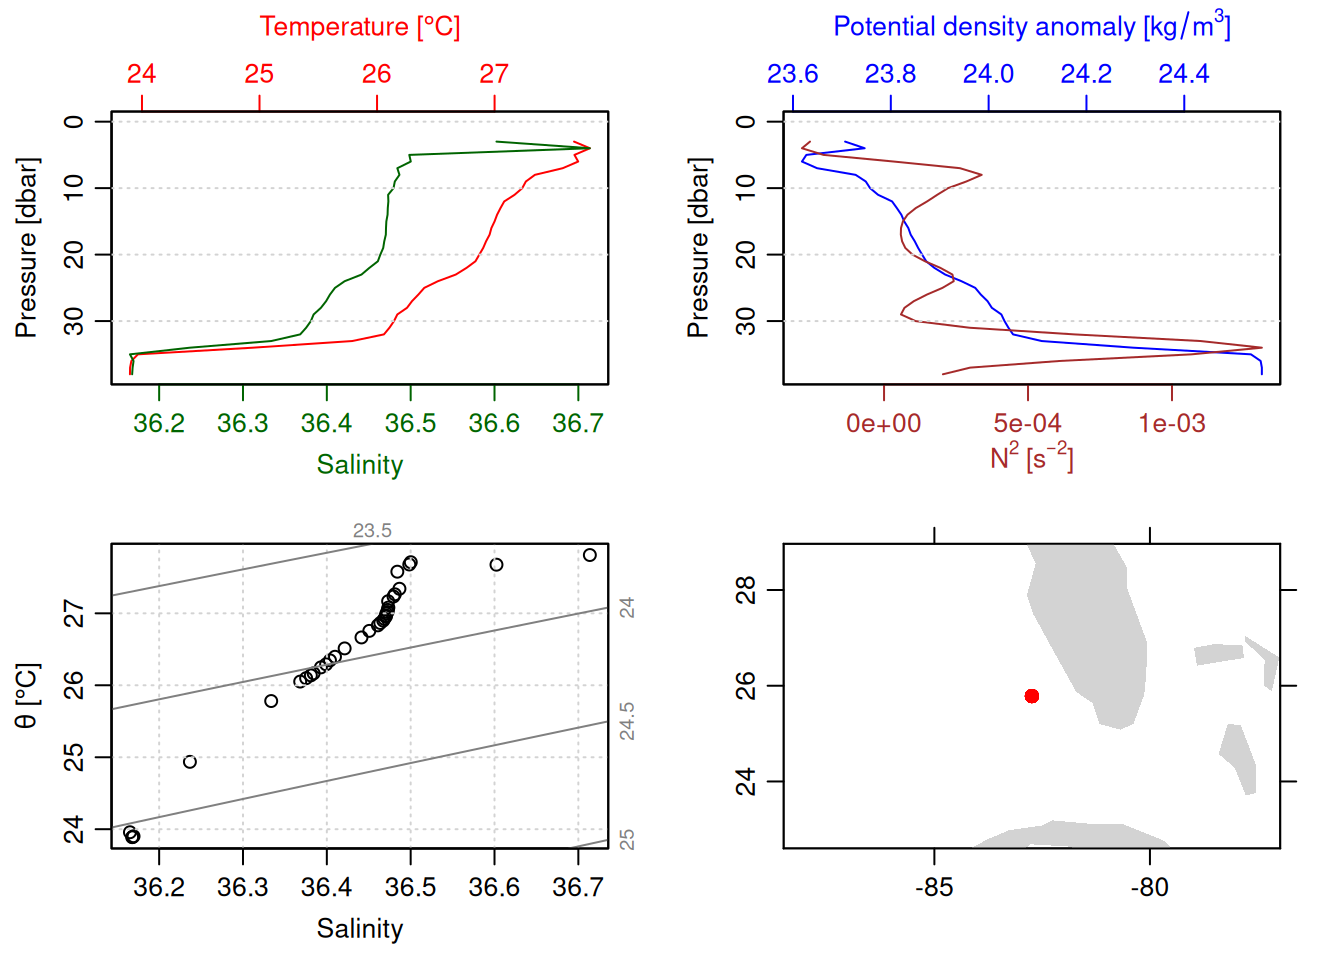
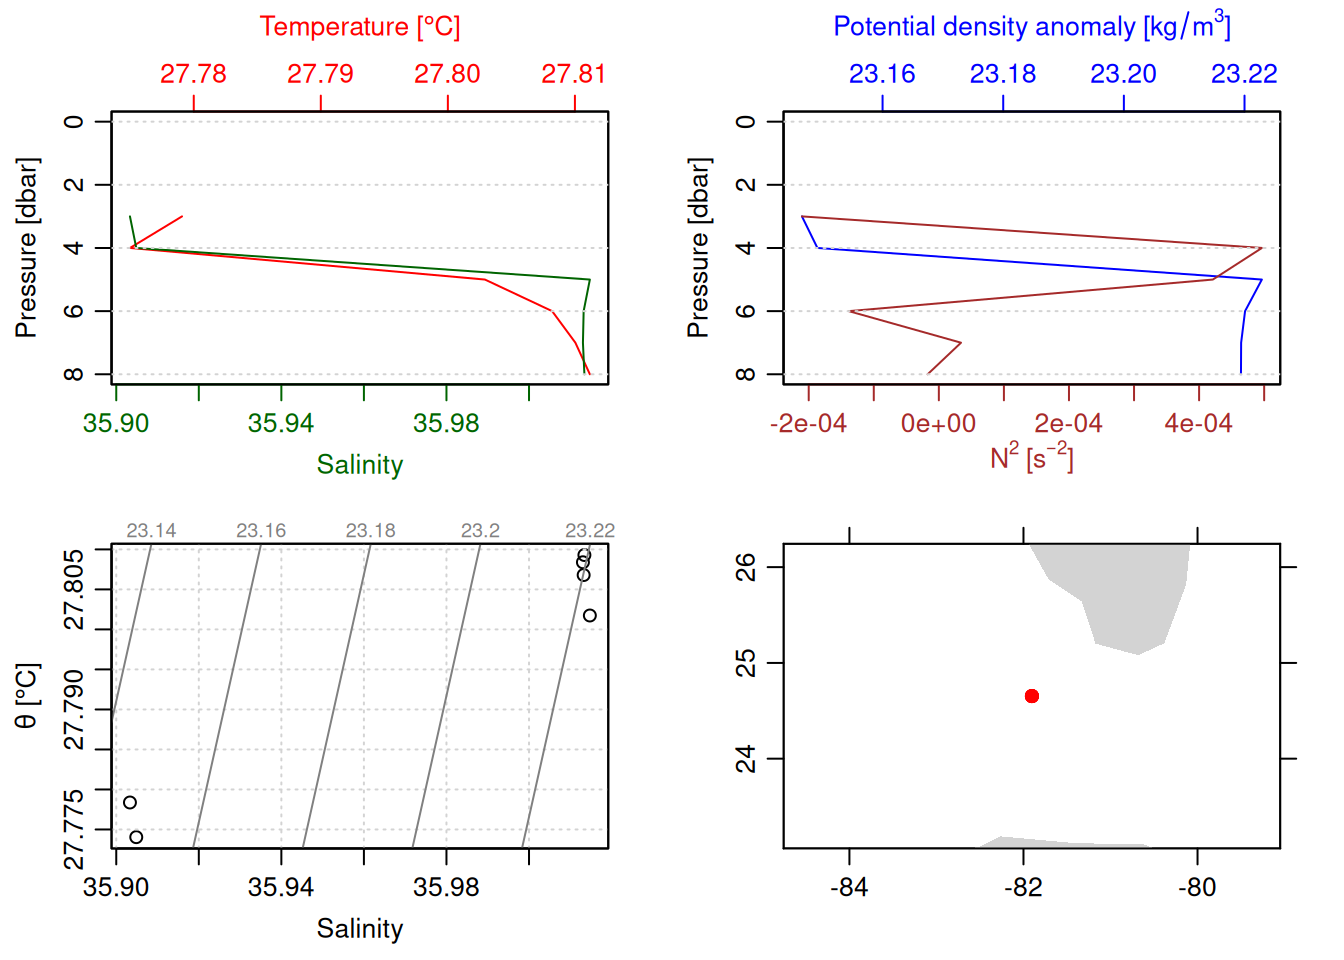
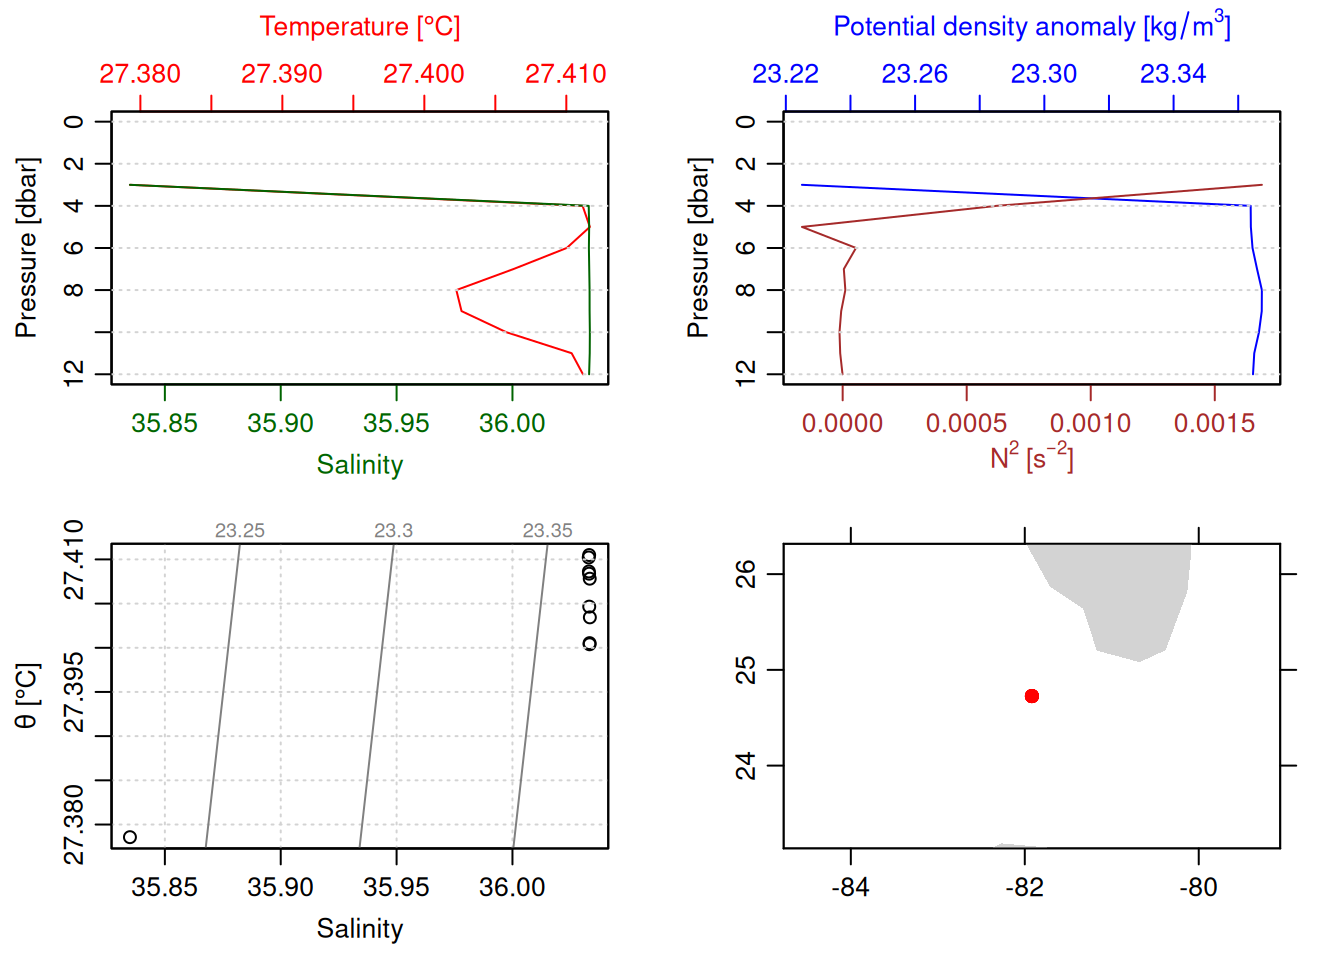
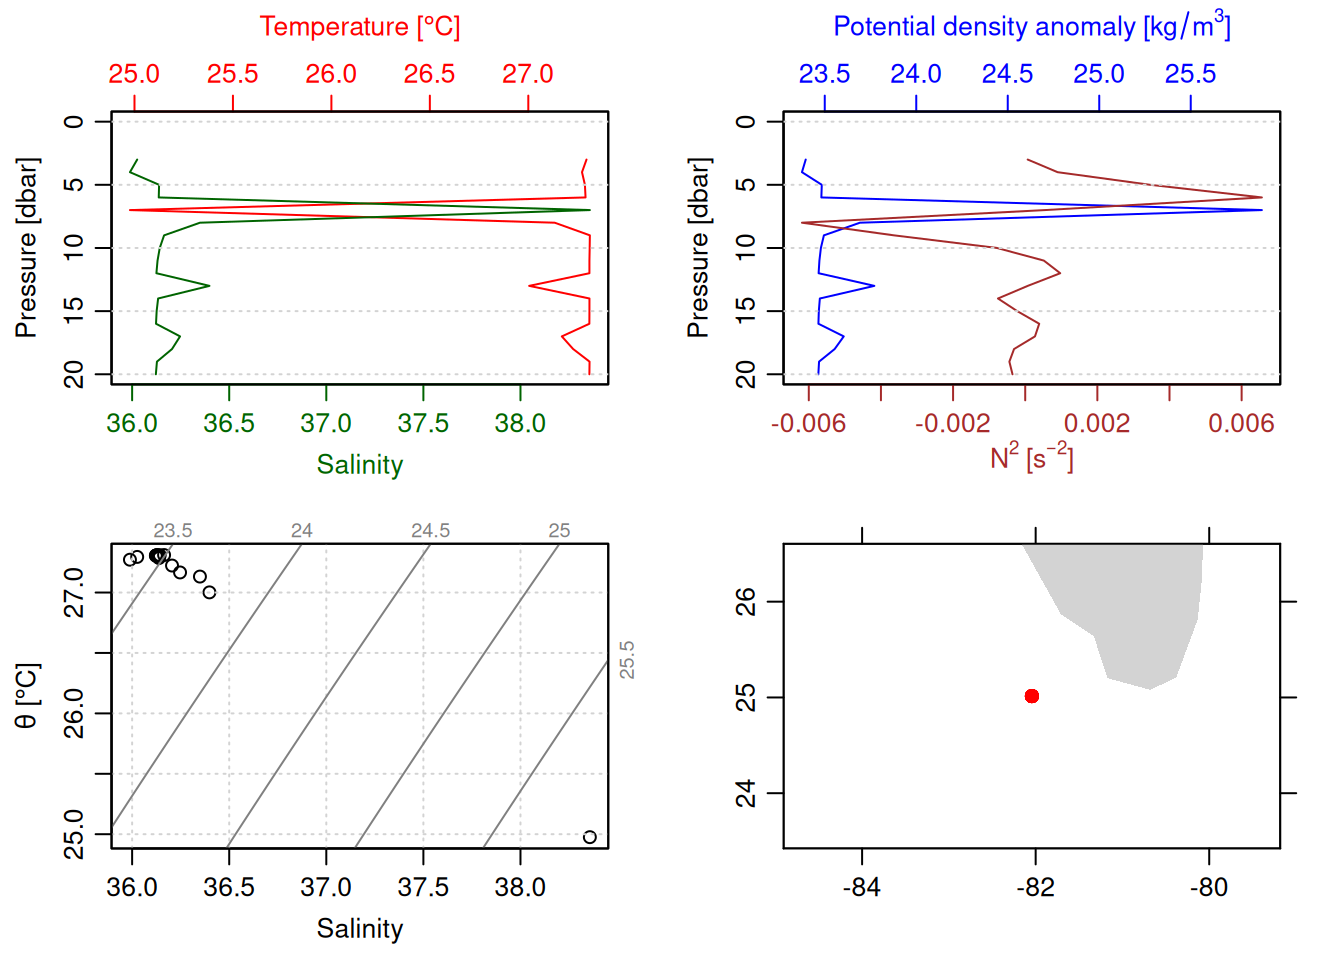
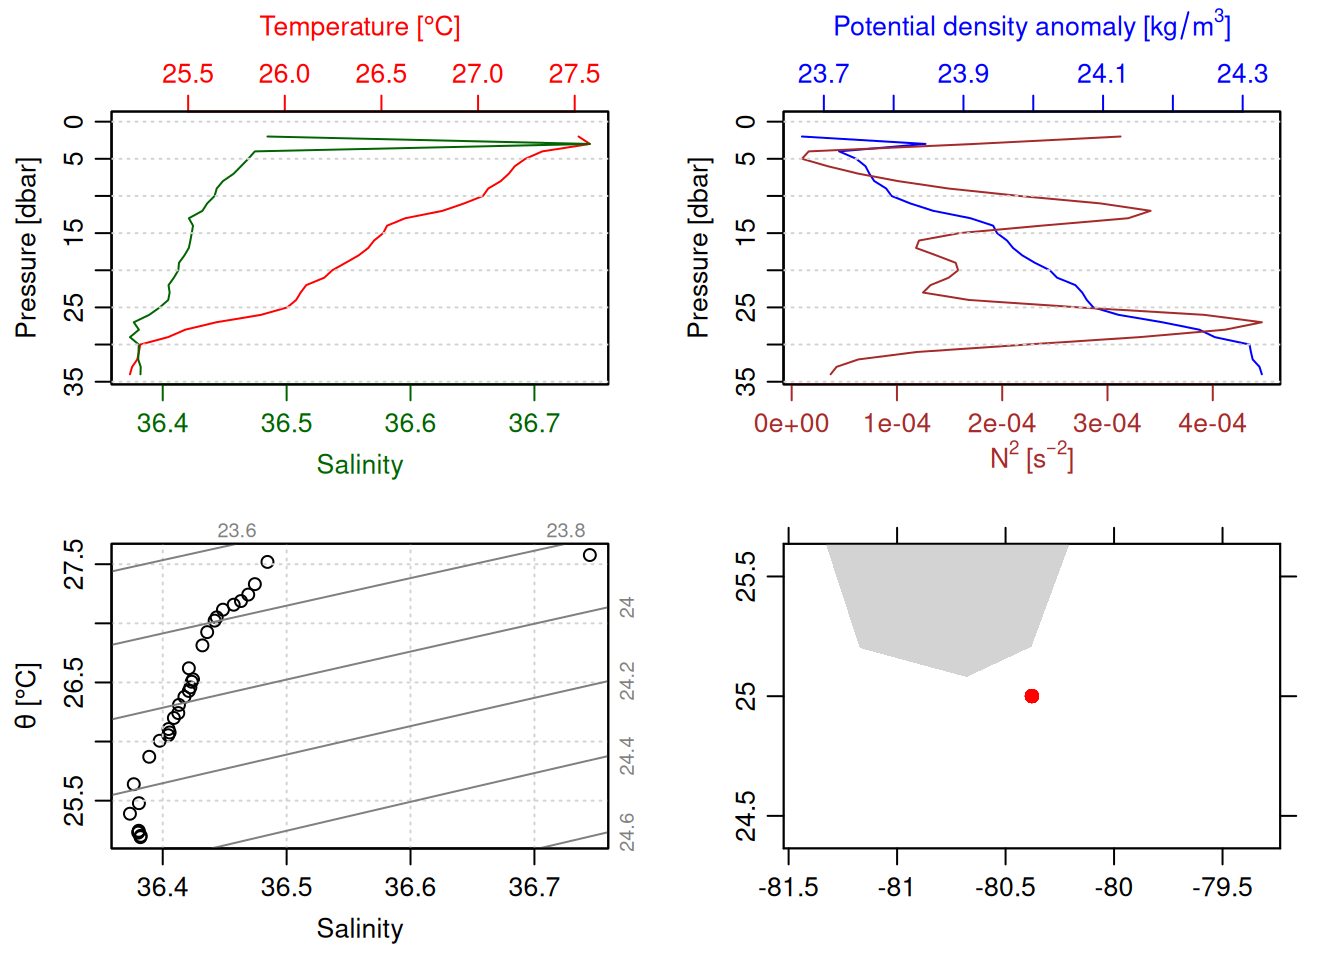
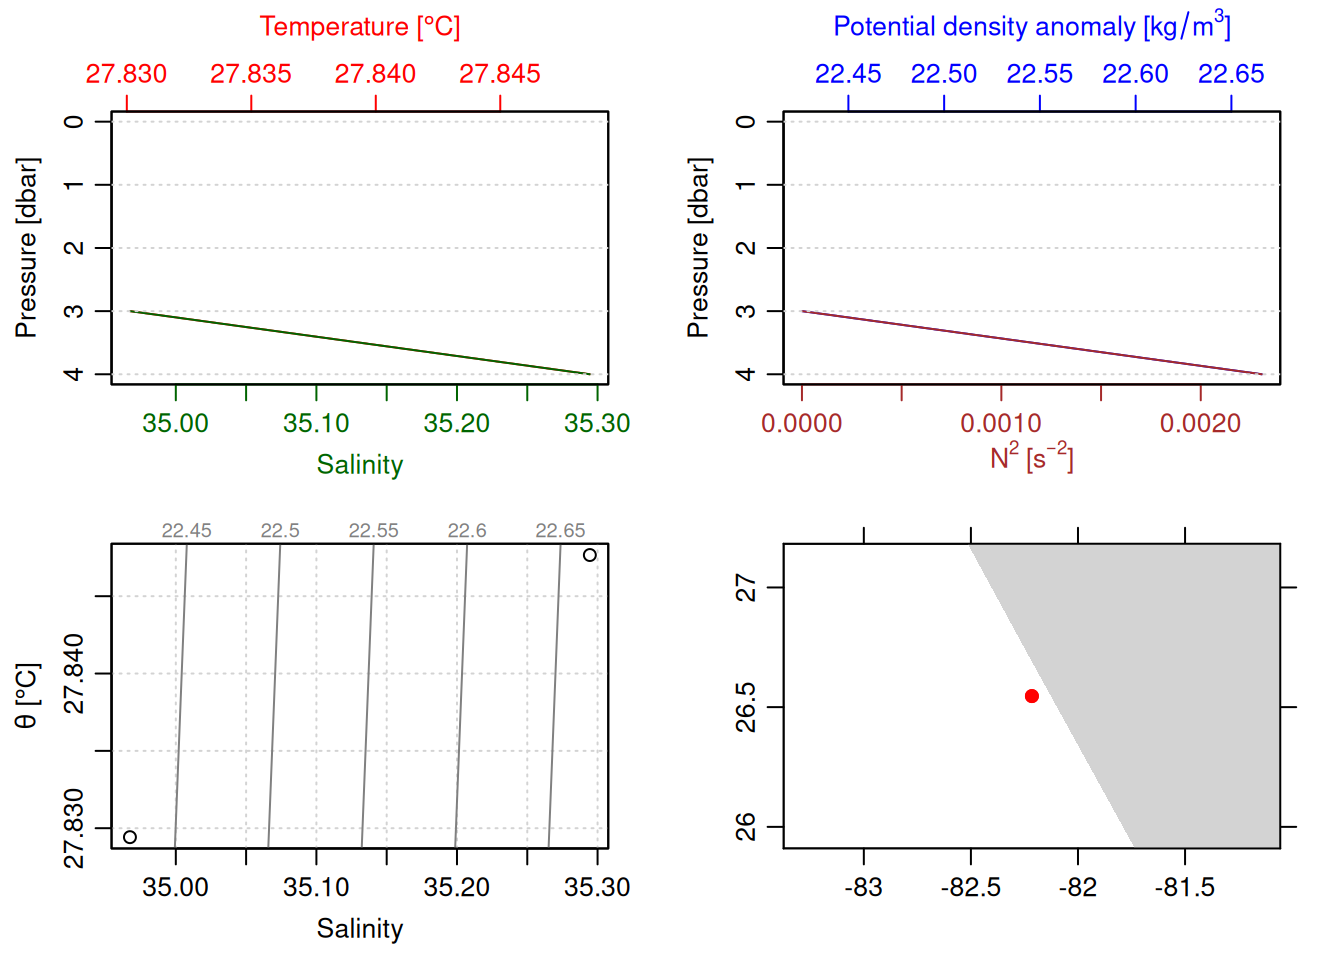
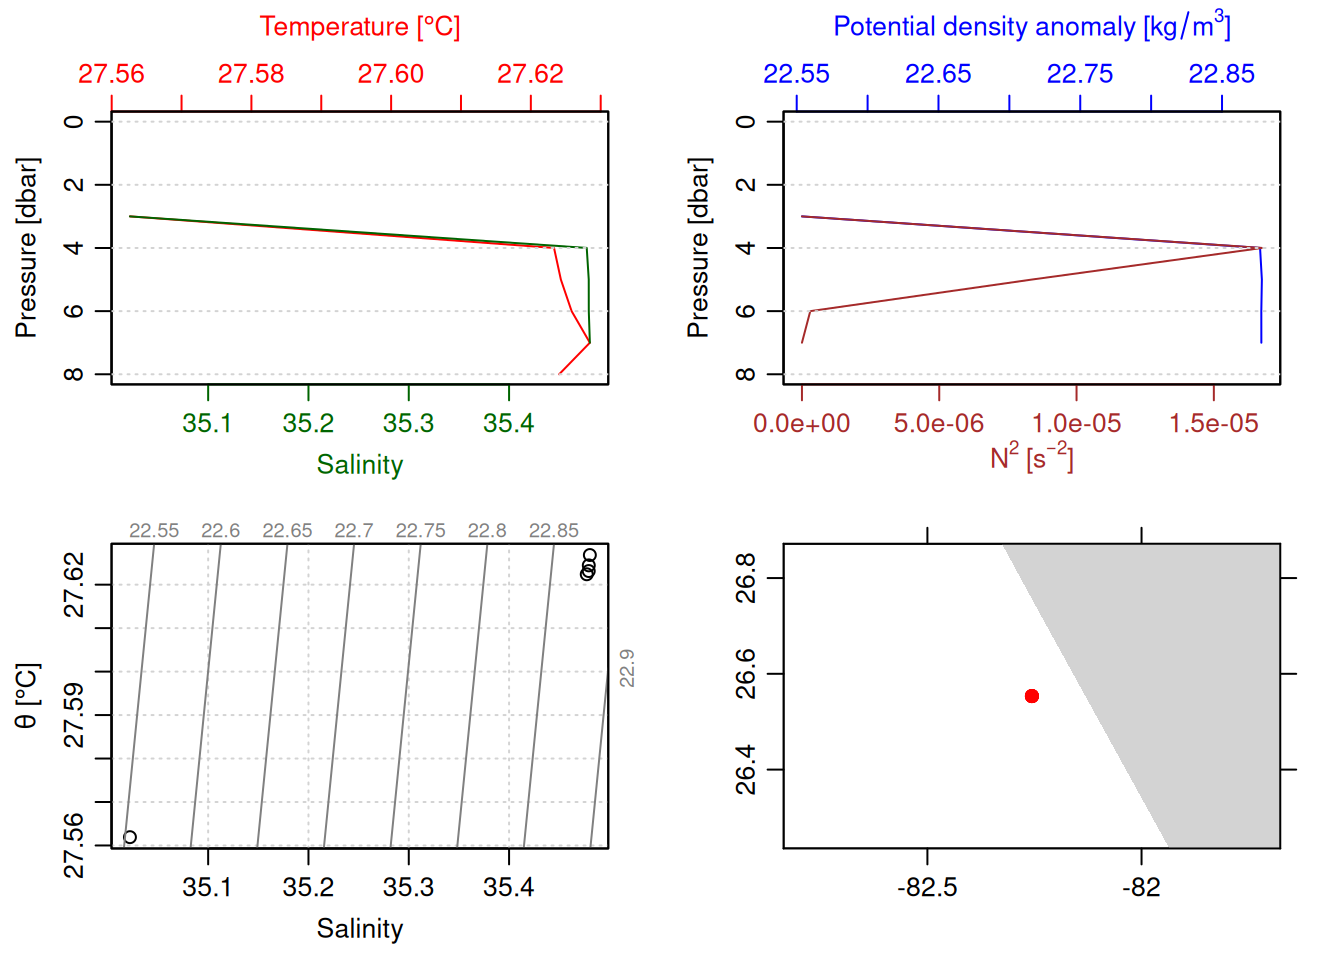
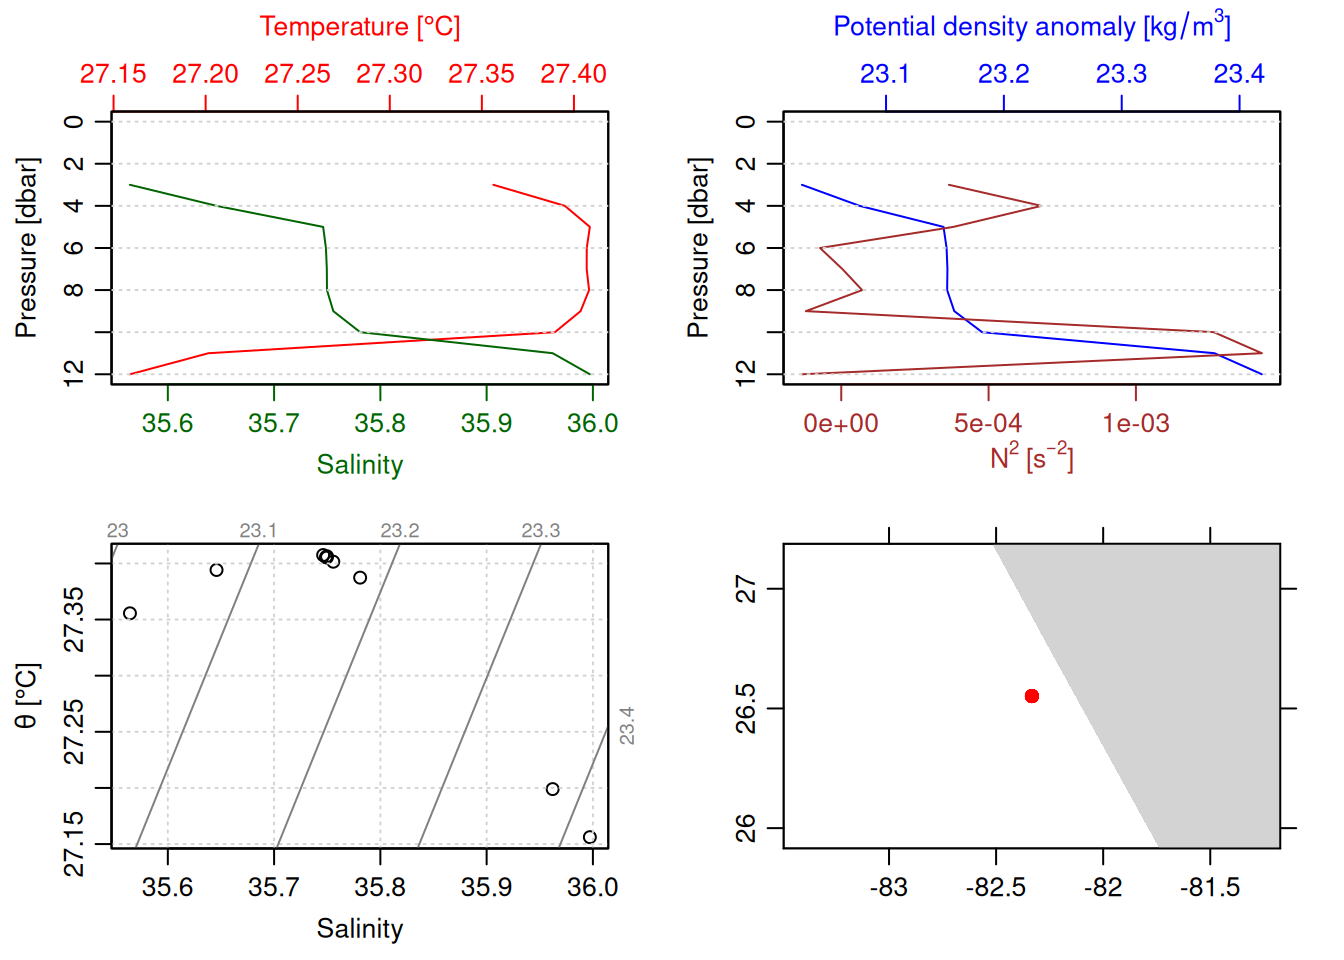
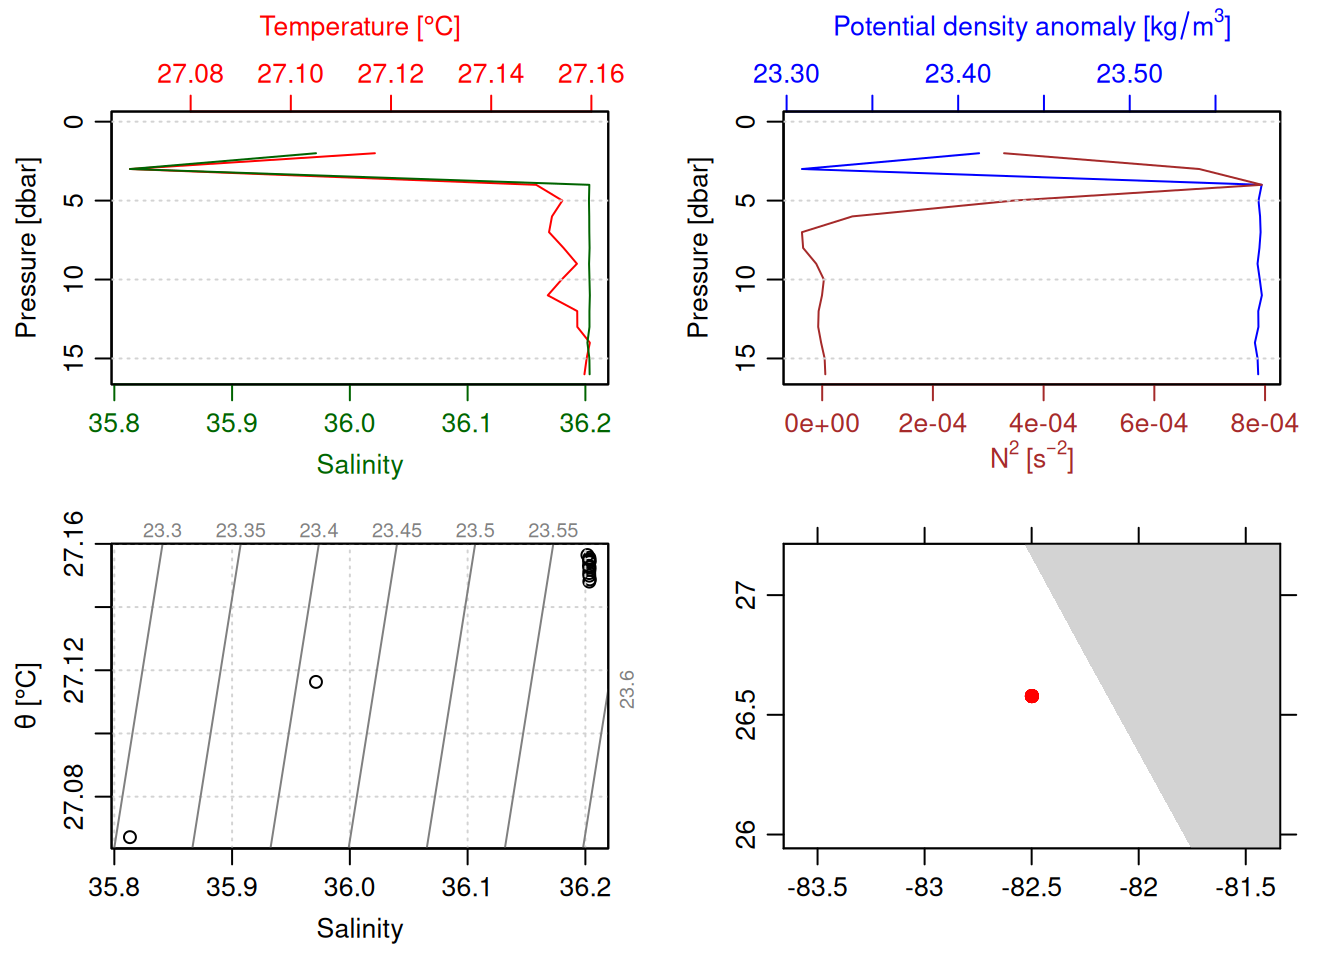
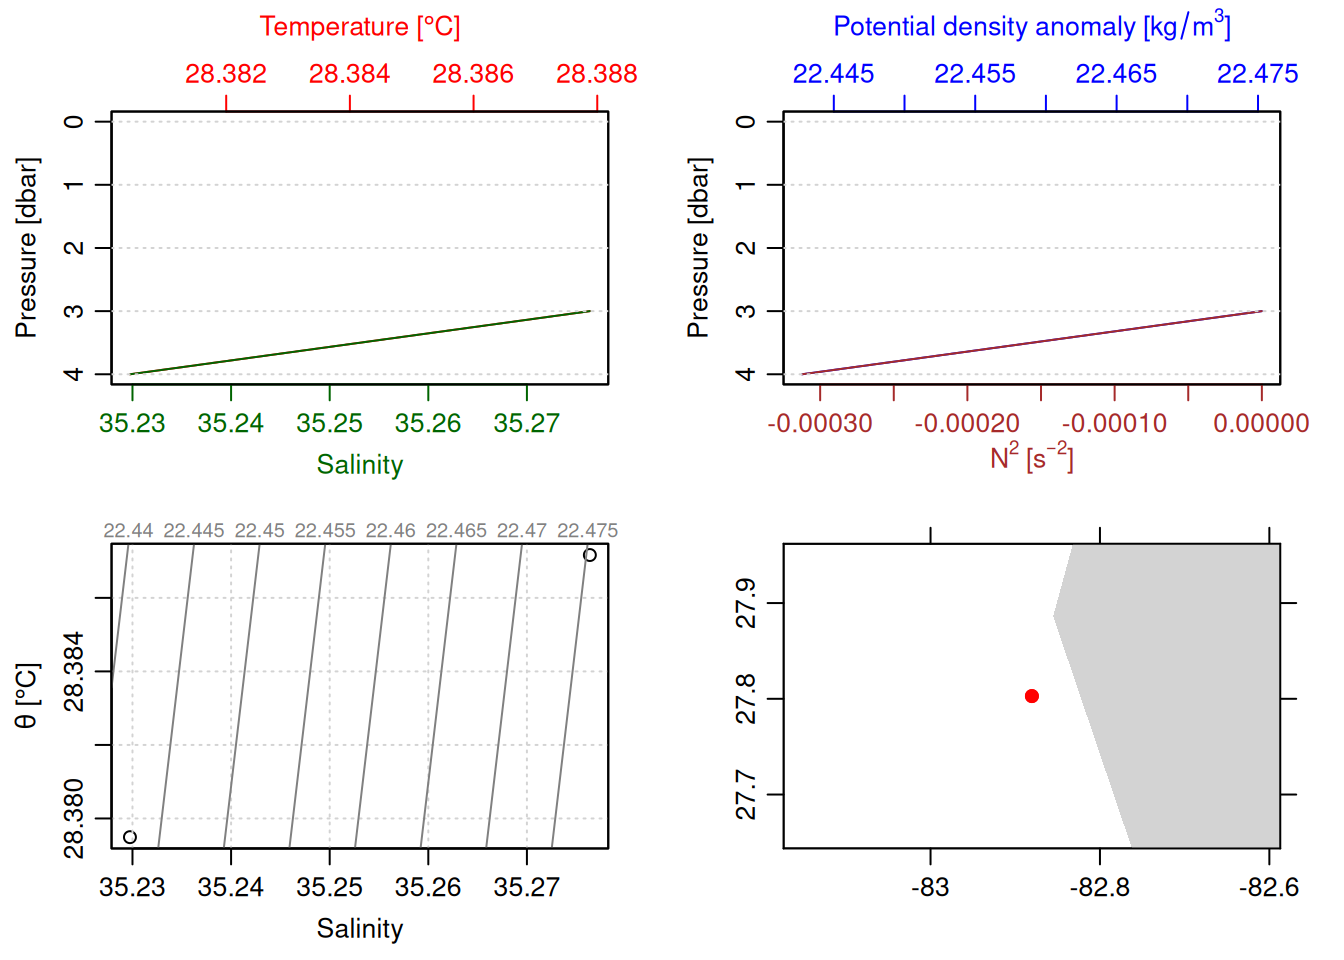
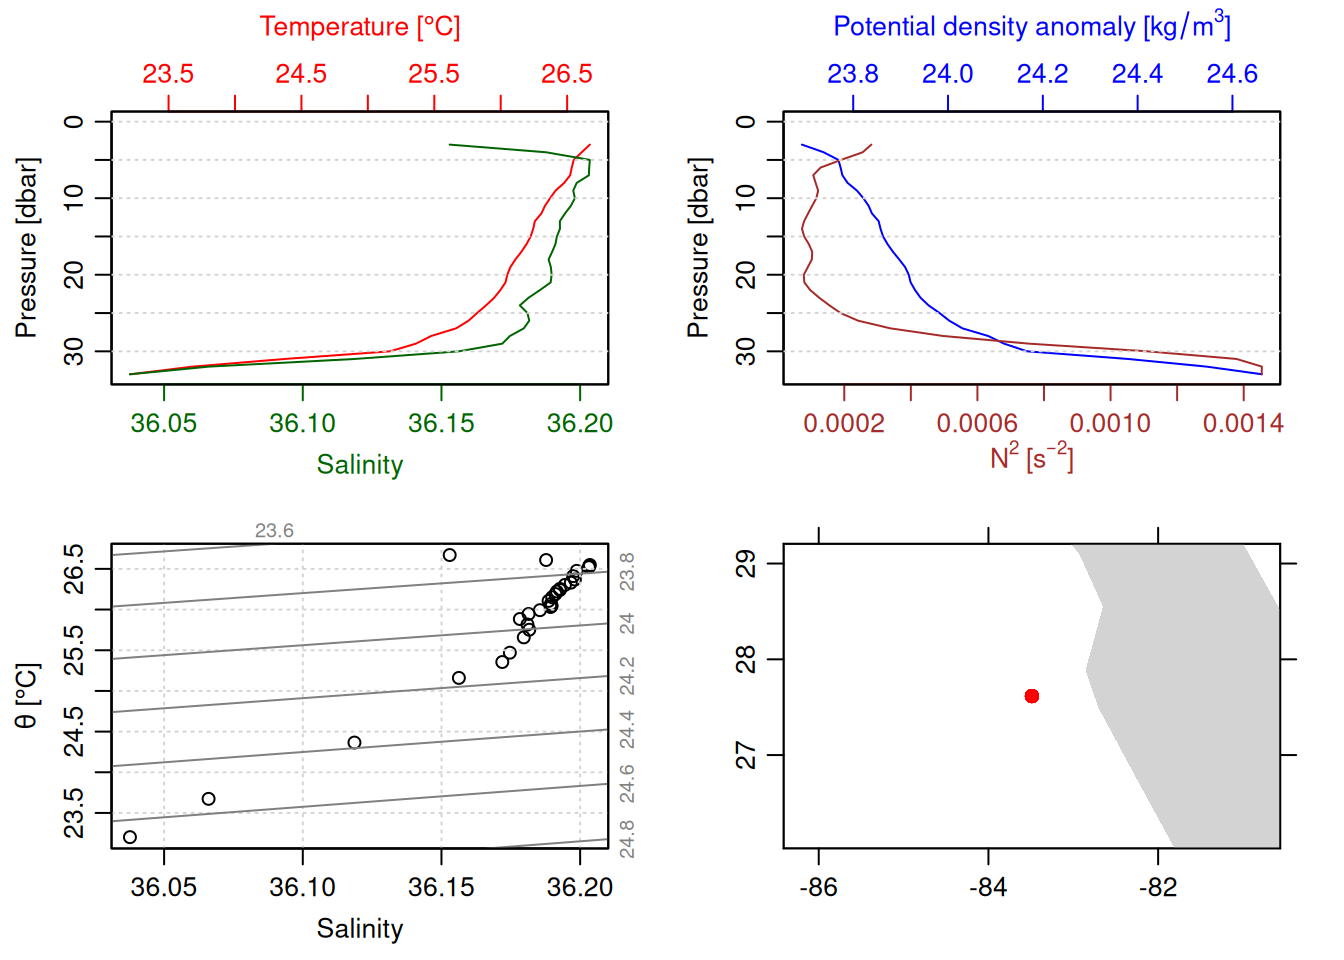
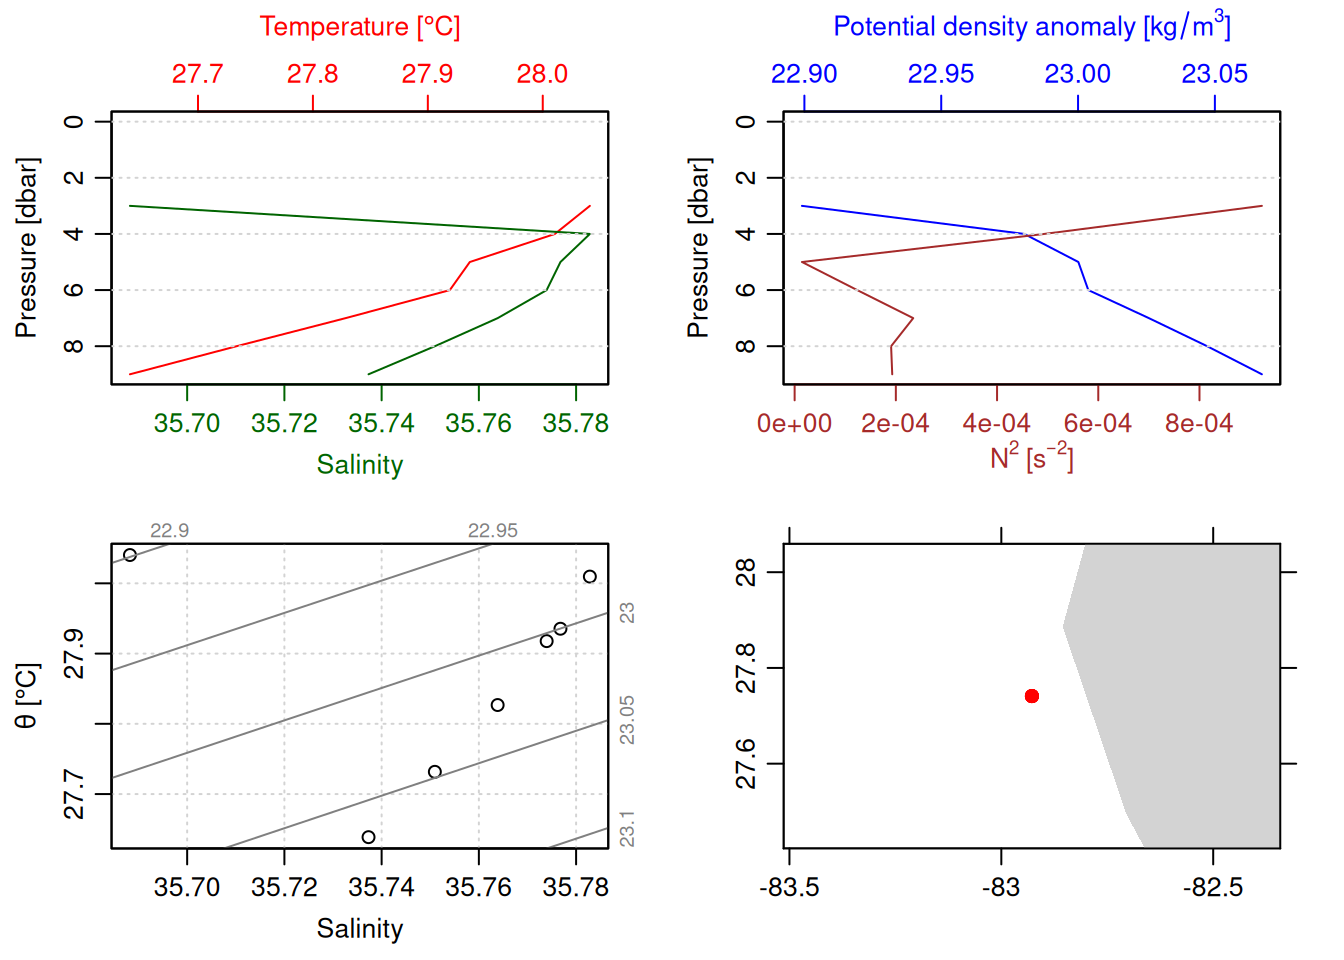
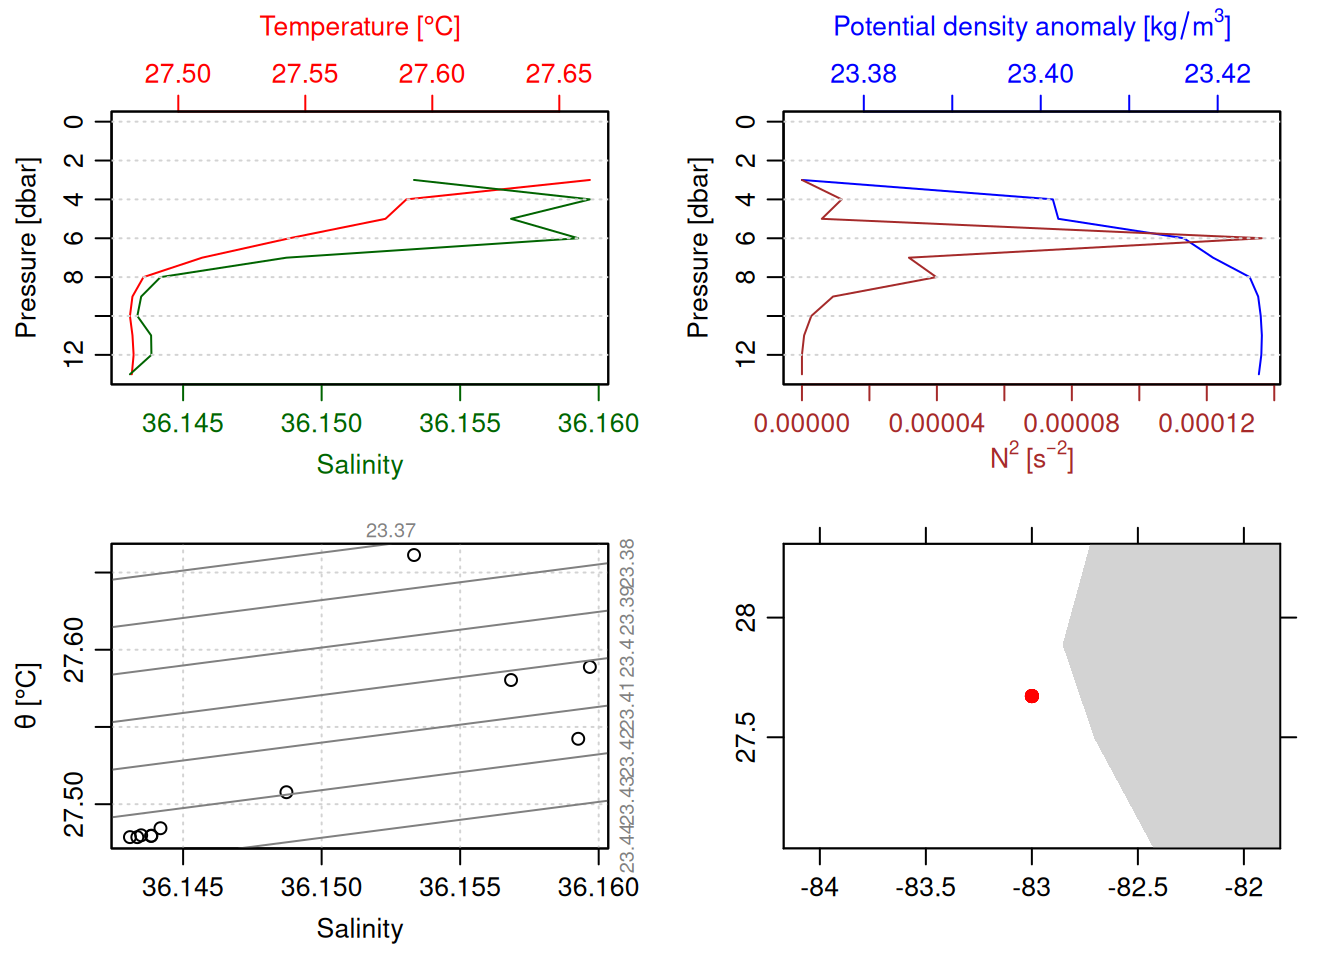
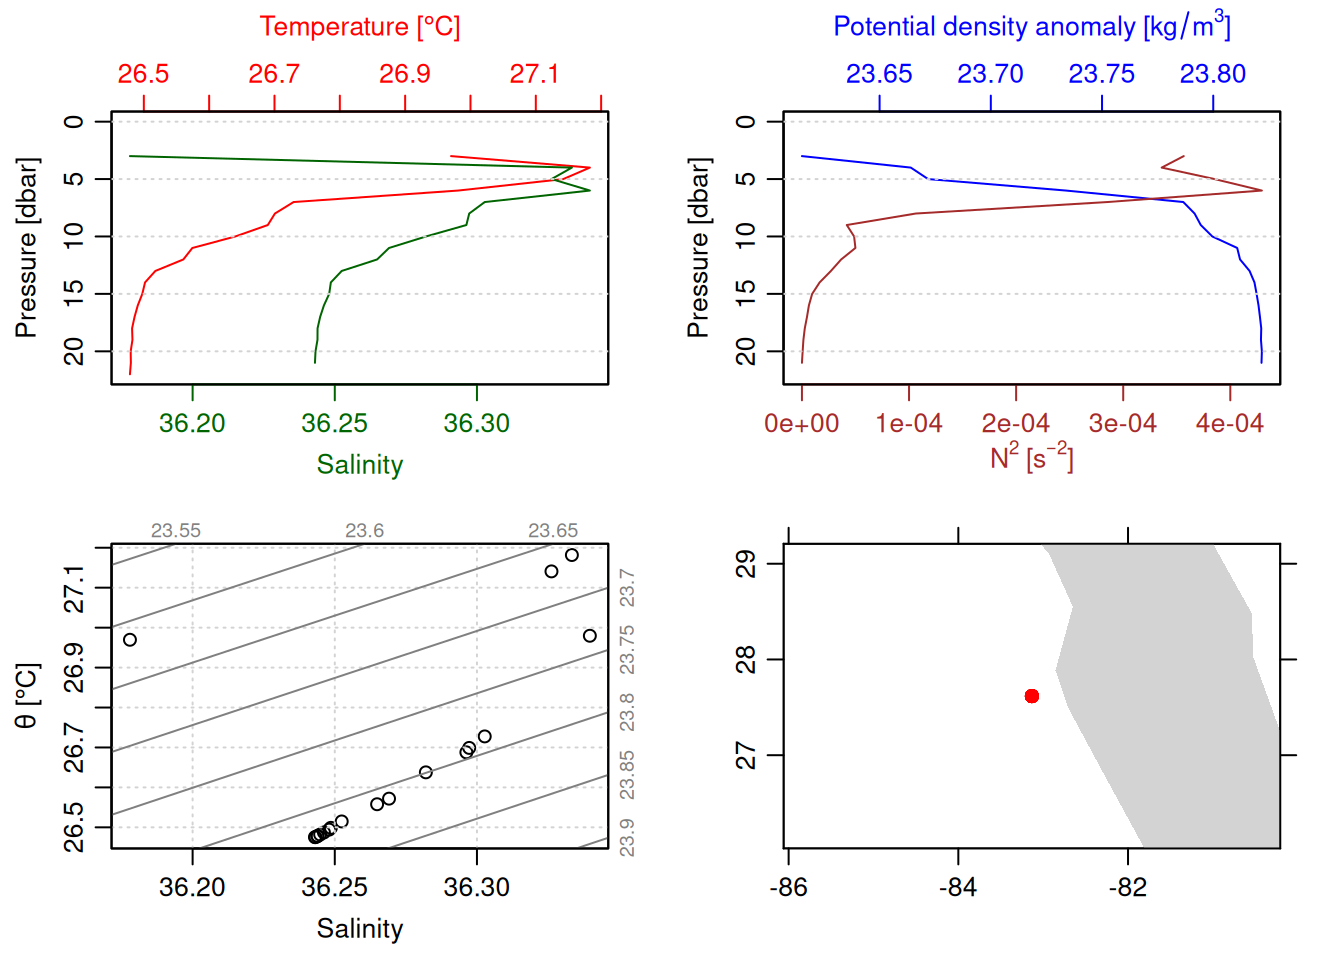
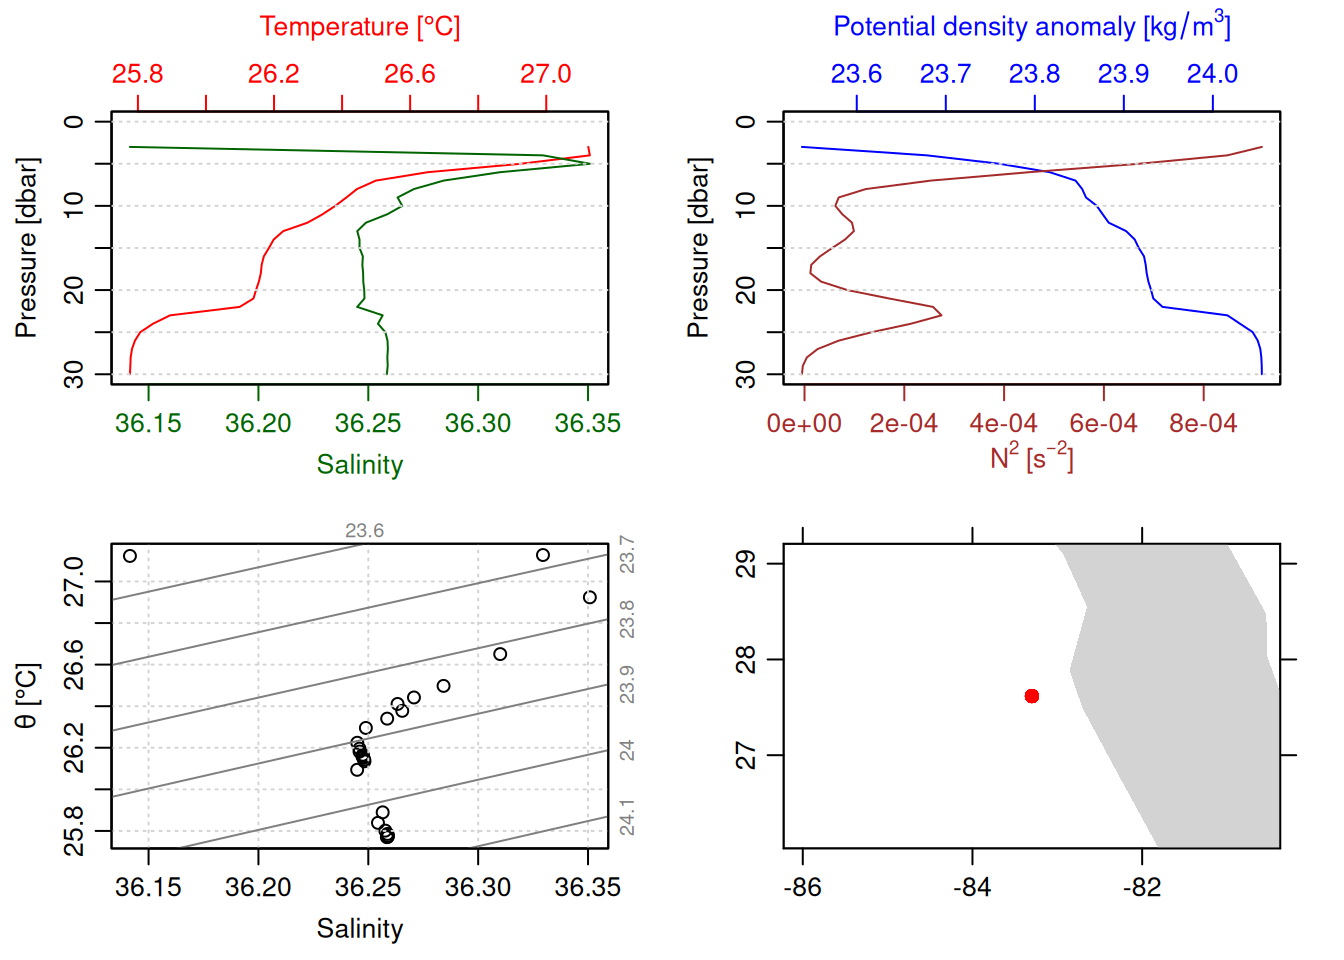
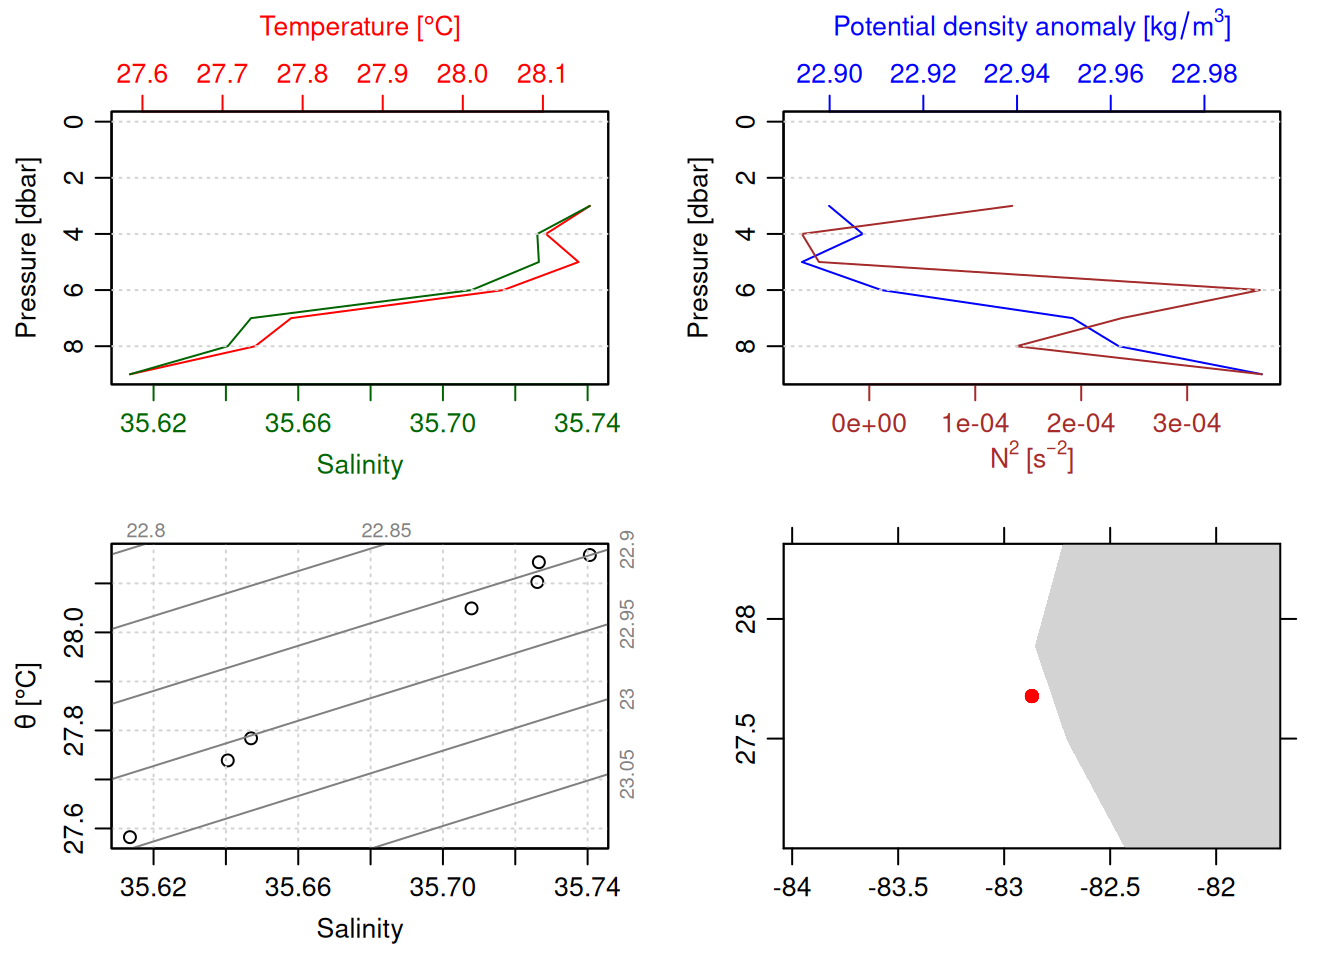
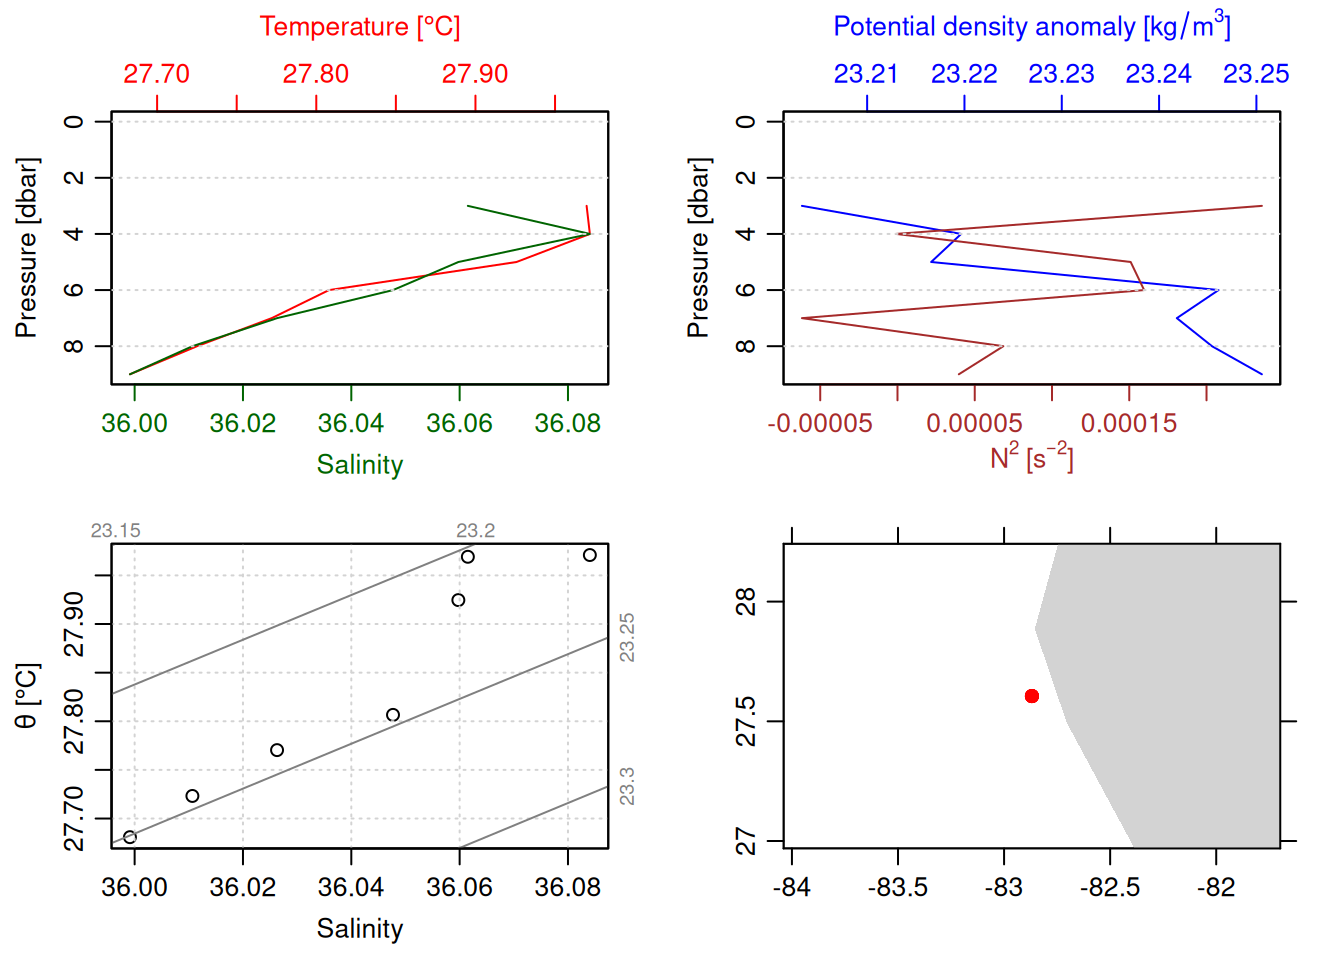
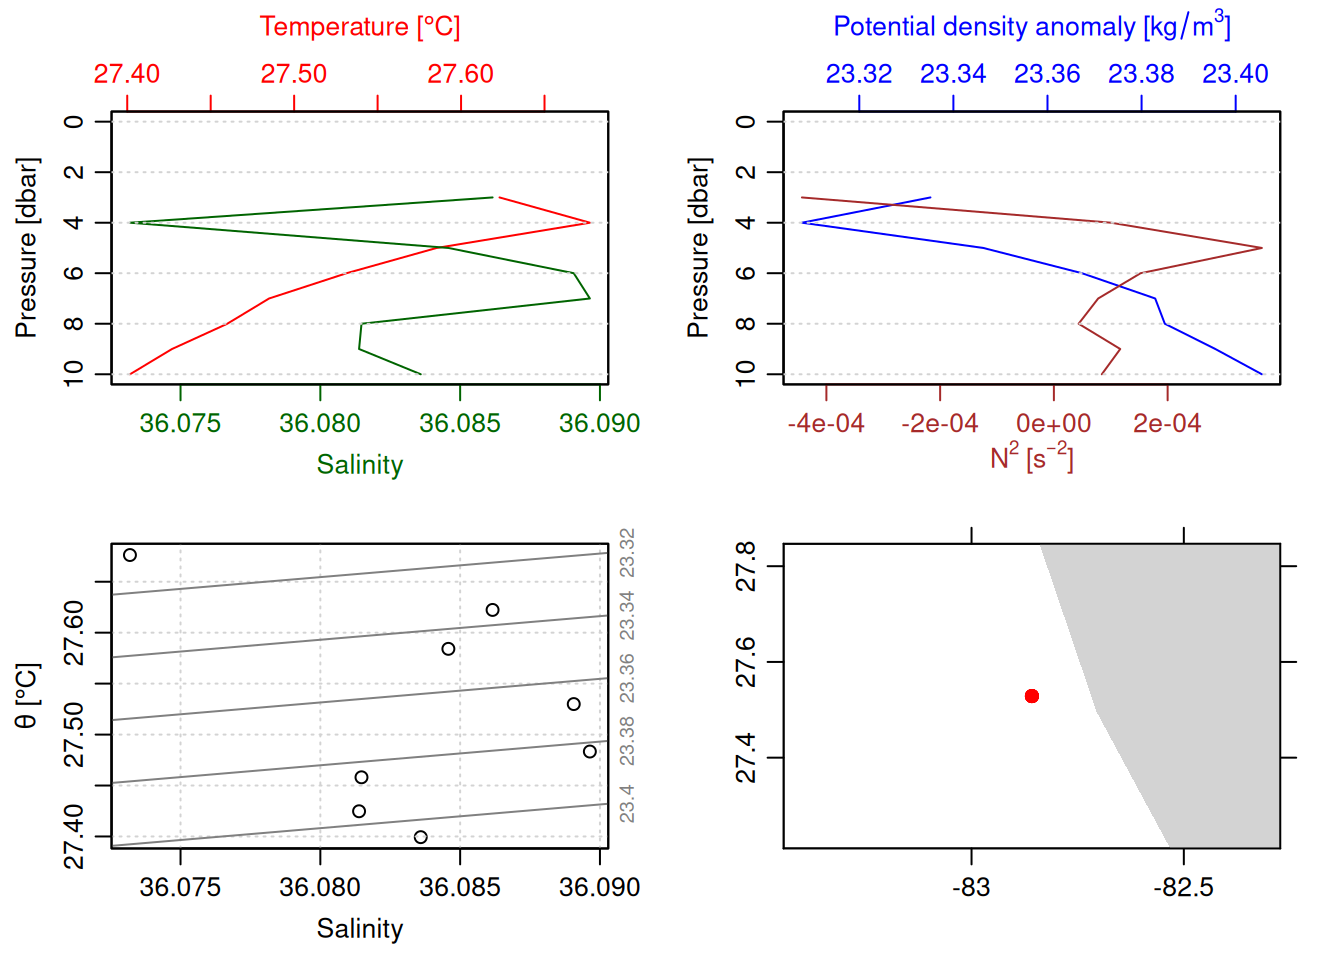
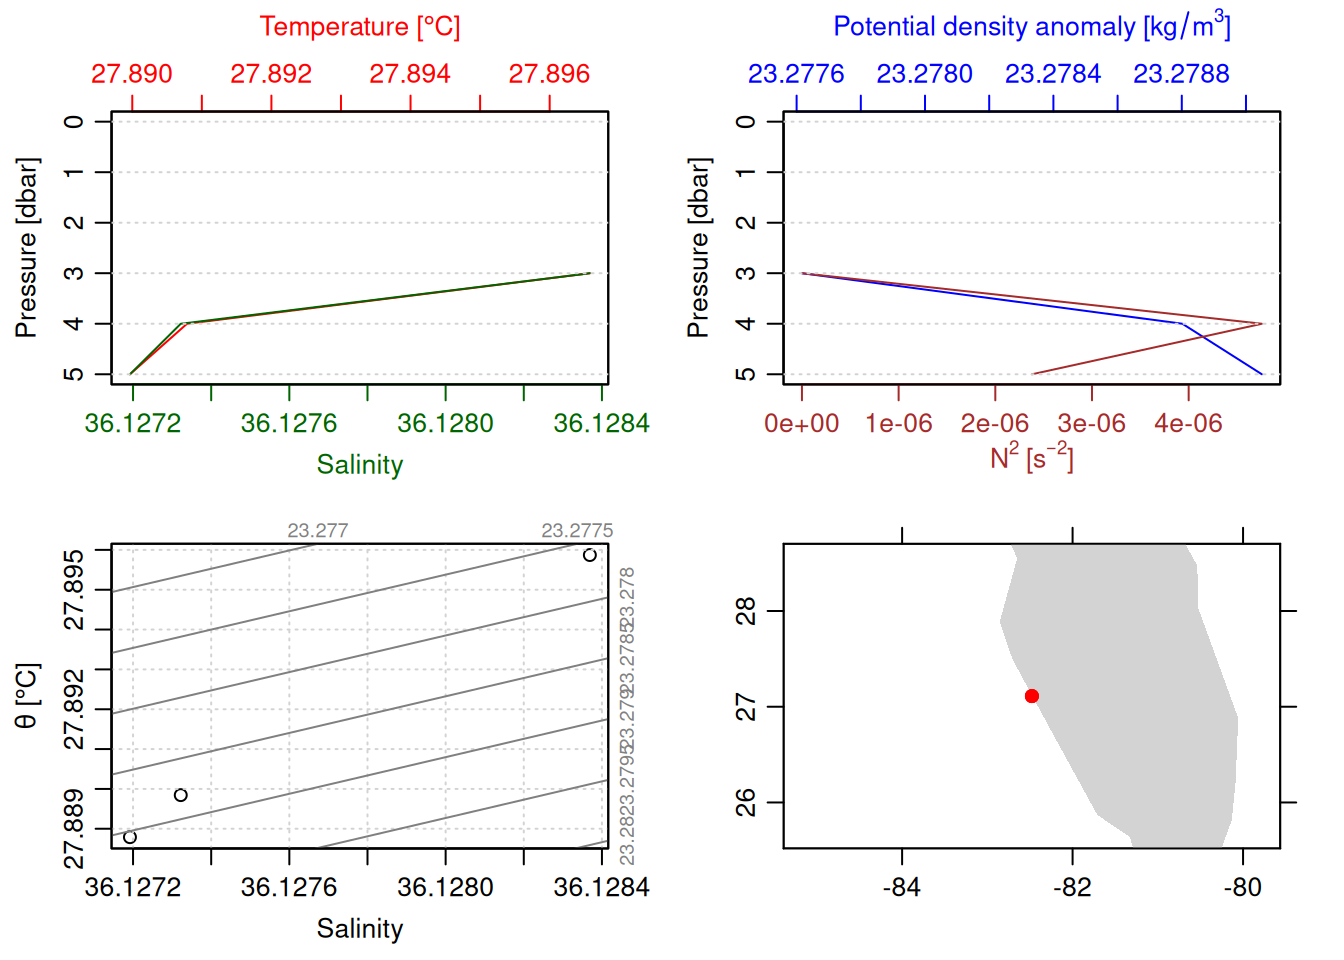
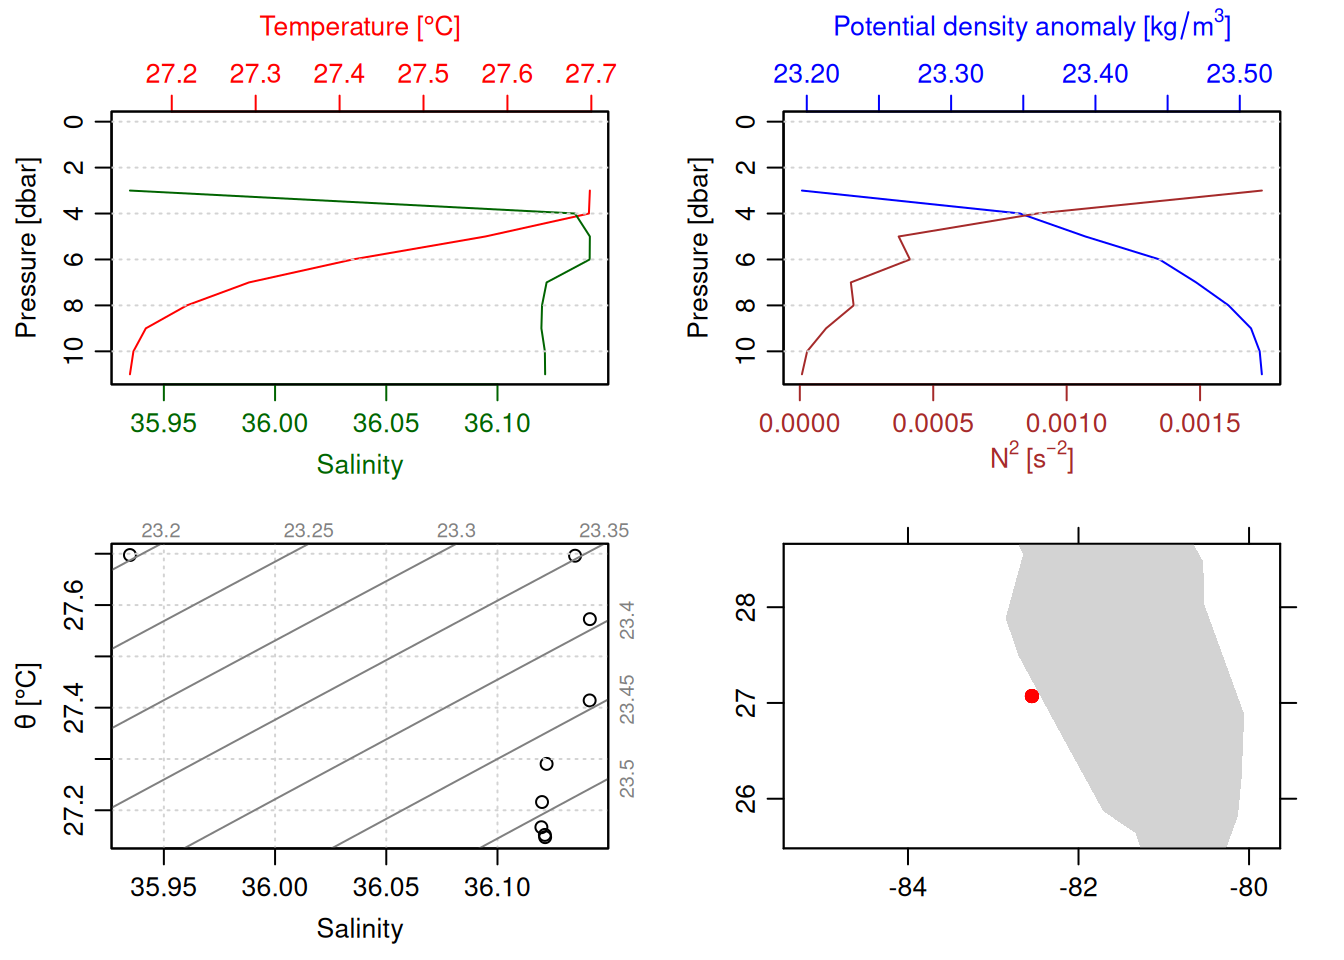
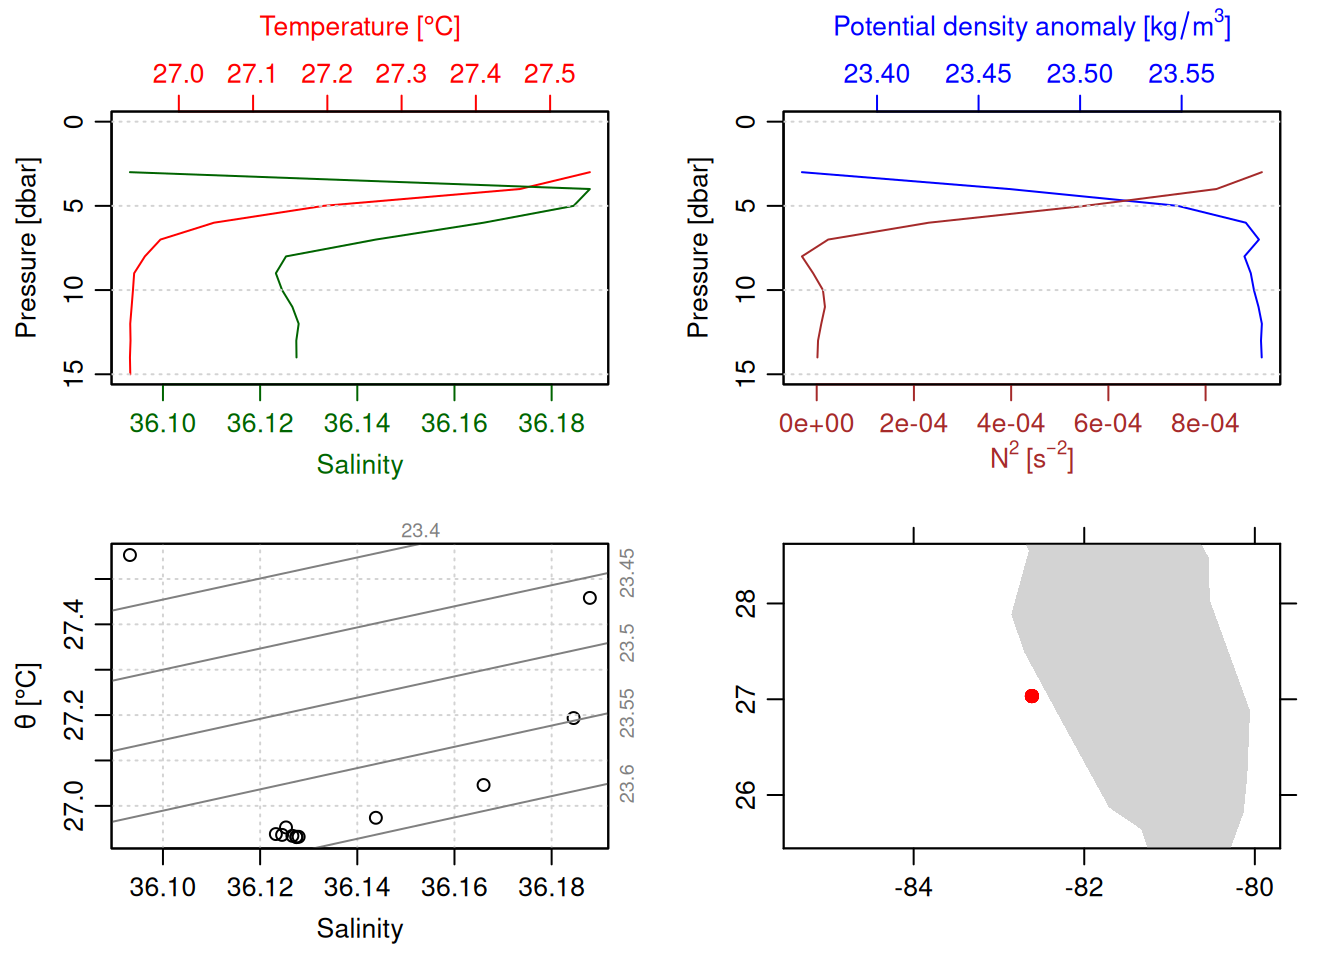
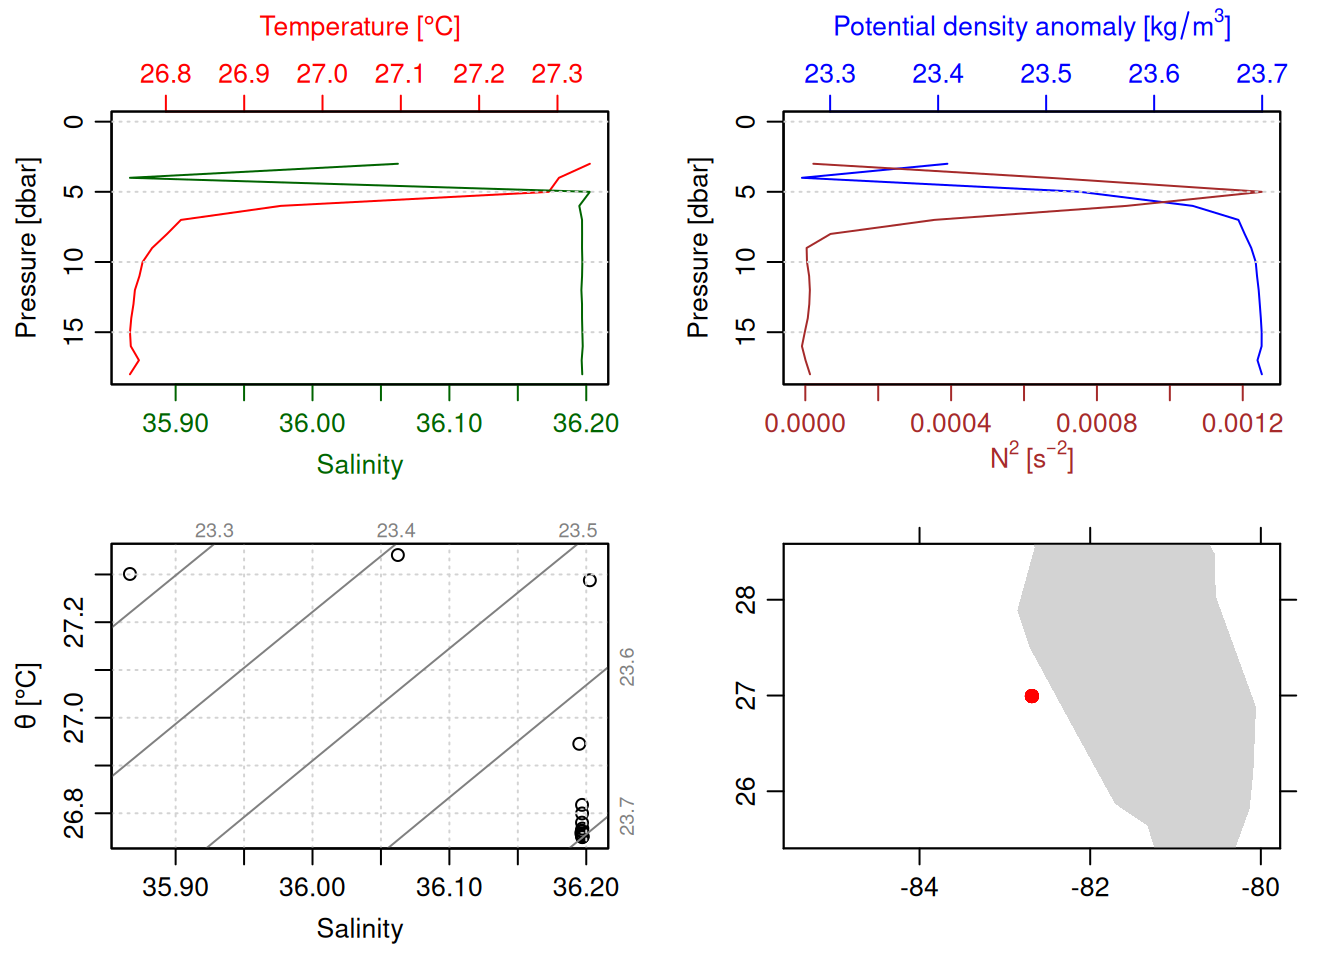
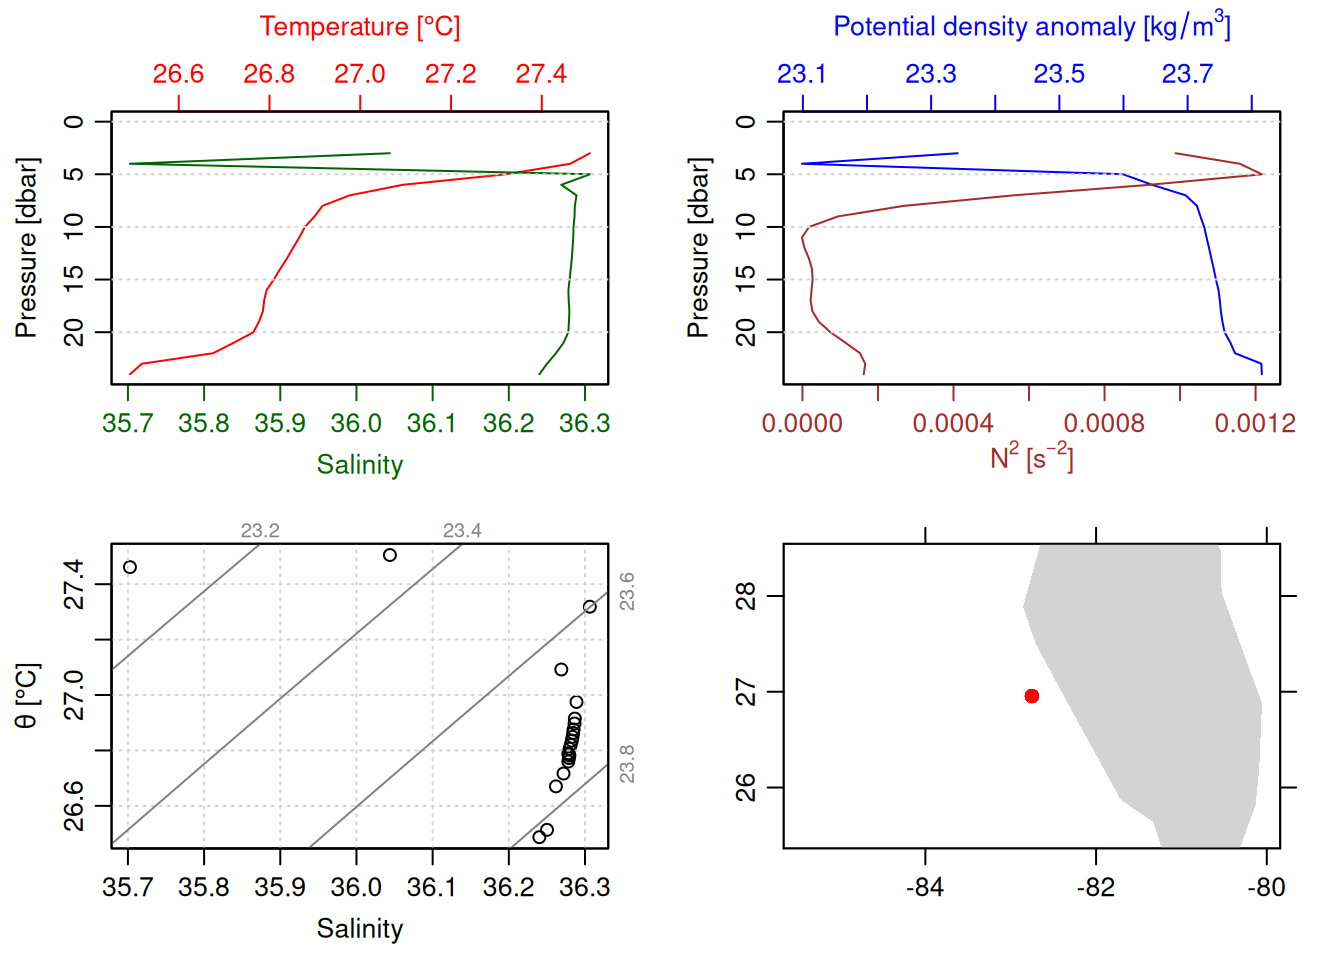
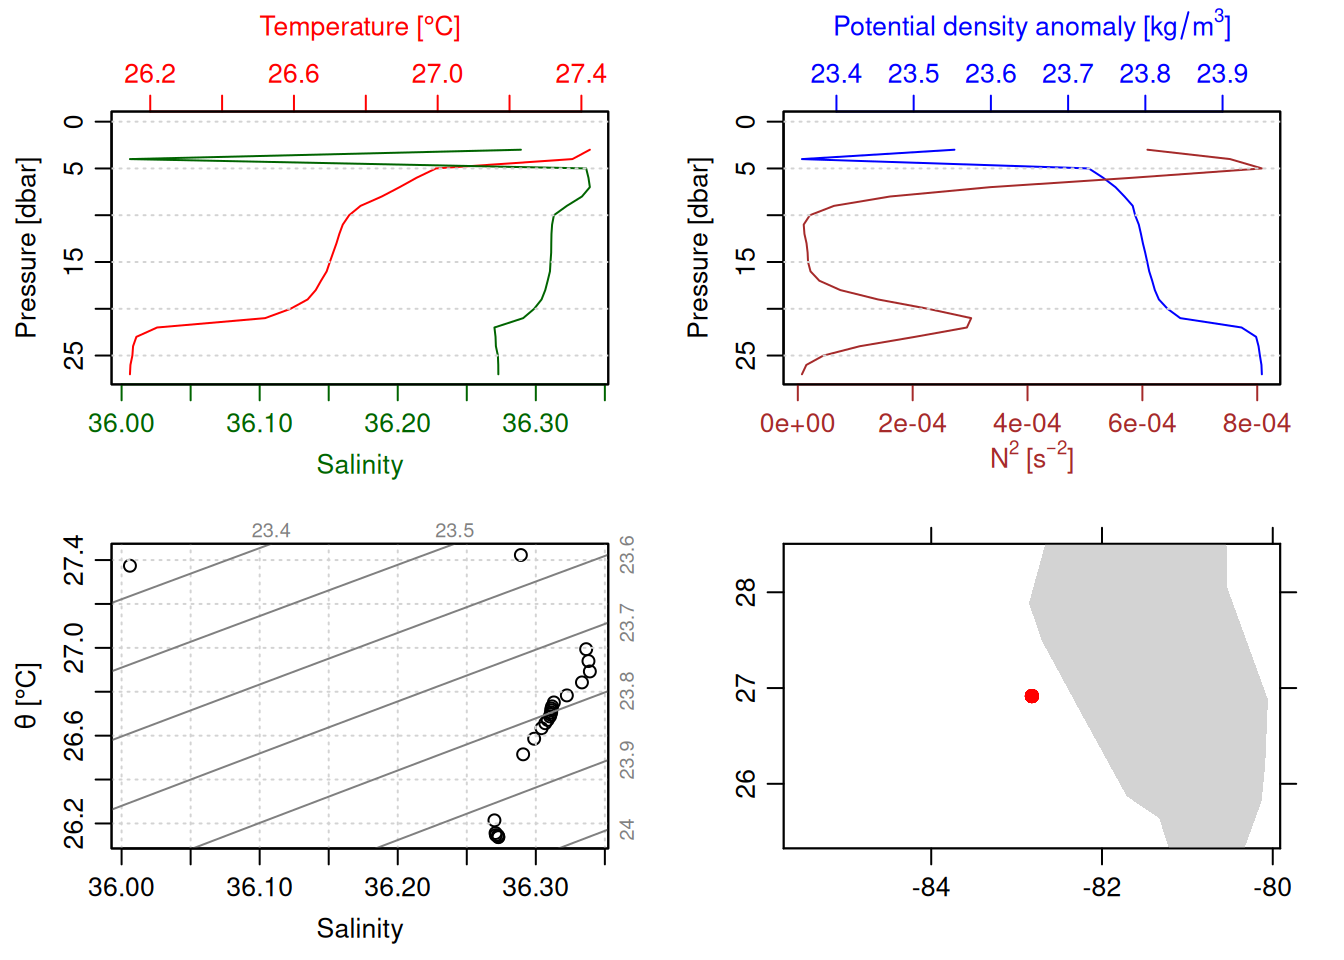
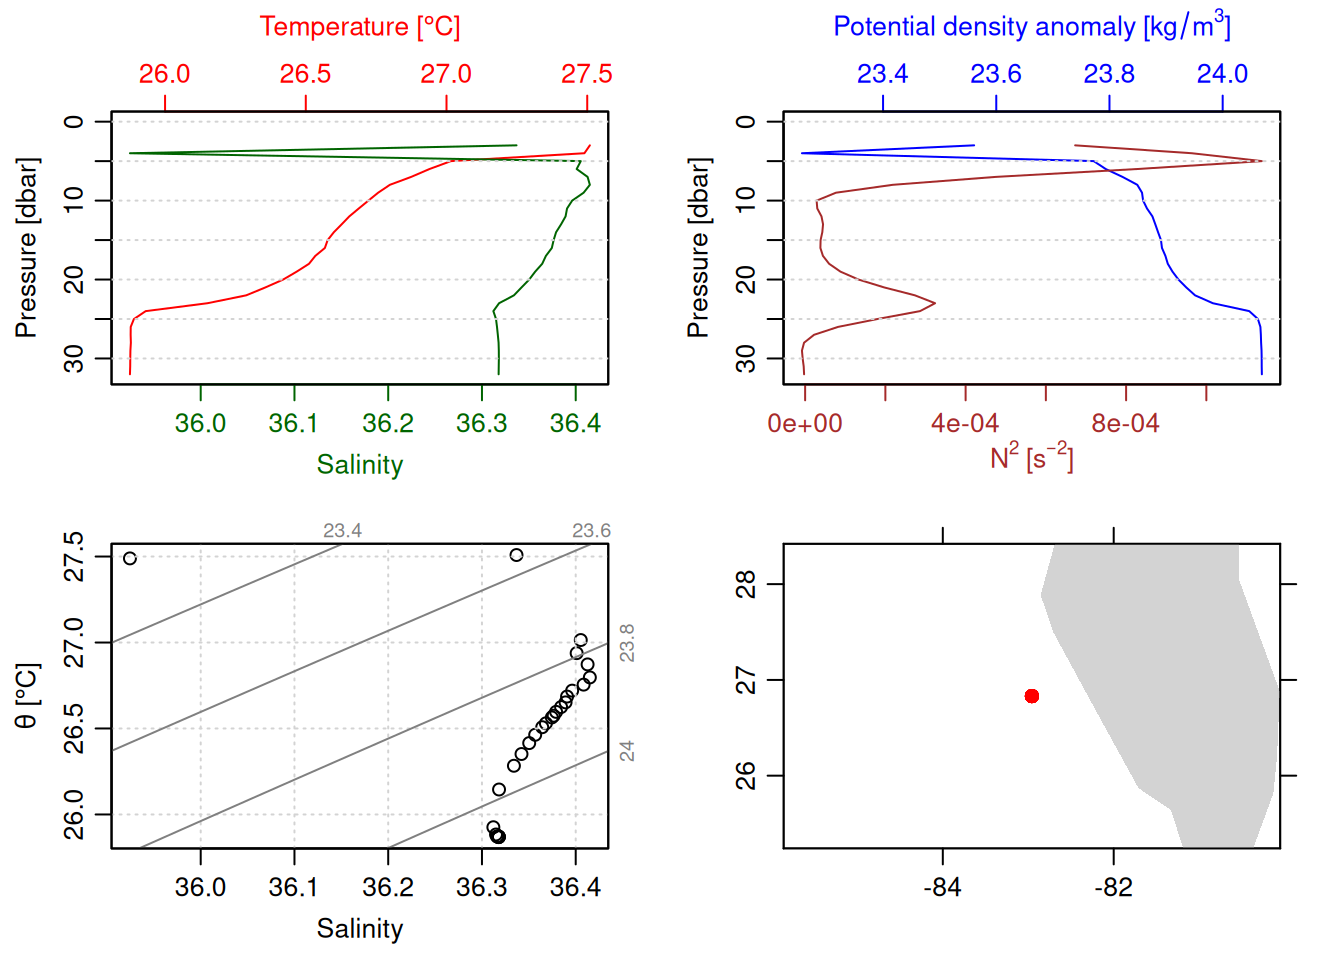
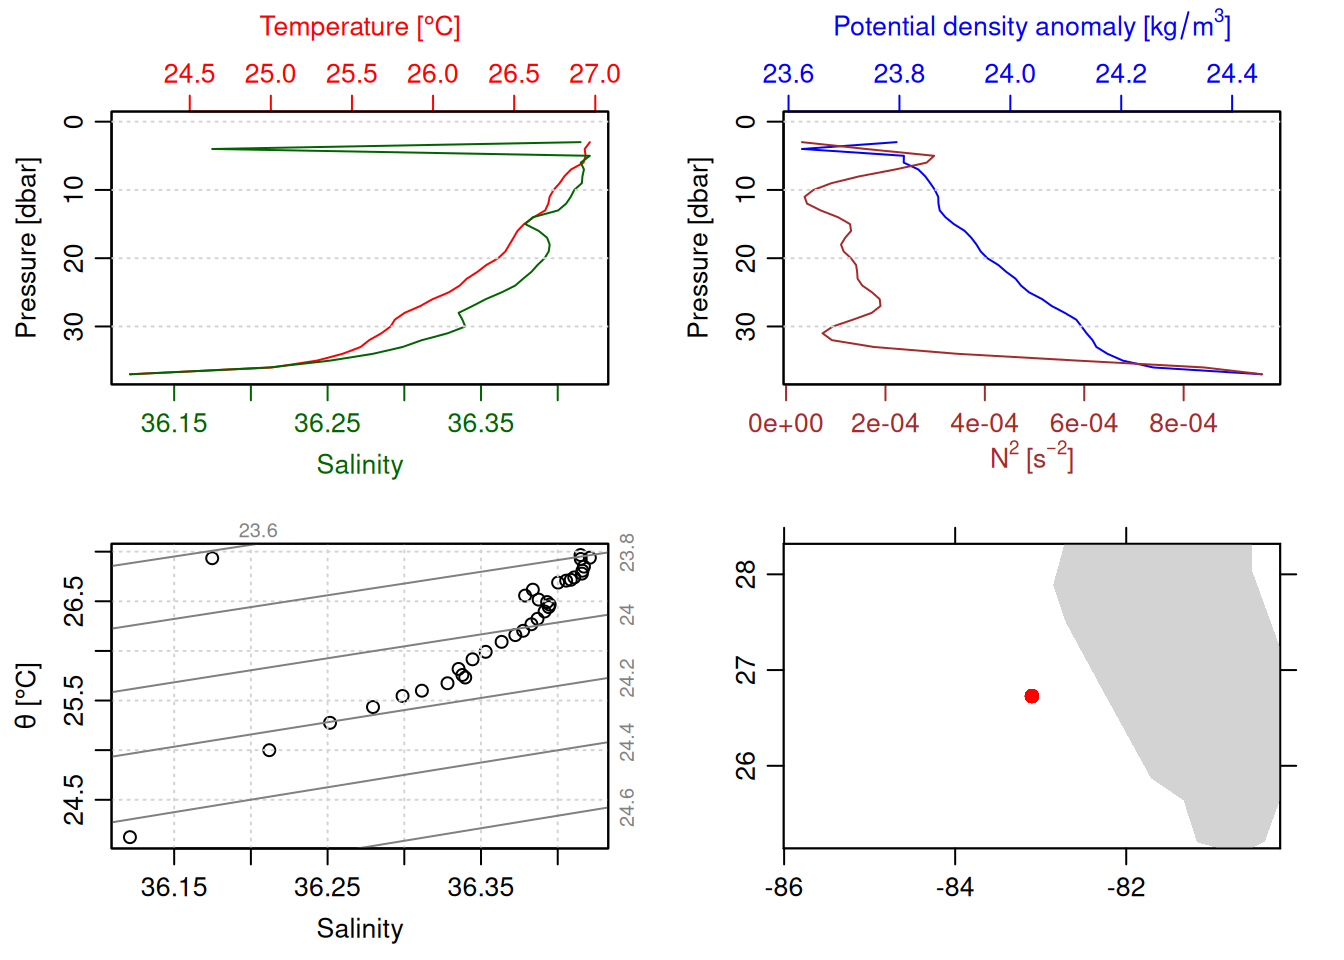
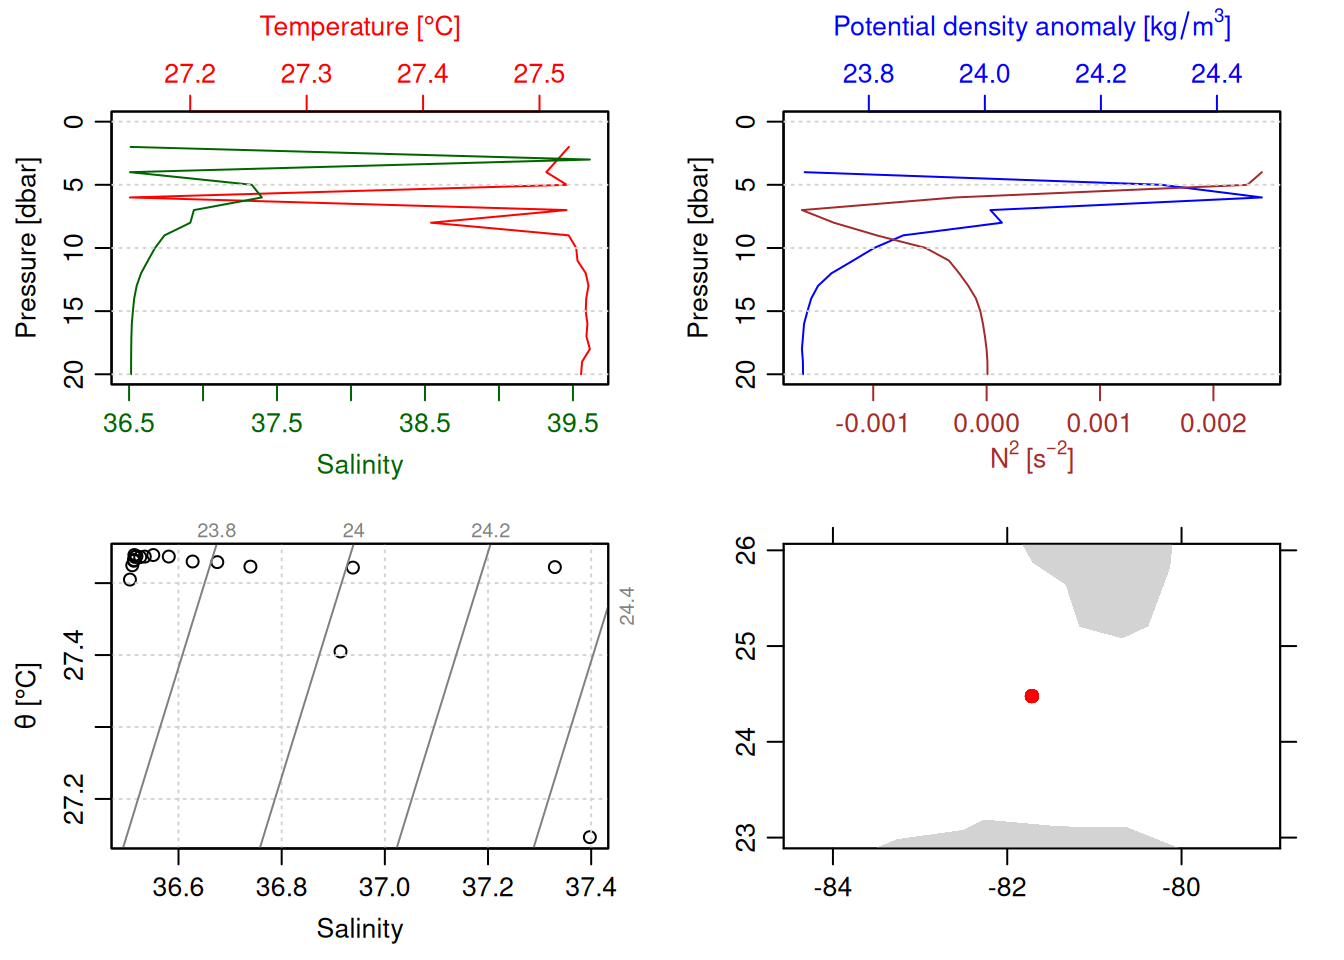
for (i inseq(ctd_FK)){ cast <- ctd_FK[[i]] # 1 is selecting only the first sublisttryCatch({plot(ctdDecimate(ctdTrim(cast))) }, error =function(e){print(e) })}
<simpleError in !is.null(x@metadata$station) && !is.na(x@metadata$station): 'length = 4083' in coercion to 'logical(1)'>
<simpleError in !is.null(x@metadata$station) && !is.na(x@metadata$station): 'length = 2401' in coercion to 'logical(1)'>
<simpleError in !is.null(x@metadata$station) && !is.na(x@metadata$station): 'length = 8790' in coercion to 'logical(1)'>
<simpleError in !is.null(x@metadata$station) && !is.na(x@metadata$station): 'length = 11589' in coercion to 'logical(1)'>
<simpleError in !is.null(x@metadata$station) && !is.na(x@metadata$station): 'length = 3495' in coercion to 'logical(1)'>
<simpleError in !is.null(x@metadata$station) && !is.na(x@metadata$station): 'length = 4989' in coercion to 'logical(1)'>
<simpleError in !is.null(x@metadata$station) && !is.na(x@metadata$station): 'length = 2068' in coercion to 'logical(1)'>
<simpleError in !is.null(x@metadata$station) && !is.na(x@metadata$station): 'length = 4476' in coercion to 'logical(1)'>
<simpleError in !is.null(x@metadata$station) && !is.na(x@metadata$station): 'length = 3836' in coercion to 'logical(1)'>
<simpleError in !is.null(x@metadata$station) && !is.na(x@metadata$station): 'length = 4127' in coercion to 'logical(1)'>
<simpleError in !is.null(x@metadata$station) && !is.na(x@metadata$station): 'length = 3503' in coercion to 'logical(1)'>
<simpleError in !is.null(x@metadata$station) && !is.na(x@metadata$station): 'length = 1939' in coercion to 'logical(1)'>
<simpleError in !is.null(x@metadata$station) && !is.na(x@metadata$station): 'length = 2144' in coercion to 'logical(1)'>
<simpleError in !is.null(x@metadata$station) && !is.na(x@metadata$station): 'length = 1496' in coercion to 'logical(1)'>
<simpleError in !is.null(x@metadata$station) && !is.na(x@metadata$station): 'length = 1433' in coercion to 'logical(1)'>
<simpleError in !is.null(x@metadata$station) && !is.na(x@metadata$station): 'length = 1786' in coercion to 'logical(1)'>
<simpleError in !is.null(x@metadata$station) && !is.na(x@metadata$station): 'length = 786' in coercion to 'logical(1)'>
<simpleError in !is.null(x@metadata$station) && !is.na(x@metadata$station): 'length = 2059' in coercion to 'logical(1)'>
<simpleError in !is.null(x@metadata$station) && !is.na(x@metadata$station): 'length = 3803' in coercion to 'logical(1)'>
<simpleError in !is.null(x@metadata$station) && !is.na(x@metadata$station): 'length = 3842' in coercion to 'logical(1)'>
<simpleError in !is.null(x@metadata$station) && !is.na(x@metadata$station): 'length = 4276' in coercion to 'logical(1)'>
<simpleError in !is.null(x@metadata$station) && !is.na(x@metadata$station): 'length = 3700' in coercion to 'logical(1)'>
<simpleError in !is.null(x@metadata$station) && !is.na(x@metadata$station): 'length = 4020' in coercion to 'logical(1)'>
<simpleError in !is.null(x@metadata$station) && !is.na(x@metadata$station): 'length = 2082' in coercion to 'logical(1)'>
<simpleError in !is.null(x@metadata$station) && !is.na(x@metadata$station): 'length = 189' in coercion to 'logical(1)'>
<simpleError in !is.null(x@metadata$station) && !is.na(x@metadata$station): 'length = 50' in coercion to 'logical(1)'>
<simpleError in !is.null(x@metadata$station) && !is.na(x@metadata$station): 'length = 26' in coercion to 'logical(1)'>
<simpleError in !is.null(x@metadata$station) && !is.na(x@metadata$station): 'length = 3305' in coercion to 'logical(1)'>
<simpleError in !is.null(x@metadata$station) && !is.na(x@metadata$station): 'length = 3517' in coercion to 'logical(1)'>
<simpleError in !is.null(x@metadata$station) && !is.na(x@metadata$station): 'length = 3773' in coercion to 'logical(1)'>
<simpleError in !is.null(x@metadata$station) && !is.na(x@metadata$station): 'length = 3907' in coercion to 'logical(1)'>
<simpleError in !is.null(x@metadata$station) && !is.na(x@metadata$station): 'length = 4860' in coercion to 'logical(1)'>
<simpleError in !is.null(x@metadata$station) && !is.na(x@metadata$station): 'length = 5757' in coercion to 'logical(1)'>
<simpleError in !is.null(x@metadata$station) && !is.na(x@metadata$station): 'length = 5406' in coercion to 'logical(1)'>
<simpleError in !is.null(x@metadata$station) && !is.na(x@metadata$station): 'length = 5667' in coercion to 'logical(1)'>
<simpleError in !is.null(x@metadata$station) && !is.na(x@metadata$station): 'length = 6452' in coercion to 'logical(1)'>
<simpleError in !is.null(x@metadata$station) && !is.na(x@metadata$station): 'length = 1990' in coercion to 'logical(1)'>
<simpleError in !is.null(x@metadata$station) && !is.na(x@metadata$station): 'length = 3919' in coercion to 'logical(1)'>
<simpleError in !is.null(x@metadata$station) && !is.na(x@metadata$station): 'length = 3476' in coercion to 'logical(1)'>
<simpleError in !is.null(x@metadata$station) && !is.na(x@metadata$station): 'length = 4101' in coercion to 'logical(1)'>
<simpleError in !is.null(x@metadata$station) && !is.na(x@metadata$station): 'length = 4275' in coercion to 'logical(1)'>
<simpleError in !is.null(x@metadata$station) && !is.na(x@metadata$station): 'length = 1562' in coercion to 'logical(1)'>
<simpleError in !is.null(x@metadata$station) && !is.na(x@metadata$station): 'length = 1635' in coercion to 'logical(1)'>
<simpleError in !is.null(x@metadata$station) && !is.na(x@metadata$station): 'length = 2805' in coercion to 'logical(1)'>
<simpleError in !is.null(x@metadata$station) && !is.na(x@metadata$station): 'length = 2245' in coercion to 'logical(1)'>
<simpleError in !is.null(x@metadata$station) && !is.na(x@metadata$station): 'length = 4217' in coercion to 'logical(1)'>
<simpleError in !is.null(x@metadata$station) && !is.na(x@metadata$station): 'length = 4214' in coercion to 'logical(1)'>
<simpleError in !is.null(x@metadata$station) && !is.na(x@metadata$station): 'length = 3928' in coercion to 'logical(1)'>
<simpleError in !is.null(x@metadata$station) && !is.na(x@metadata$station): 'length = 7392' in coercion to 'logical(1)'>
<simpleError in !is.null(x@metadata$station) && !is.na(x@metadata$station): 'length = 3121' in coercion to 'logical(1)'>
<simpleError in !is.null(x@metadata$station) && !is.na(x@metadata$station): 'length = 4303' in coercion to 'logical(1)'>
<simpleError in !is.null(x@metadata$station) && !is.na(x@metadata$station): 'length = 4700' in coercion to 'logical(1)'>
<simpleError in !is.null(x@metadata$station) && !is.na(x@metadata$station): 'length = 3370' in coercion to 'logical(1)'>
<simpleError in !is.null(x@metadata$station) && !is.na(x@metadata$station): 'length = 2651' in coercion to 'logical(1)'>
<simpleError in !is.null(x@metadata$station) && !is.na(x@metadata$station): 'length = 2801' in coercion to 'logical(1)'>
<simpleError in !is.null(x@metadata$station) && !is.na(x@metadata$station): 'length = 3874' in coercion to 'logical(1)'>
<simpleError in !is.null(x@metadata$station) && !is.na(x@metadata$station): 'length = 3963' in coercion to 'logical(1)'>
<simpleError in !is.null(x@metadata$station) && !is.na(x@metadata$station): 'length = 2323' in coercion to 'logical(1)'>
<simpleError in !is.null(x@metadata$station) && !is.na(x@metadata$station): 'length = 4822' in coercion to 'logical(1)'>
<simpleError in !is.null(x@metadata$station) && !is.na(x@metadata$station): 'length = 3170' in coercion to 'logical(1)'>
<simpleError in !is.null(x@metadata$station) && !is.na(x@metadata$station): 'length = 4540' in coercion to 'logical(1)'>
<simpleError in !is.null(x@metadata$station) && !is.na(x@metadata$station): 'length = 4601' in coercion to 'logical(1)'>
<simpleError in !is.null(x@metadata$station) && !is.na(x@metadata$station): 'length = 3469' in coercion to 'logical(1)'>
<simpleError in !is.null(x@metadata$station) && !is.na(x@metadata$station): 'length = 2930' in coercion to 'logical(1)'>
<simpleError in !is.null(x@metadata$station) && !is.na(x@metadata$station): 'length = 1884' in coercion to 'logical(1)'>
<simpleError in !is.null(x@metadata$station) && !is.na(x@metadata$station): 'length = 2402' in coercion to 'logical(1)'>
<simpleError in !is.null(x@metadata$station) && !is.na(x@metadata$station): 'length = 3724' in coercion to 'logical(1)'>
<simpleError in !is.null(x@metadata$station) && !is.na(x@metadata$station): 'length = 3053' in coercion to 'logical(1)'>
<simpleError in !is.null(x@metadata$station) && !is.na(x@metadata$station): 'length = 3052' in coercion to 'logical(1)'>
<simpleError in !is.null(x@metadata$station) && !is.na(x@metadata$station): 'length = 3528' in coercion to 'logical(1)'>
<simpleError in !is.null(x@metadata$station) && !is.na(x@metadata$station): 'length = 3960' in coercion to 'logical(1)'>
<simpleError in !is.null(x@metadata$station) && !is.na(x@metadata$station): 'length = 3316' in coercion to 'logical(1)'>
<simpleError in !is.null(x@metadata$station) && !is.na(x@metadata$station): 'length = 3725' in coercion to 'logical(1)'>
<simpleError in !is.null(x@metadata$station) && !is.na(x@metadata$station): 'length = 3542' in coercion to 'logical(1)'>
<simpleError in !is.null(x@metadata$station) && !is.na(x@metadata$station): 'length = 3899' in coercion to 'logical(1)'>
<simpleError in !is.null(x@metadata$station) && !is.na(x@metadata$station): 'length = 3363' in coercion to 'logical(1)'>
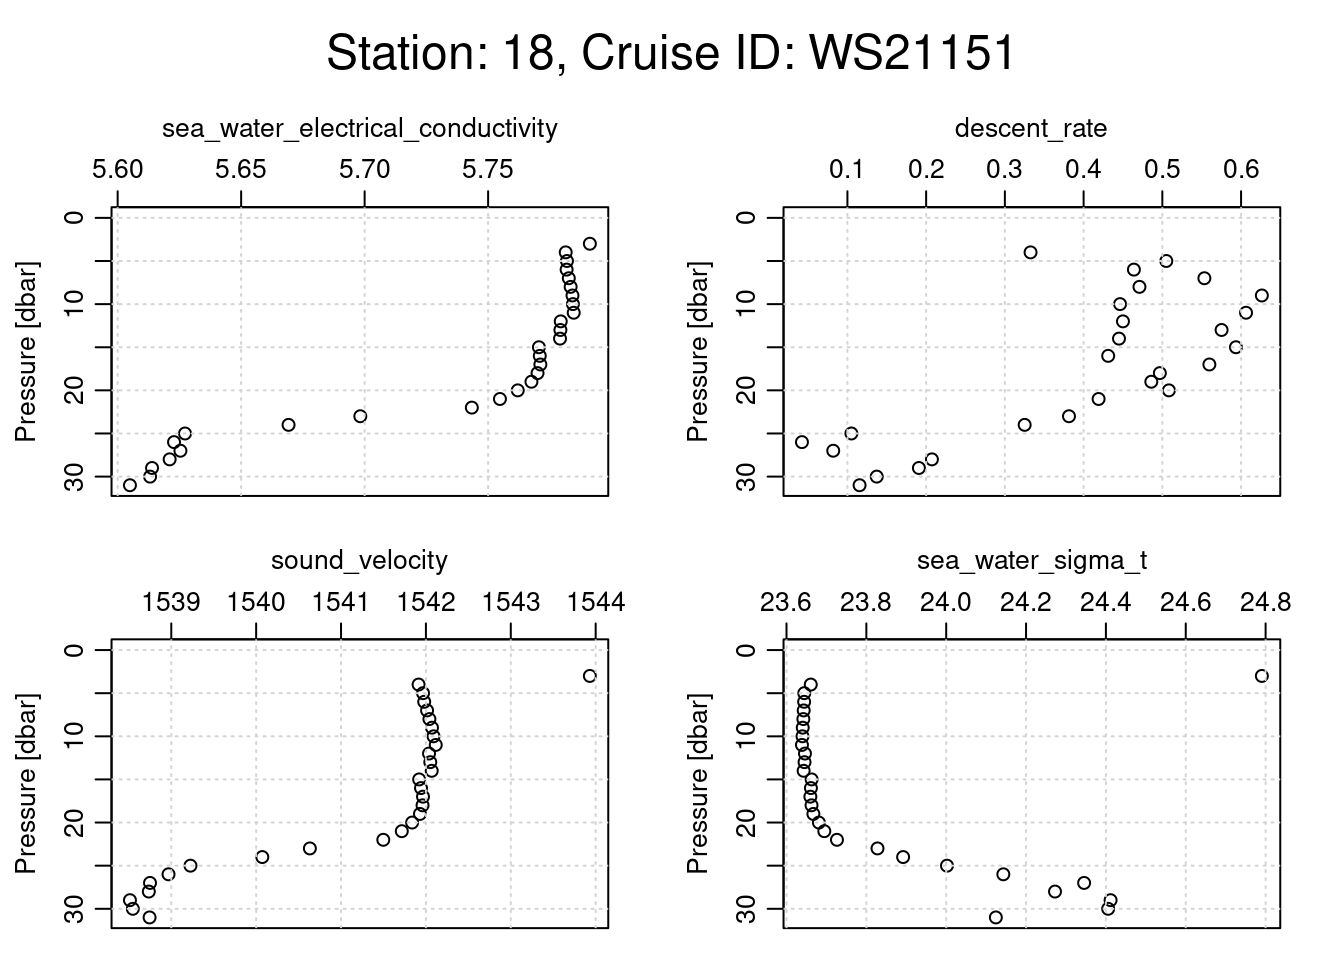
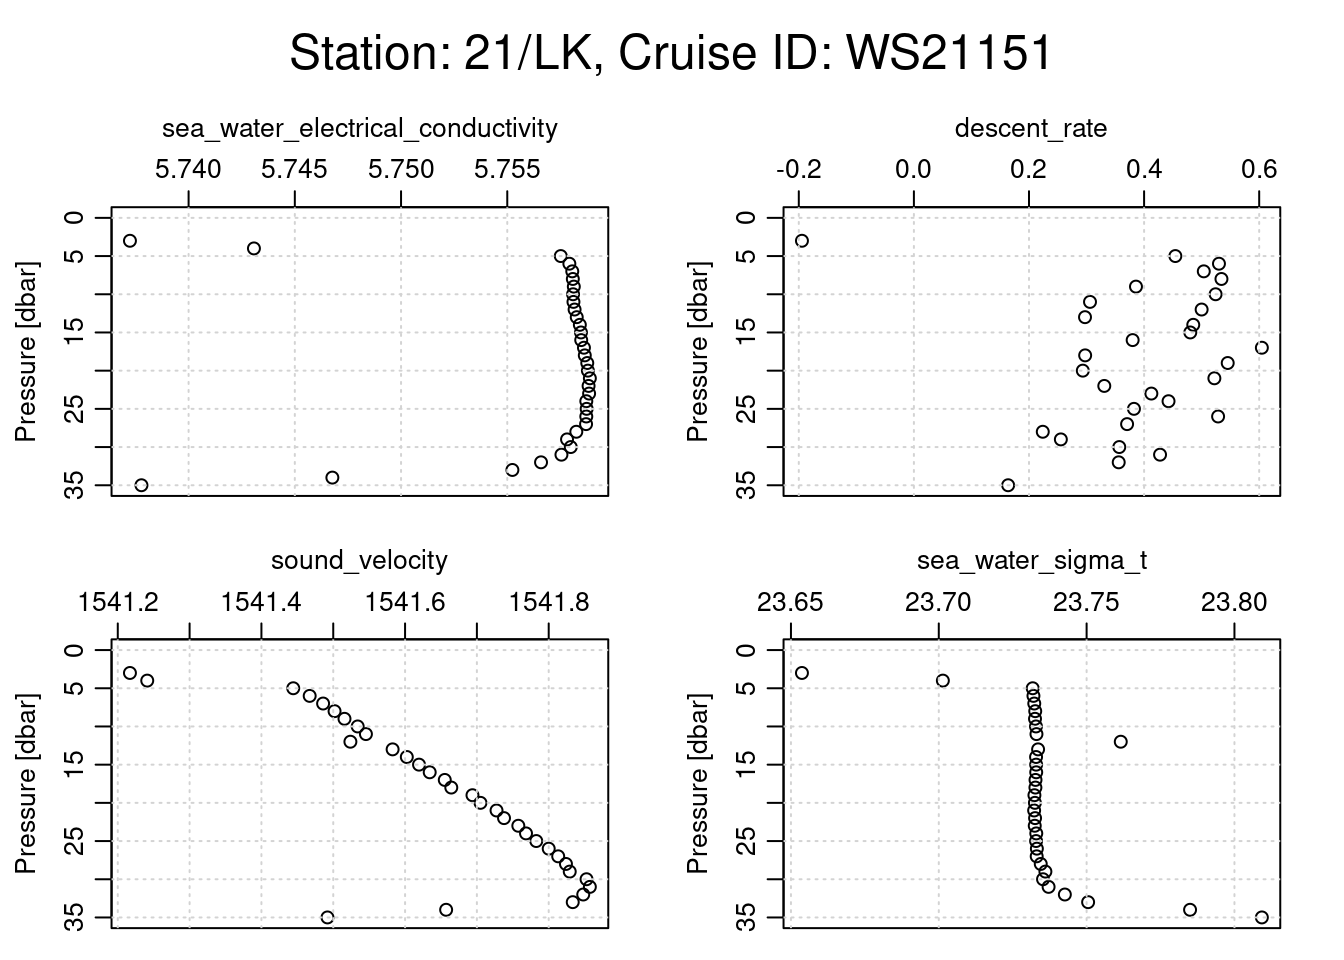
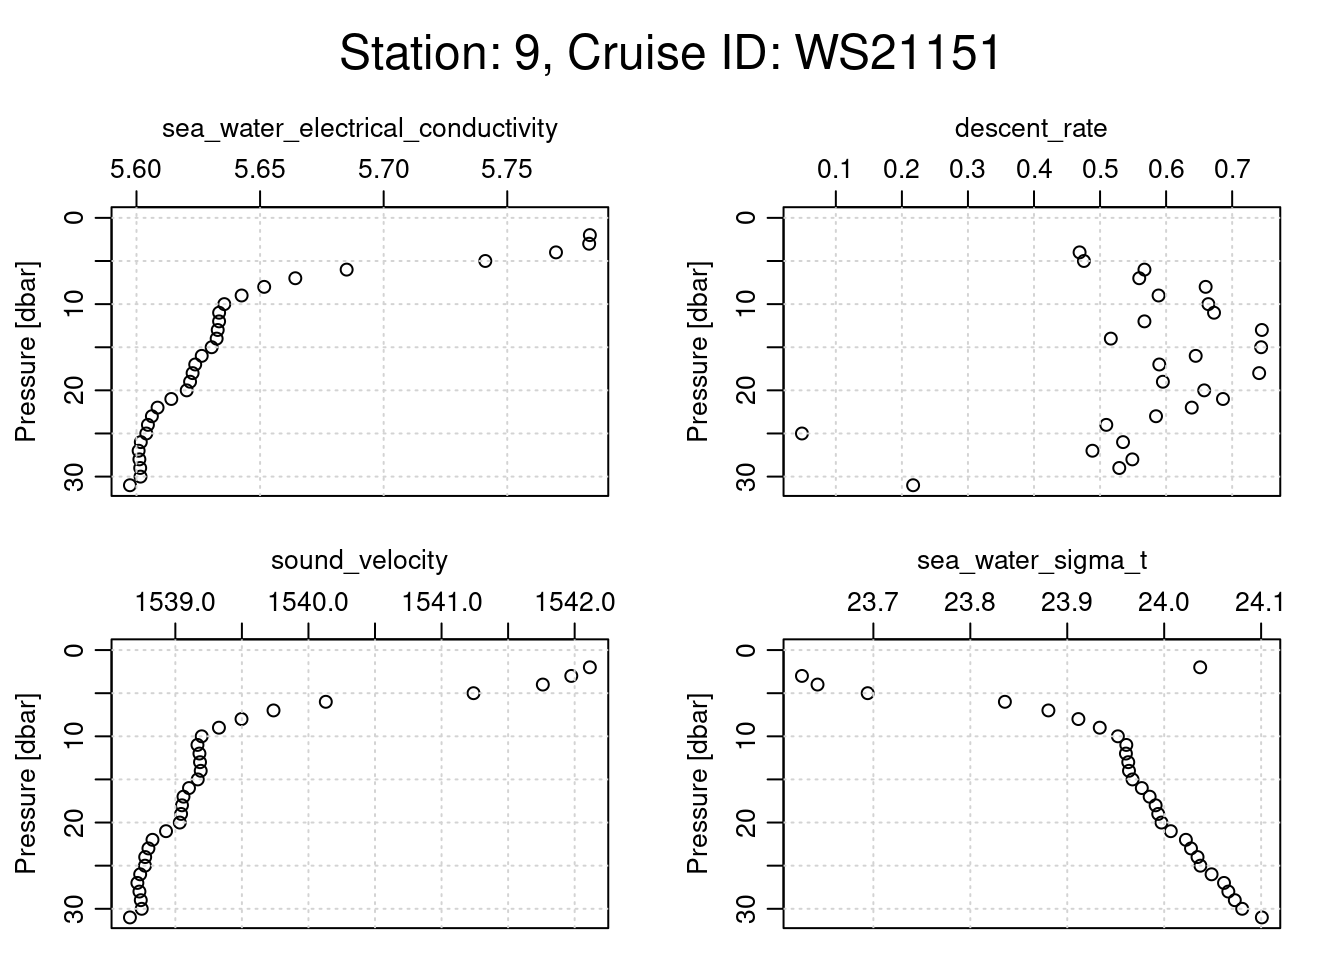
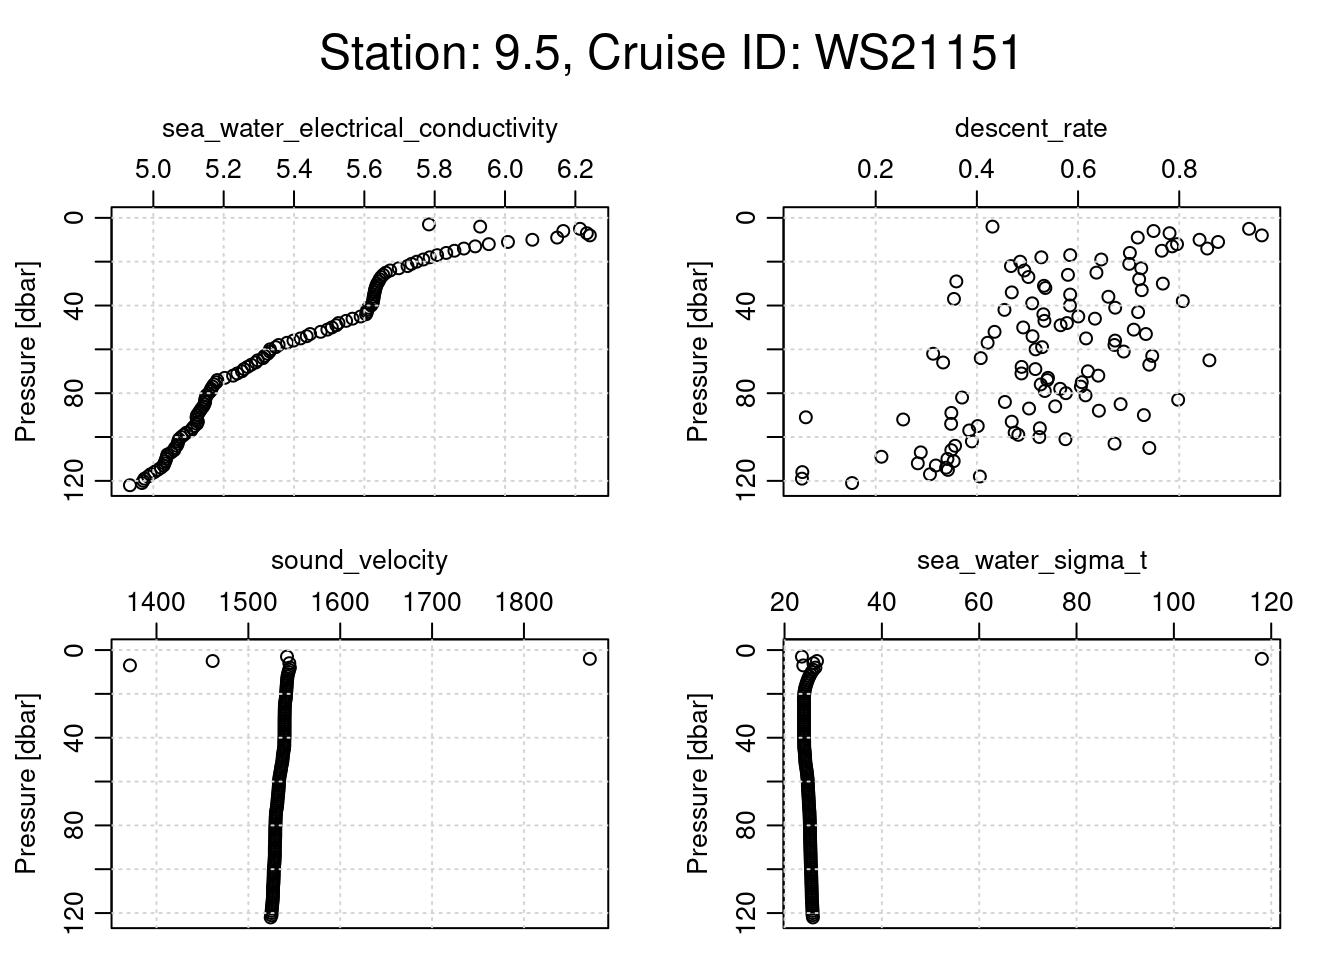
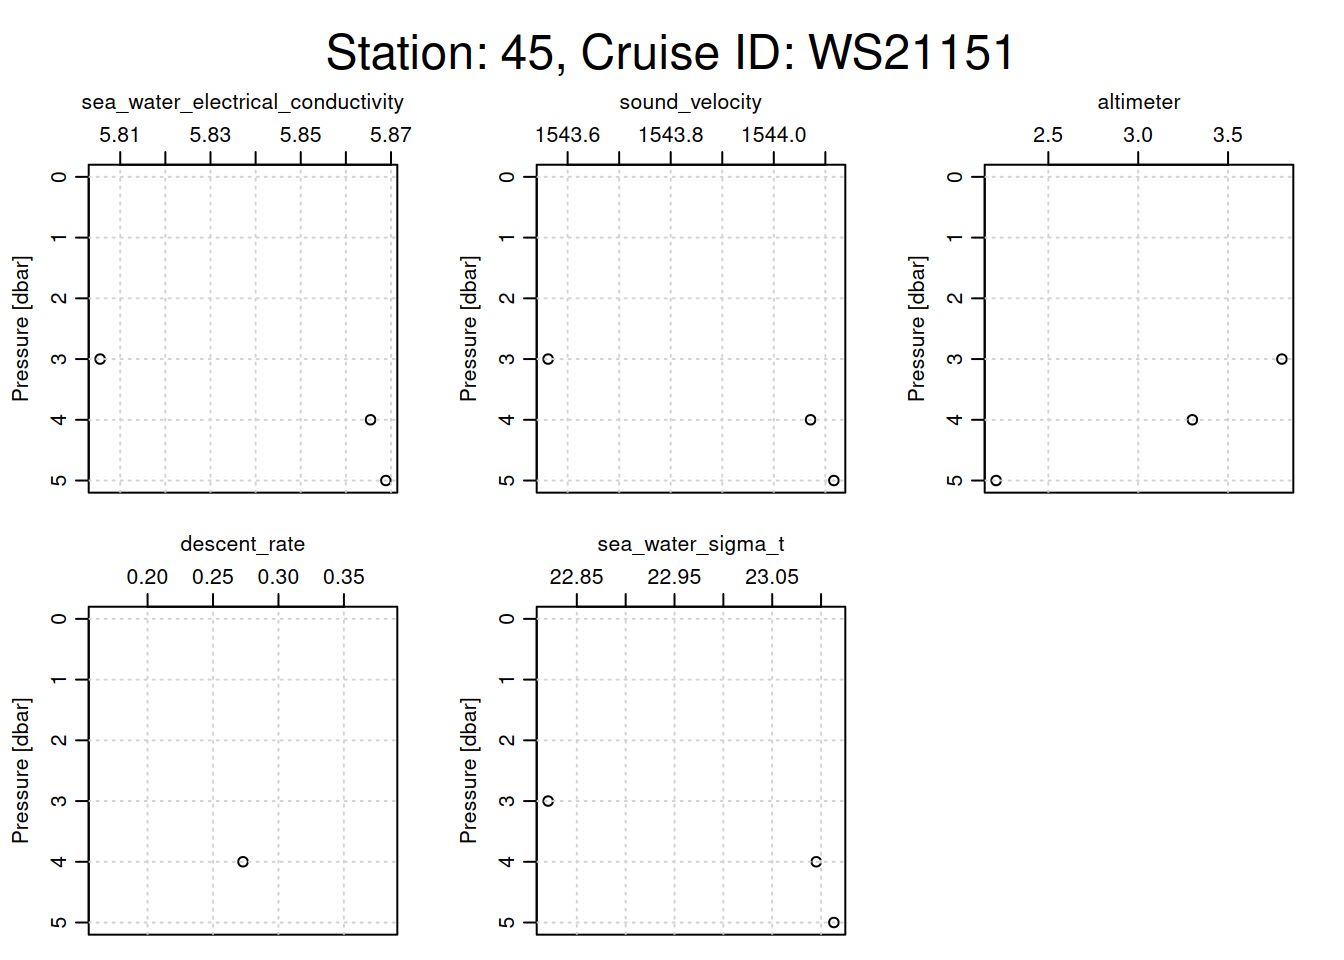
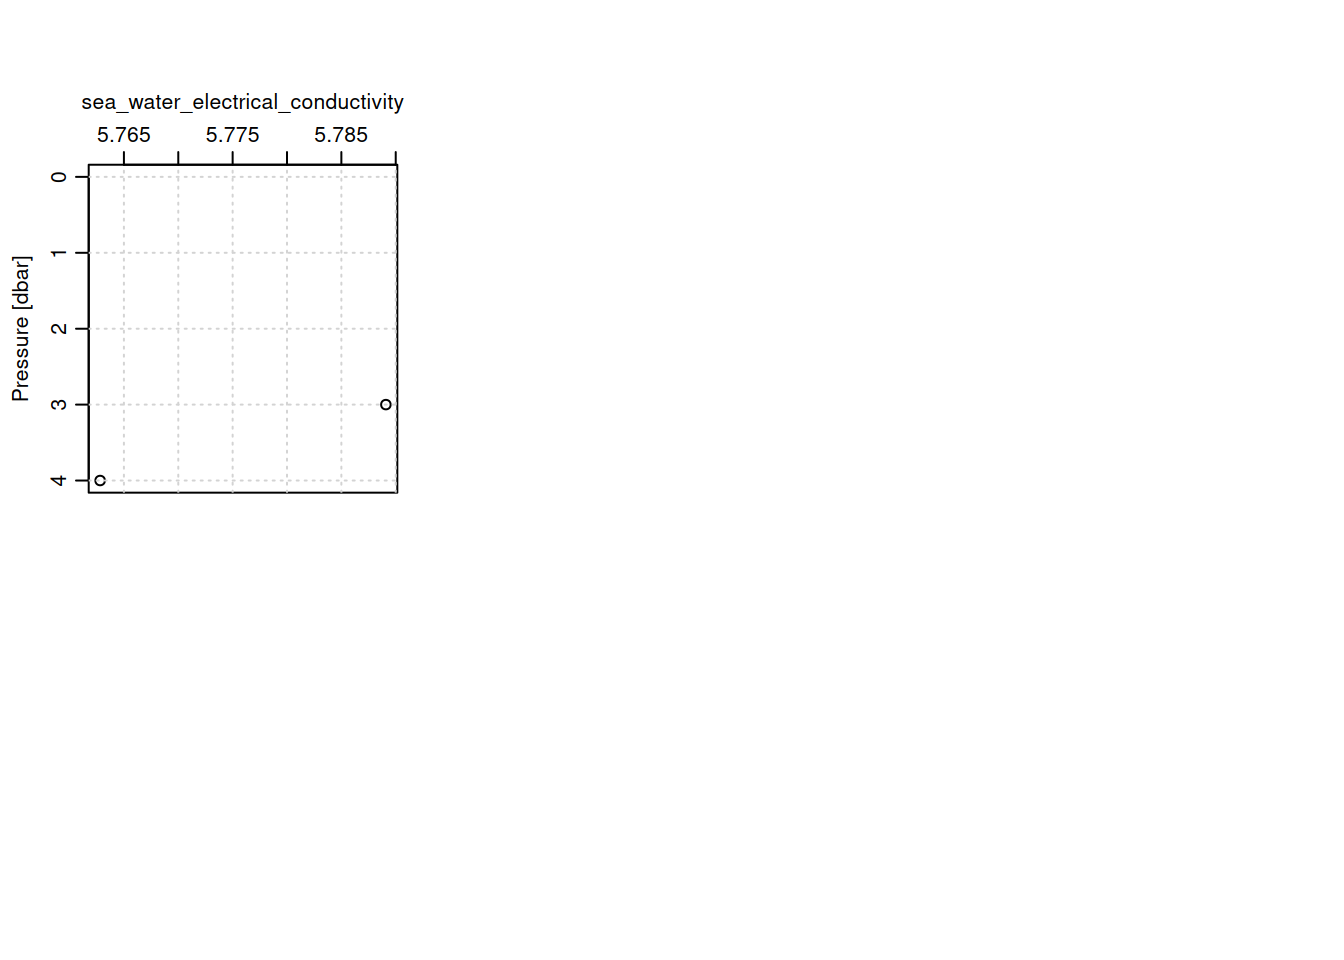
plotting other physical parameters for each cast
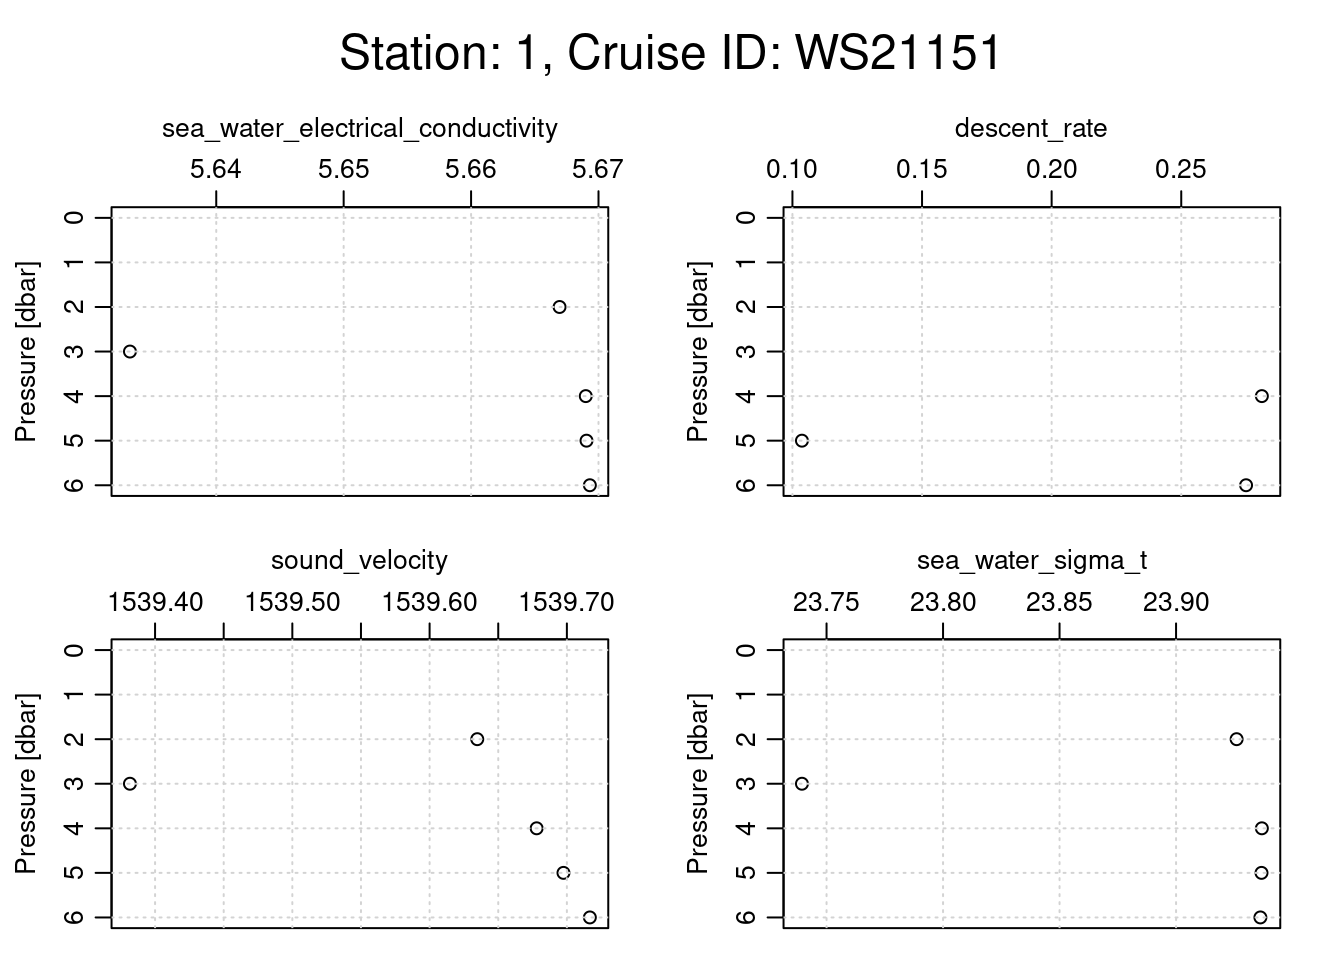
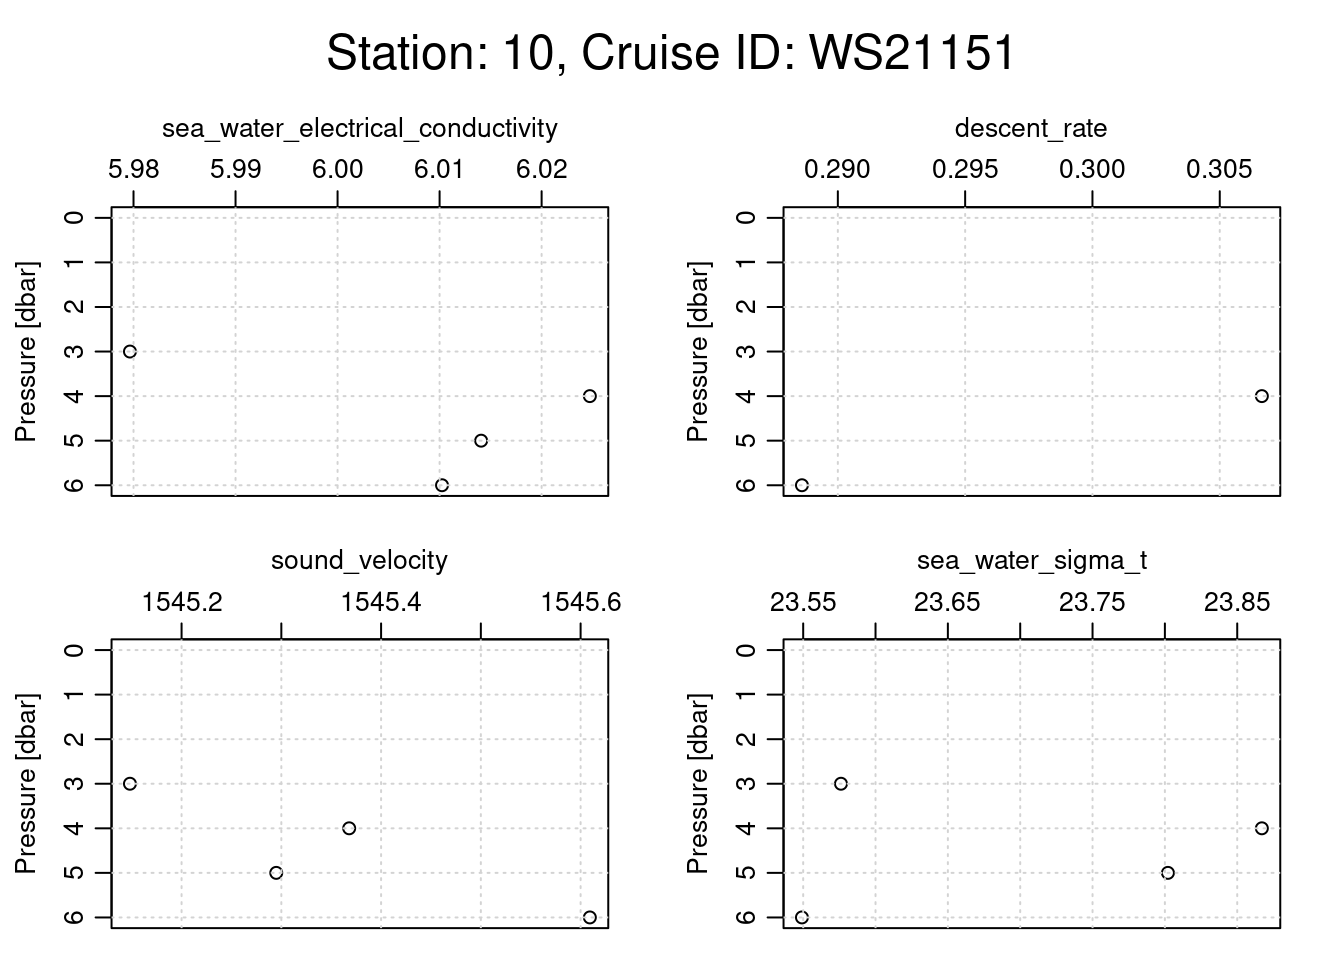
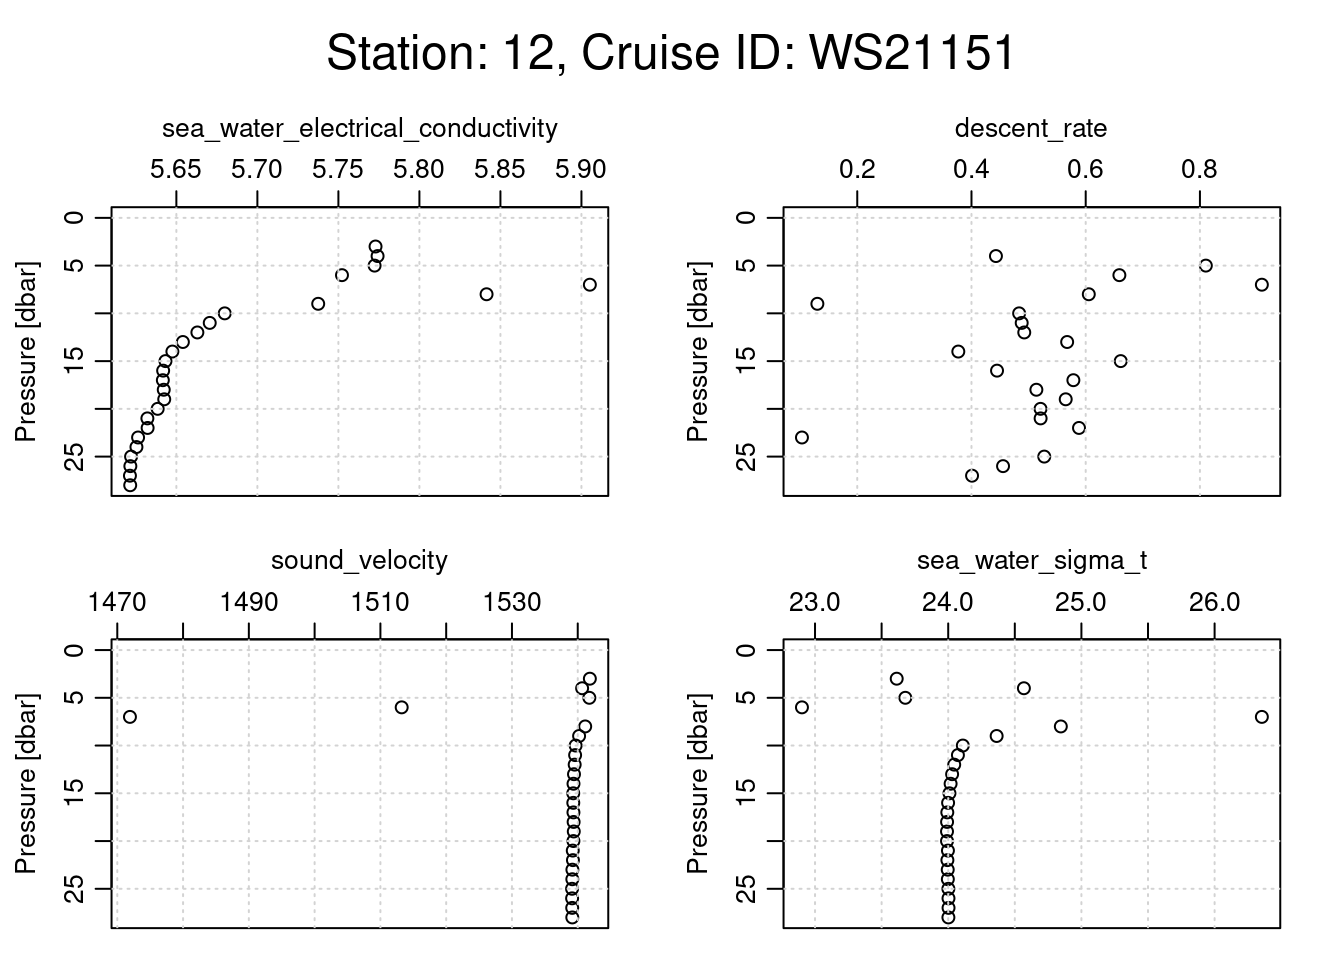
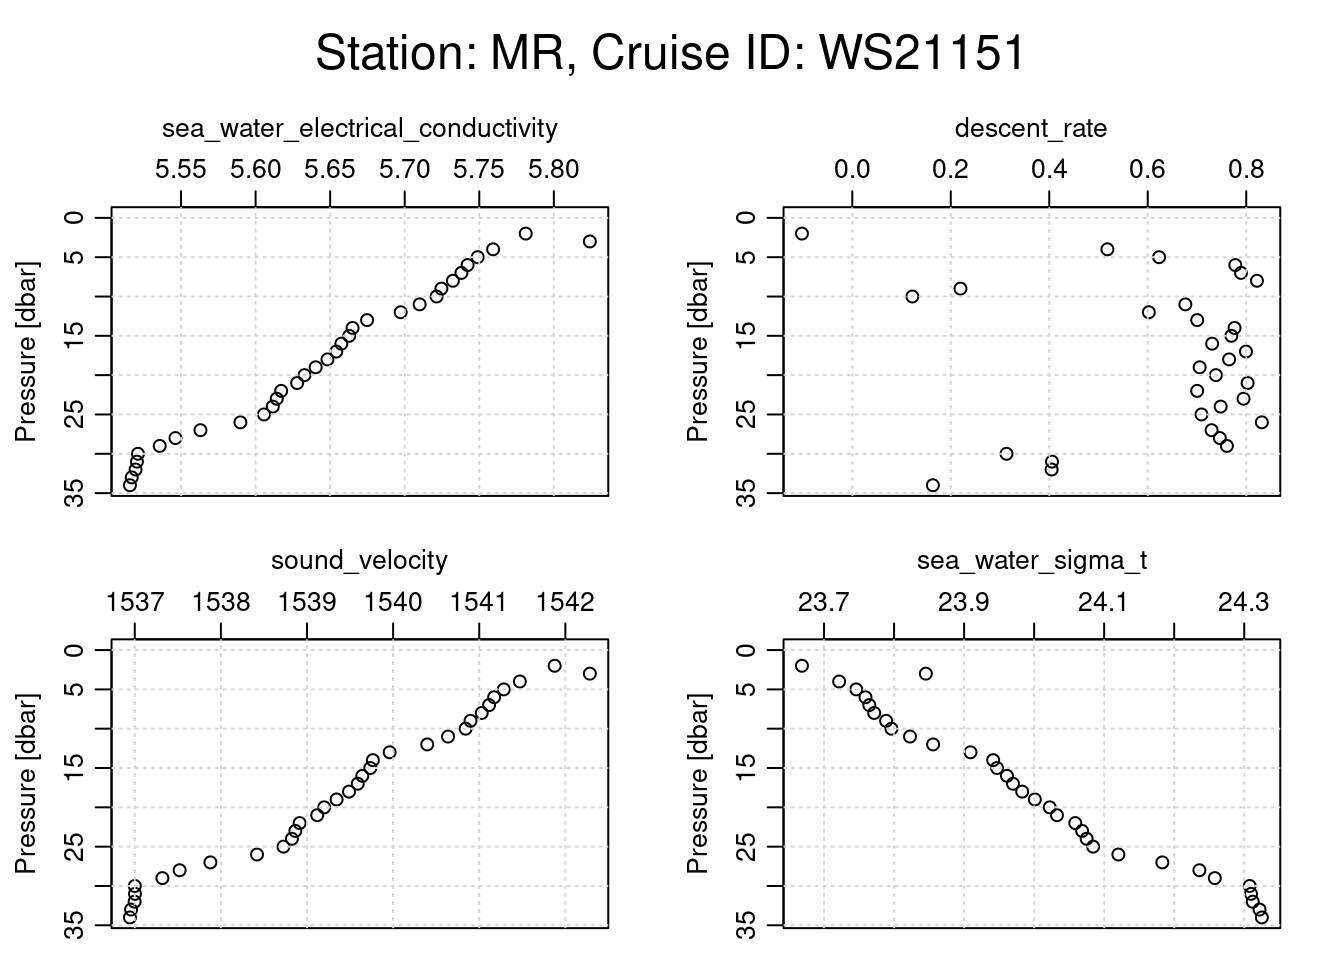
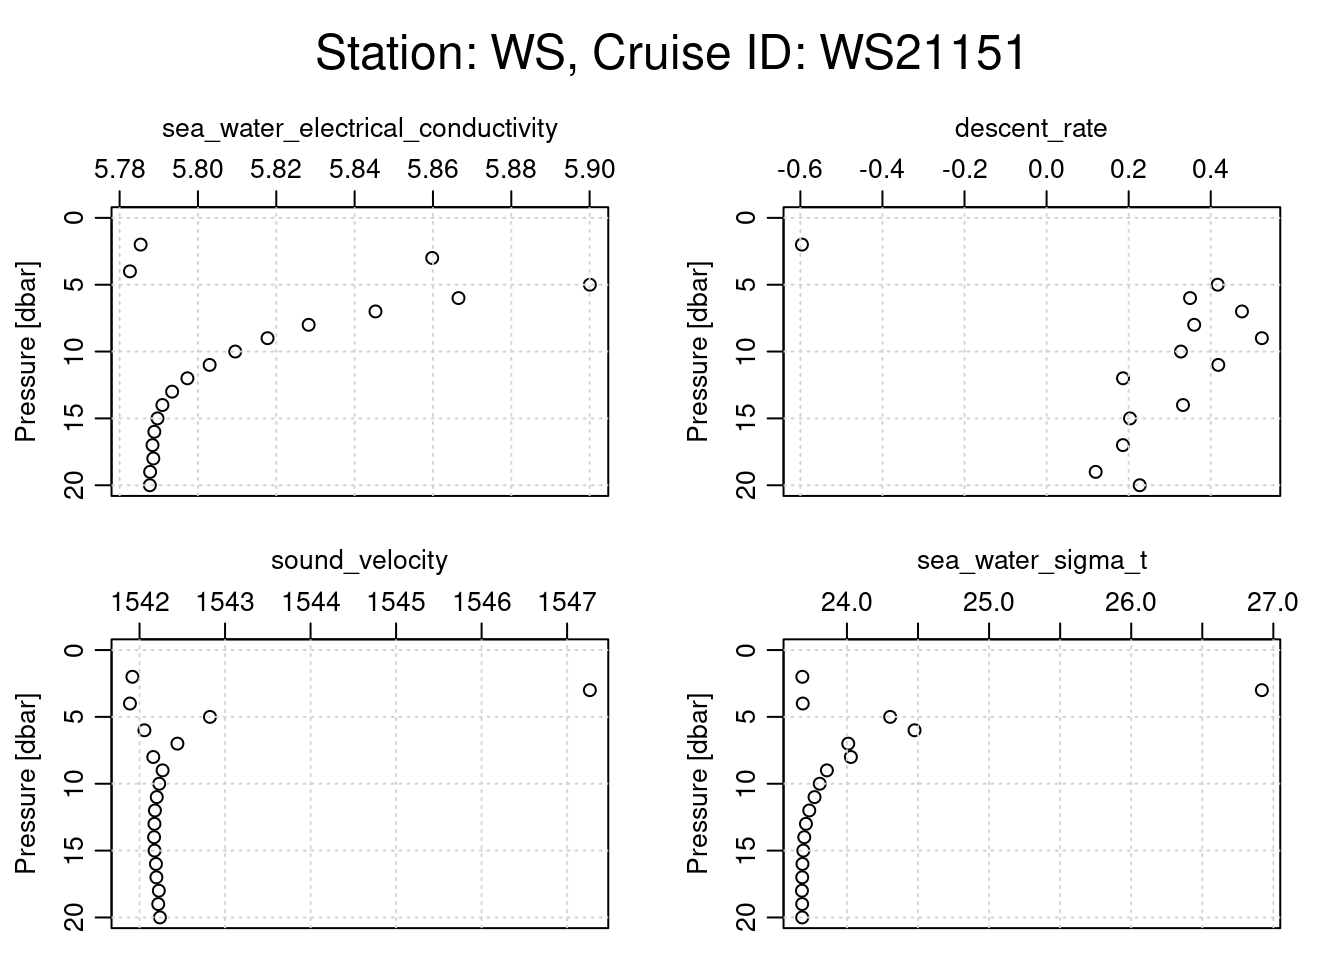
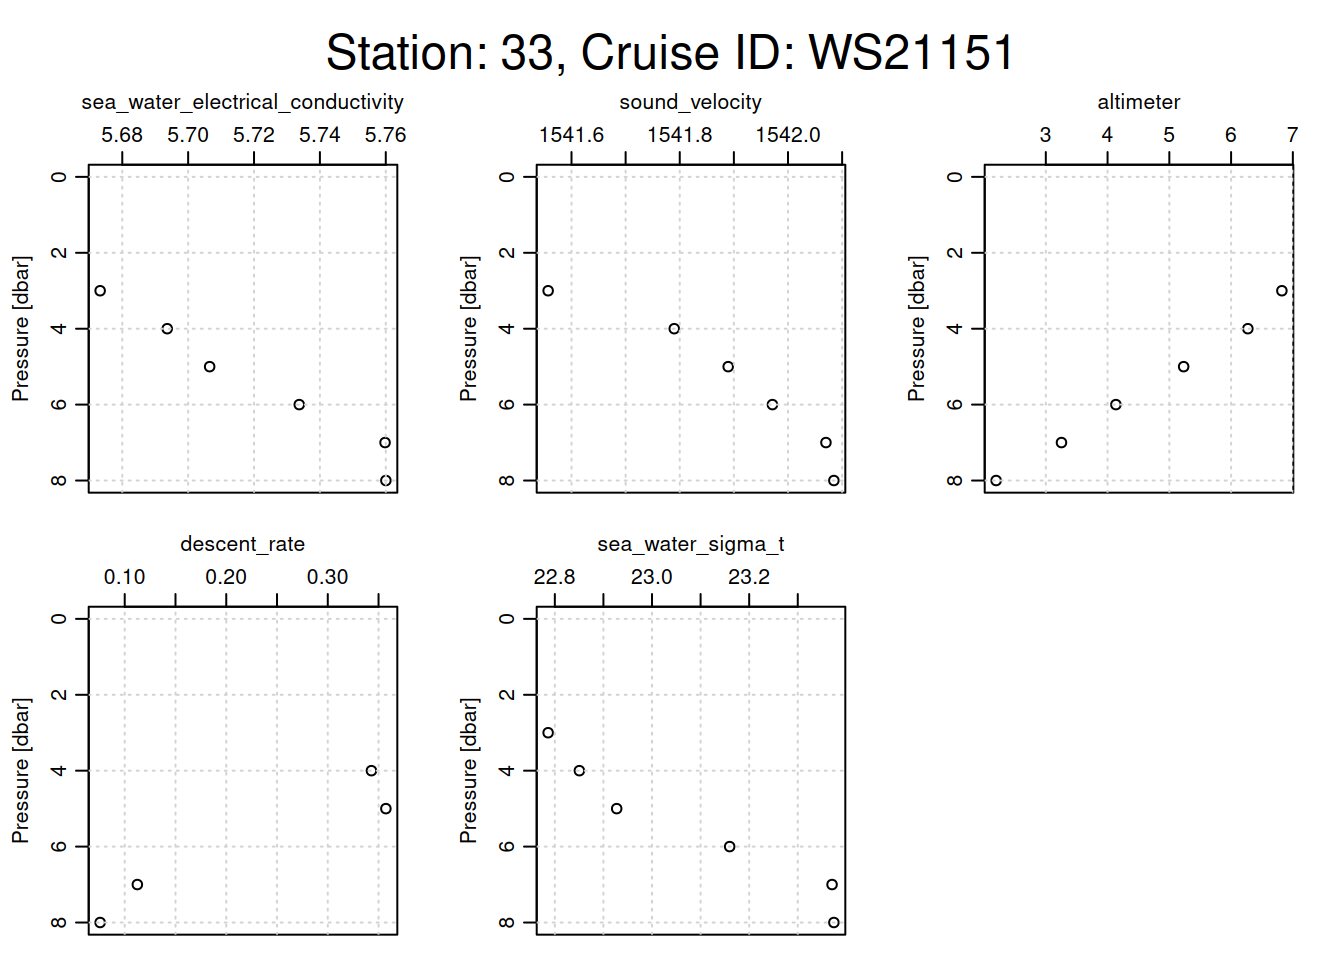
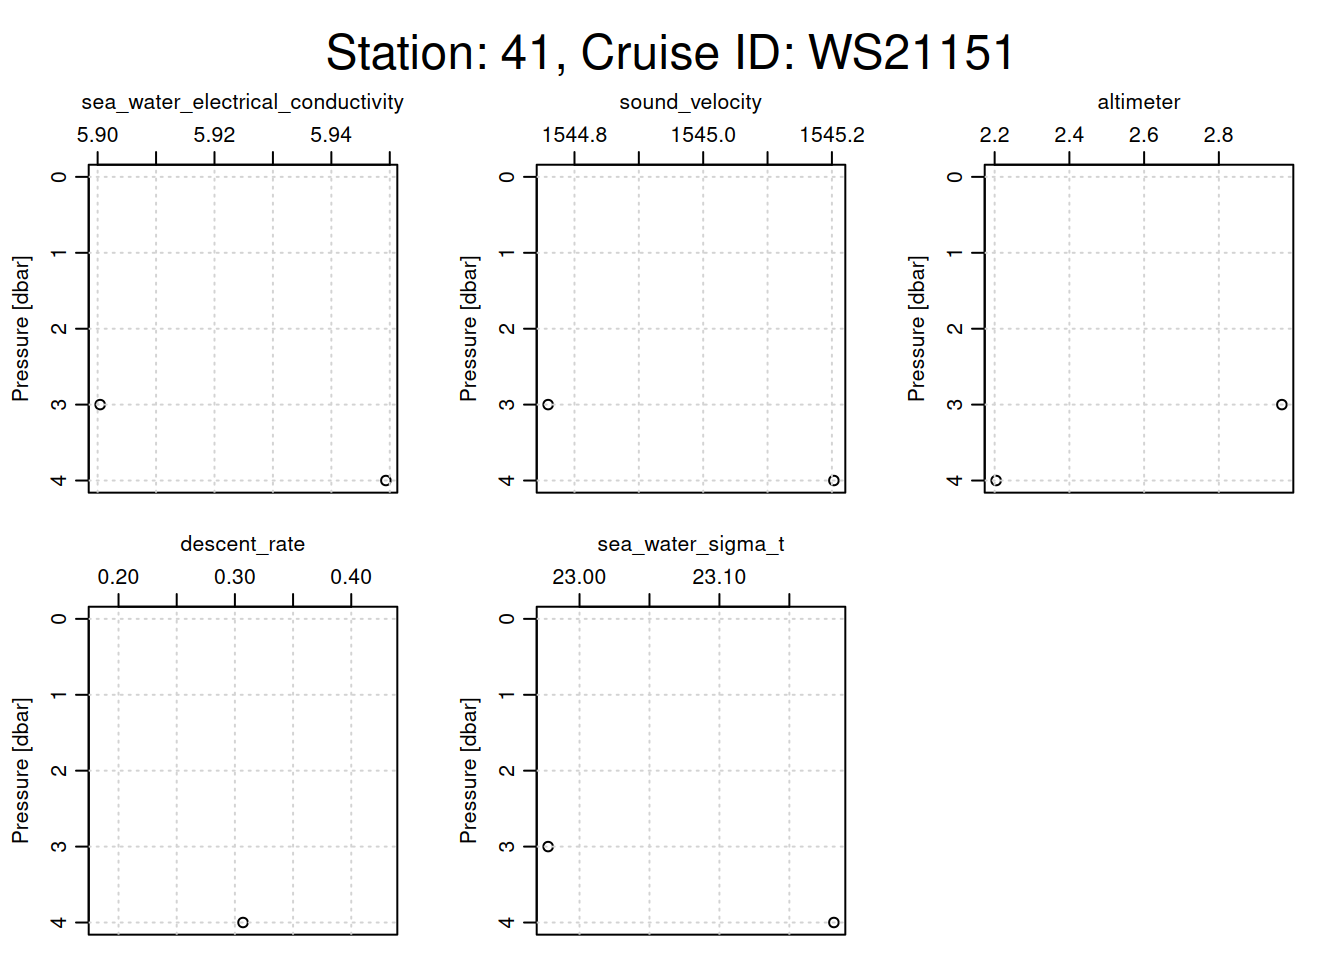
# Loop through each CTD castfor (i inseq(ctd_FK)){ cast <- ctd_FK[[i]] # Assuming each sublist contains only one relevant CTD objecttryCatch({# Extract metadata for station name and cruise ID station_name <- cast@metadata$station[1] cruise_id <- cast@data$cruise_id[1]# Generate a title with station name and cruise ID overall_title <- glue::glue("Station: {station_name}, Cruise ID: {cruise_id}")# Set margins: increase the outer margin for the titlepar(oma =c(0, 0, 3, 0)) # Top outer margin increased for title# Plotting function with specific parameters oce::plot(x =ctdDecimate(ctdTrim(cast)),which =c("sea_water_electrical_conductivity","descent_rate", "sound_velocity","sea_water_sigma_t","altimeter" ),main =""# No main title for individual subplots )# Place a single overall title at the top of the plot framemtext(overall_title, side =3, line =1, outer =TRUE, cex =1.5)# Reset outer margins to defaultpar(oma =c(0, 0, 0, 0)) }, error =function(e) {print(e$message) # Print any errors that occur during plotting })}
[1] "need finite 'xlim' values"
[1] "unknown xtype value (\"5.461893\")"
[1] "need finite 'xlim' values"
[1] "need finite 'xlim' values"
[1] "need finite 'xlim' values"
[1] "need finite 'xlim' values"
[1] "need finite 'xlim' values"
[1] "need finite 'xlim' values"
[1] "need finite 'xlim' values"
[1] "need finite 'xlim' values"
[1] "need finite 'xlim' values"
plotting other nutrient parameters for each cast
# Loop through each CTD castfor (i inseq(ctd_FK)){ cast <- ctd_FK[[i]] # Assuming each sublist contains only one relevant CTD objecttryCatch({# Extract metadata for station name and cruise ID station_name <- cast@metadata$station[1] cruise_id <- cast@data$cruise_id[1]# Generate a title with station name and cruise ID overall_title <- glue::glue("Station: {station_name}, Cruise ID: {cruise_id}")# Set margins: increase the outer margin for the titlepar(oma =c(0, 0, 3, 0)) # Top outer margin increased for title# Plotting function with specific parameters oce::plot(x =ctdDecimate(ctdTrim(cast)),which =c("CDOM", "dissolved_oxygen","oxygen_saturation","chlorophyll_concentration", "chlorophyll_fluorescence" ),main =""# No main title for individual subplots )# Place a single overall title at the top of the plot framemtext(overall_title, side =3, line =1, outer =TRUE, cex =1.5)# Reset outer margins to defaultpar(oma =c(0, 0, 0, 0)) }, error =function(e) {print(e$message) # Print any errors that occur during plotting })}
[1] "In plot,ctd-method() : which=\"CDOMdissolved_oxygenoxygen_saturationchlorophyll_concentrationchlorophyll_fluorescence\" cannot be handled"
[1] "In plot,ctd-method() : which=\"CDOMdissolved_oxygenoxygen_saturationchlorophyll_concentrationchlorophyll_fluorescence\" cannot be handled"
[1] "In plot,ctd-method() : which=\"CDOMdissolved_oxygenoxygen_saturationchlorophyll_concentrationchlorophyll_fluorescence\" cannot be handled"
[1] "In plot,ctd-method() : which=\"CDOMdissolved_oxygenoxygen_saturationchlorophyll_concentrationchlorophyll_fluorescence\" cannot be handled"
[1] "In plot,ctd-method() : which=\"CDOMdissolved_oxygenoxygen_saturationchlorophyll_concentrationchlorophyll_fluorescence\" cannot be handled"
[1] "In plot,ctd-method() : which=\"CDOMdissolved_oxygenoxygen_saturationchlorophyll_concentrationchlorophyll_fluorescence\" cannot be handled"
[1] "In plot,ctd-method() : which=\"CDOMdissolved_oxygenoxygen_saturationchlorophyll_concentrationchlorophyll_fluorescence\" cannot be handled"
[1] "In plot,ctd-method() : which=\"CDOMdissolved_oxygenoxygen_saturationchlorophyll_concentrationchlorophyll_fluorescence\" cannot be handled"
[1] "In plot,ctd-method() : which=\"CDOMdissolved_oxygenoxygen_saturationchlorophyll_concentrationchlorophyll_fluorescence\" cannot be handled"
[1] "In plot,ctd-method() : which=\"CDOMdissolved_oxygenoxygen_saturationchlorophyll_concentrationchlorophyll_fluorescence\" cannot be handled"
[1] "In plot,ctd-method() : which=\"CDOMdissolved_oxygenoxygen_saturationchlorophyll_concentrationchlorophyll_fluorescence\" cannot be handled"
[1] "In plot,ctd-method() : which=\"CDOMdissolved_oxygenoxygen_saturationchlorophyll_concentrationchlorophyll_fluorescence\" cannot be handled"
[1] "In plot,ctd-method() : which=\"CDOMdissolved_oxygenoxygen_saturationchlorophyll_concentrationchlorophyll_fluorescence\" cannot be handled"
[1] "In plot,ctd-method() : which=\"CDOMdissolved_oxygenoxygen_saturationchlorophyll_concentrationchlorophyll_fluorescence\" cannot be handled"
[1] "In plot,ctd-method() : which=\"CDOMdissolved_oxygenoxygen_saturationchlorophyll_concentrationchlorophyll_fluorescence\" cannot be handled"
[1] "plot.new has not been called yet"
[1] "In plot,ctd-method() : which=\"CDOMdissolved_oxygenoxygen_saturationchlorophyll_concentrationchlorophyll_fluorescence\" cannot be handled"
[1] "In plot,ctd-method() : which=\"CDOMdissolved_oxygenoxygen_saturationchlorophyll_concentrationchlorophyll_fluorescence\" cannot be handled"
[1] "In plot,ctd-method() : which=\"CDOMdissolved_oxygenoxygen_saturationchlorophyll_concentrationchlorophyll_fluorescence\" cannot be handled"
[1] "In plot,ctd-method() : which=\"CDOMdissolved_oxygenoxygen_saturationchlorophyll_concentrationchlorophyll_fluorescence\" cannot be handled"
[1] "In plot,ctd-method() : which=\"CDOMdissolved_oxygenoxygen_saturationchlorophyll_concentrationchlorophyll_fluorescence\" cannot be handled"
[1] "In plot,ctd-method() : which=\"CDOMdissolved_oxygenoxygen_saturationchlorophyll_concentrationchlorophyll_fluorescence\" cannot be handled"
[1] "In plot,ctd-method() : which=\"CDOMdissolved_oxygenoxygen_saturationchlorophyll_concentrationchlorophyll_fluorescence\" cannot be handled"
[1] "In plot,ctd-method() : which=\"CDOMdissolved_oxygenoxygen_saturationchlorophyll_concentrationchlorophyll_fluorescence\" cannot be handled"
[1] "In plot,ctd-method() : which=\"CDOMdissolved_oxygenoxygen_saturationchlorophyll_concentrationchlorophyll_fluorescence\" cannot be handled"
[1] "In plot,ctd-method() : which=\"CDOMdissolved_oxygenoxygen_saturationchlorophyll_concentrationchlorophyll_fluorescence\" cannot be handled"
[1] "In plot,ctd-method() : which=\"CDOMdissolved_oxygenoxygen_saturationchlorophyll_concentrationchlorophyll_fluorescence\" cannot be handled"
[1] "In plot,ctd-method() : which=\"CDOMdissolved_oxygenoxygen_saturationchlorophyll_concentrationchlorophyll_fluorescence\" cannot be handled"
[1] "In plot,ctd-method() : which=\"CDOMdissolved_oxygenoxygen_saturationchlorophyll_concentrationchlorophyll_fluorescence\" cannot be handled"
[1] "In plot,ctd-method() : which=\"CDOMdissolved_oxygenoxygen_saturationchlorophyll_concentrationchlorophyll_fluorescence\" cannot be handled"
[1] "In plot,ctd-method() : which=\"CDOMdissolved_oxygenoxygen_saturationchlorophyll_concentrationchlorophyll_fluorescence\" cannot be handled"
[1] "In plot,ctd-method() : which=\"CDOMdissolved_oxygenoxygen_saturationchlorophyll_concentrationchlorophyll_fluorescence\" cannot be handled"
[1] "In plot,ctd-method() : which=\"CDOMdissolved_oxygenoxygen_saturationchlorophyll_concentrationchlorophyll_fluorescence\" cannot be handled"
[1] "In plot,ctd-method() : which=\"CDOMdissolved_oxygenoxygen_saturationchlorophyll_concentrationchlorophyll_fluorescence\" cannot be handled"
[1] "In plot,ctd-method() : which=\"CDOMdissolved_oxygenoxygen_saturationchlorophyll_concentrationchlorophyll_fluorescence\" cannot be handled"
[1] "In plot,ctd-method() : which=\"CDOMdissolved_oxygenoxygen_saturationchlorophyll_concentrationchlorophyll_fluorescence\" cannot be handled"
[1] "In plot,ctd-method() : which=\"CDOMdissolved_oxygenoxygen_saturationchlorophyll_concentrationchlorophyll_fluorescence\" cannot be handled"
[1] "In plot,ctd-method() : which=\"CDOMdissolved_oxygenoxygen_saturationchlorophyll_concentrationchlorophyll_fluorescence\" cannot be handled"
[1] "In plot,ctd-method() : which=\"CDOMdissolved_oxygenoxygen_saturationchlorophyll_concentrationchlorophyll_fluorescence\" cannot be handled"
[1] "In plot,ctd-method() : which=\"CDOMdissolved_oxygenoxygen_saturationchlorophyll_concentrationchlorophyll_fluorescence\" cannot be handled"
[1] "In plot,ctd-method() : which=\"CDOMdissolved_oxygenoxygen_saturationchlorophyll_concentrationchlorophyll_fluorescence\" cannot be handled"
[1] "In plot,ctd-method() : which=\"CDOMdissolved_oxygenoxygen_saturationchlorophyll_concentrationchlorophyll_fluorescence\" cannot be handled"
[1] "In plot,ctd-method() : which=\"CDOMdissolved_oxygenoxygen_saturationchlorophyll_concentrationchlorophyll_fluorescence\" cannot be handled"
[1] "In plot,ctd-method() : which=\"CDOMdissolved_oxygenoxygen_saturationchlorophyll_concentrationchlorophyll_fluorescence\" cannot be handled"
[1] "In plot,ctd-method() : which=\"CDOMdissolved_oxygenoxygen_saturationchlorophyll_concentrationchlorophyll_fluorescence\" cannot be handled"
[1] "In plot,ctd-method() : which=\"CDOMdissolved_oxygenoxygen_saturationchlorophyll_concentrationchlorophyll_fluorescence\" cannot be handled"
[1] "In plot,ctd-method() : which=\"CDOMdissolved_oxygenoxygen_saturationchlorophyll_concentrationchlorophyll_fluorescence\" cannot be handled"
[1] "In plot,ctd-method() : which=\"CDOMdissolved_oxygenoxygen_saturationchlorophyll_concentrationchlorophyll_fluorescence\" cannot be handled"
[1] "In plot,ctd-method() : which=\"CDOMdissolved_oxygenoxygen_saturationchlorophyll_concentrationchlorophyll_fluorescence\" cannot be handled"
[1] "In plot,ctd-method() : which=\"CDOMdissolved_oxygenoxygen_saturationchlorophyll_concentrationchlorophyll_fluorescence\" cannot be handled"
[1] "In plot,ctd-method() : which=\"CDOMdissolved_oxygenoxygen_saturationchlorophyll_concentrationchlorophyll_fluorescence\" cannot be handled"
[1] "In plot,ctd-method() : which=\"CDOMdissolved_oxygenoxygen_saturationchlorophyll_concentrationchlorophyll_fluorescence\" cannot be handled"
[1] "In plot,ctd-method() : which=\"CDOMdissolved_oxygenoxygen_saturationchlorophyll_concentrationchlorophyll_fluorescence\" cannot be handled"
[1] "In plot,ctd-method() : which=\"CDOMdissolved_oxygenoxygen_saturationchlorophyll_concentrationchlorophyll_fluorescence\" cannot be handled"
[1] "In plot,ctd-method() : which=\"CDOMdissolved_oxygenoxygen_saturationchlorophyll_concentrationchlorophyll_fluorescence\" cannot be handled"
[1] "In plot,ctd-method() : which=\"CDOMdissolved_oxygenoxygen_saturationchlorophyll_concentrationchlorophyll_fluorescence\" cannot be handled"
[1] "In plot,ctd-method() : which=\"CDOMdissolved_oxygenoxygen_saturationchlorophyll_concentrationchlorophyll_fluorescence\" cannot be handled"
[1] "In plot,ctd-method() : which=\"CDOMdissolved_oxygenoxygen_saturationchlorophyll_concentrationchlorophyll_fluorescence\" cannot be handled"
[1] "In plot,ctd-method() : which=\"CDOMdissolved_oxygenoxygen_saturationchlorophyll_concentrationchlorophyll_fluorescence\" cannot be handled"
[1] "In plot,ctd-method() : which=\"CDOMdissolved_oxygenoxygen_saturationchlorophyll_concentrationchlorophyll_fluorescence\" cannot be handled"
[1] "In plot,ctd-method() : which=\"CDOMdissolved_oxygenoxygen_saturationchlorophyll_concentrationchlorophyll_fluorescence\" cannot be handled"
[1] "In plot,ctd-method() : which=\"CDOMdissolved_oxygenoxygen_saturationchlorophyll_concentrationchlorophyll_fluorescence\" cannot be handled"
[1] "In plot,ctd-method() : which=\"CDOMdissolved_oxygenoxygen_saturationchlorophyll_concentrationchlorophyll_fluorescence\" cannot be handled"
[1] "In plot,ctd-method() : which=\"CDOMdissolved_oxygenoxygen_saturationchlorophyll_concentrationchlorophyll_fluorescence\" cannot be handled"
[1] "In plot,ctd-method() : which=\"CDOMdissolved_oxygenoxygen_saturationchlorophyll_concentrationchlorophyll_fluorescence\" cannot be handled"
[1] "In plot,ctd-method() : which=\"CDOMdissolved_oxygenoxygen_saturationchlorophyll_concentrationchlorophyll_fluorescence\" cannot be handled"
[1] "In plot,ctd-method() : which=\"CDOMdissolved_oxygenoxygen_saturationchlorophyll_concentrationchlorophyll_fluorescence\" cannot be handled"
[1] "In plot,ctd-method() : which=\"CDOMdissolved_oxygenoxygen_saturationchlorophyll_concentrationchlorophyll_fluorescence\" cannot be handled"
[1] "In plot,ctd-method() : which=\"CDOMdissolved_oxygenoxygen_saturationchlorophyll_concentrationchlorophyll_fluorescence\" cannot be handled"
[1] "In plot,ctd-method() : which=\"CDOMdissolved_oxygenoxygen_saturationchlorophyll_concentrationchlorophyll_fluorescence\" cannot be handled"
[1] "In plot,ctd-method() : which=\"CDOMdissolved_oxygenoxygen_saturationchlorophyll_concentrationchlorophyll_fluorescence\" cannot be handled"
[1] "In plot,ctd-method() : which=\"CDOMdissolved_oxygenoxygen_saturationchlorophyll_concentrationchlorophyll_fluorescence\" cannot be handled"
[1] "In plot,ctd-method() : which=\"CDOMdissolved_oxygenoxygen_saturationchlorophyll_concentrationchlorophyll_fluorescence\" cannot be handled"
[1] "In plot,ctd-method() : which=\"CDOMdissolved_oxygenoxygen_saturationchlorophyll_concentrationchlorophyll_fluorescence\" cannot be handled"
[1] "In plot,ctd-method() : which=\"CDOMdissolved_oxygenoxygen_saturationchlorophyll_concentrationchlorophyll_fluorescence\" cannot be handled"
[1] "In plot,ctd-method() : which=\"CDOMdissolved_oxygenoxygen_saturationchlorophyll_concentrationchlorophyll_fluorescence\" cannot be handled"
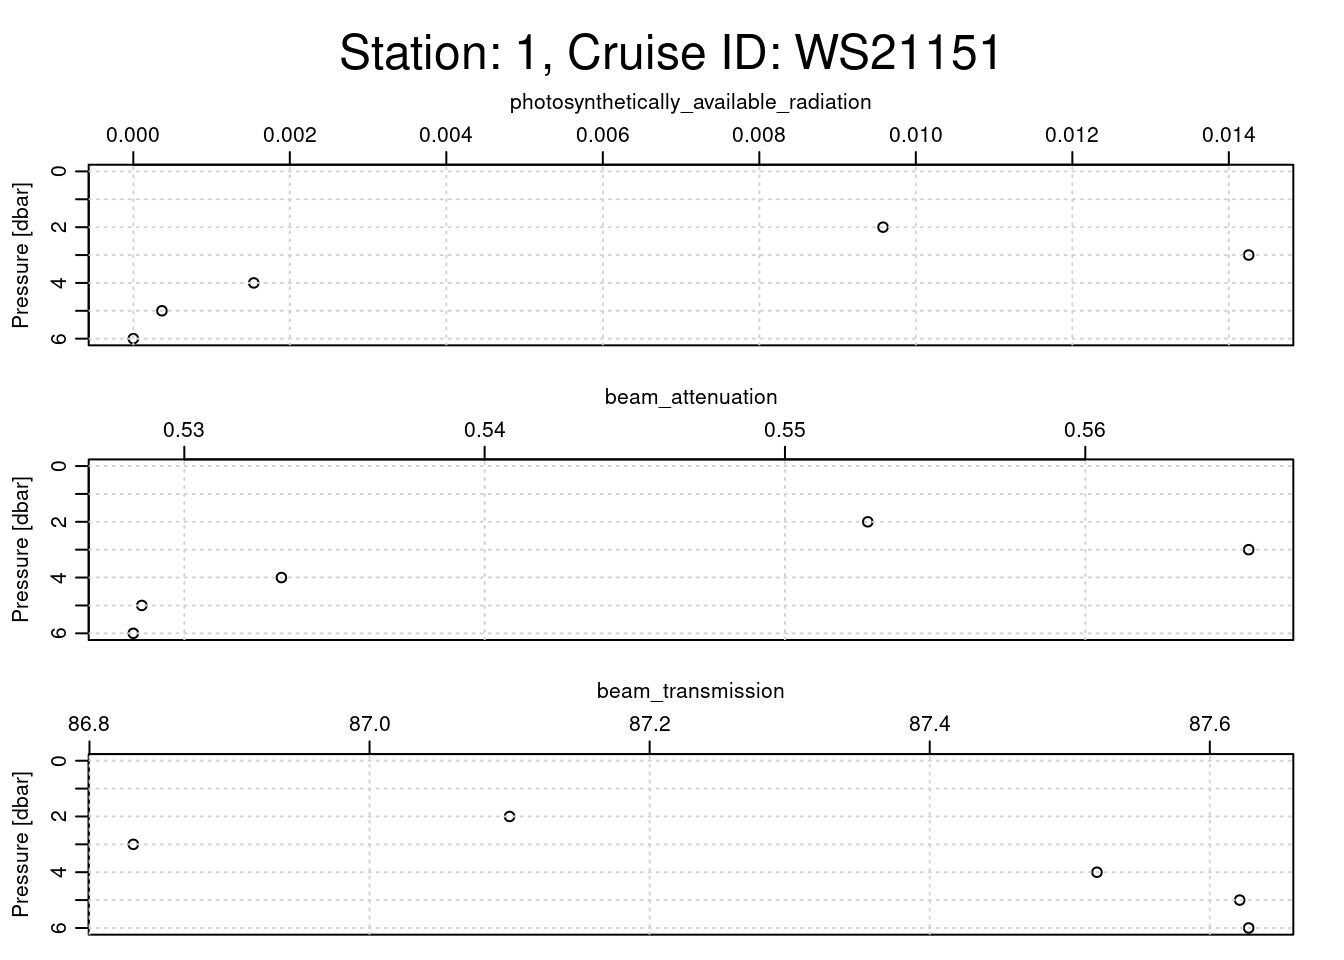
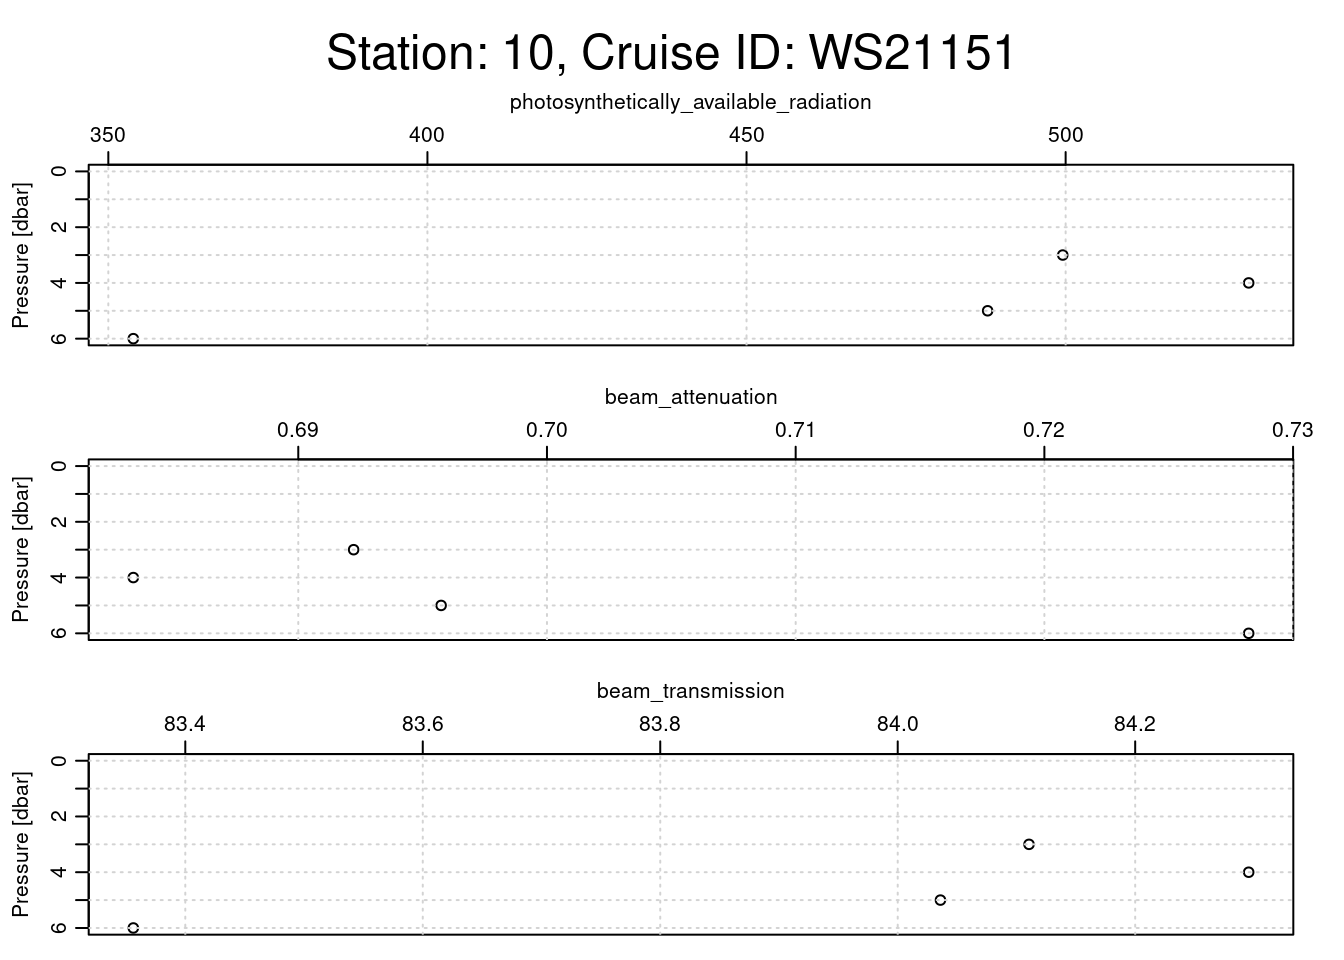
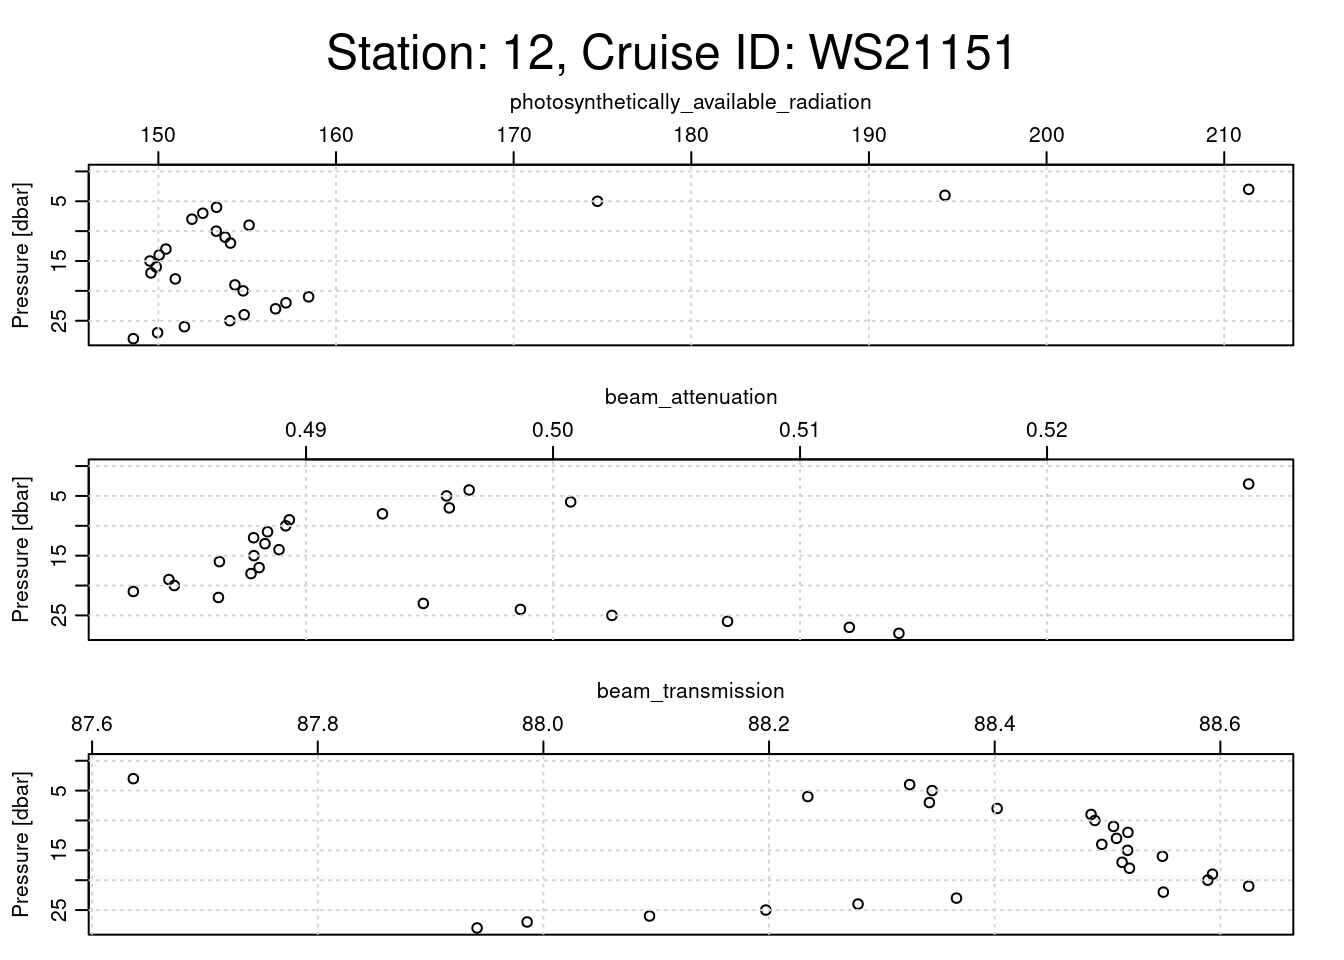
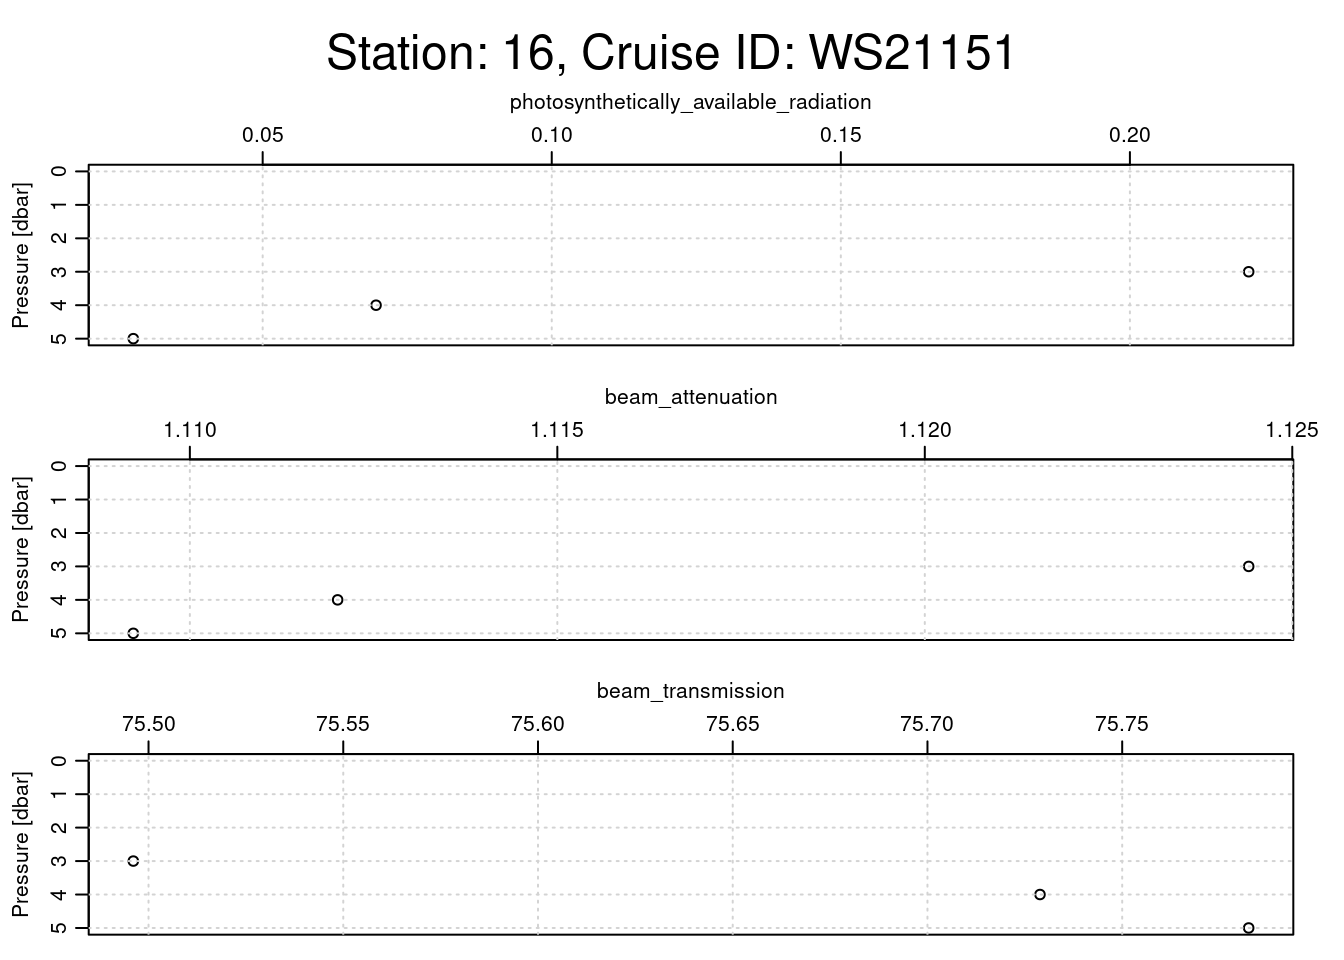
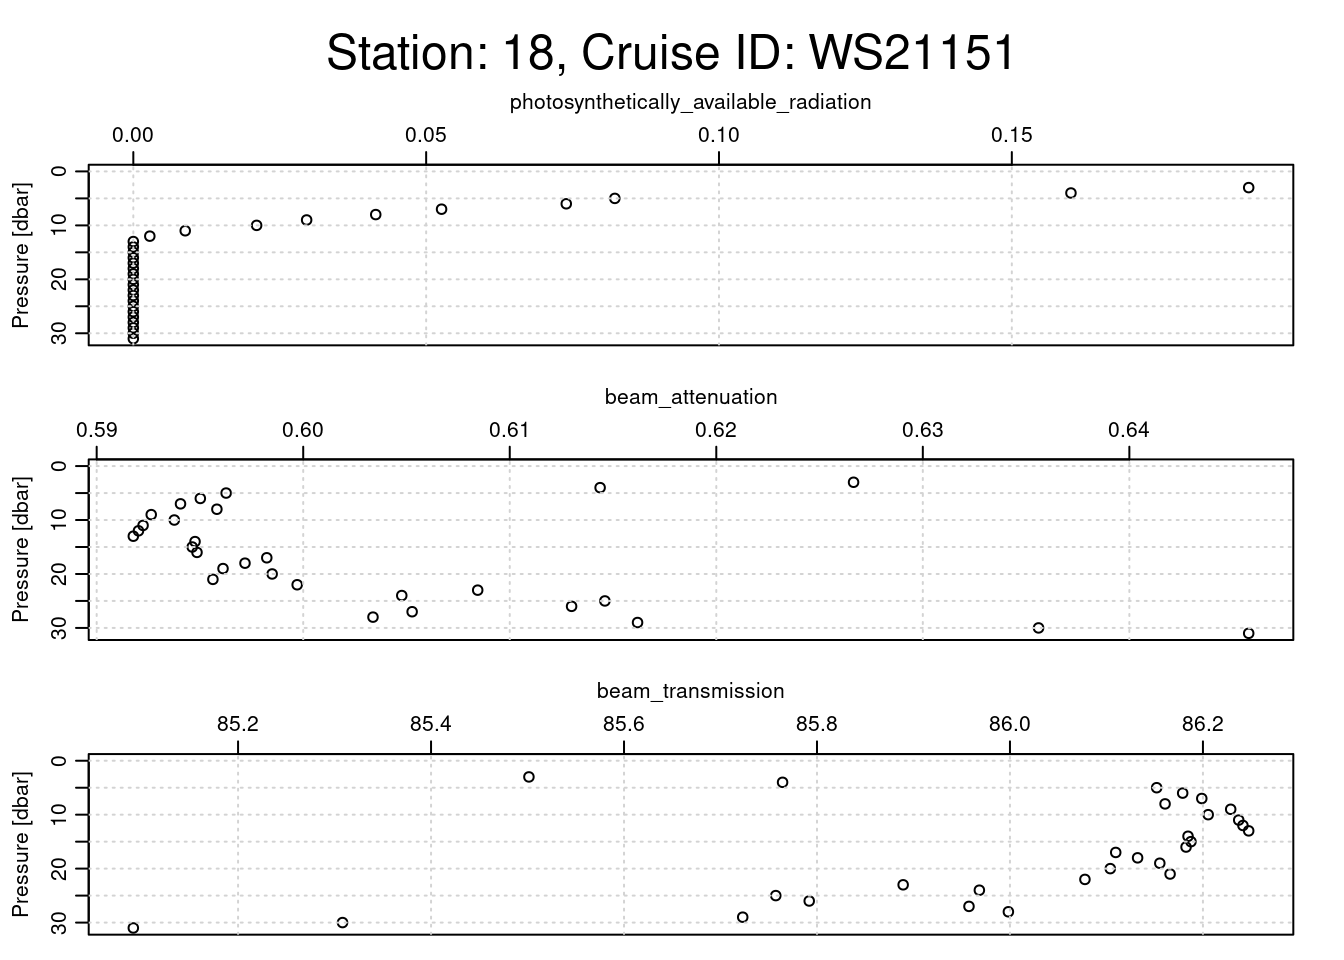
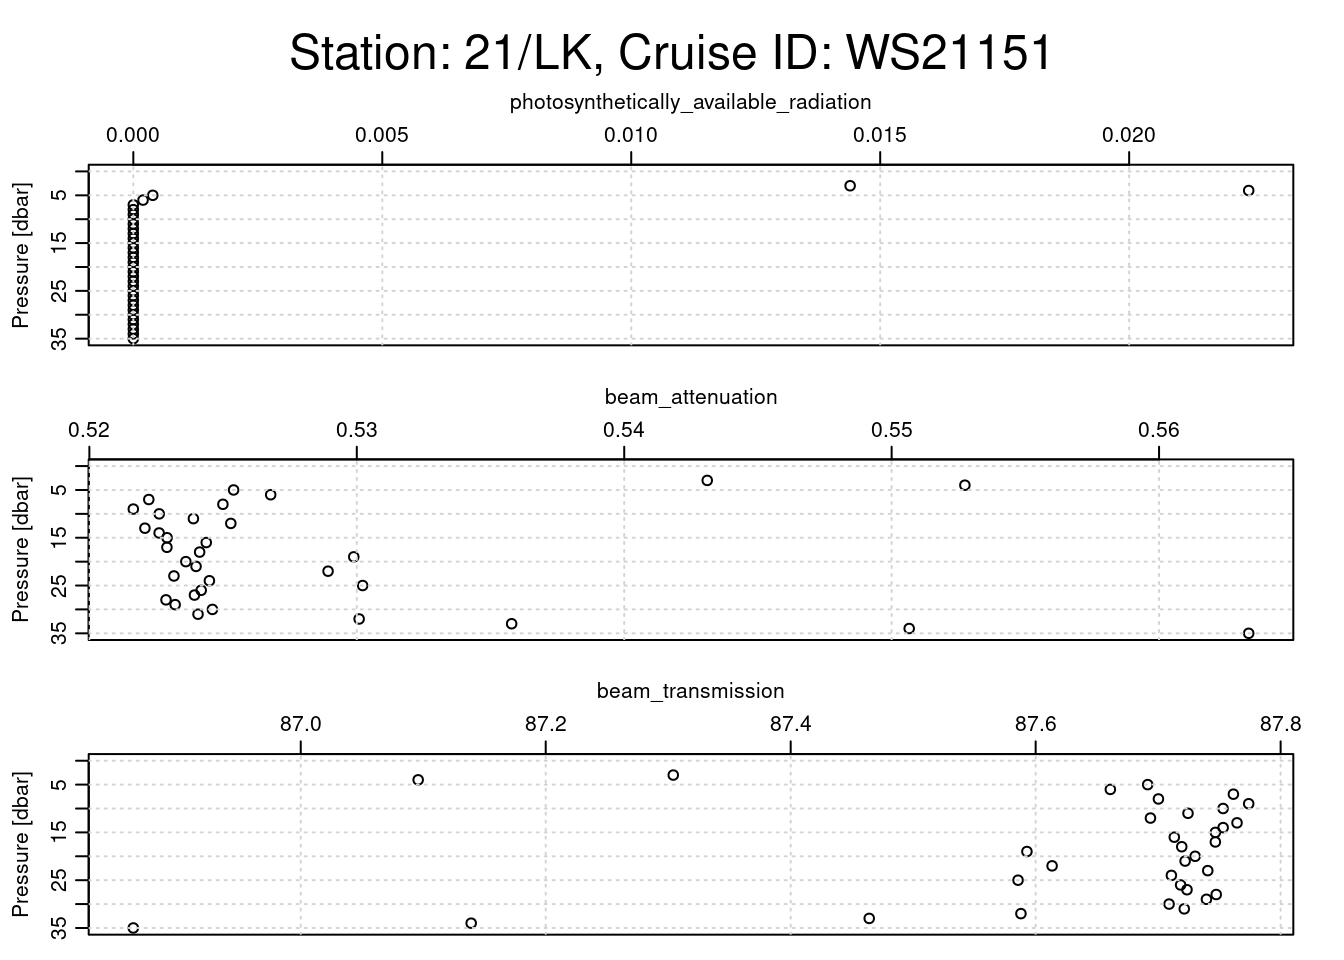
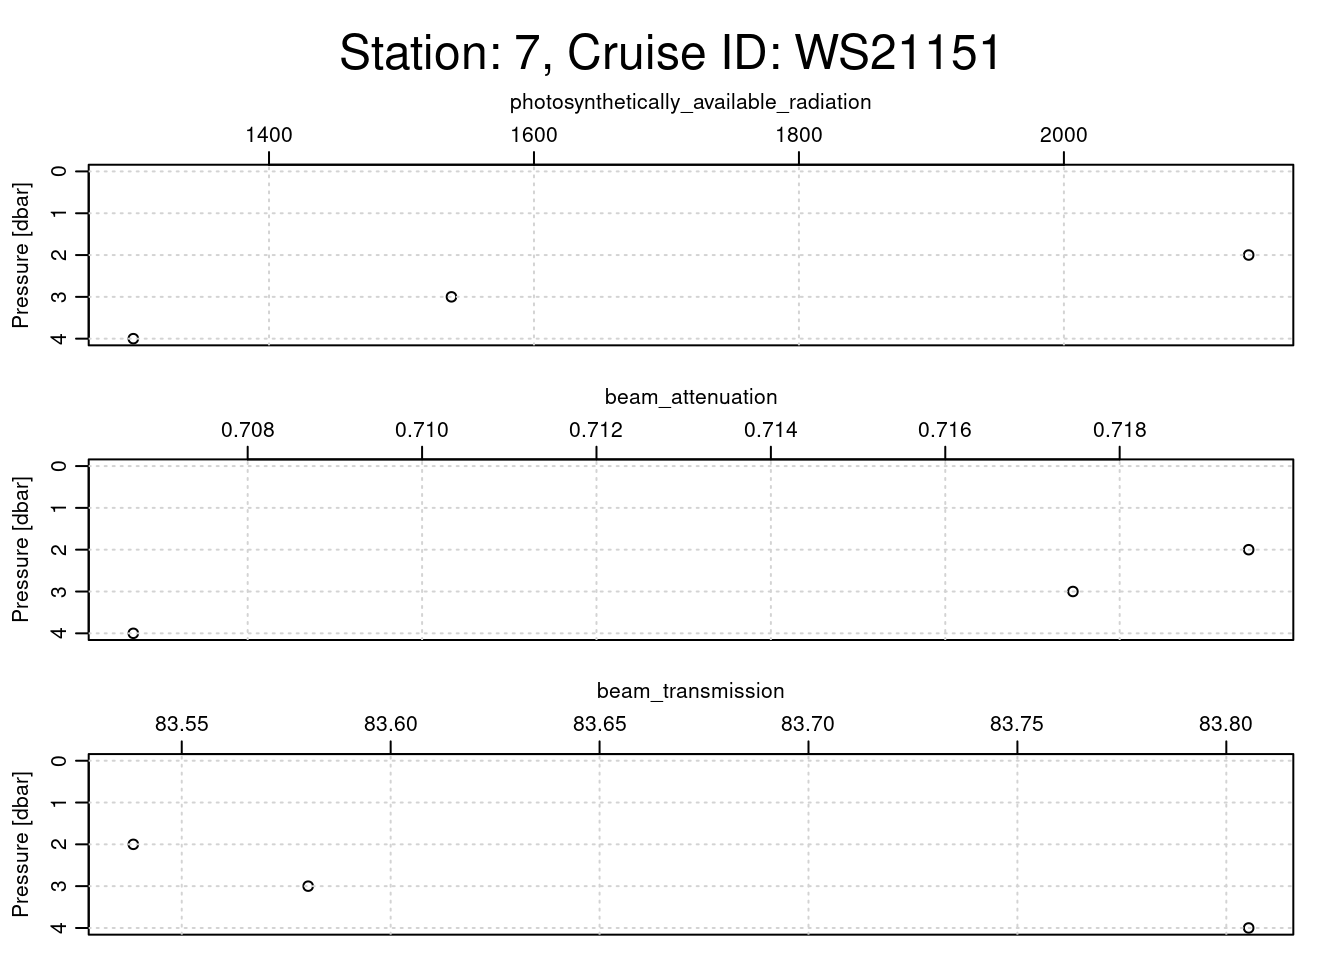
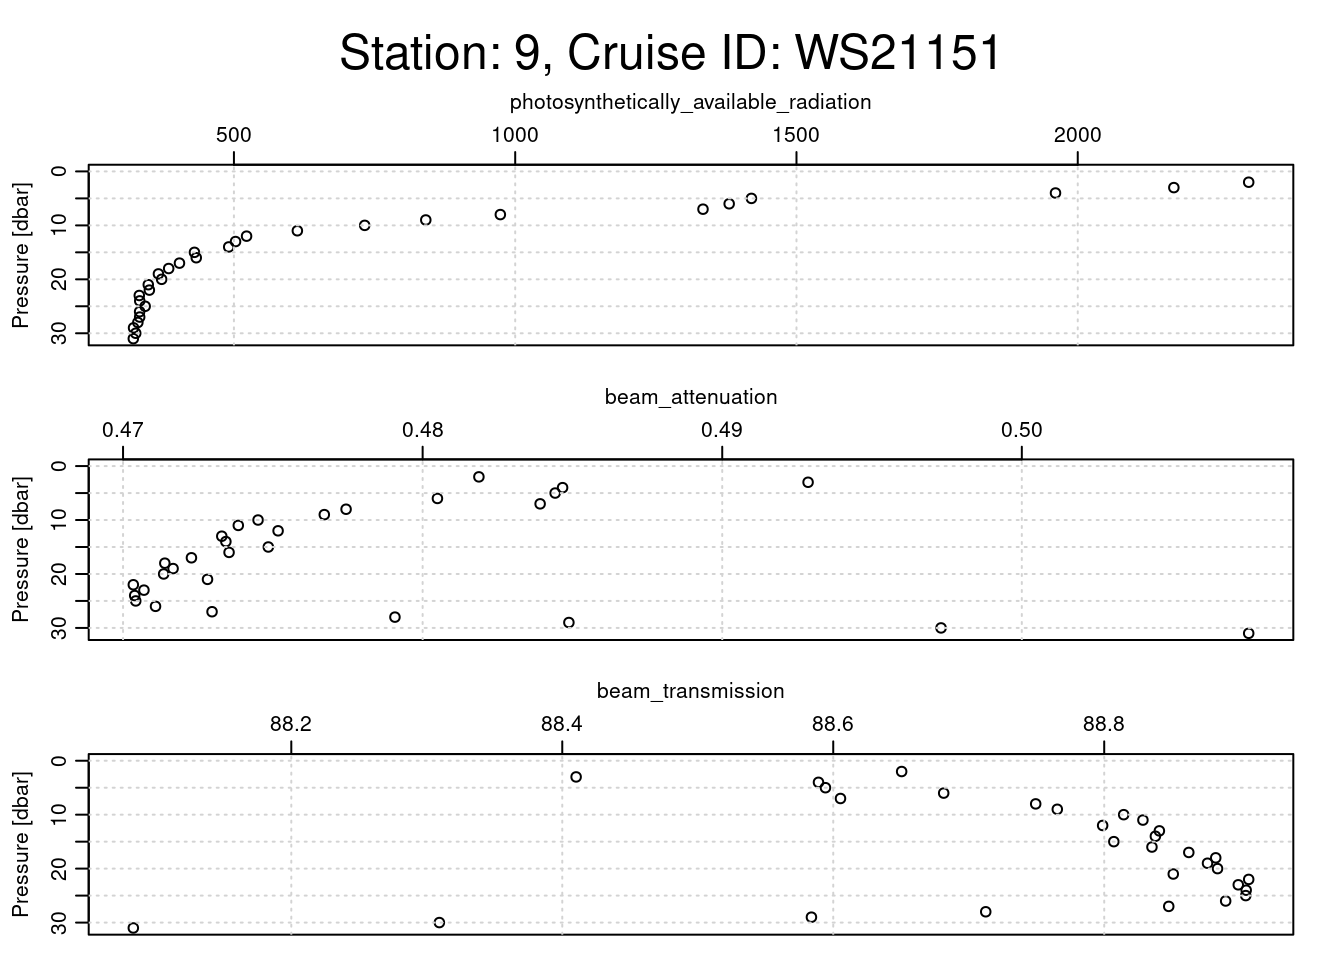
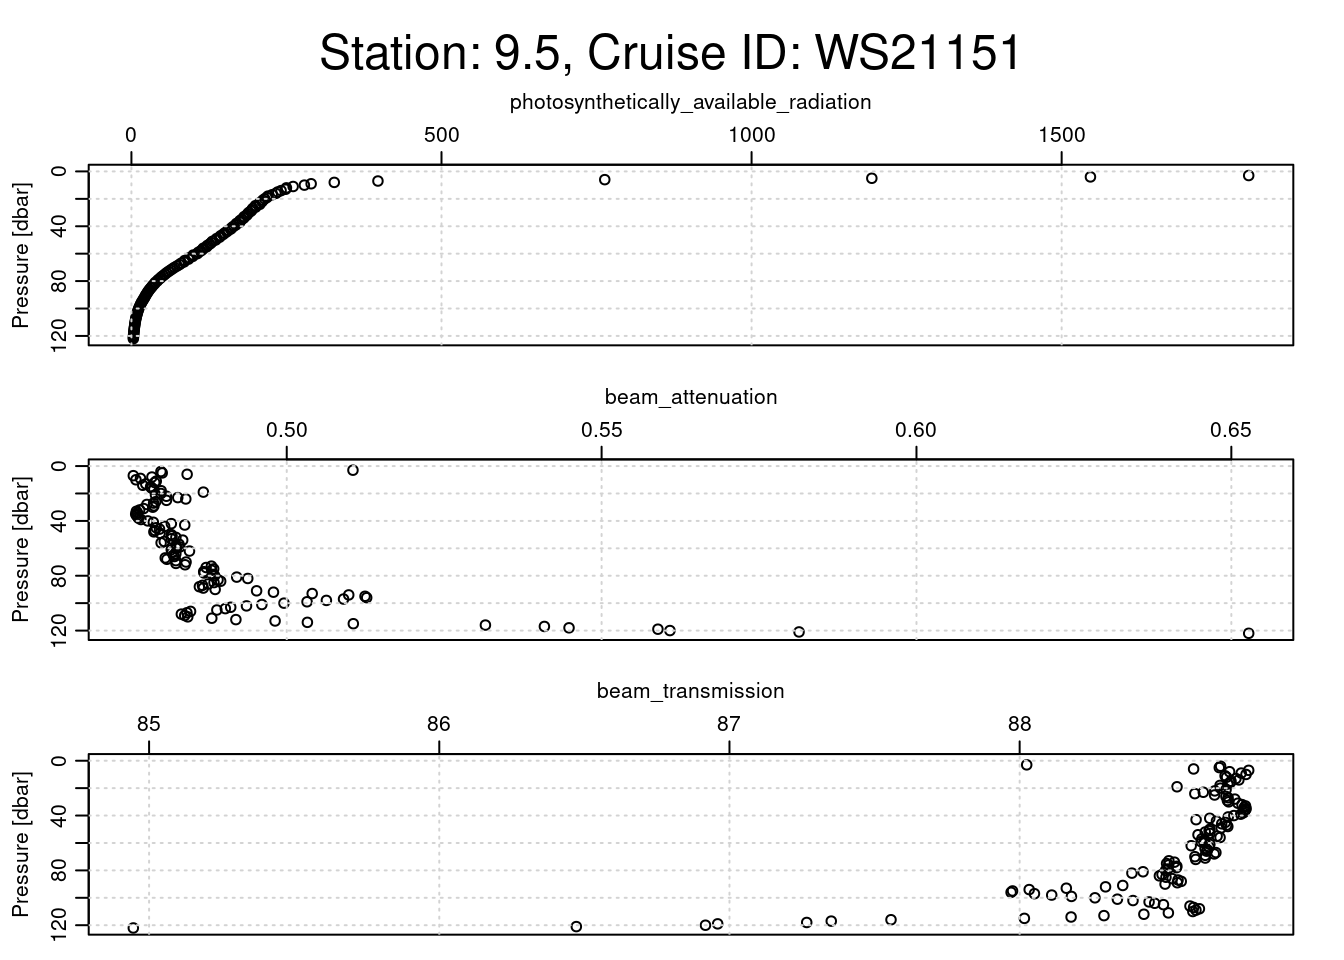
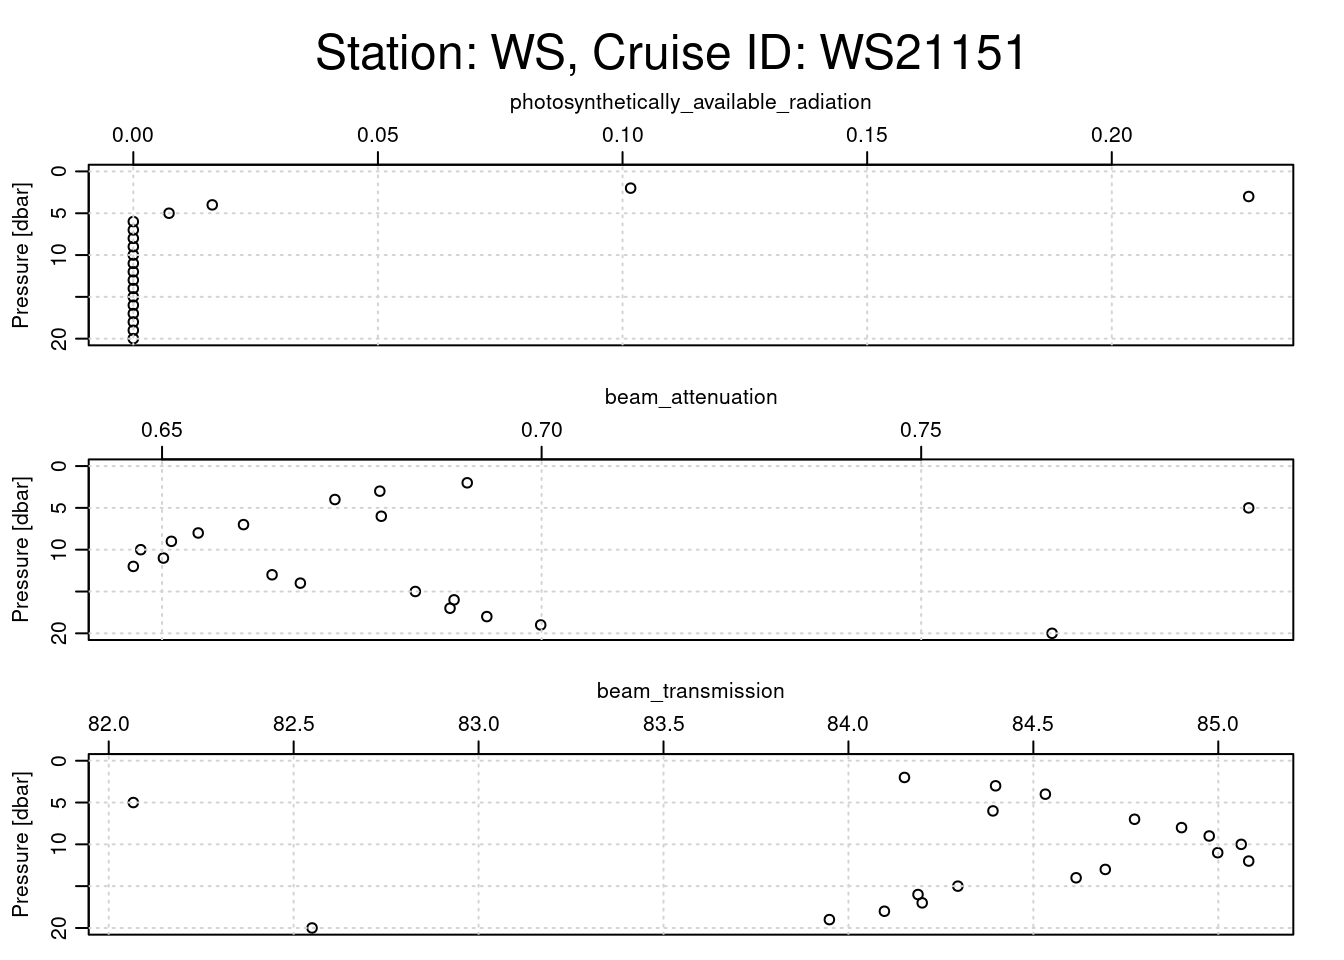
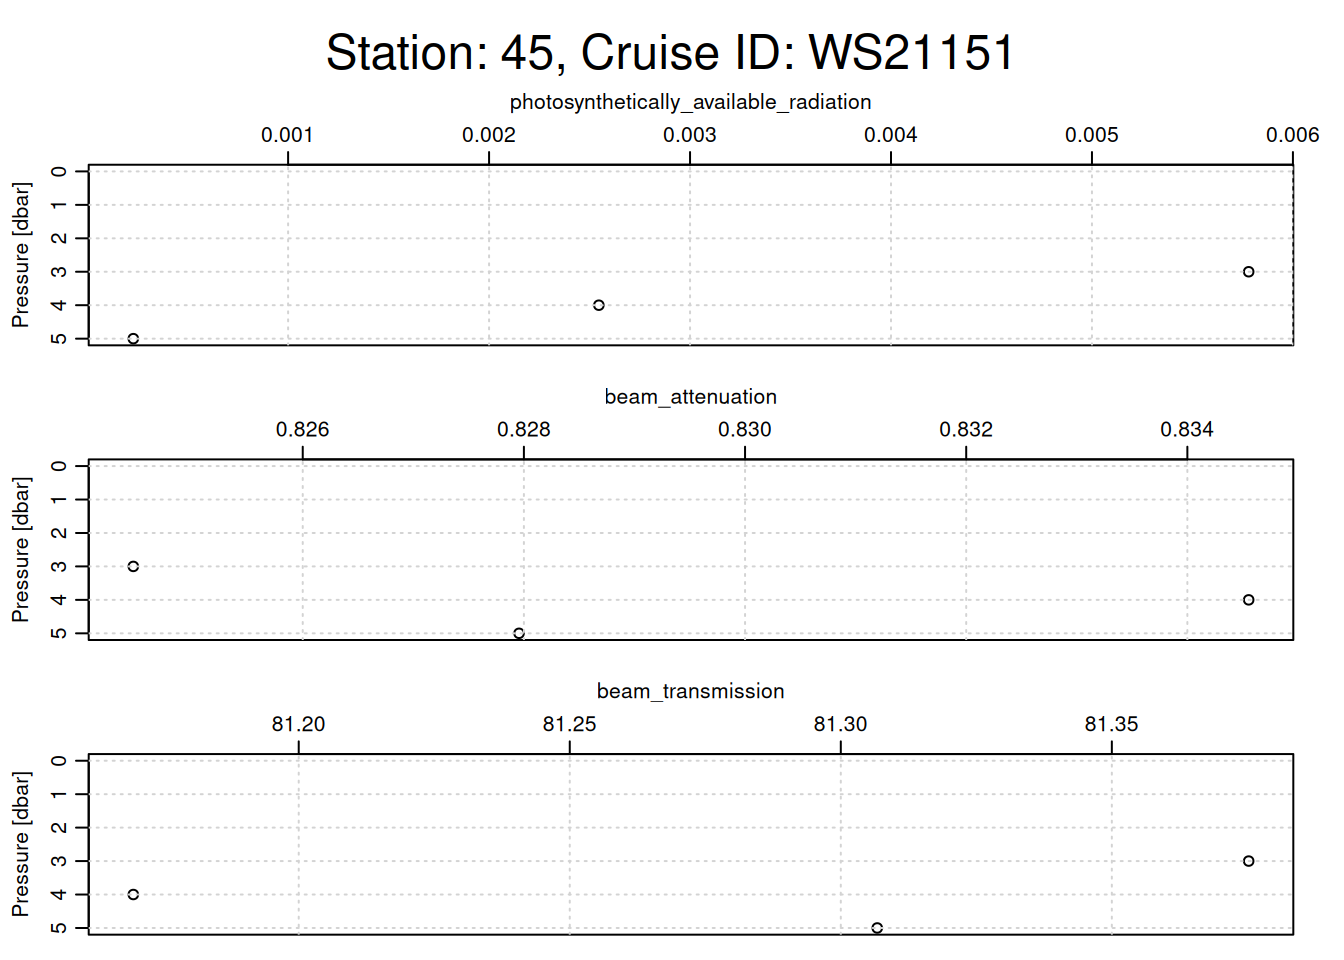
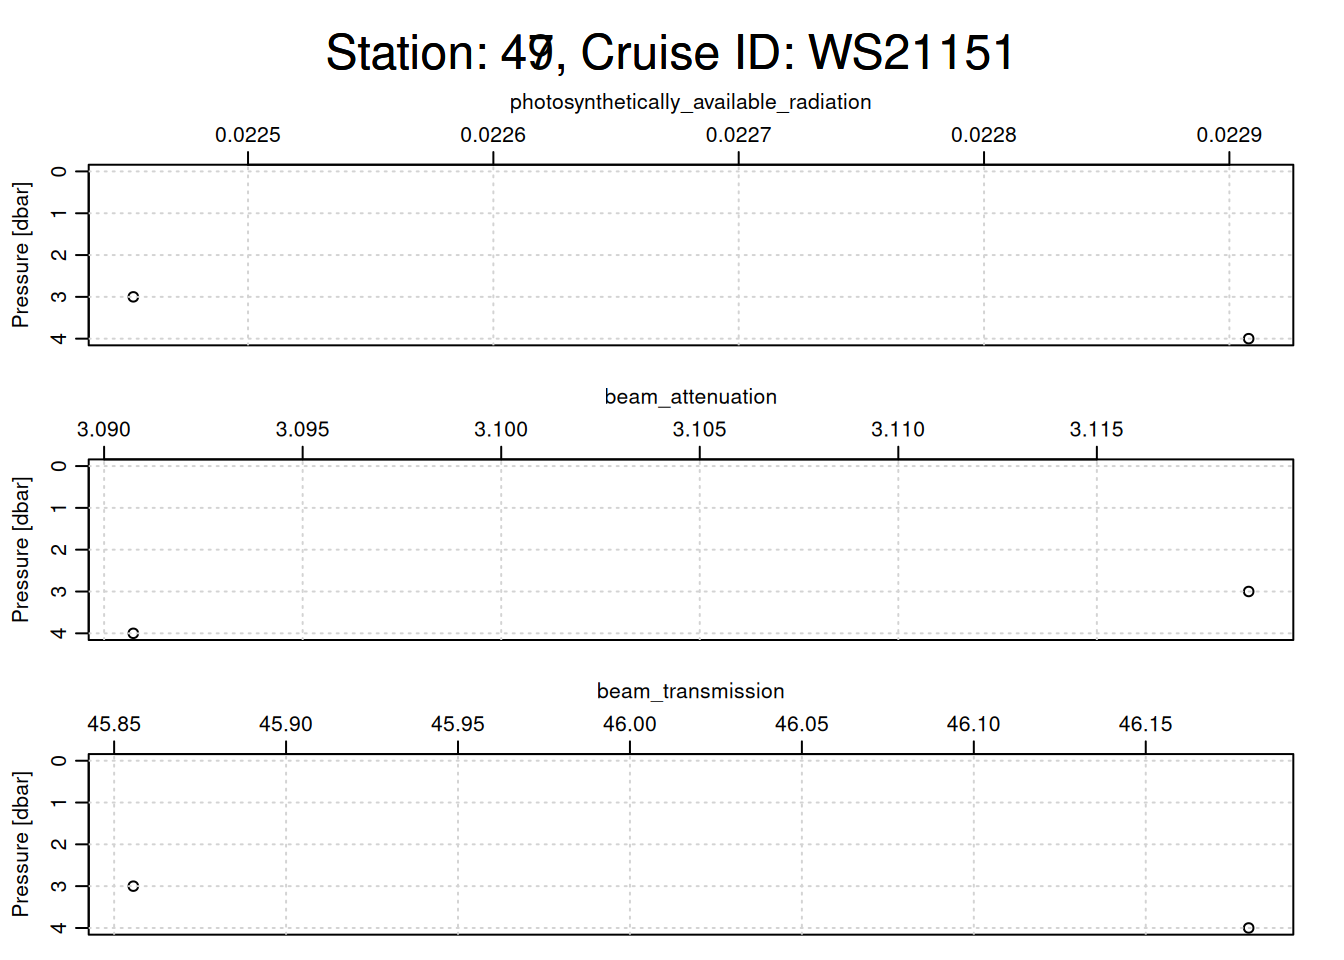
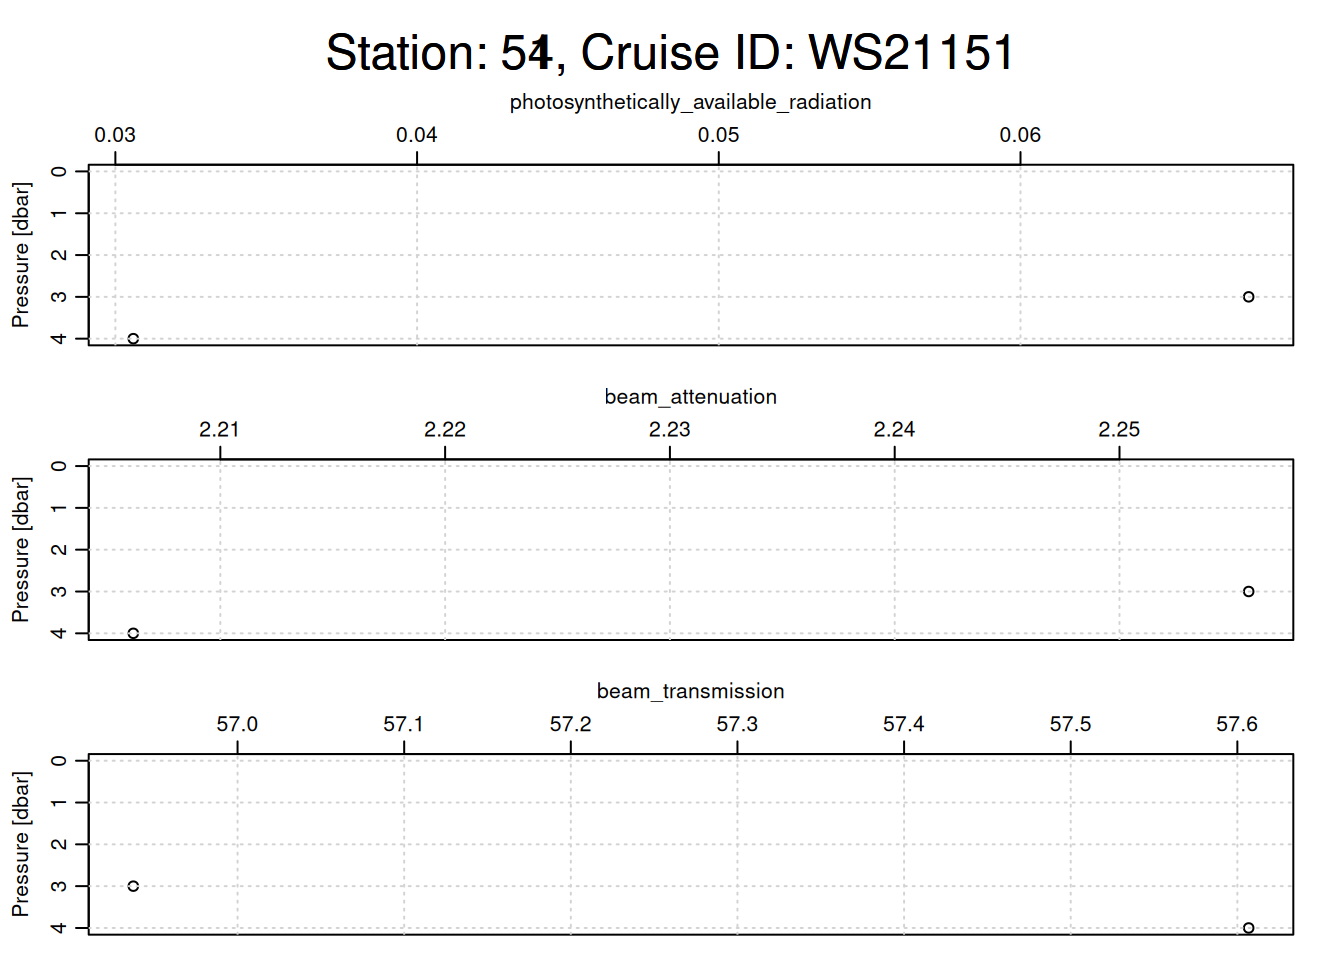
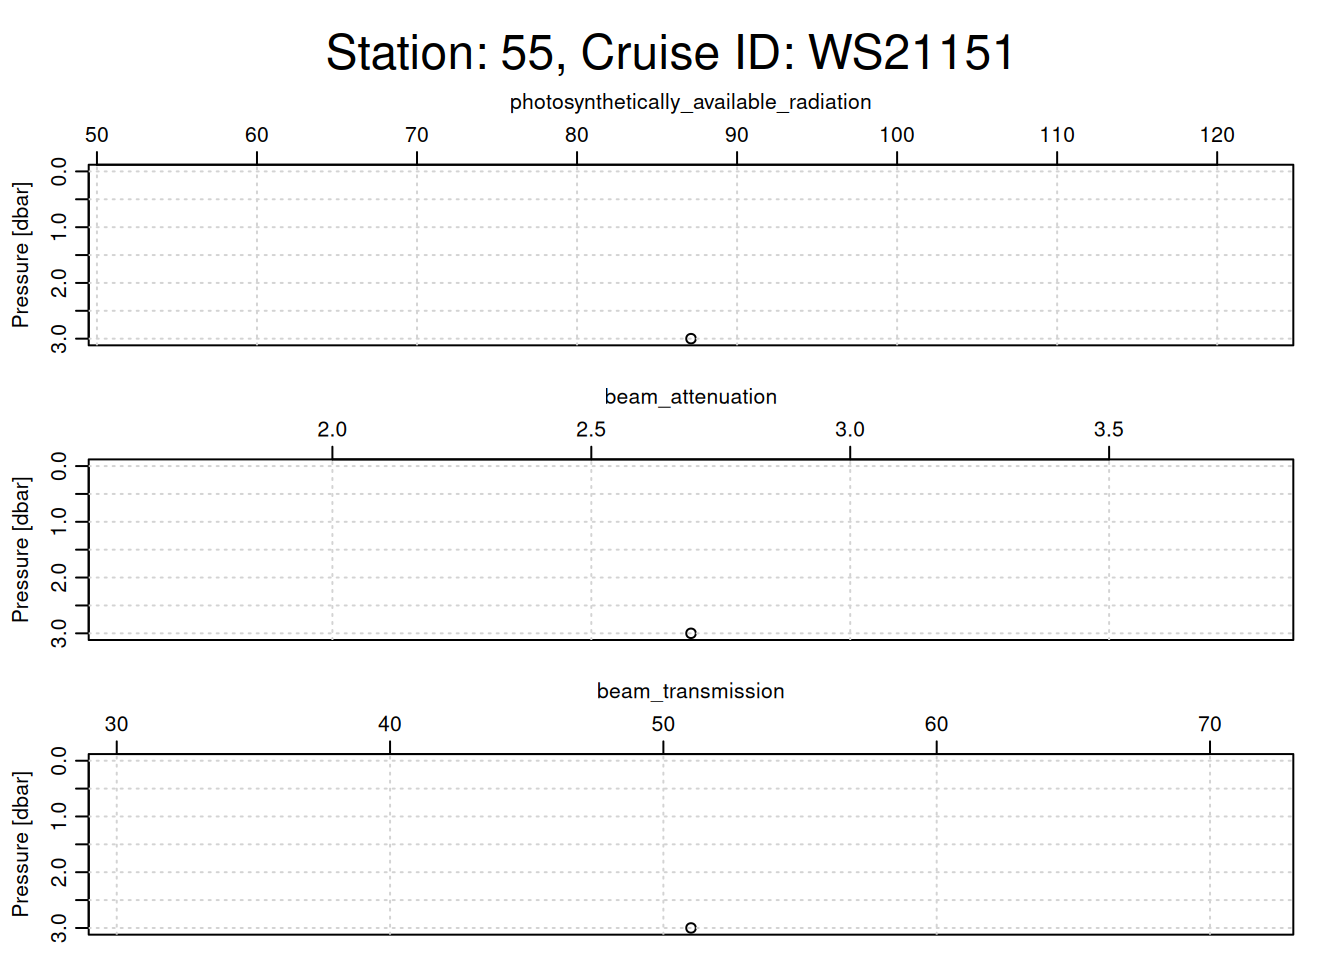
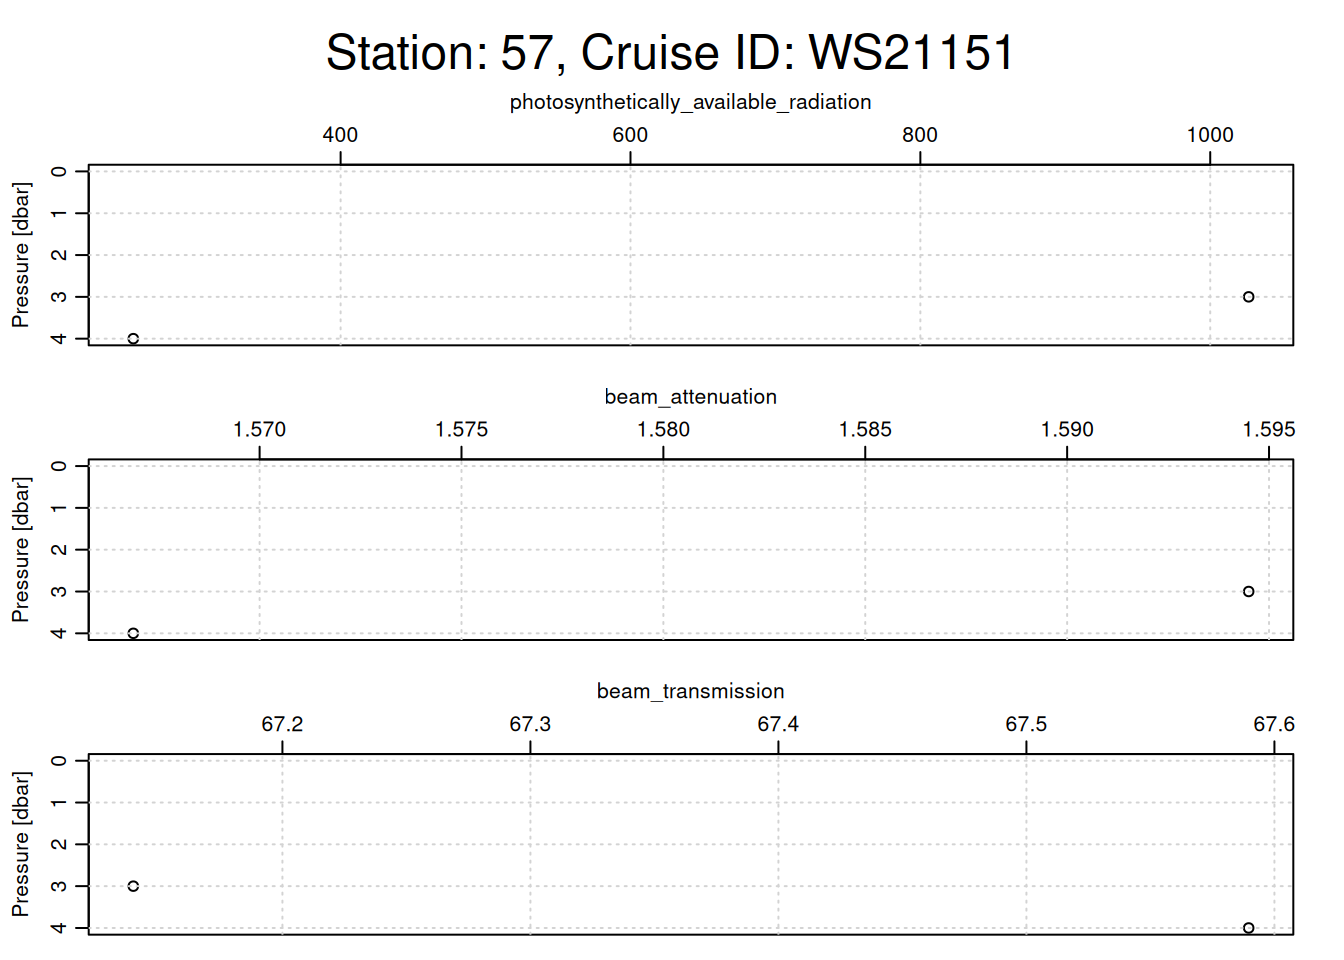
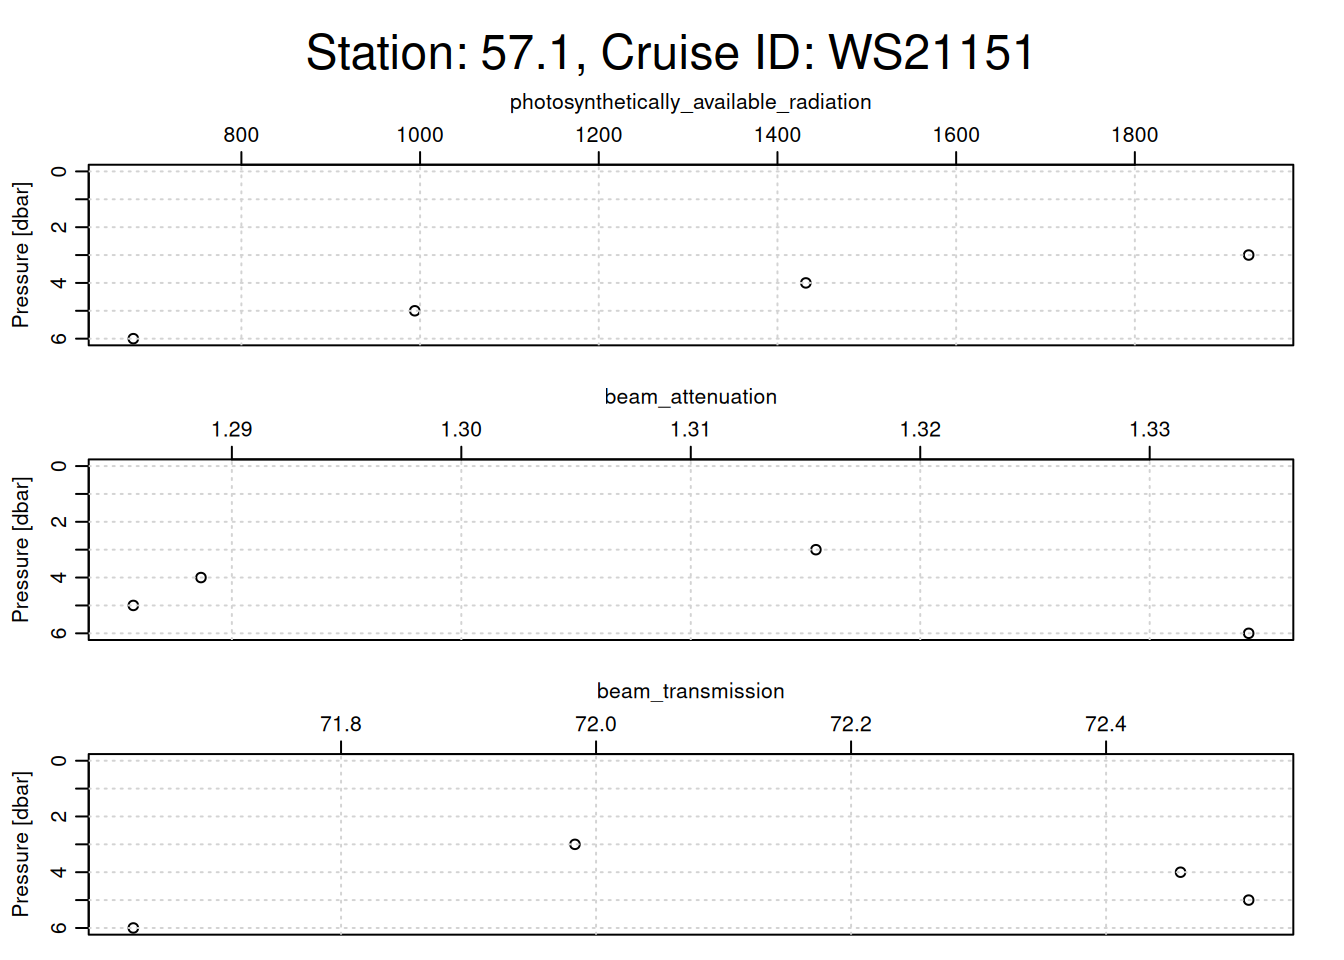
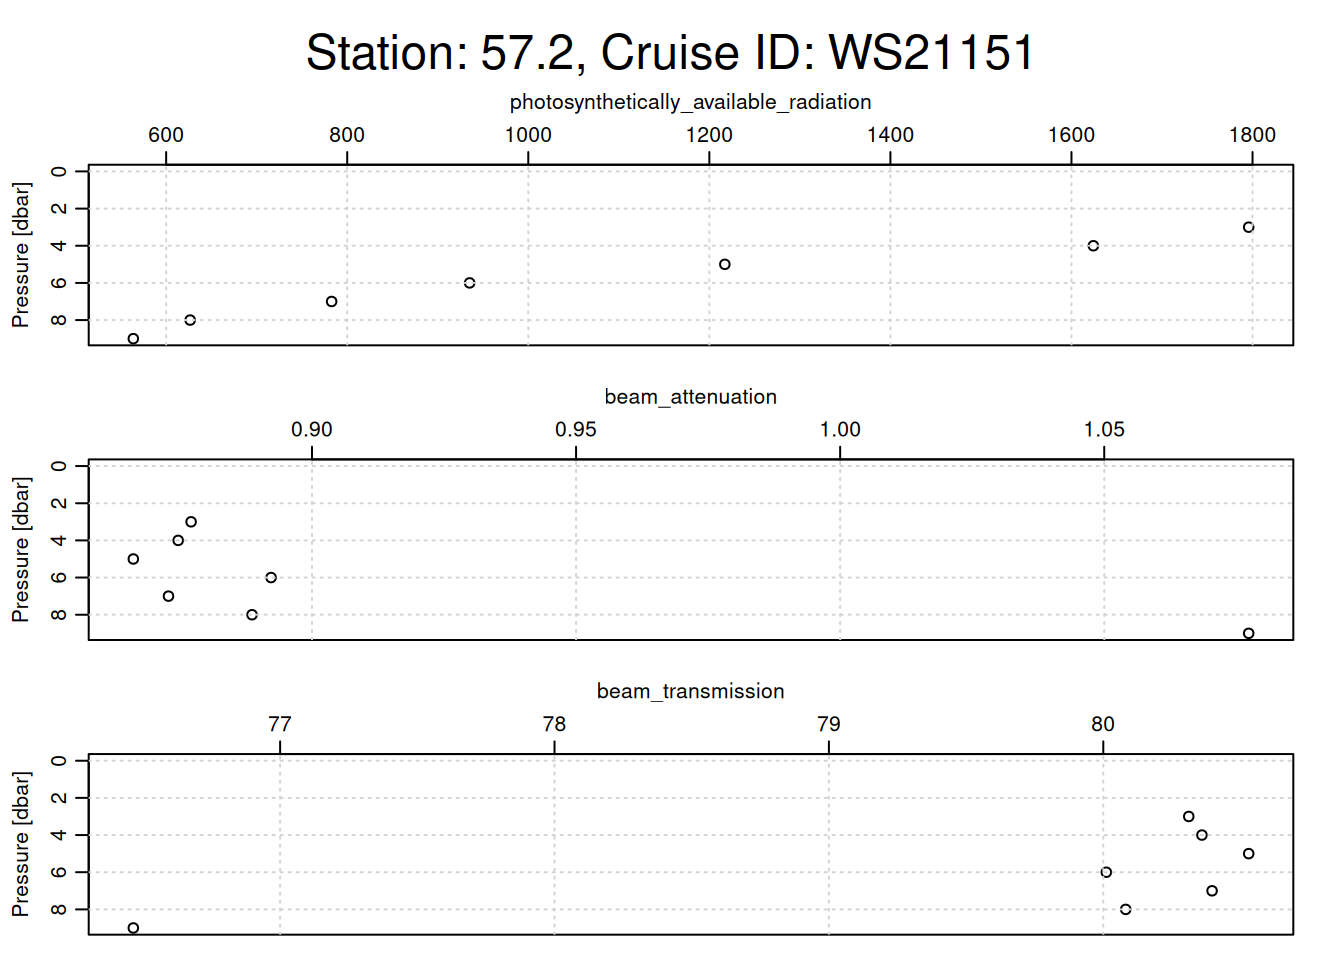
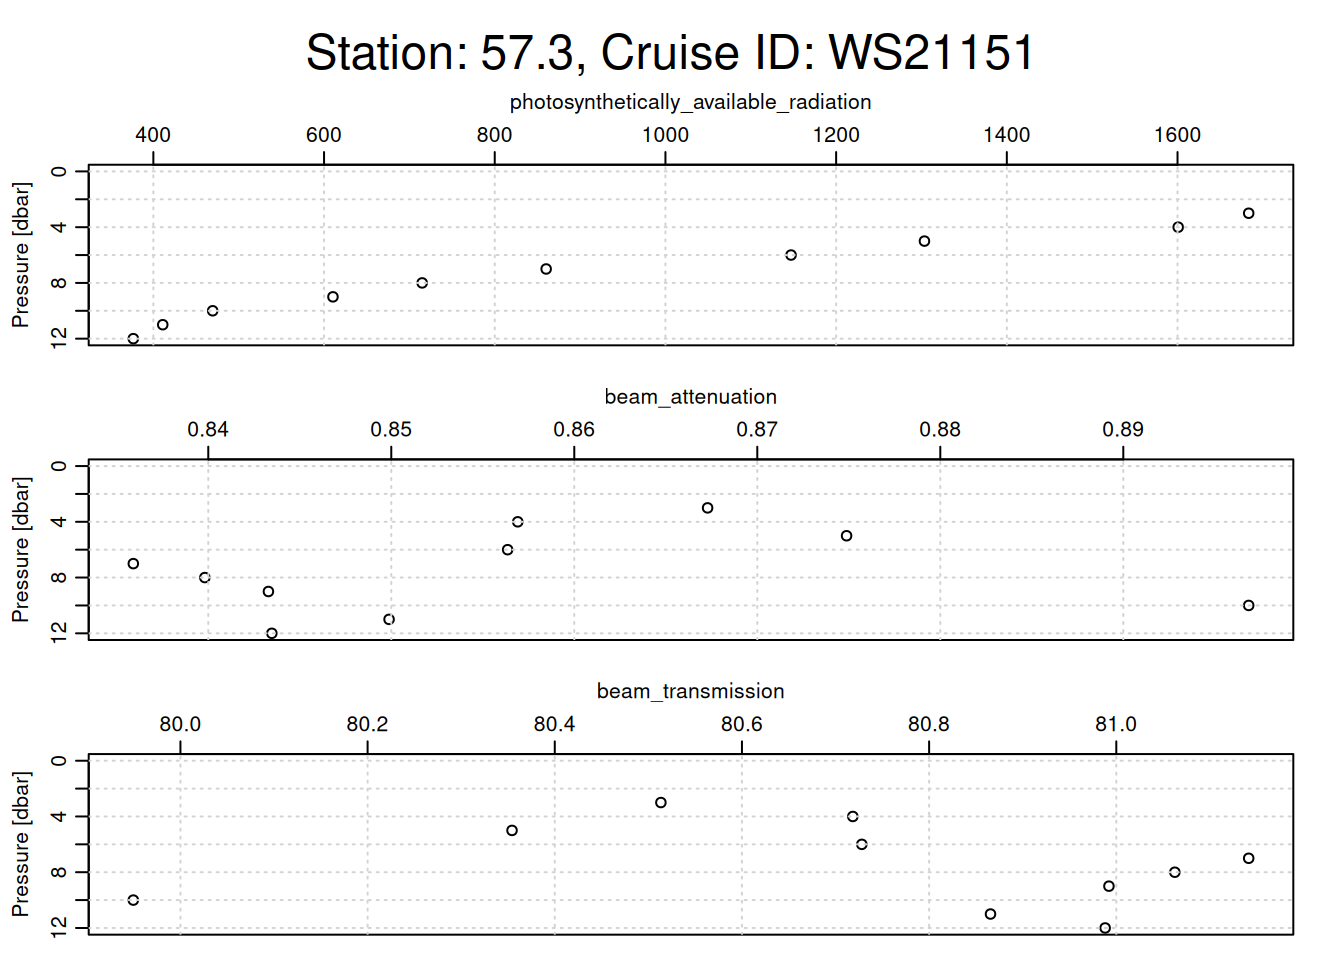
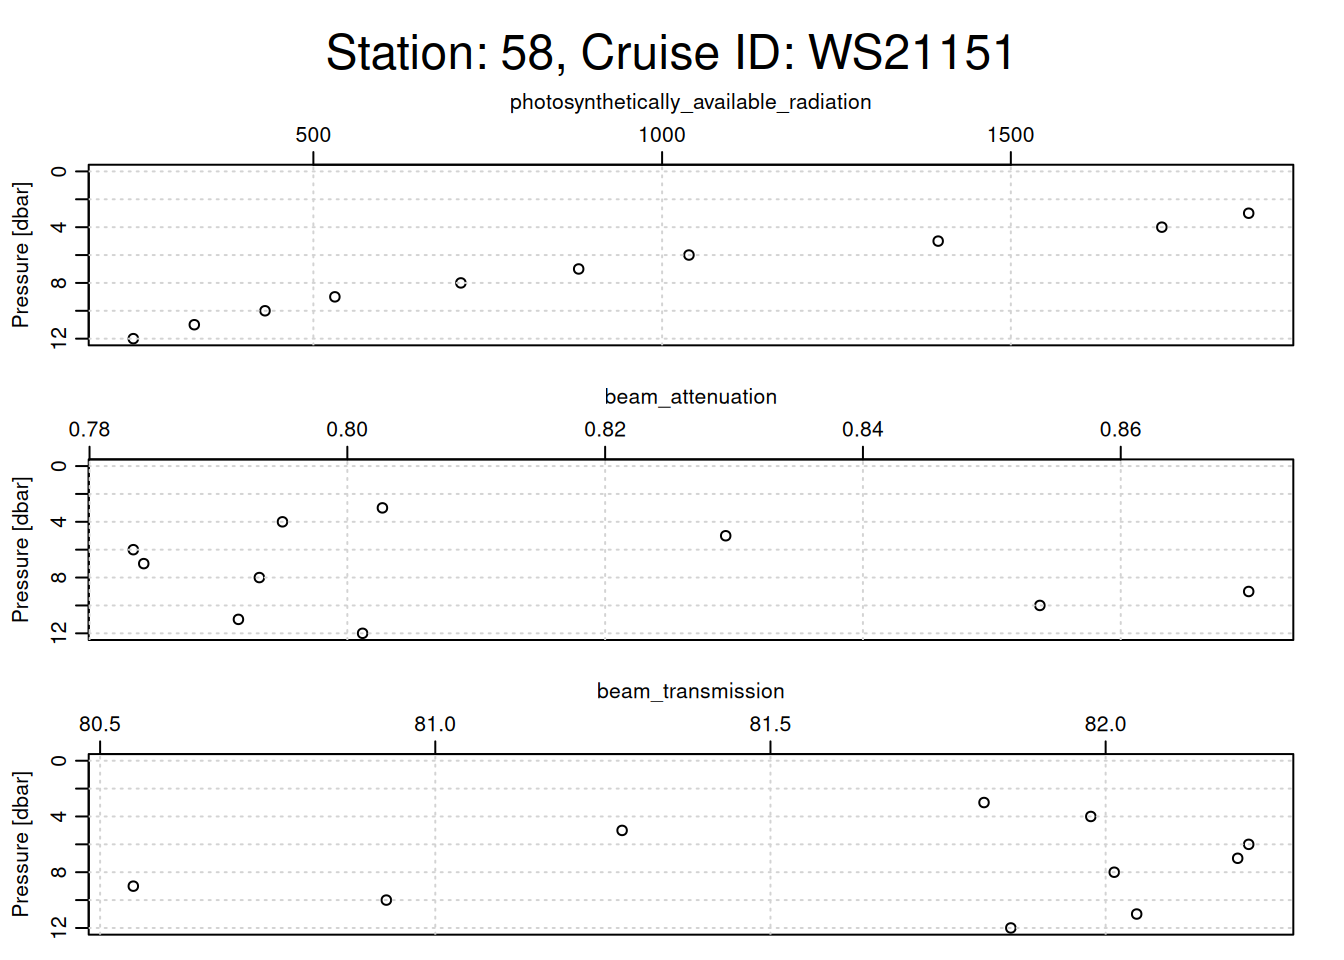
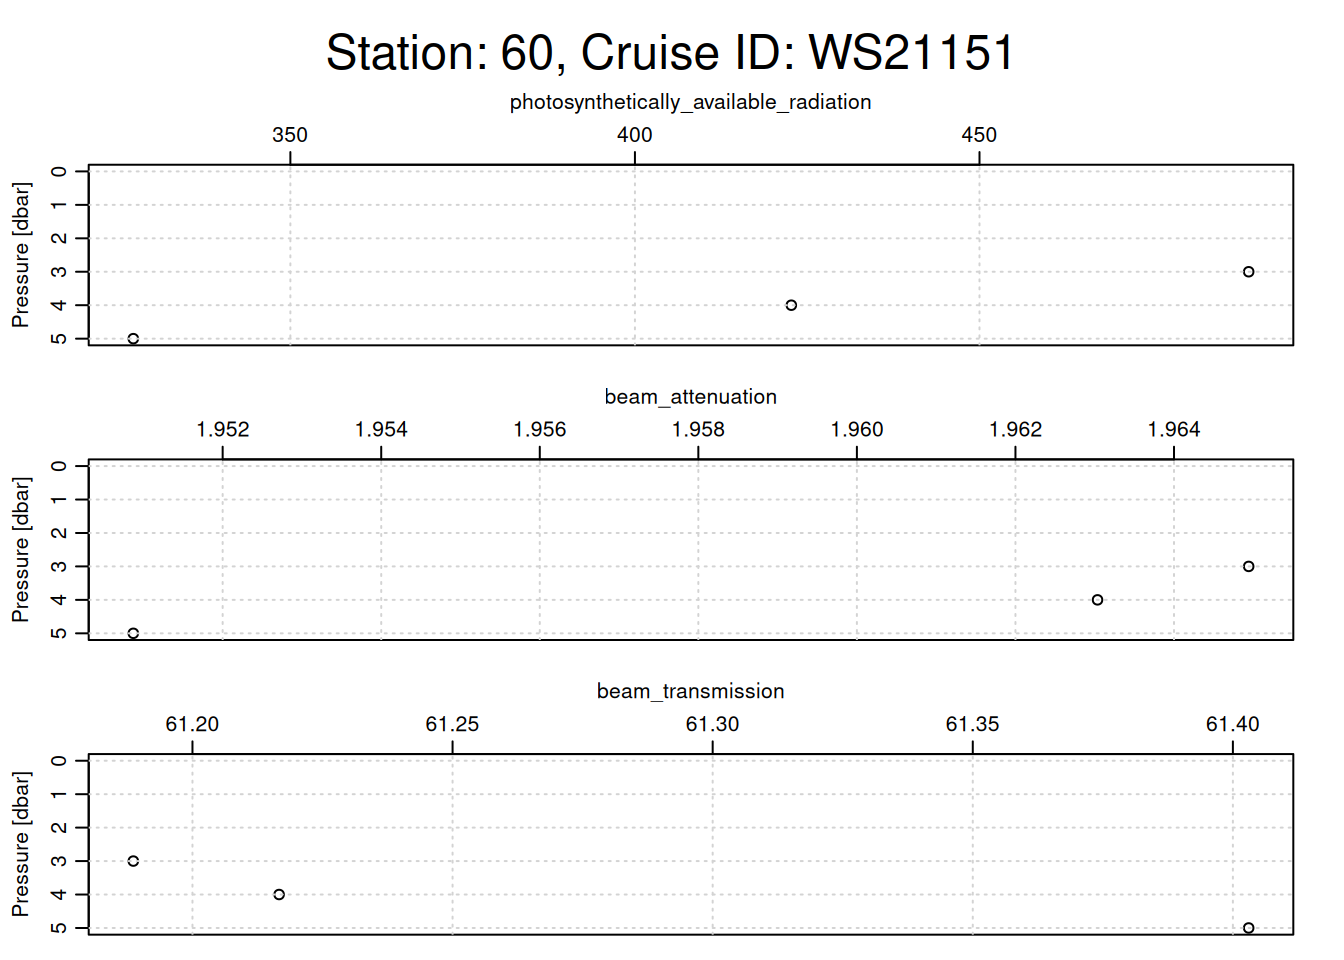
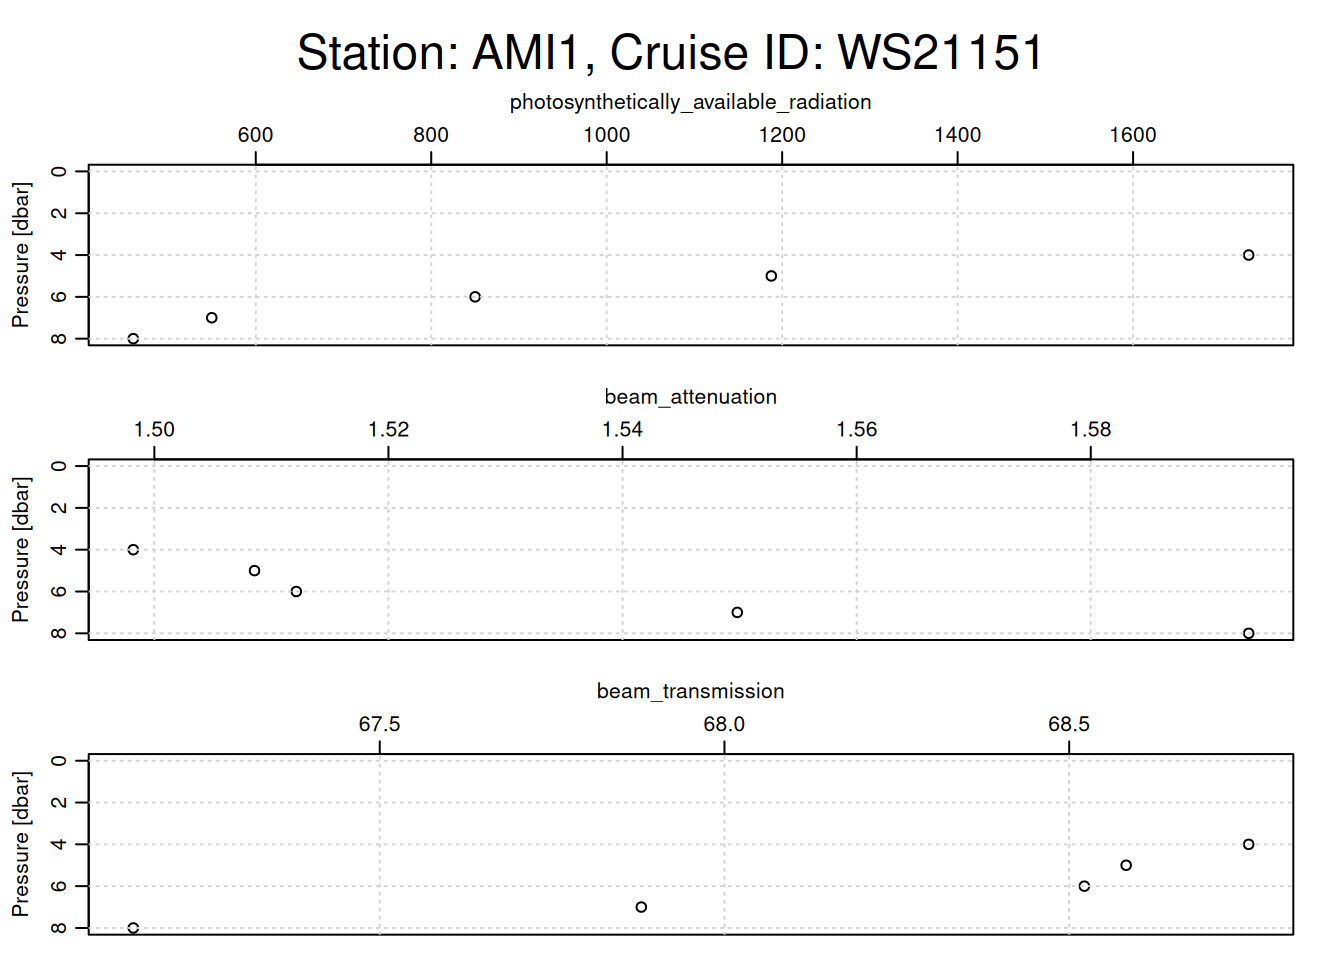
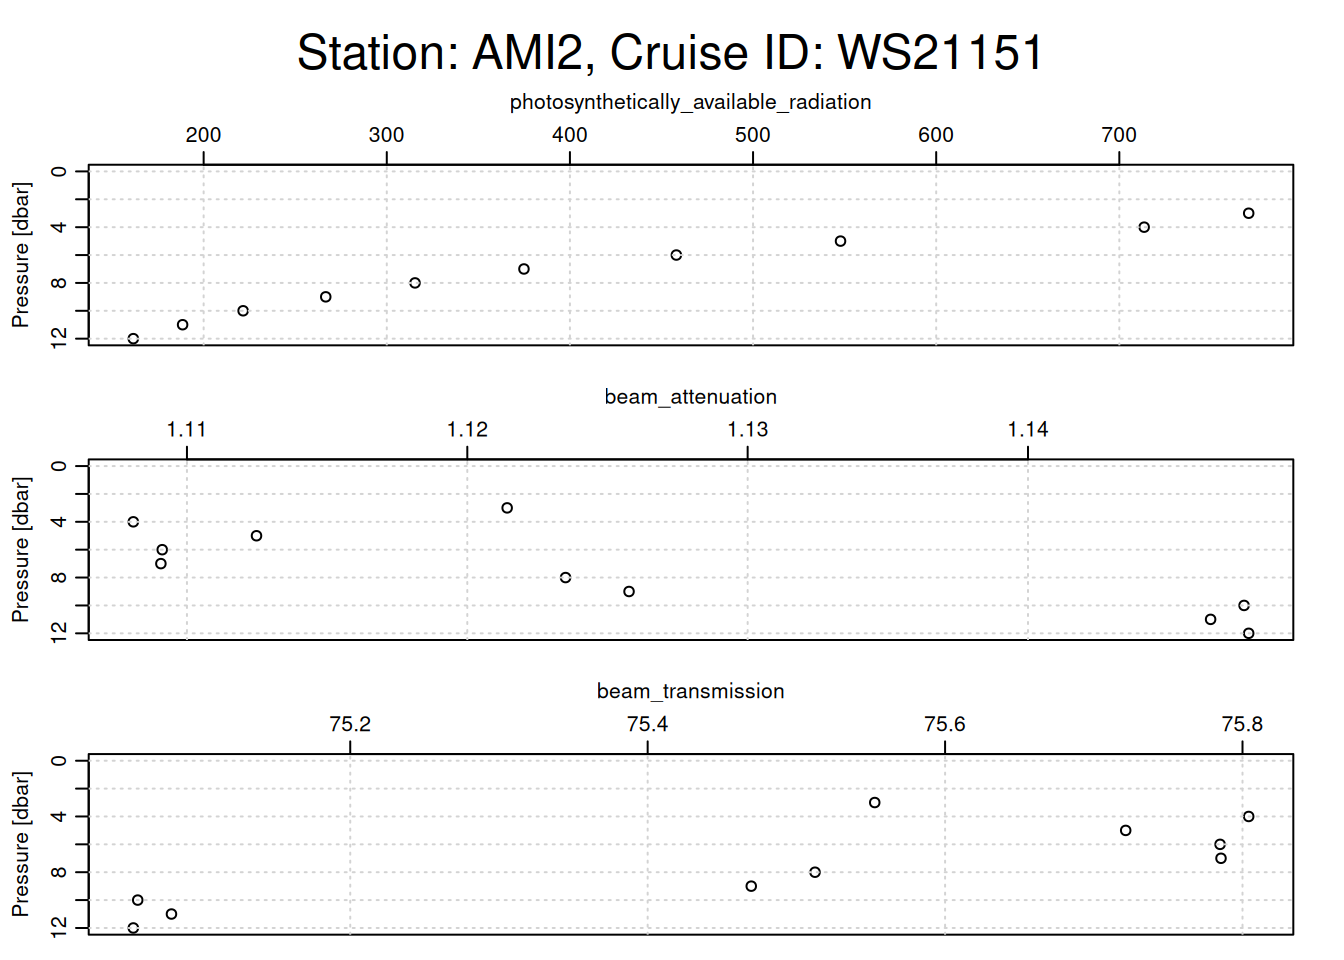
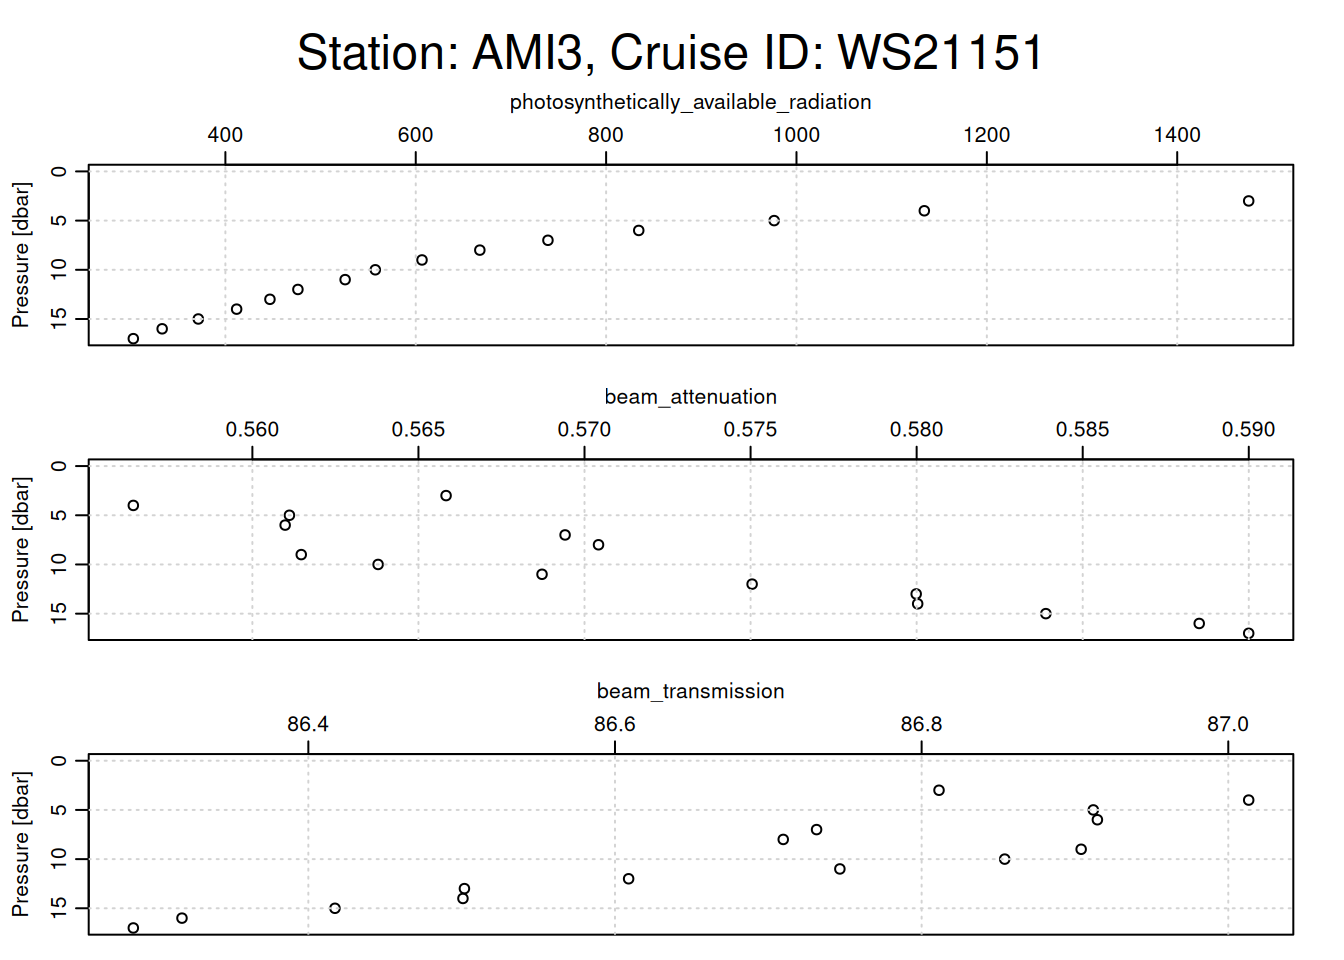
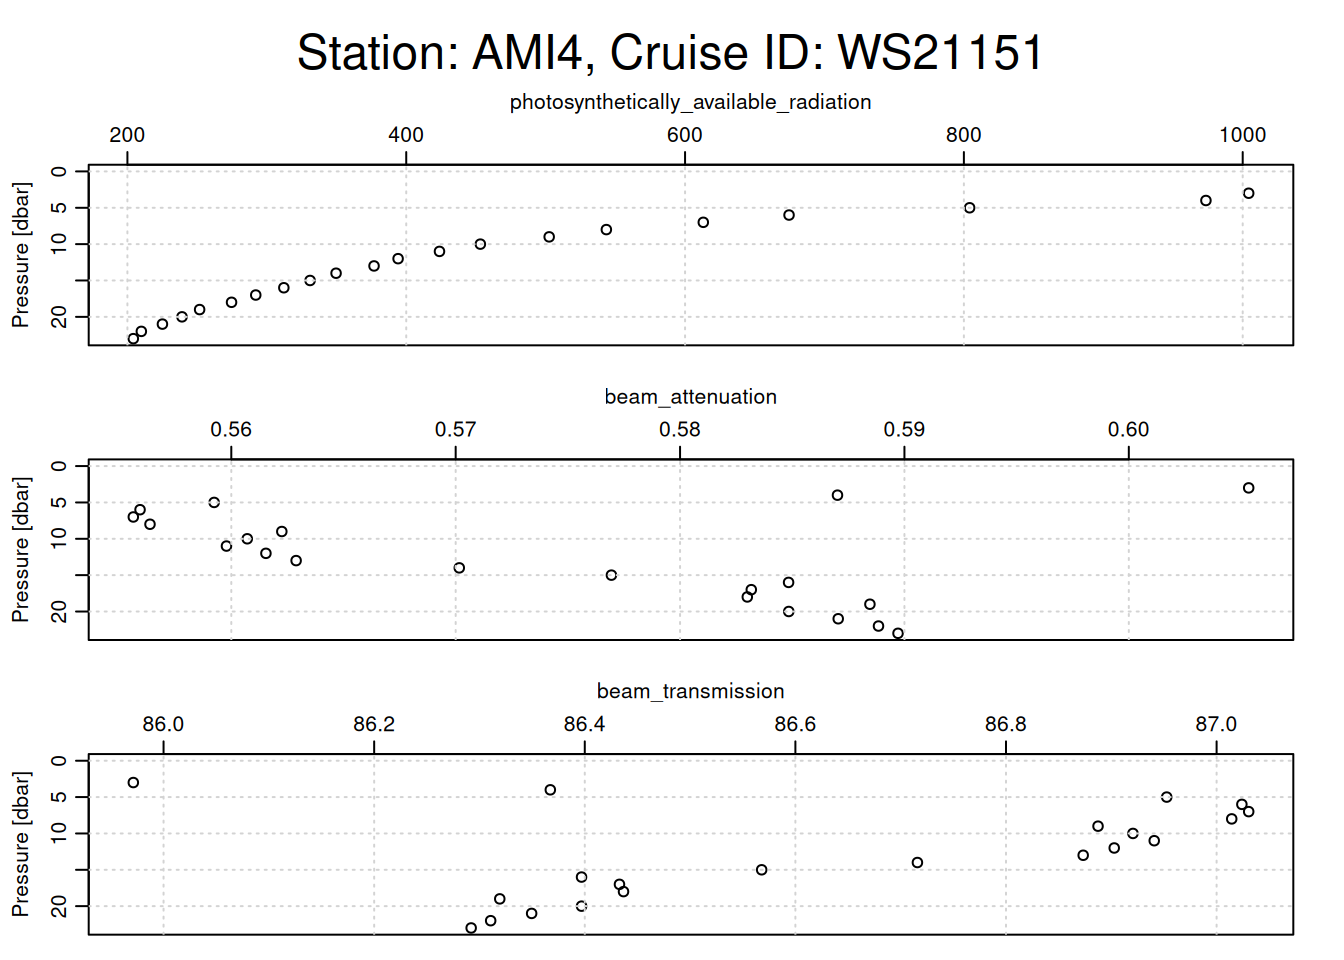
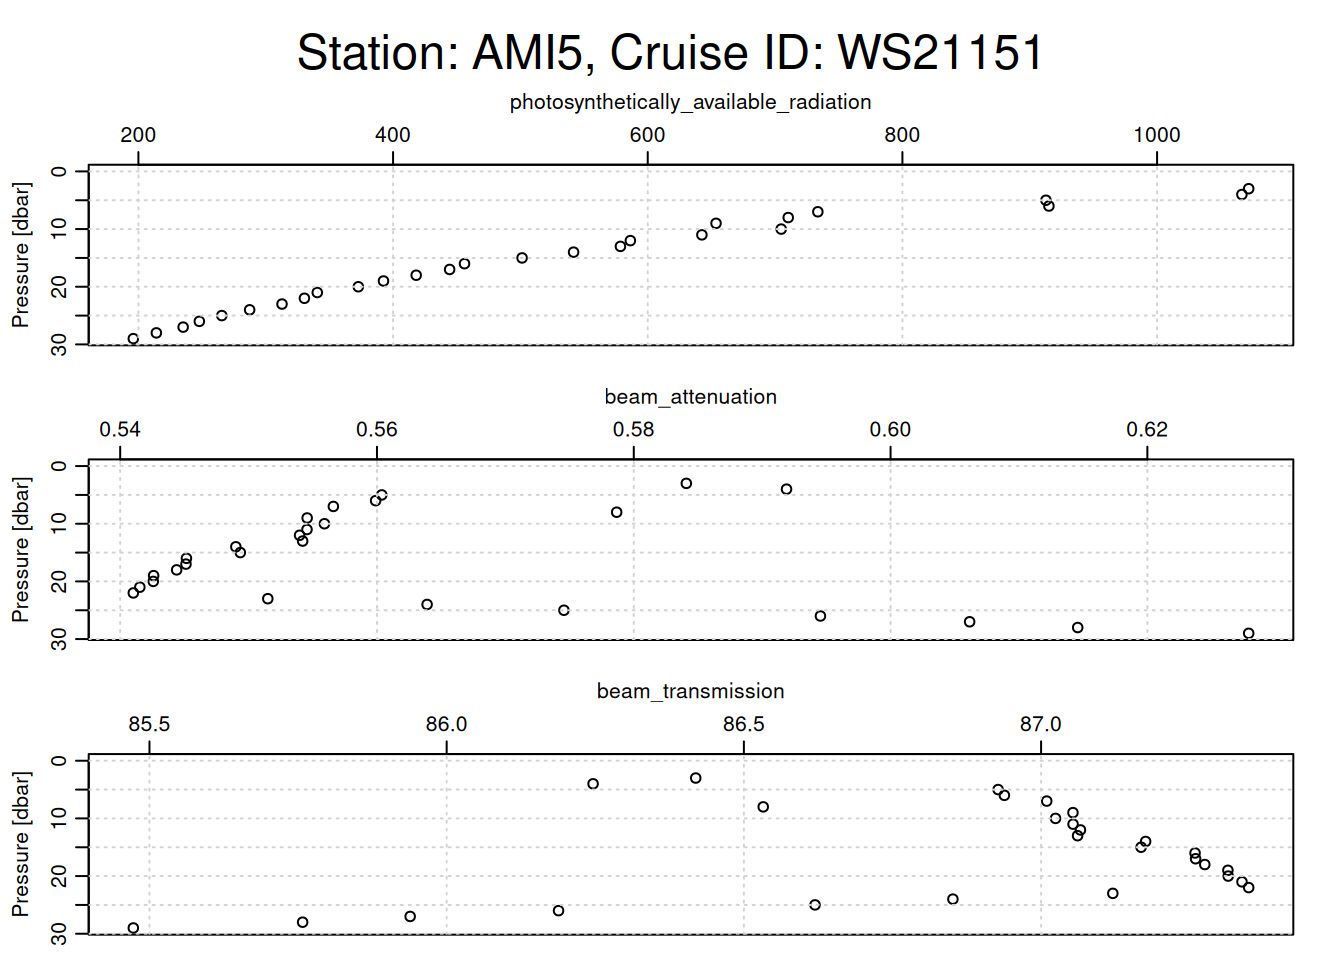
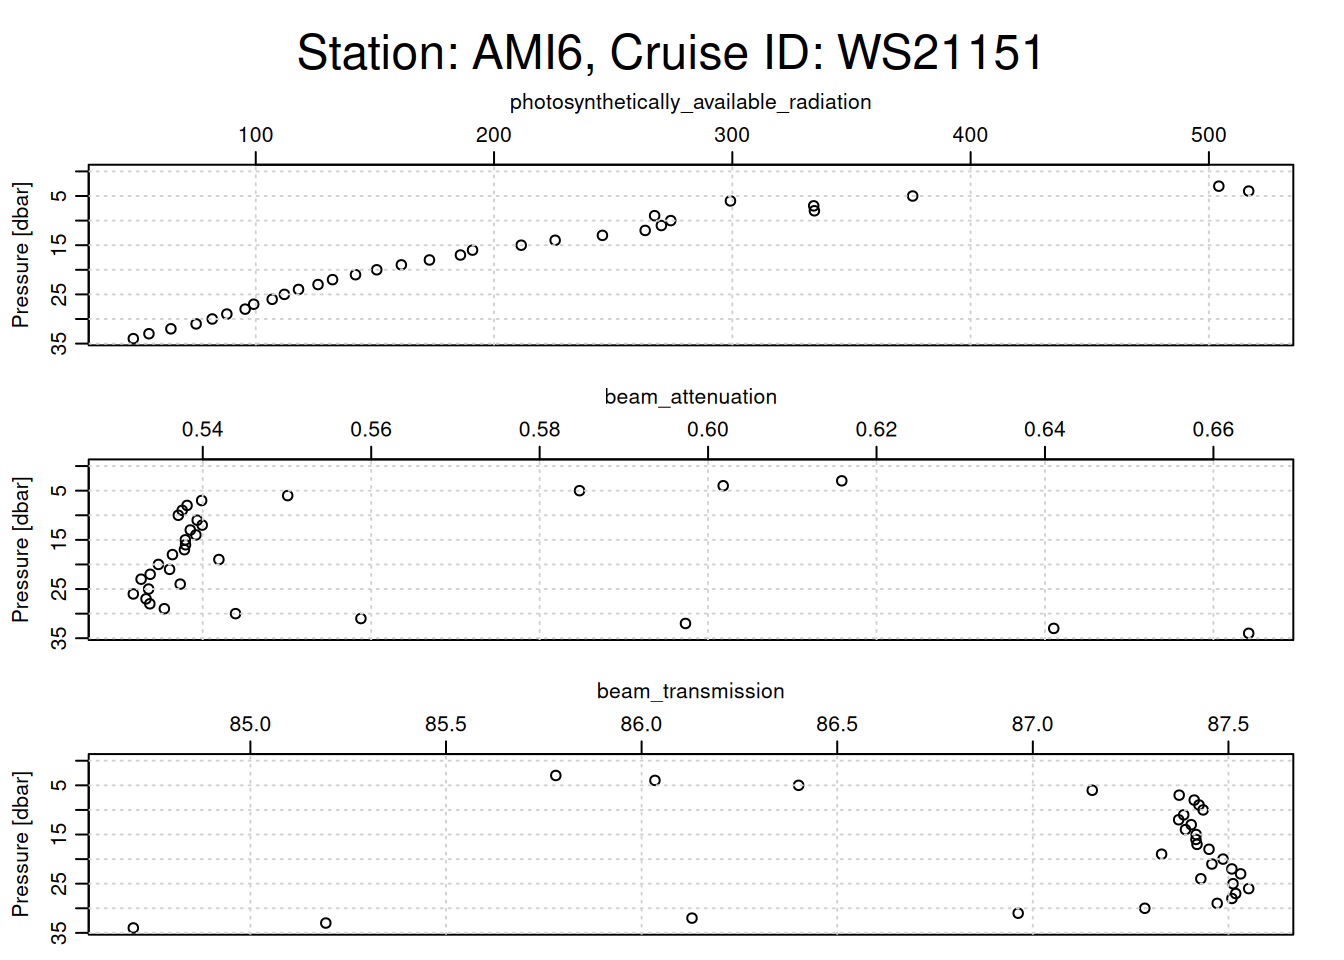
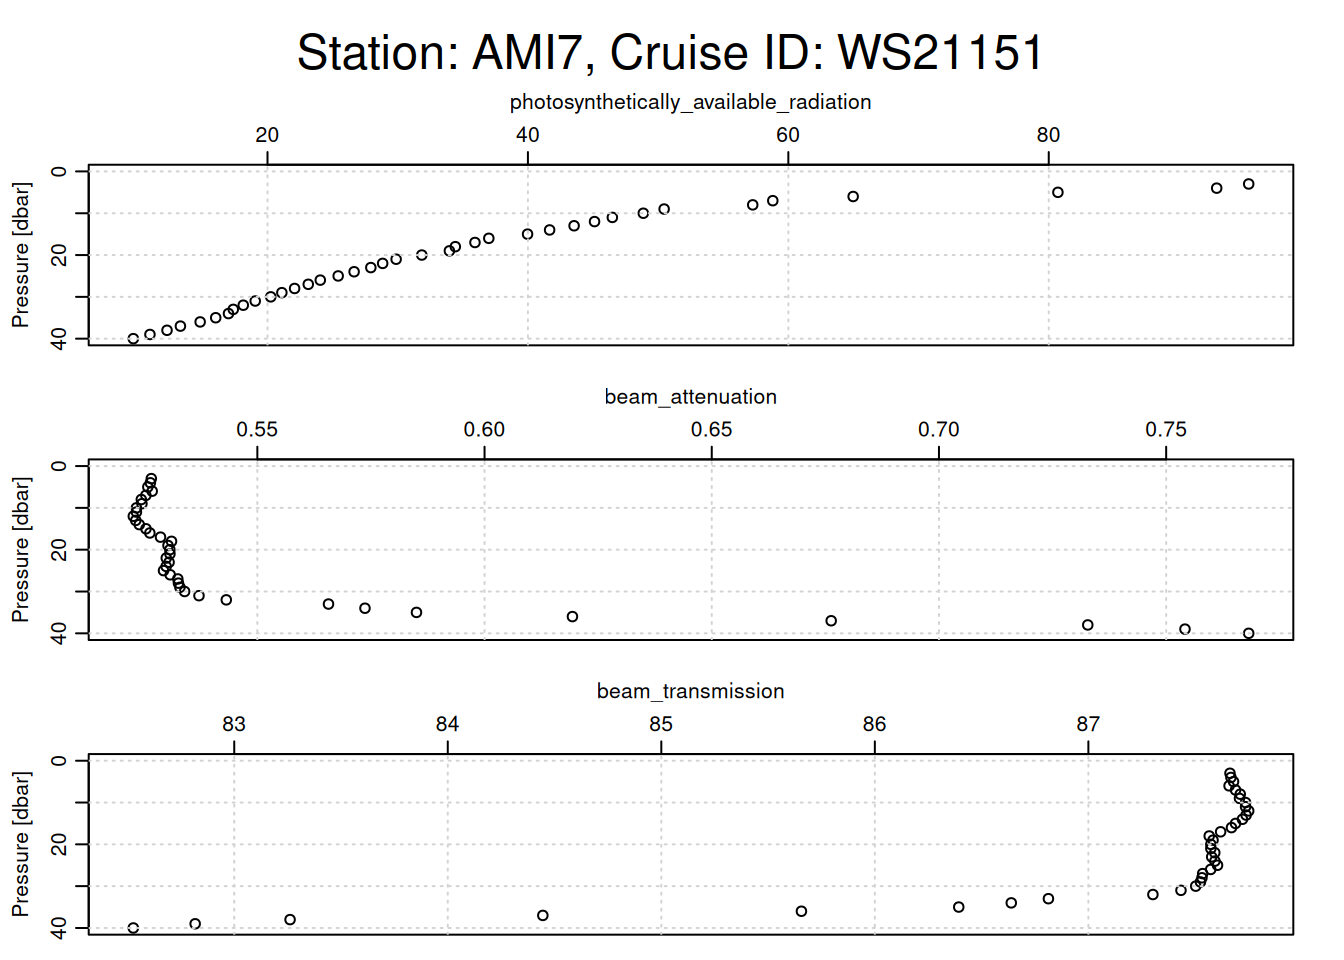
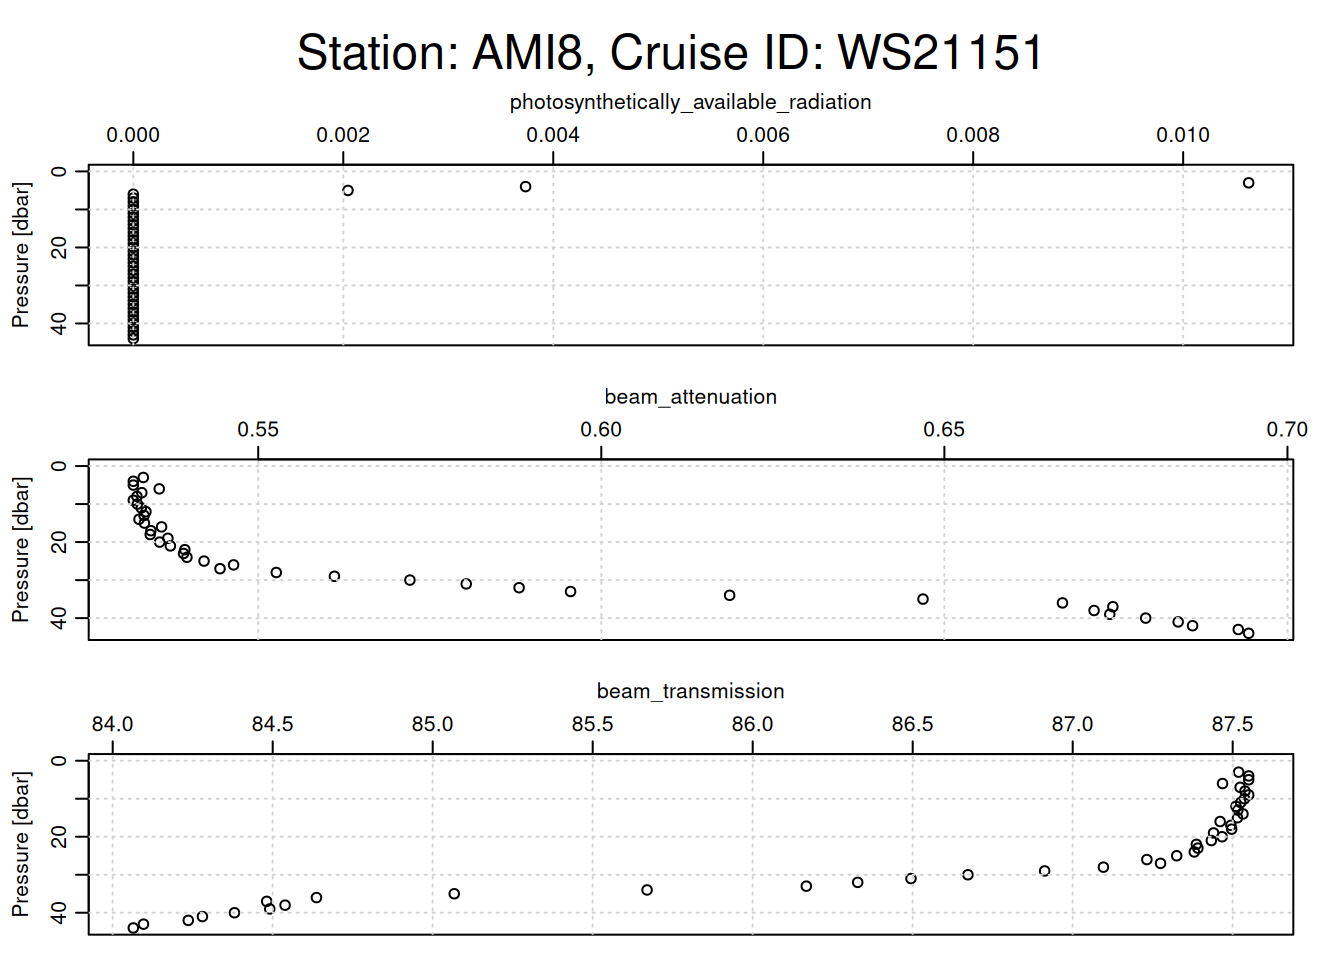
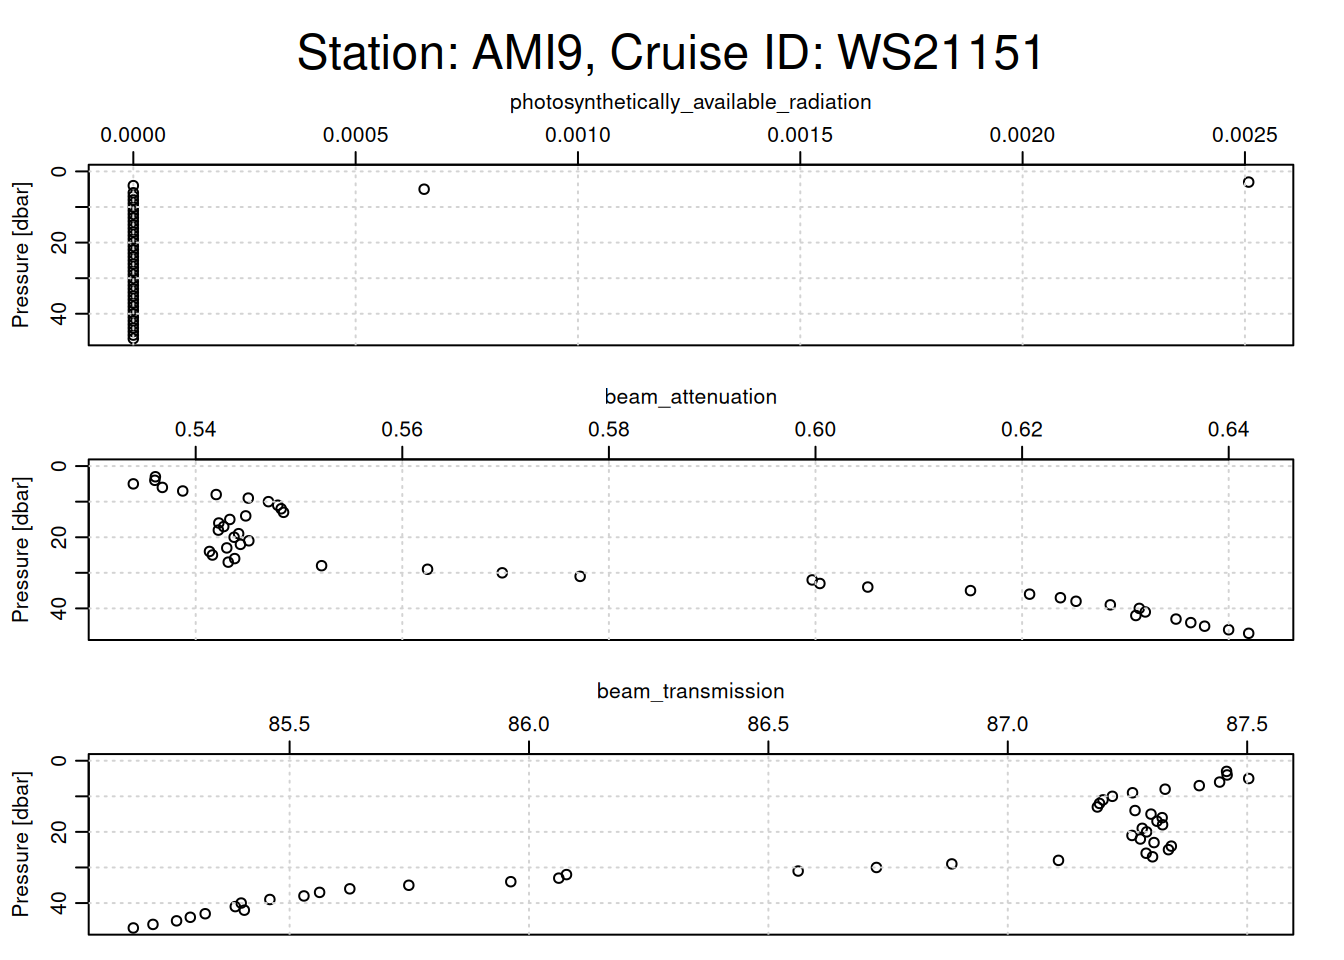
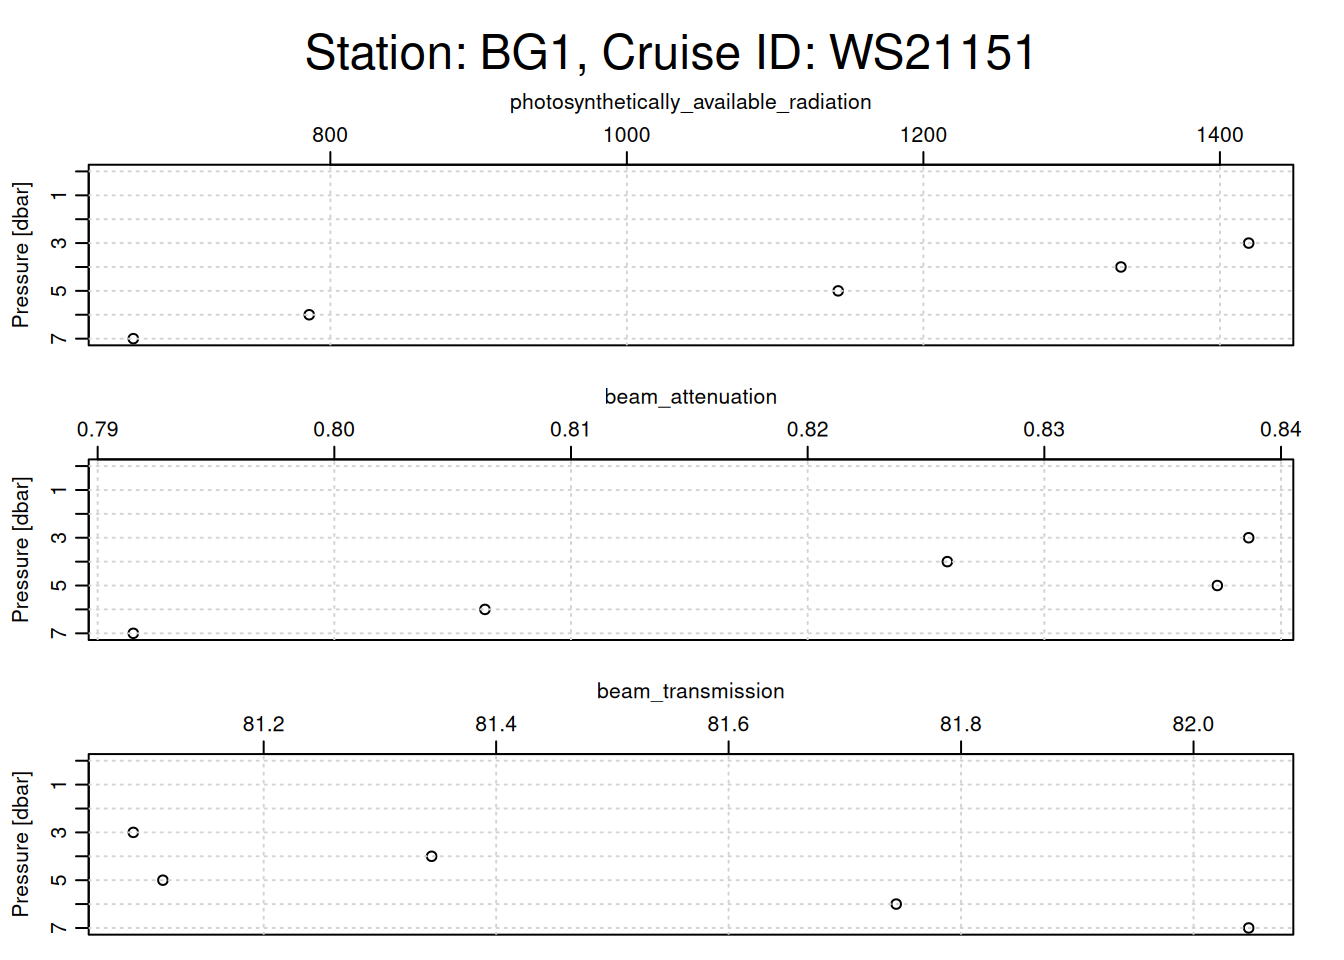
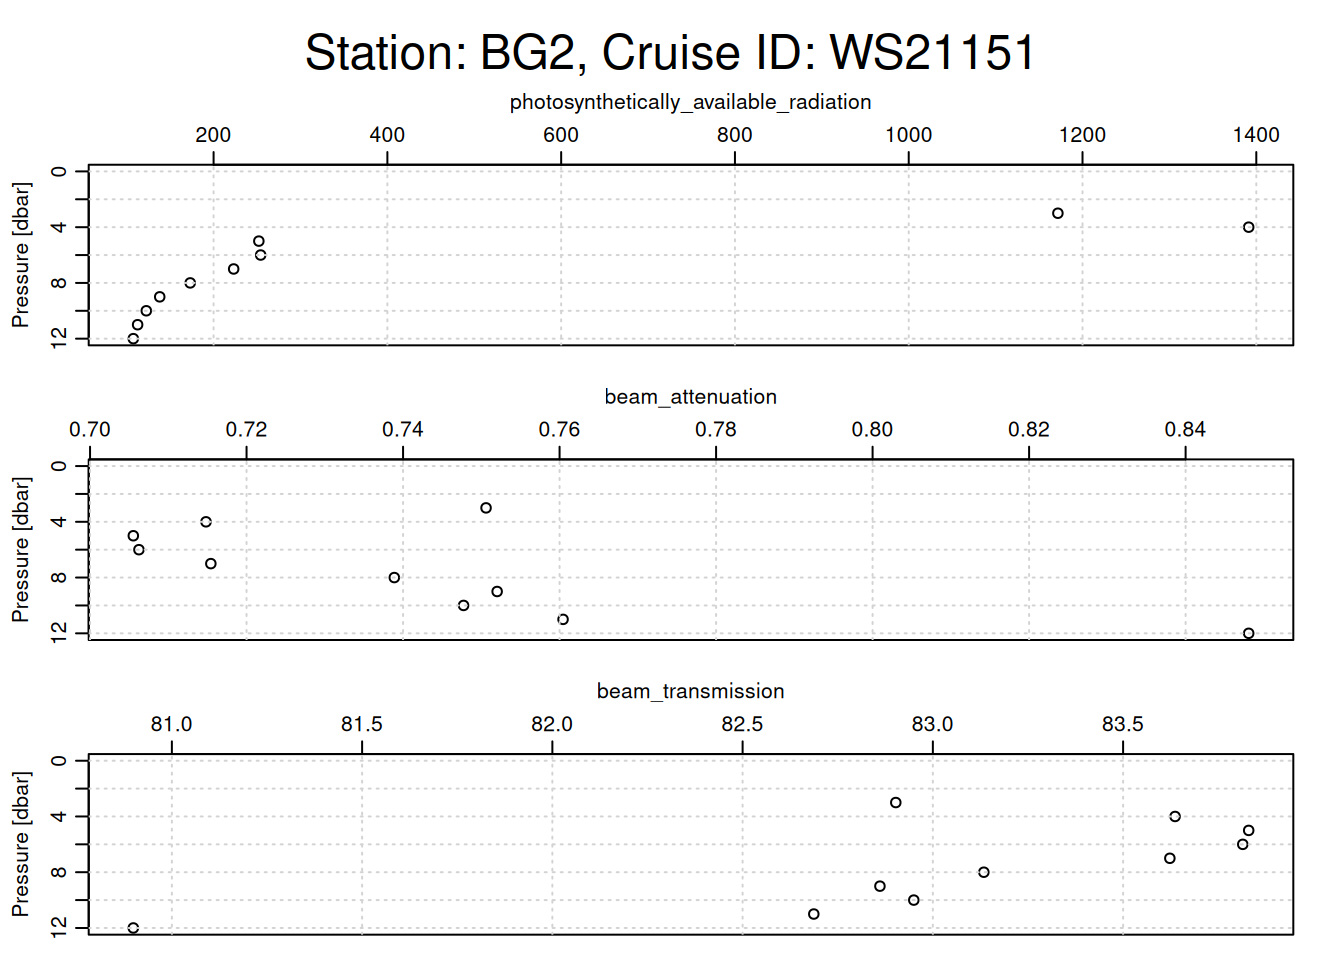
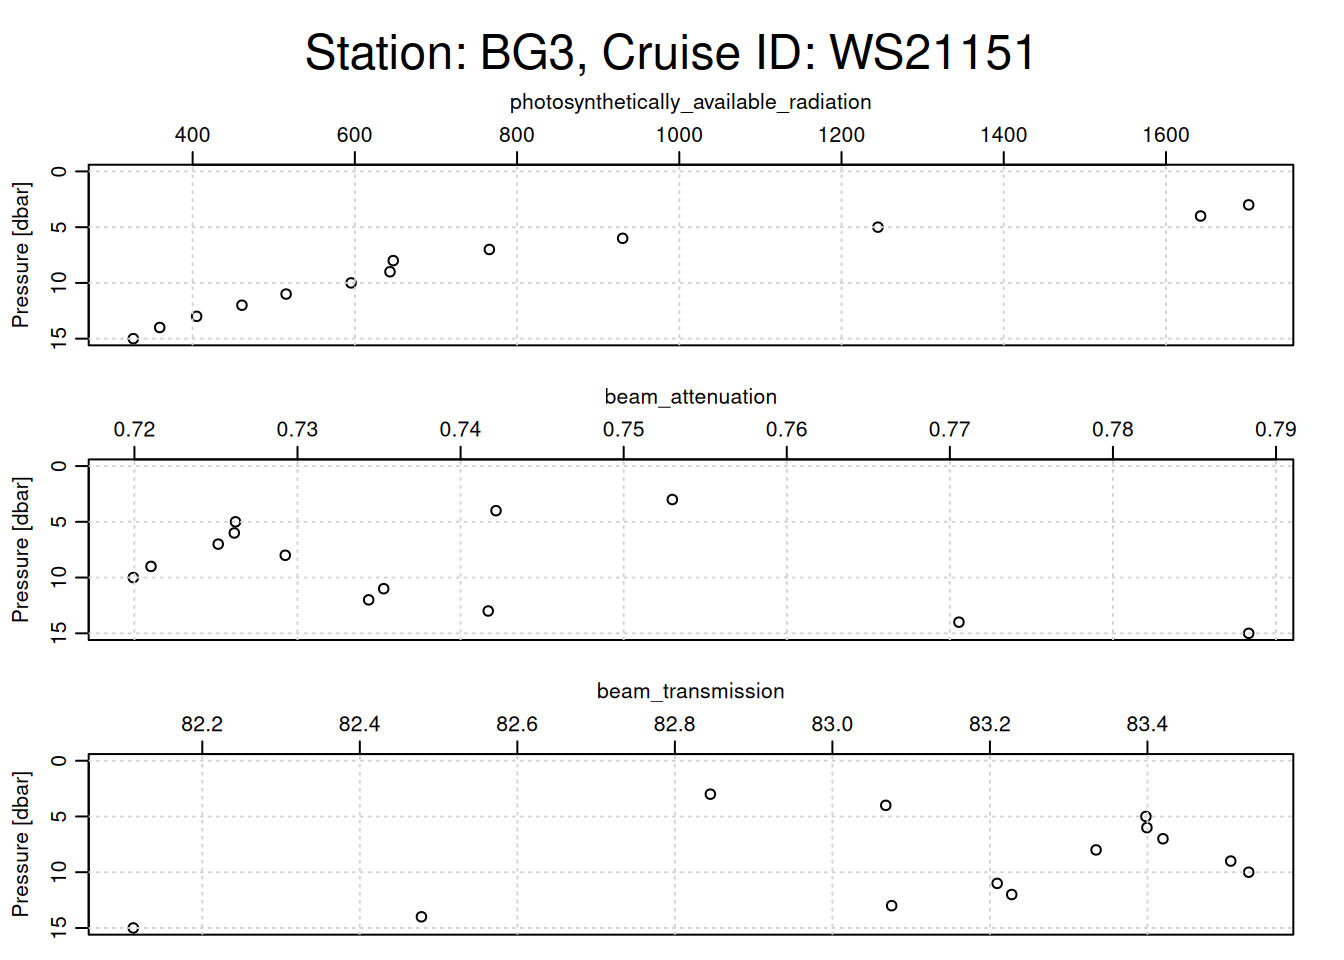
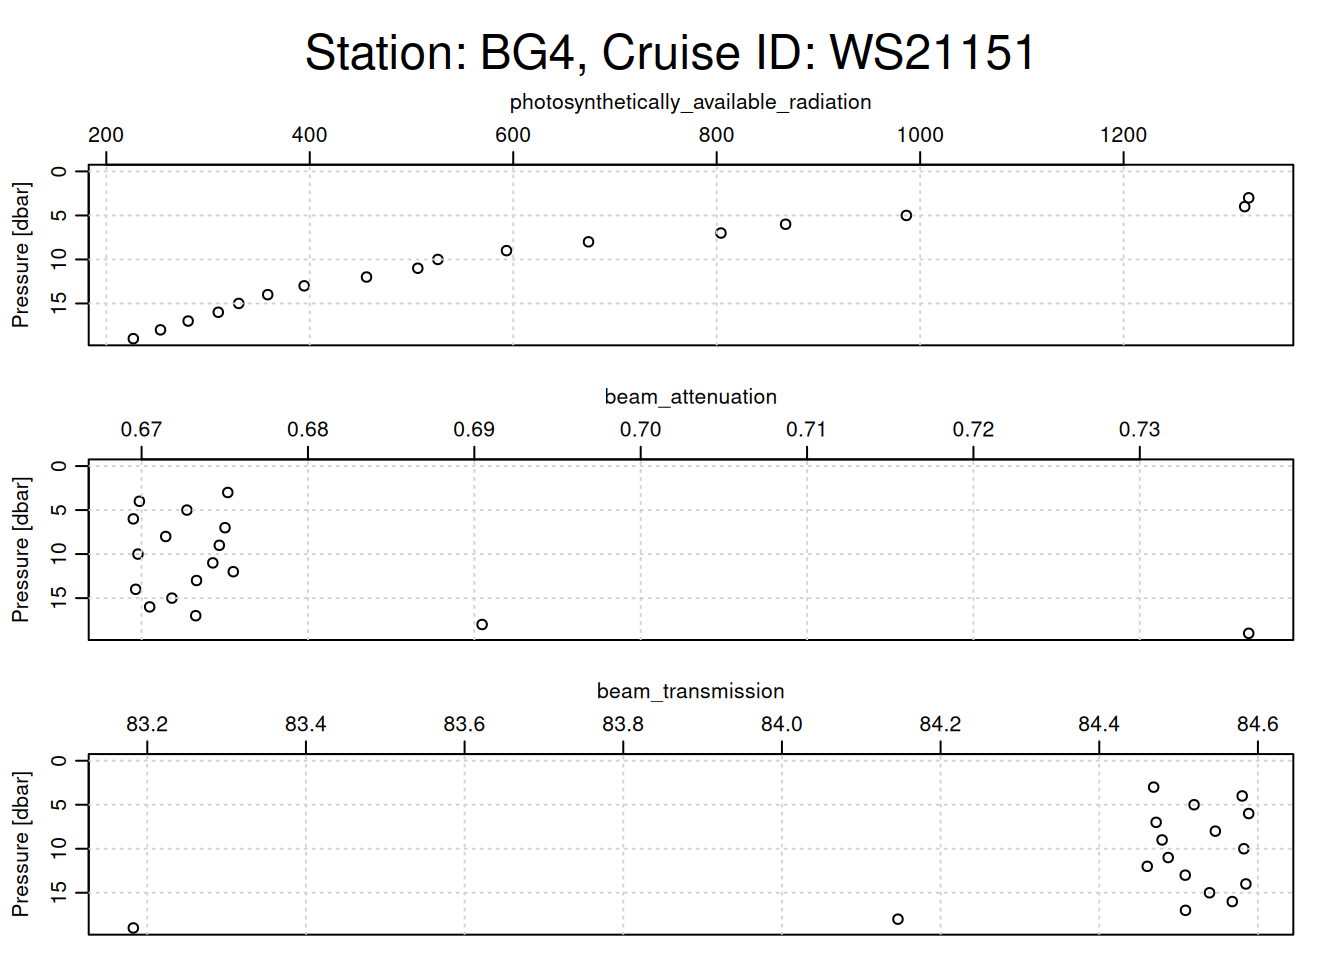
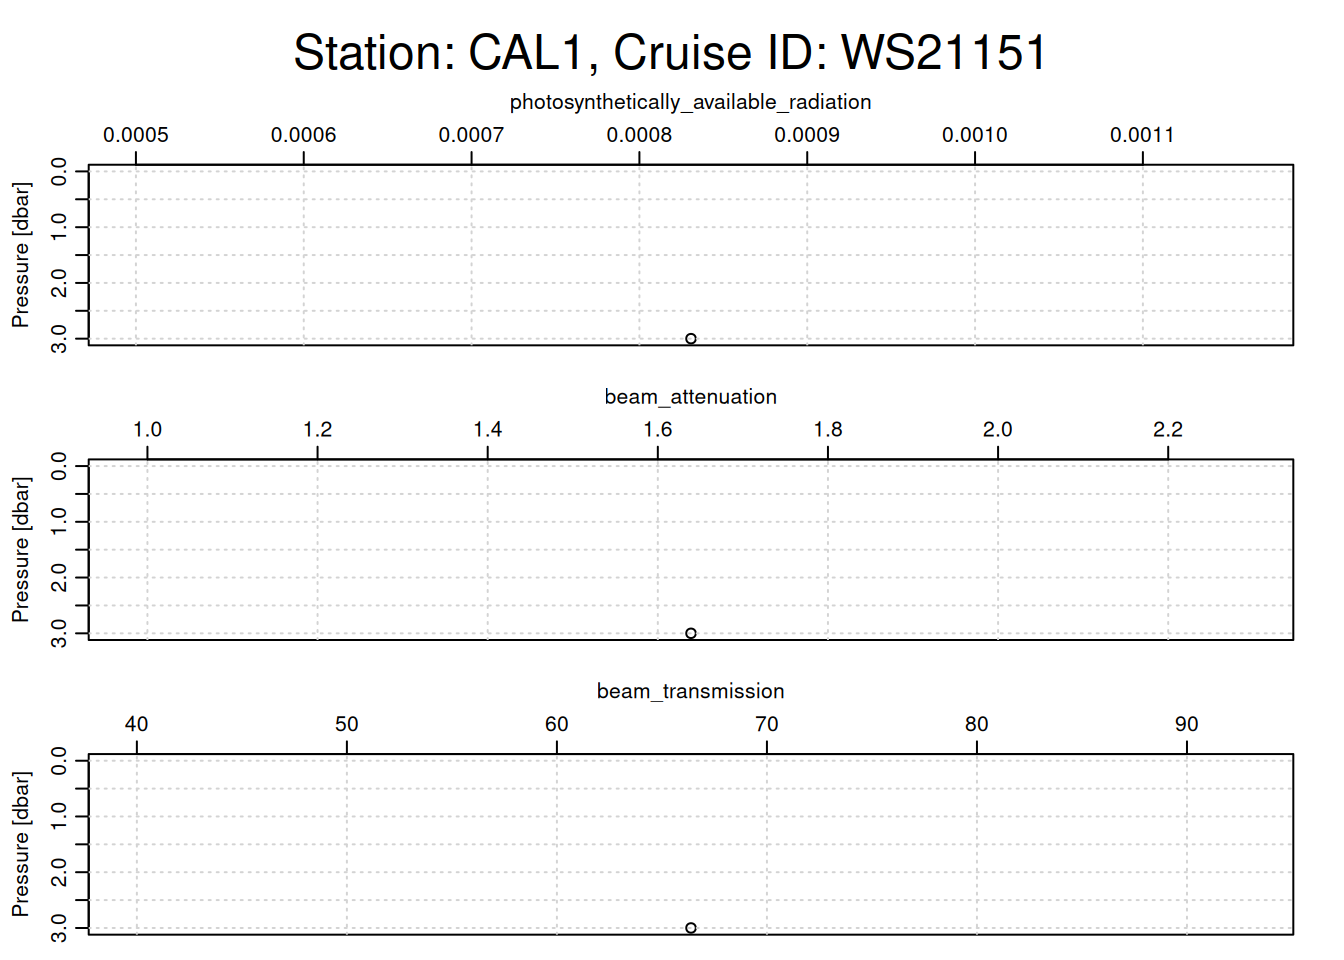
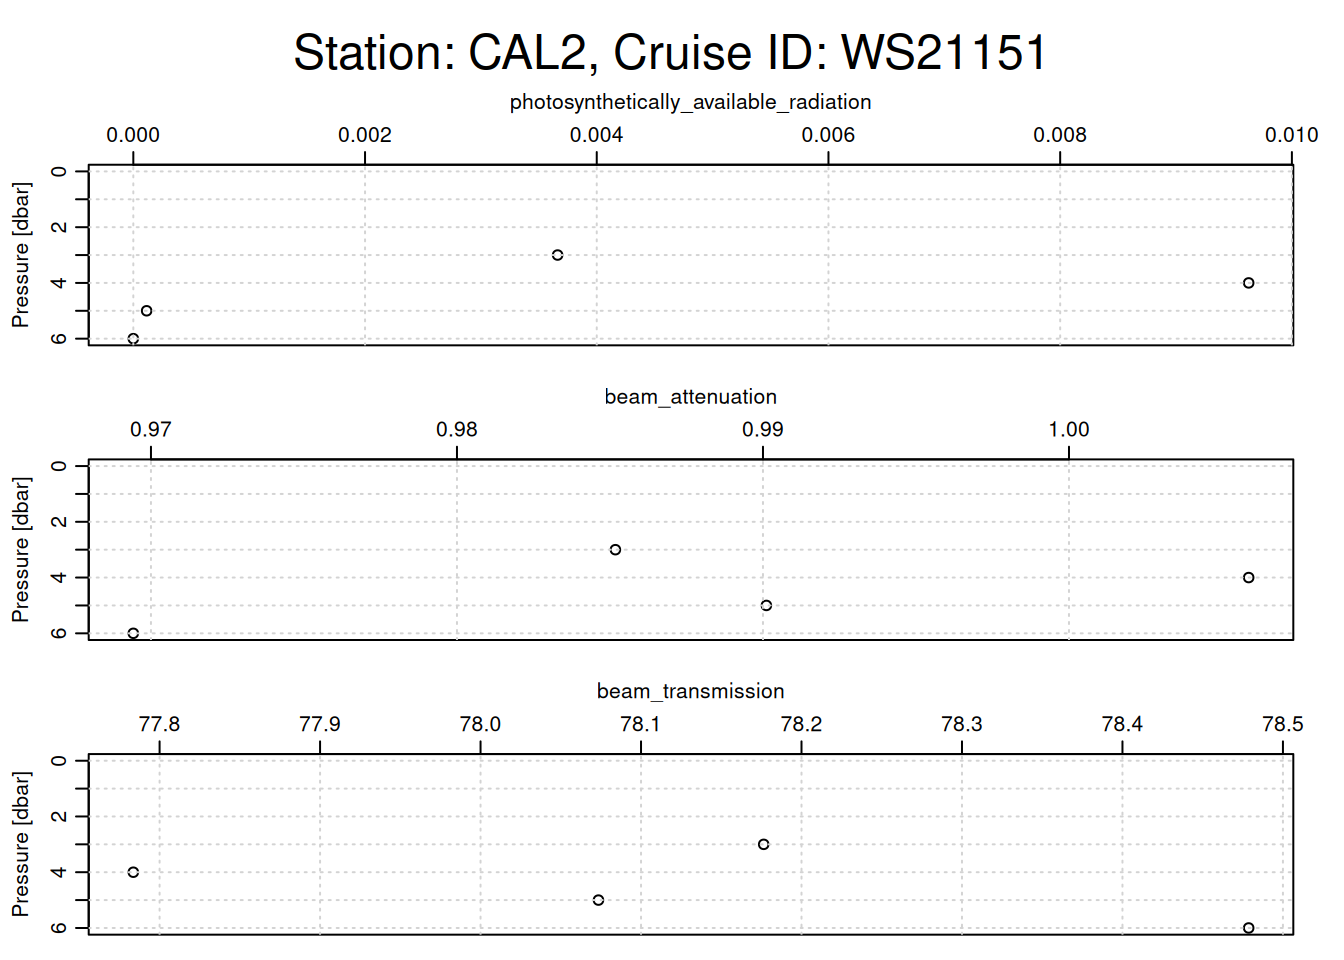
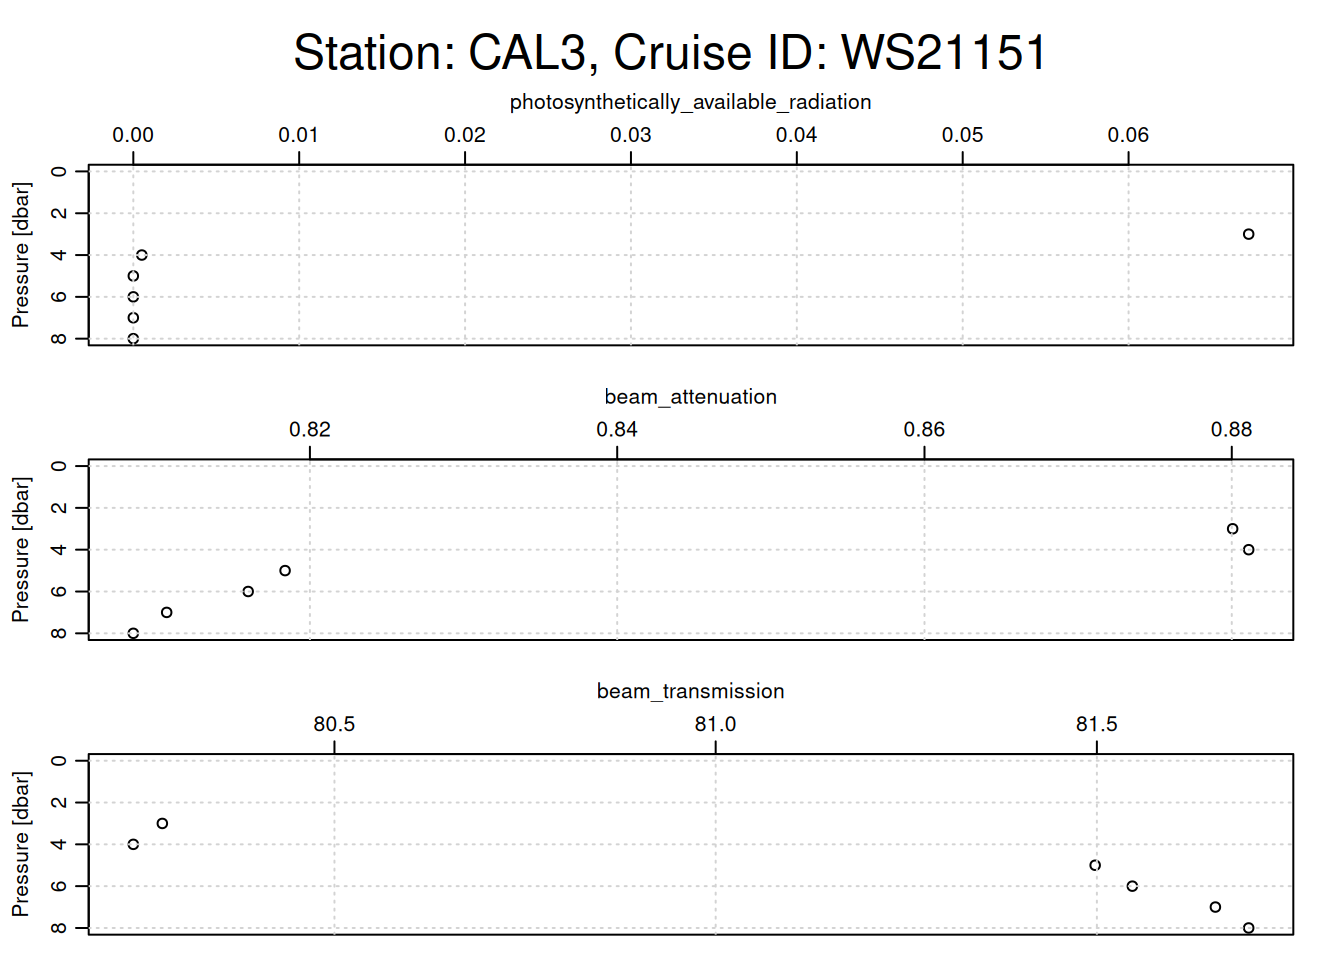
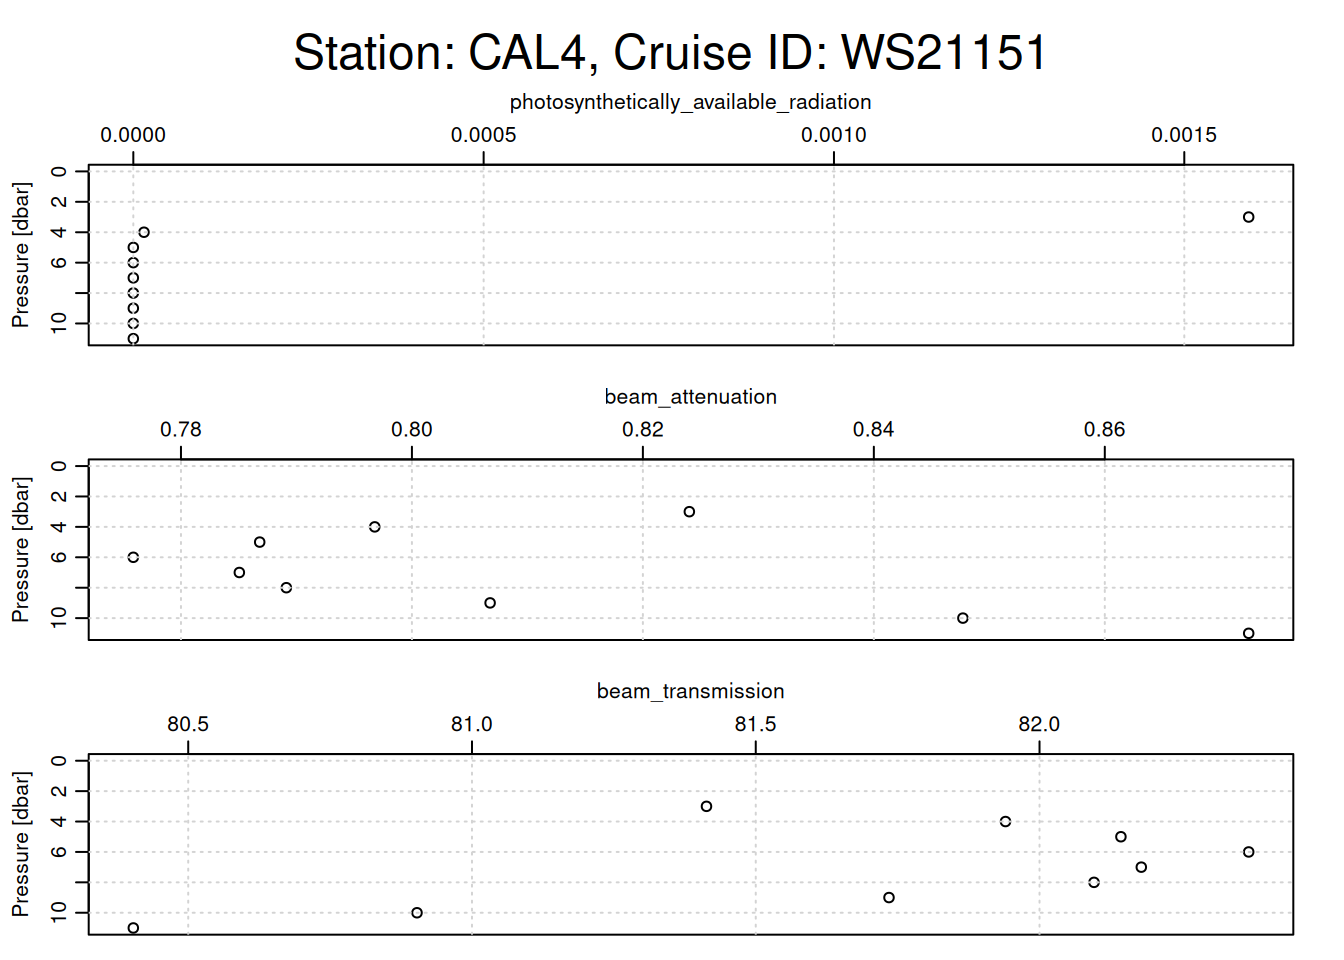
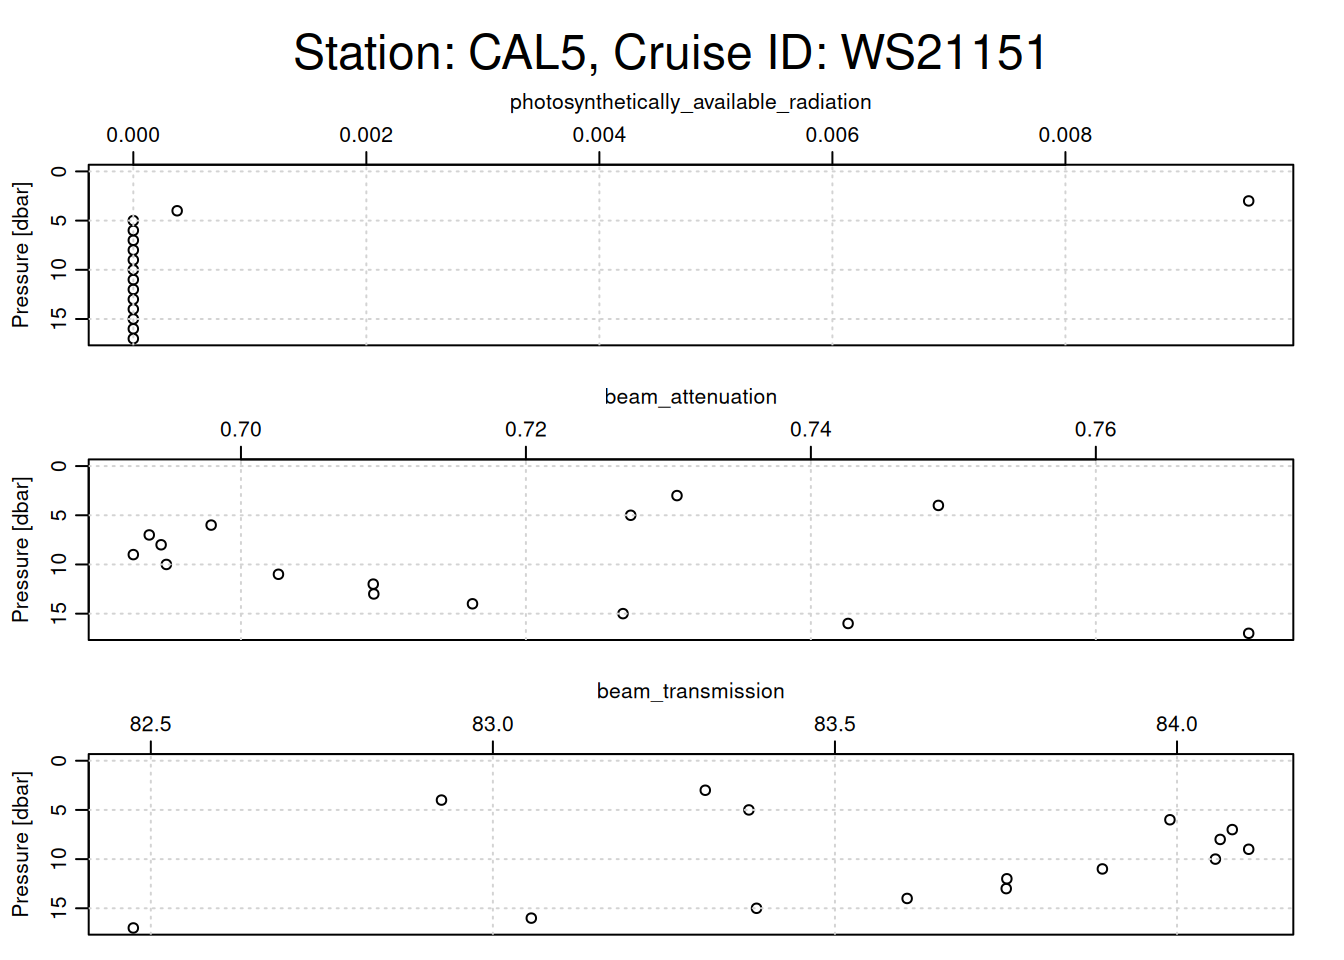
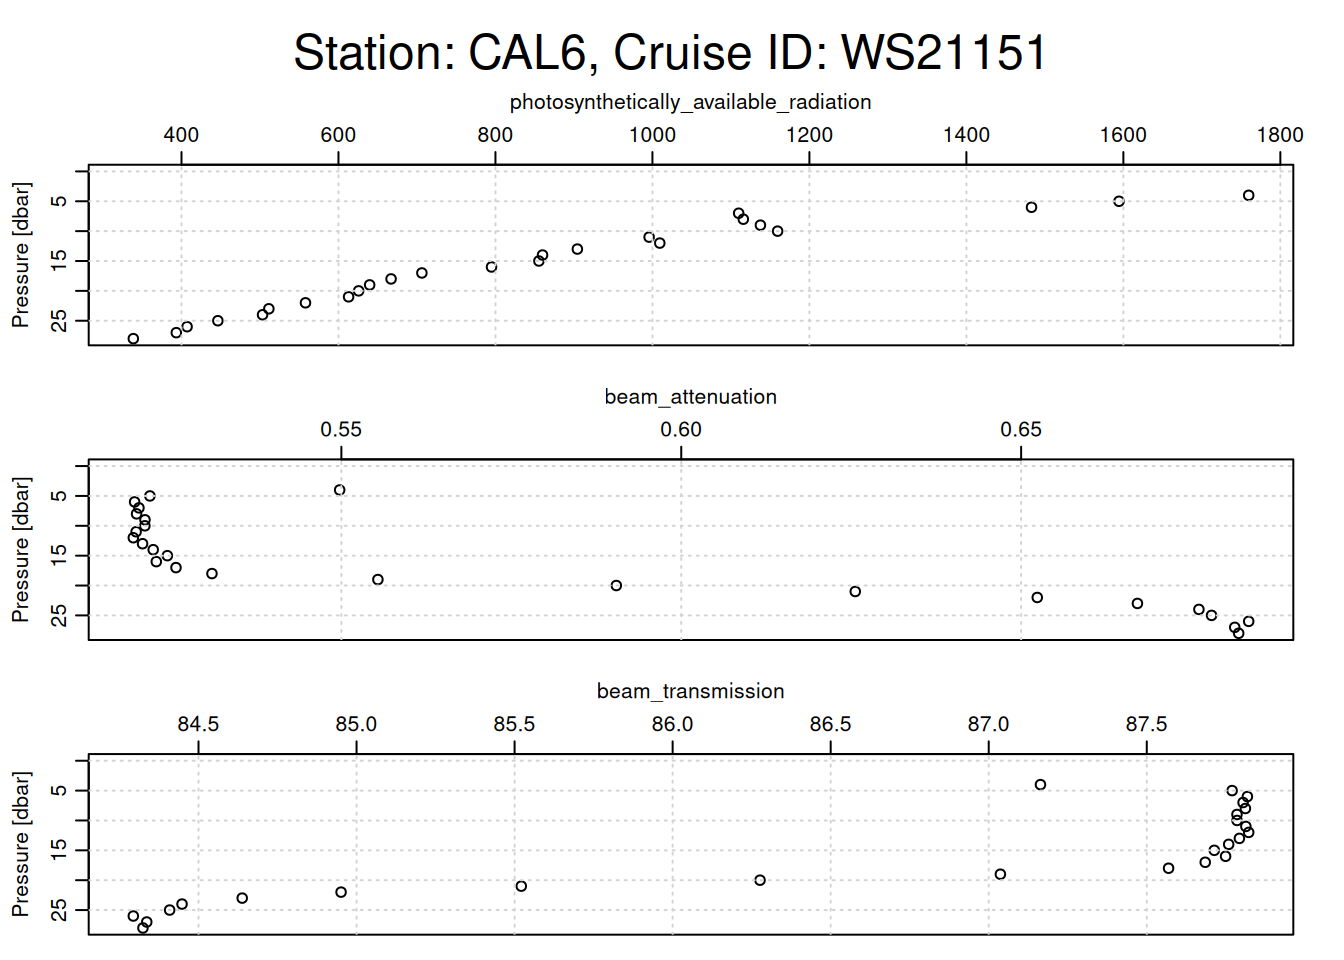
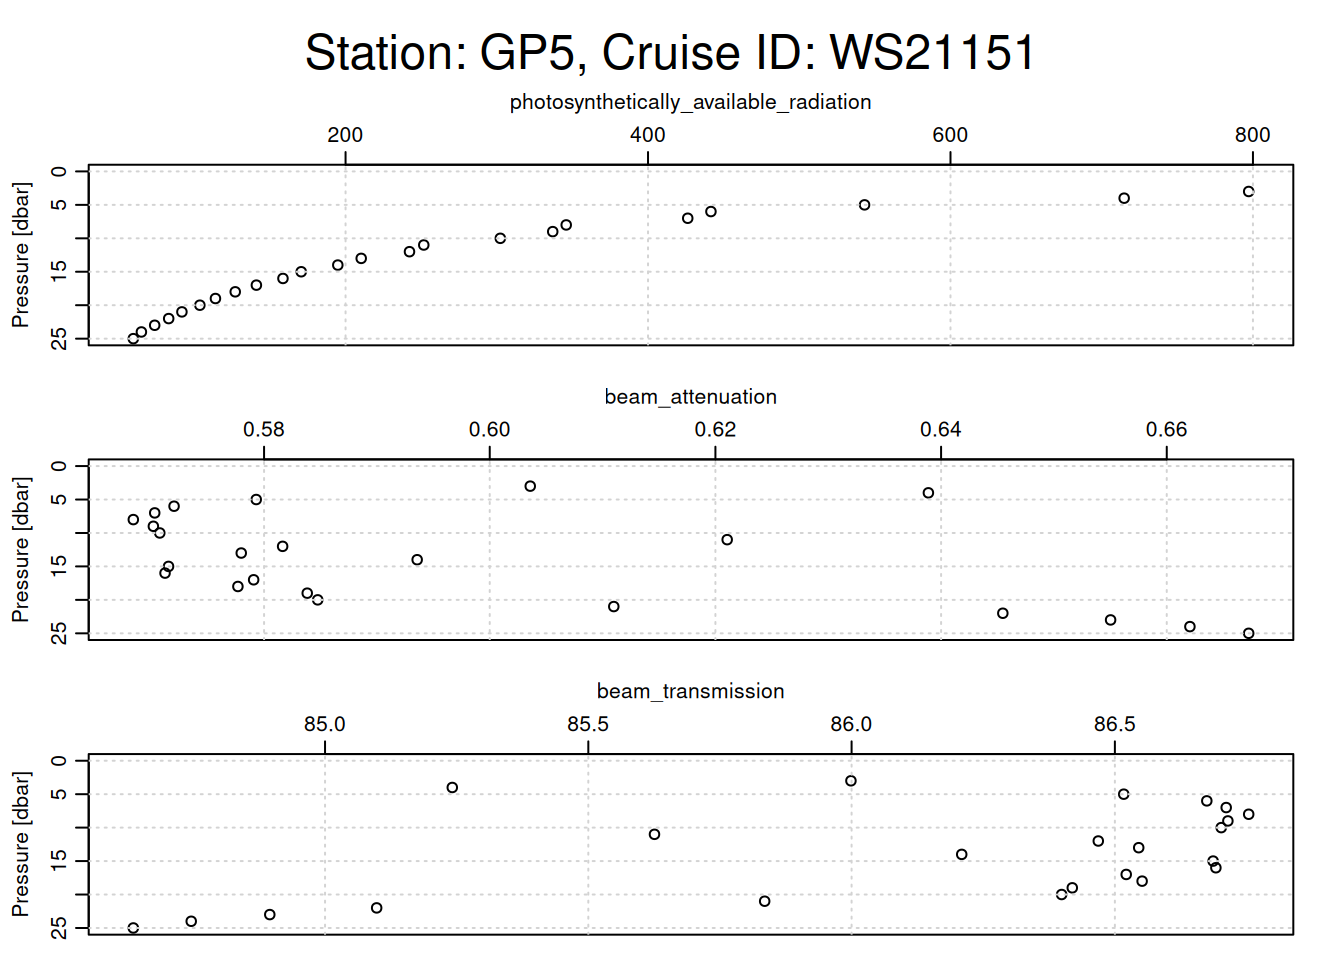
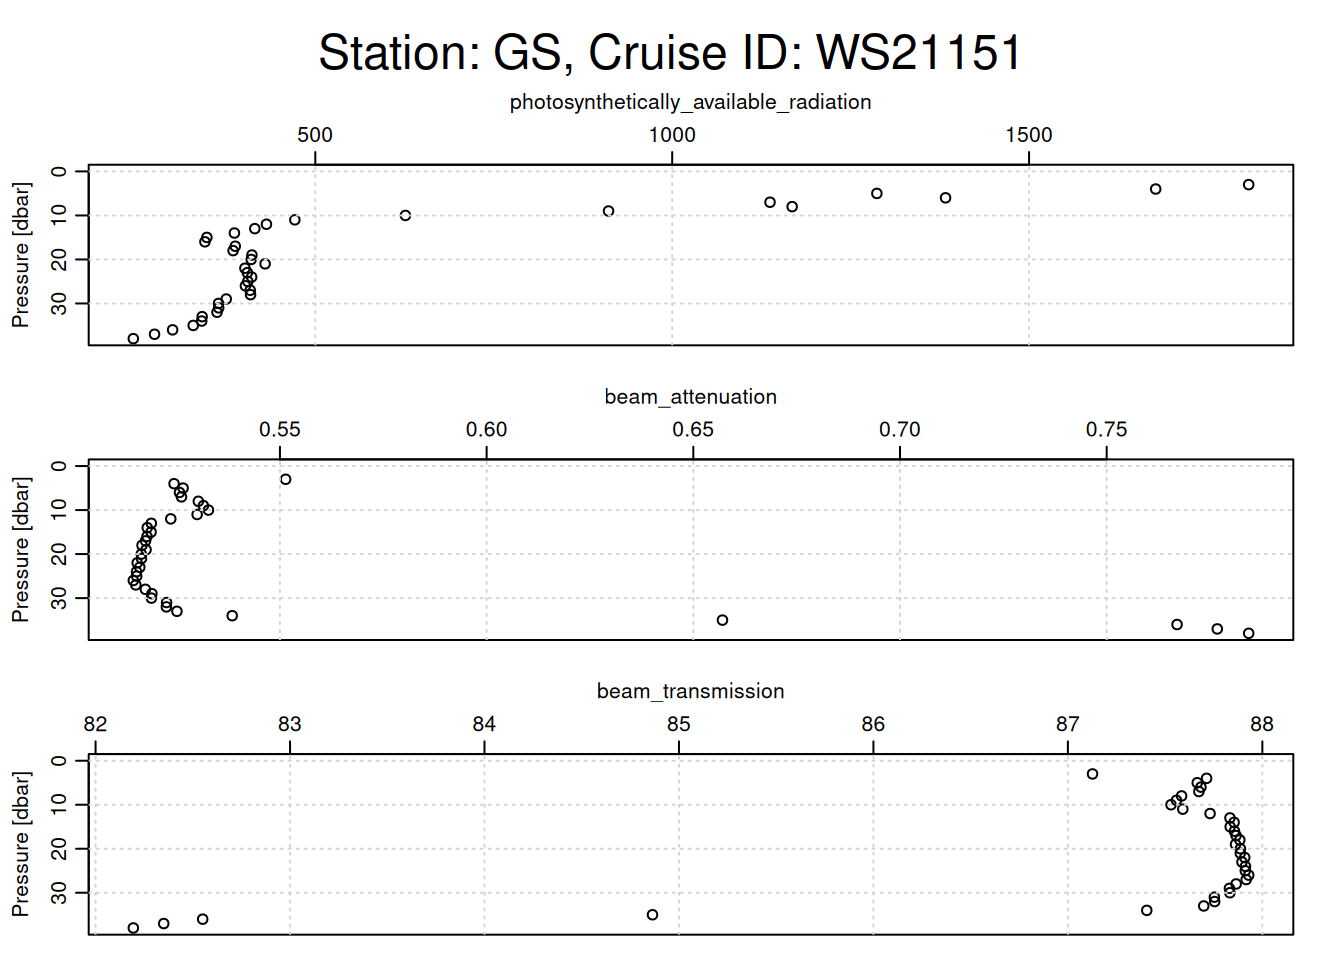
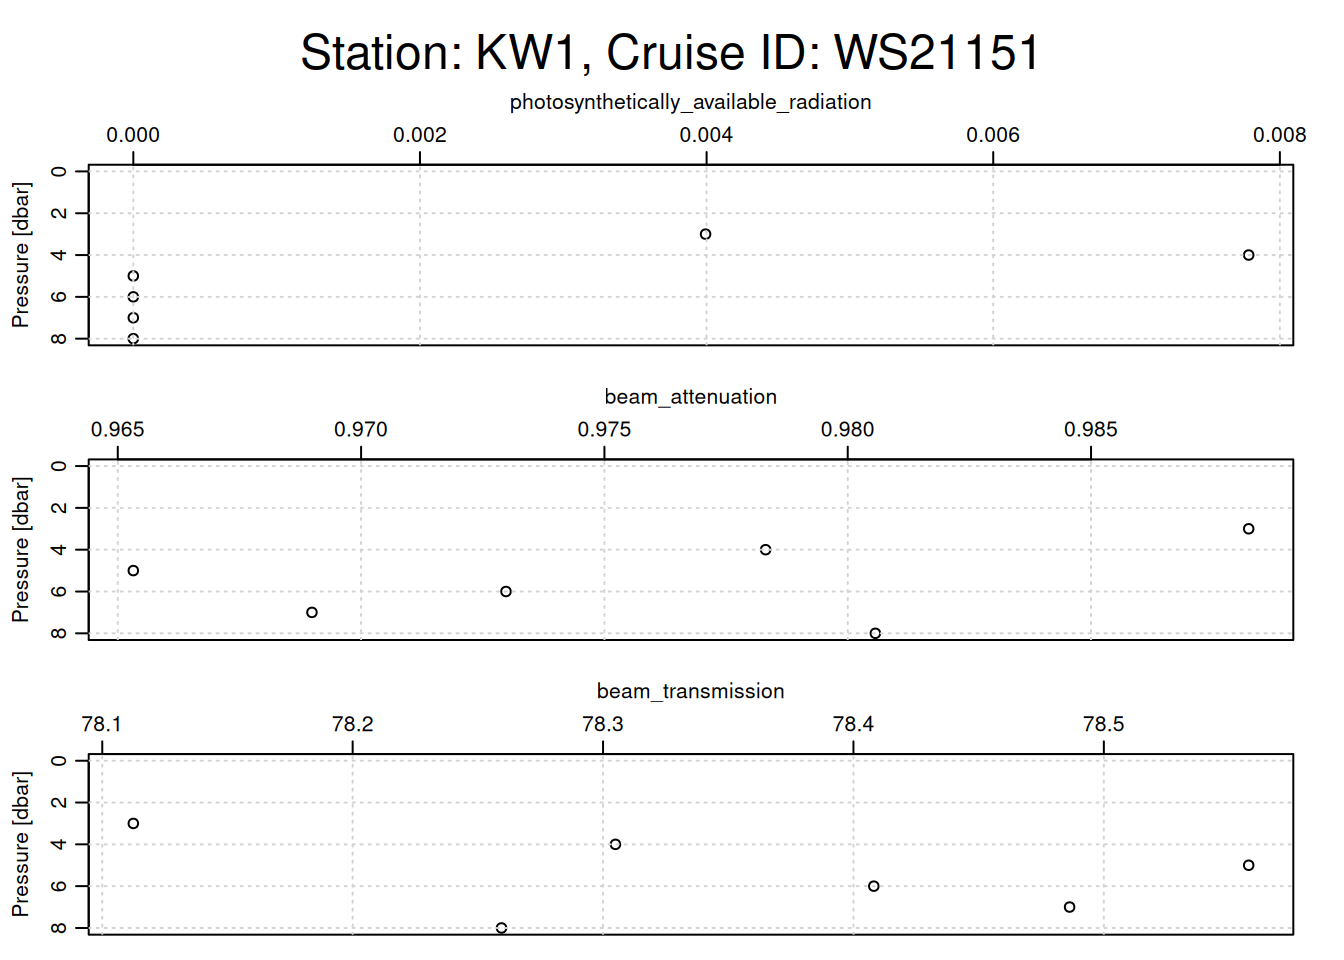
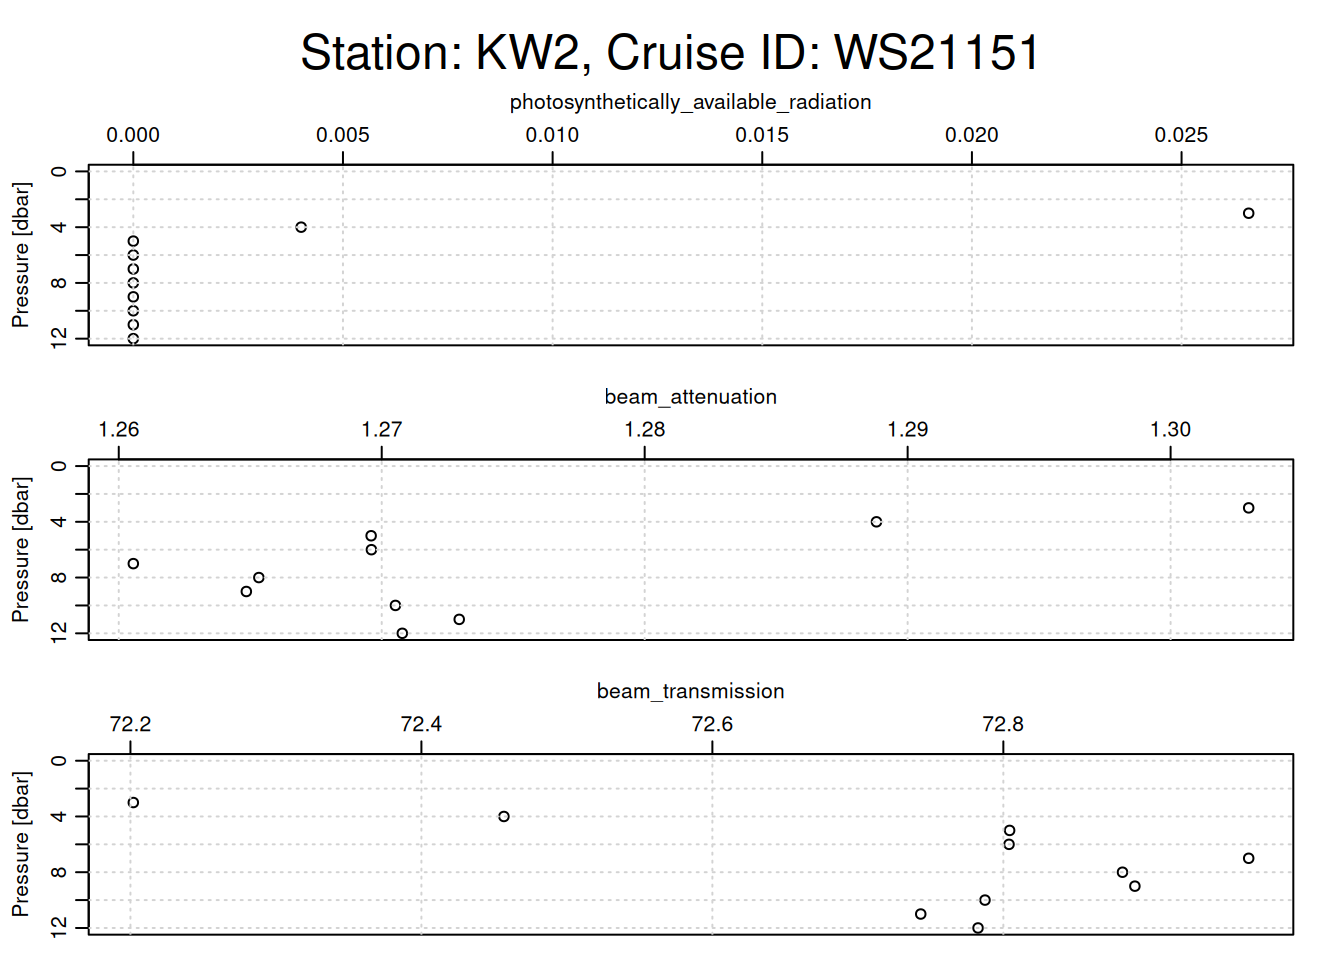
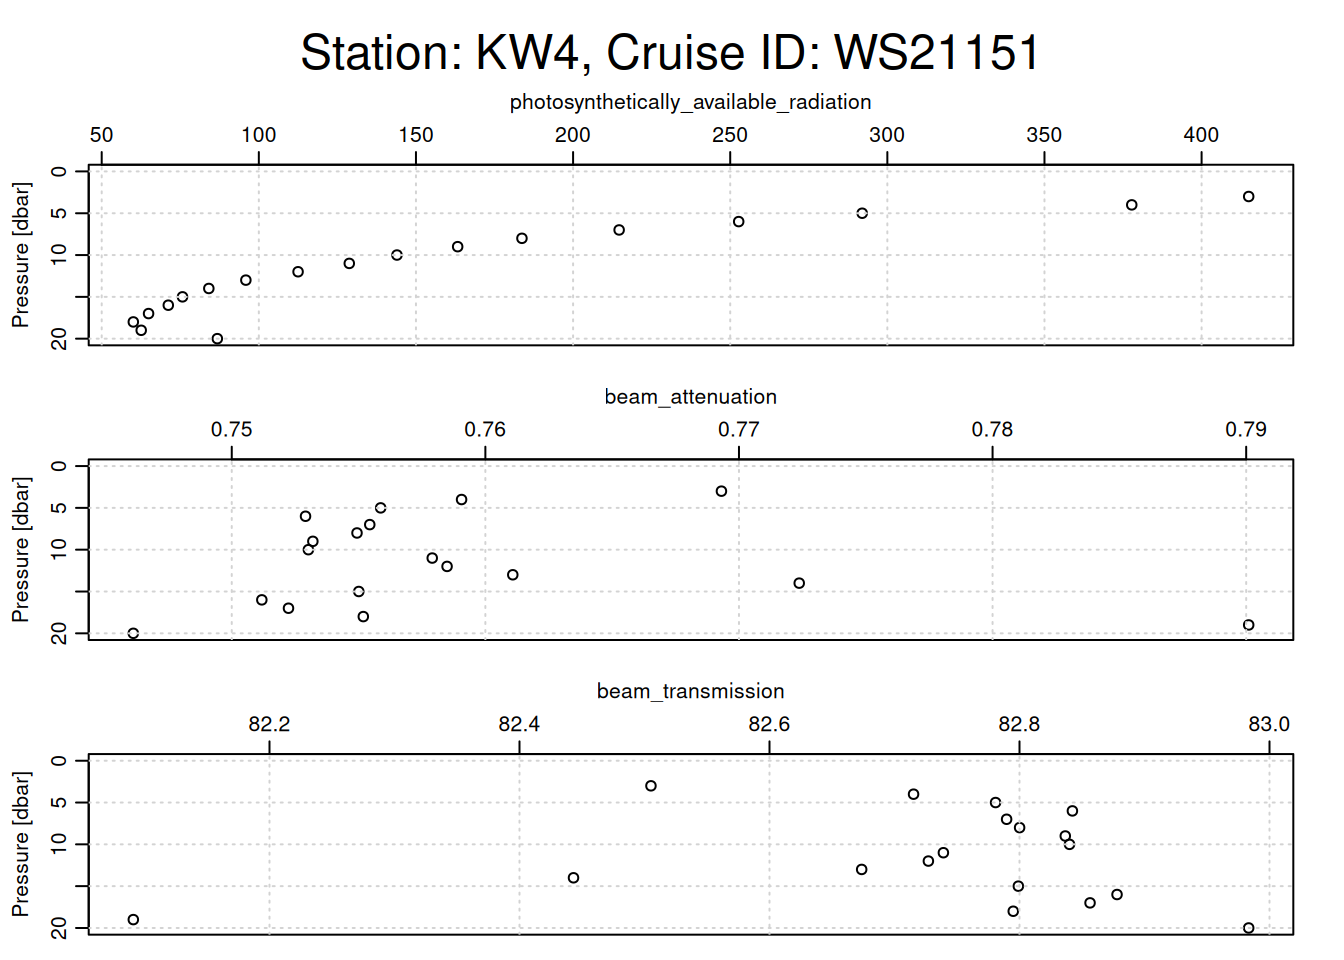
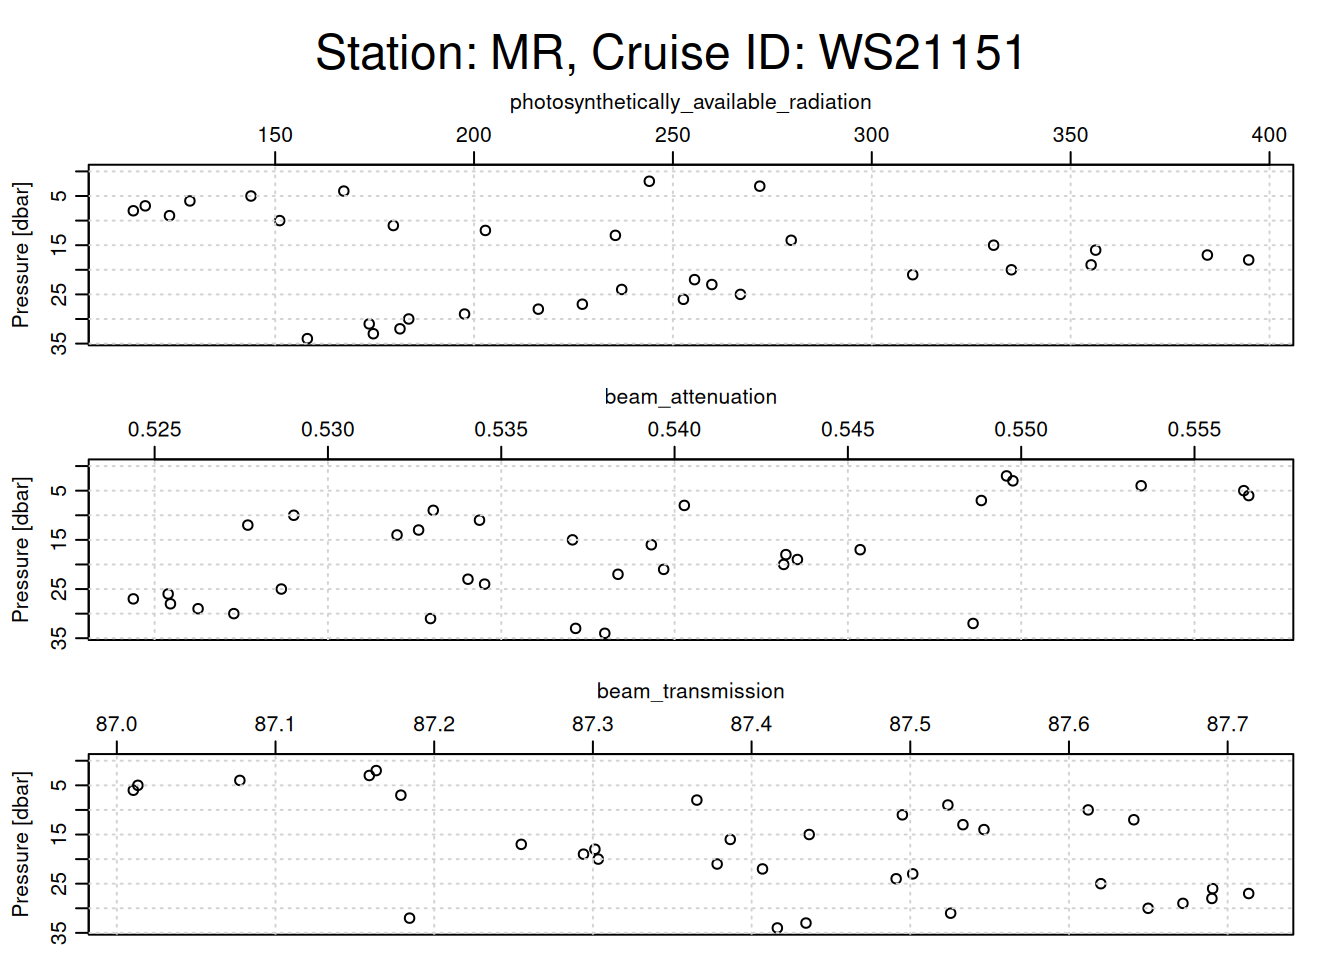
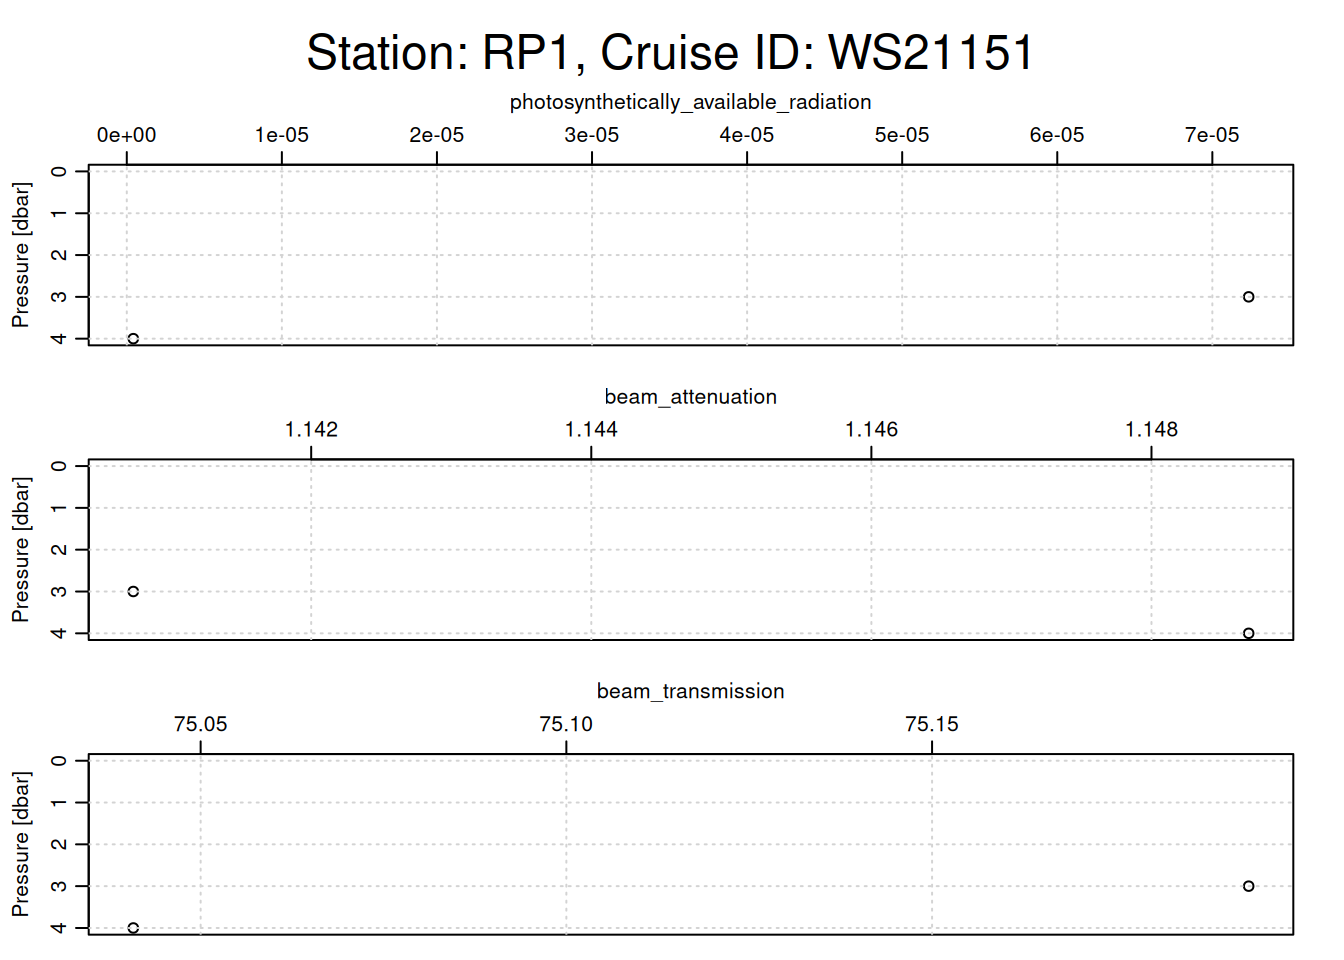
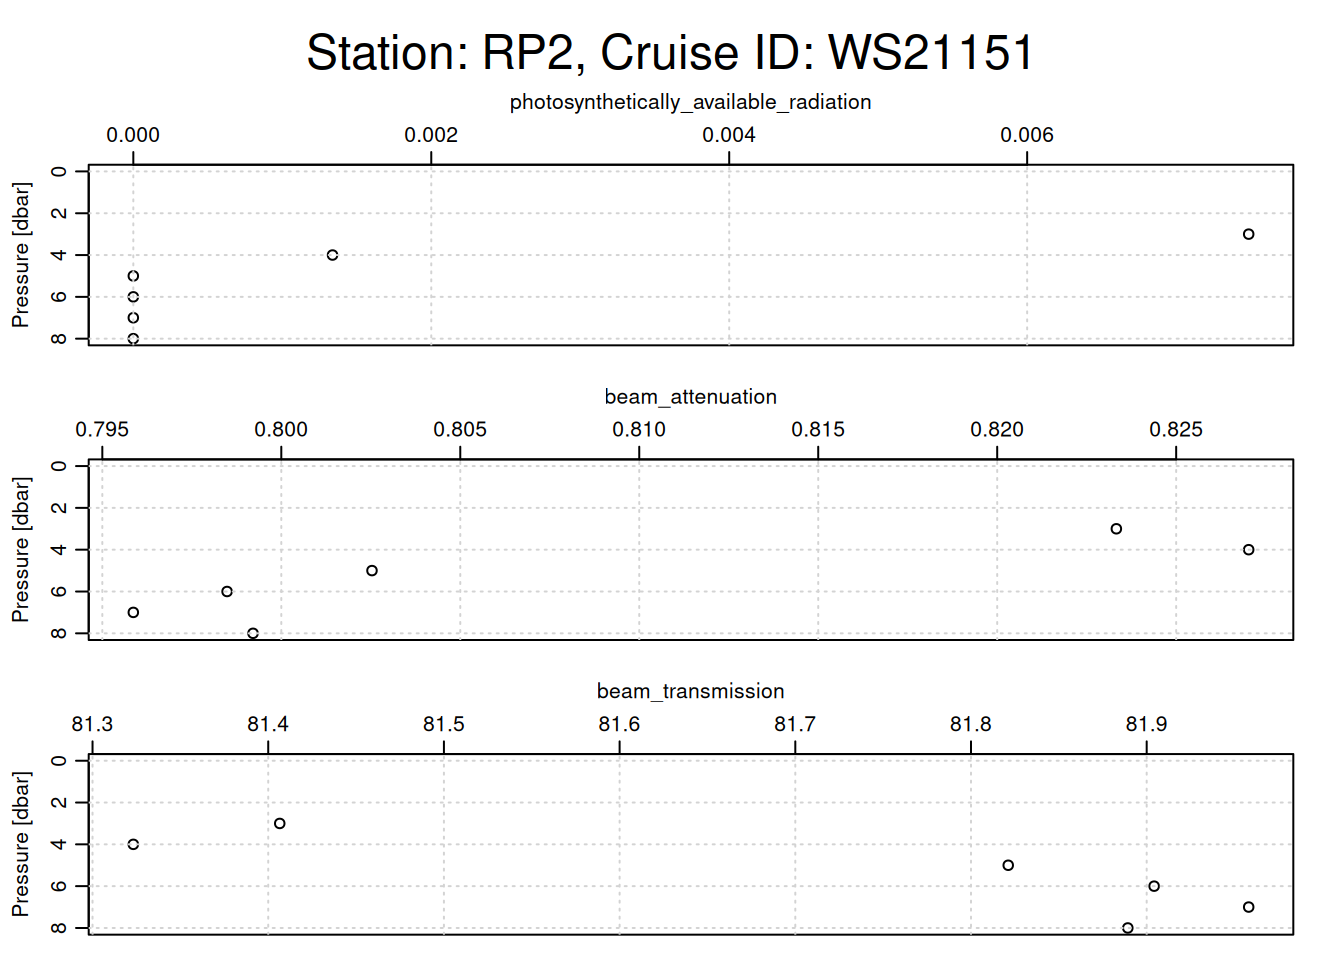
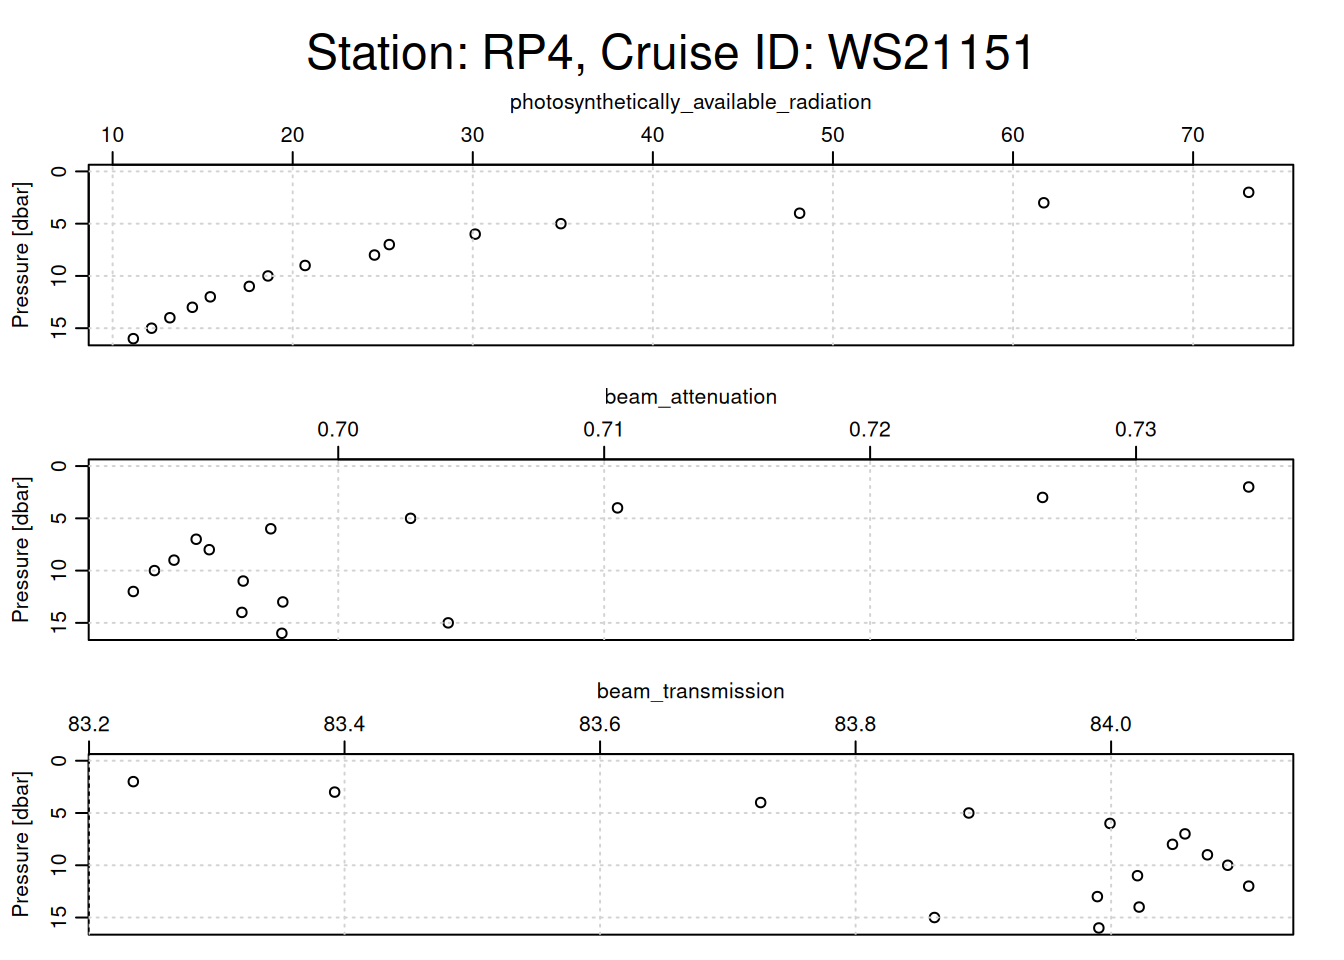
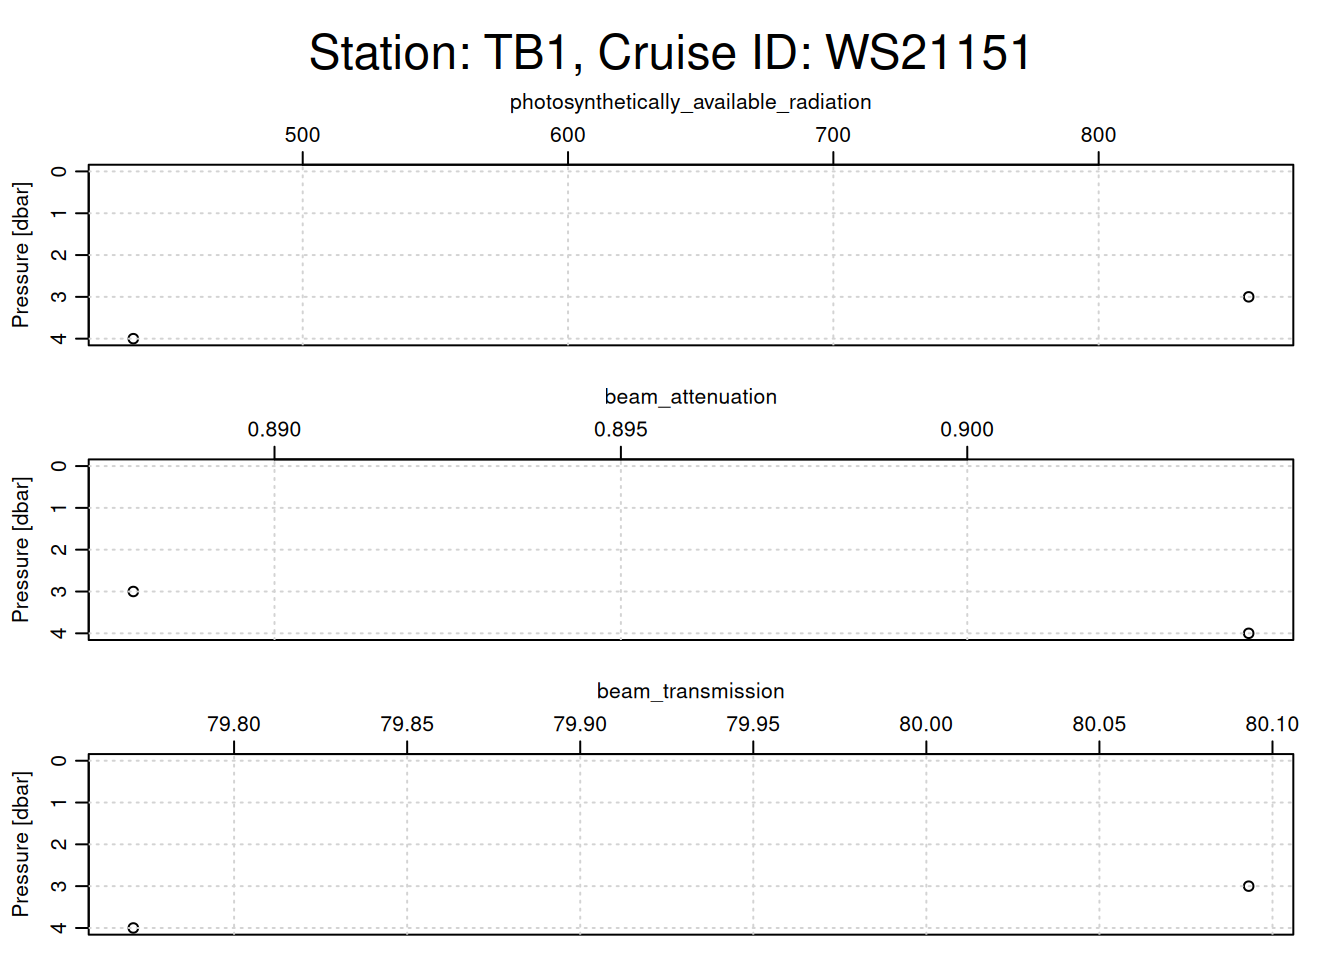
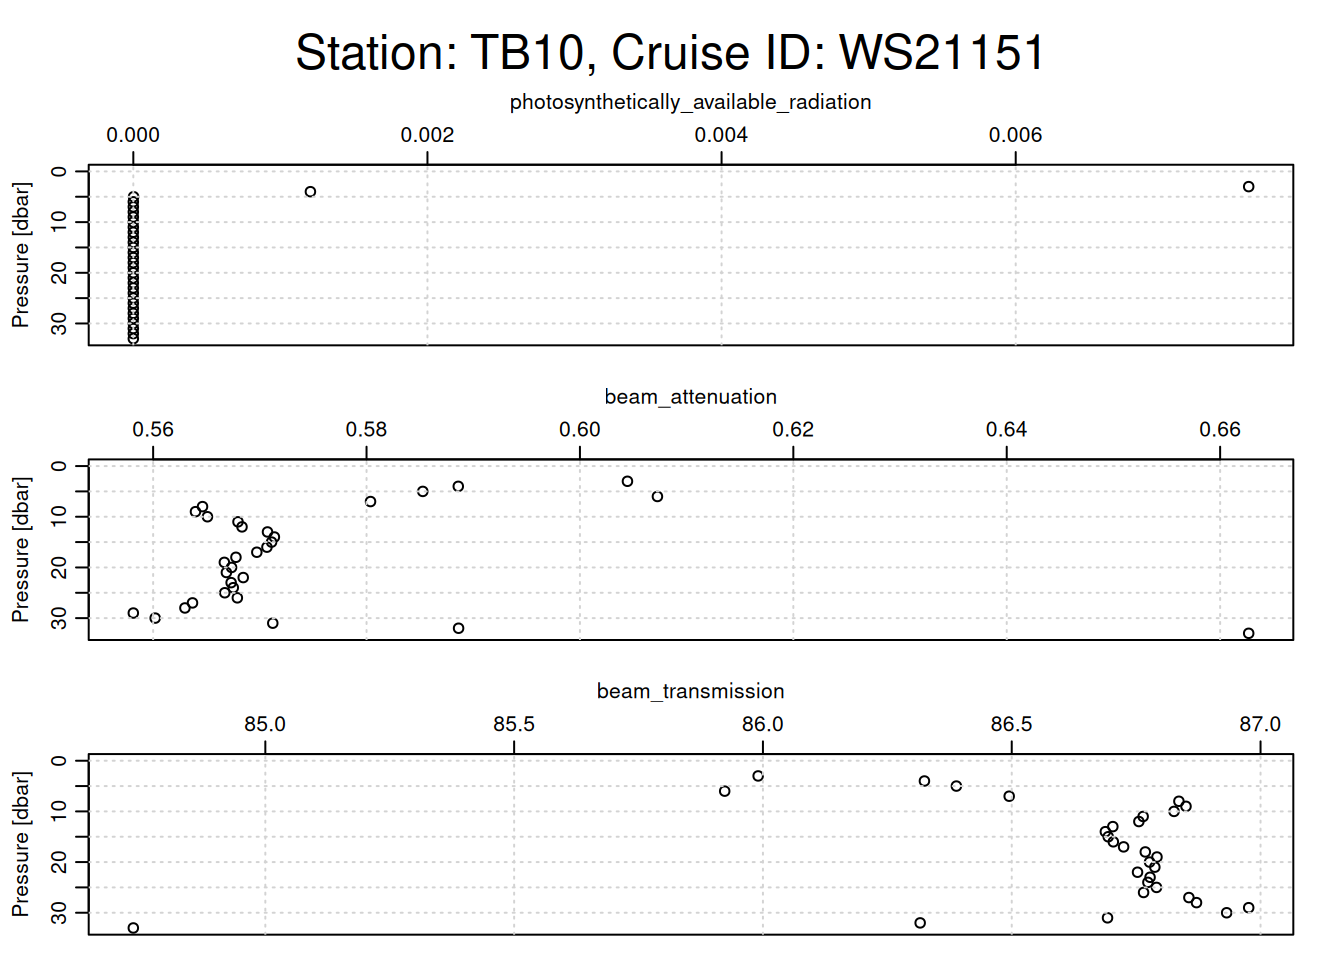
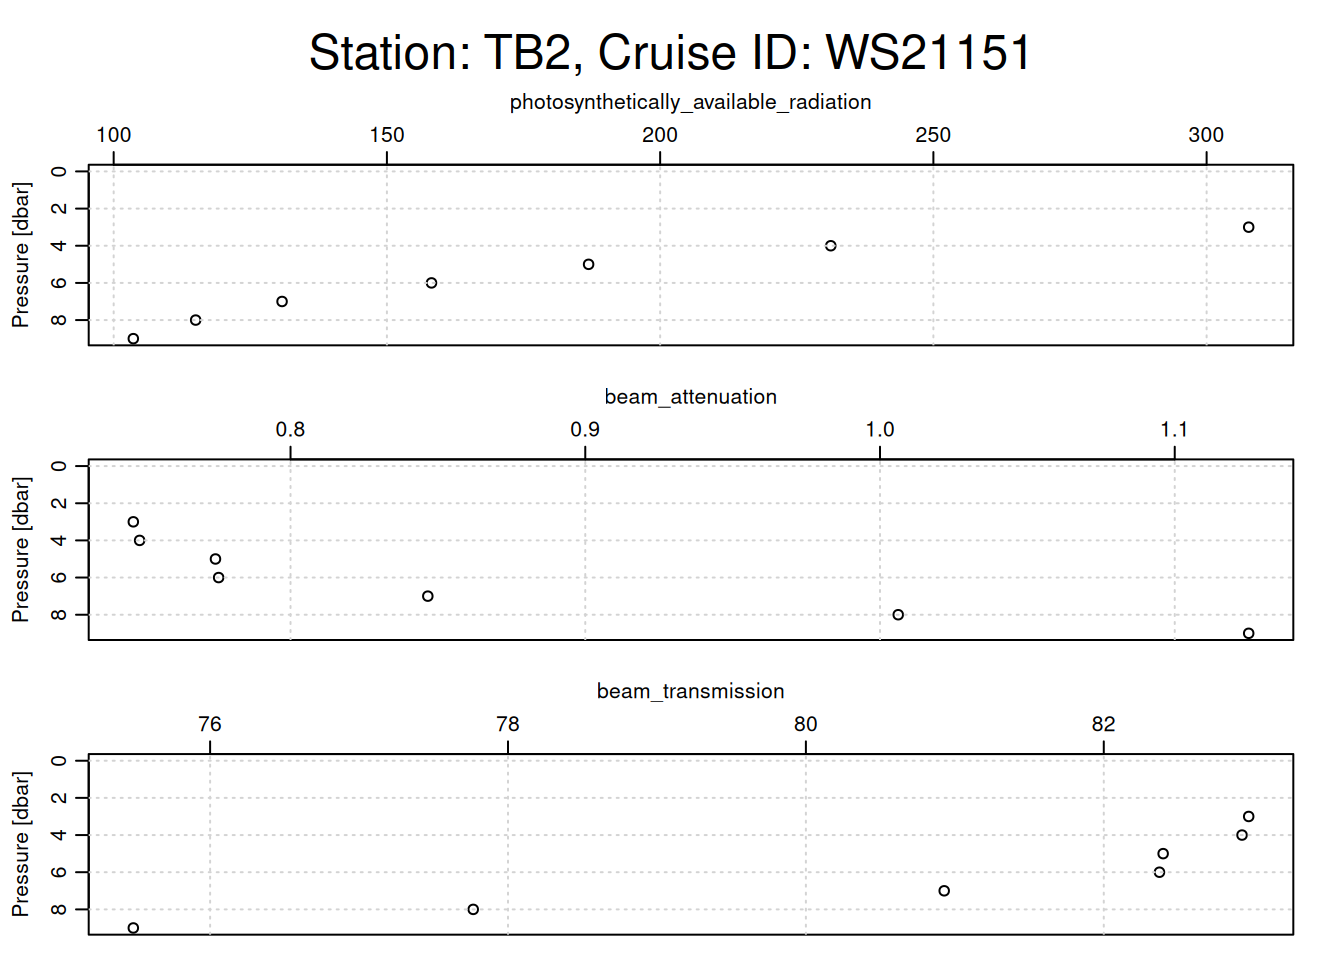
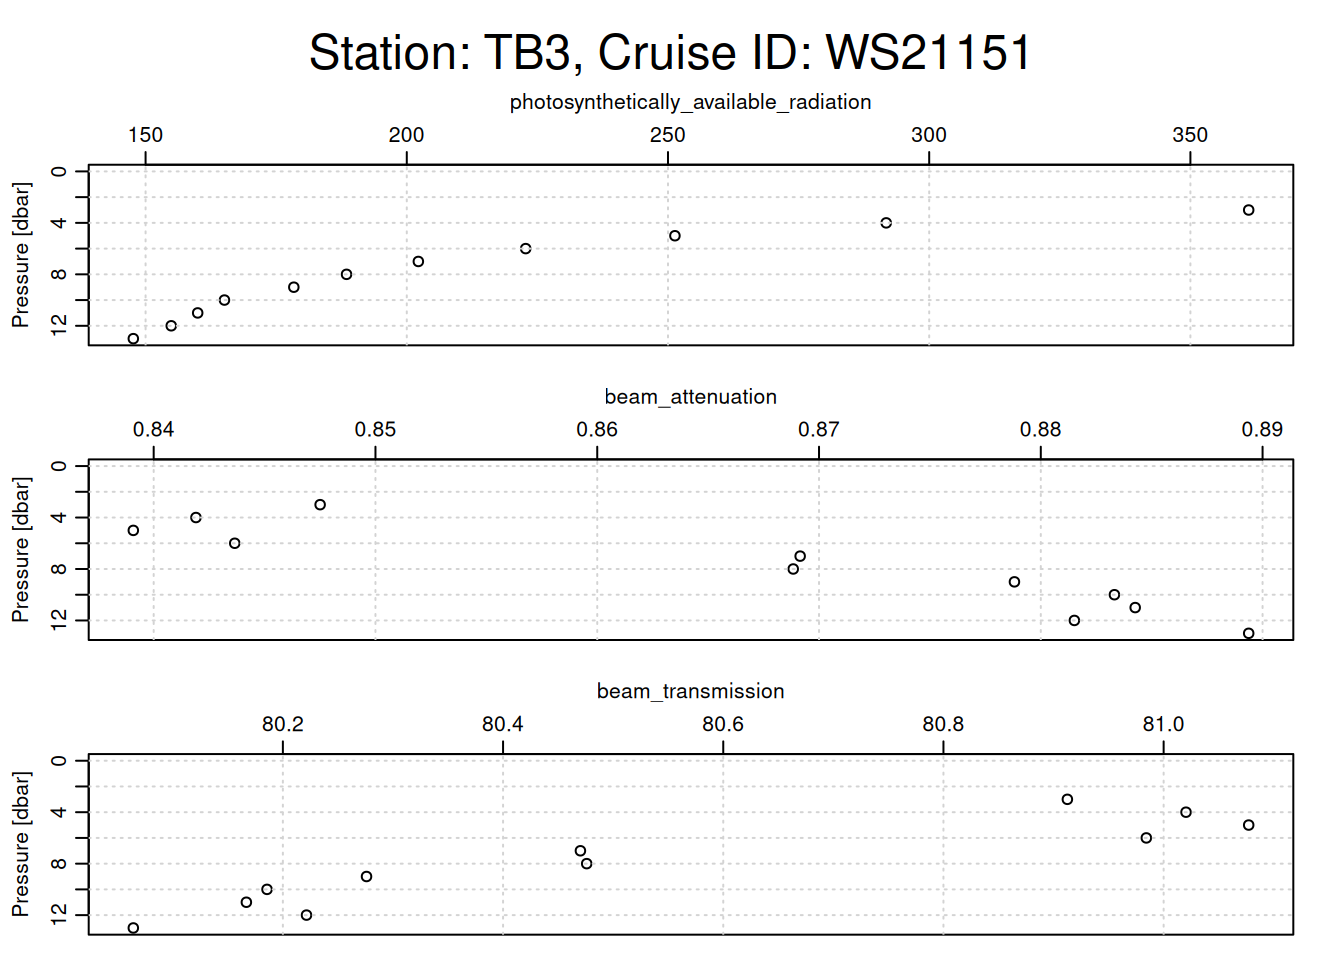
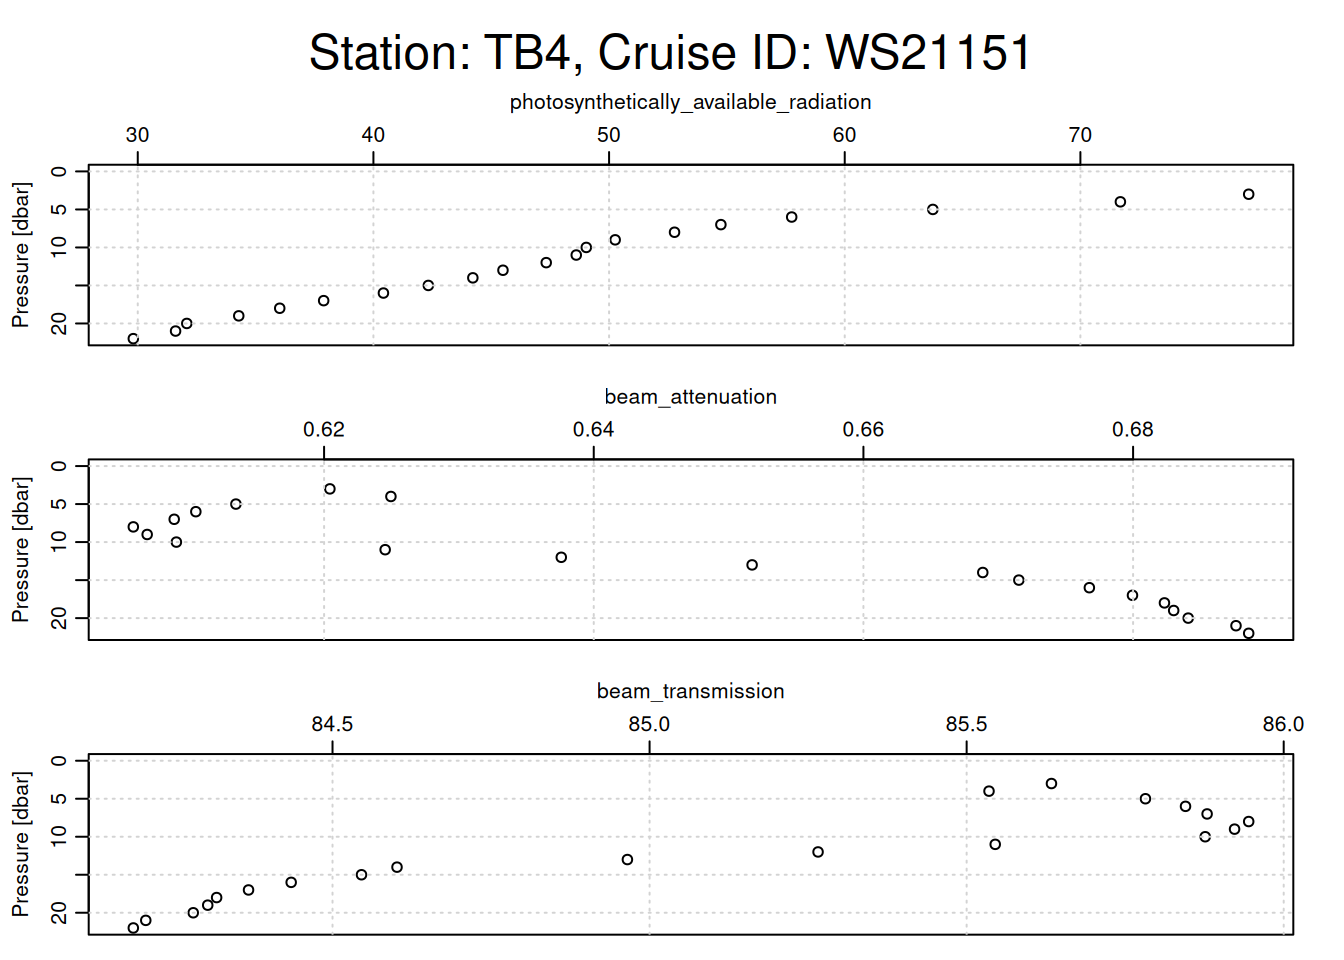
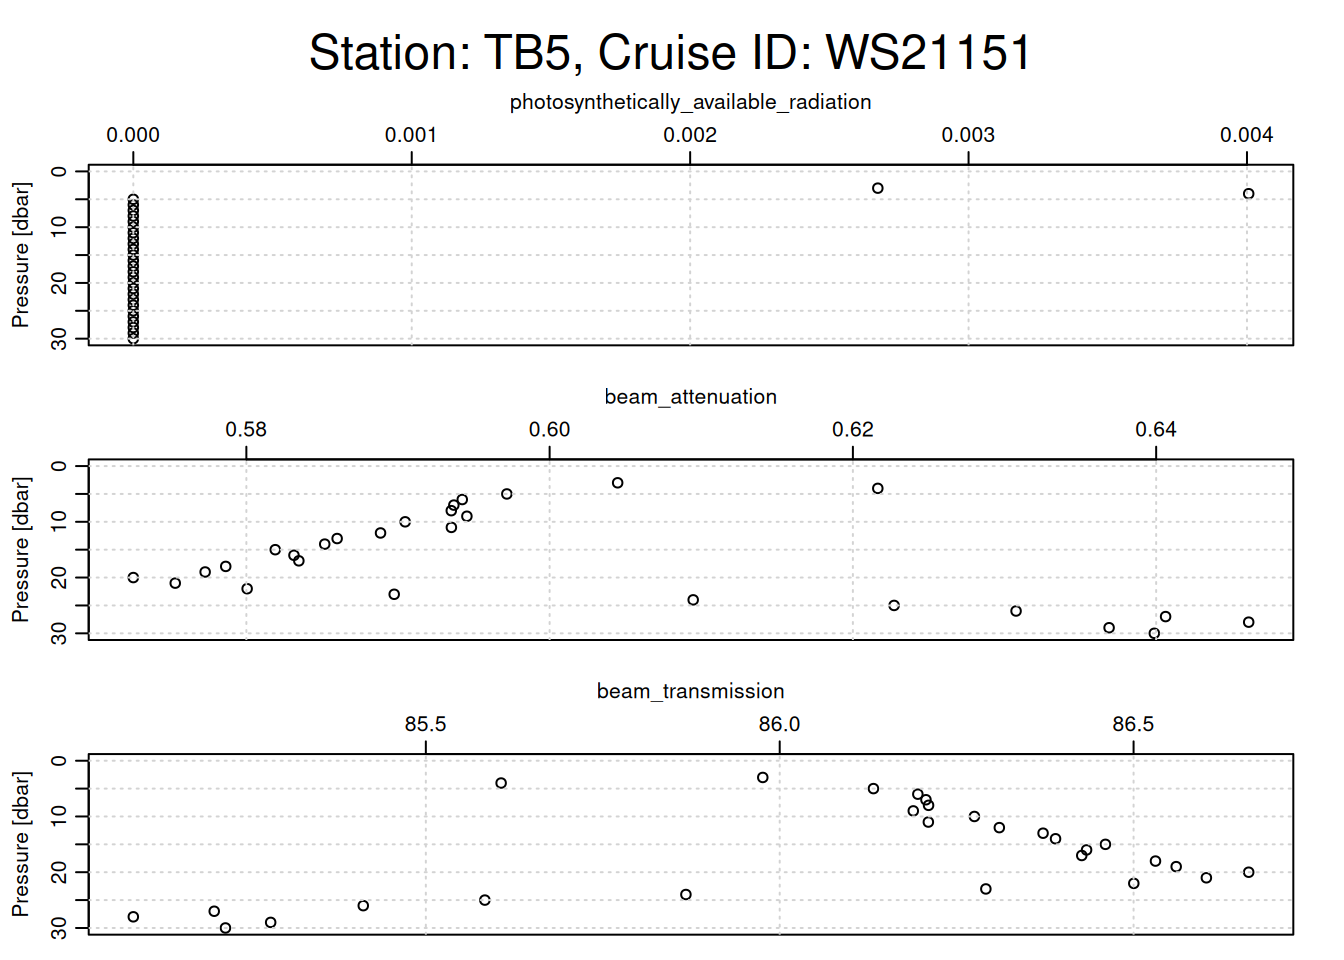
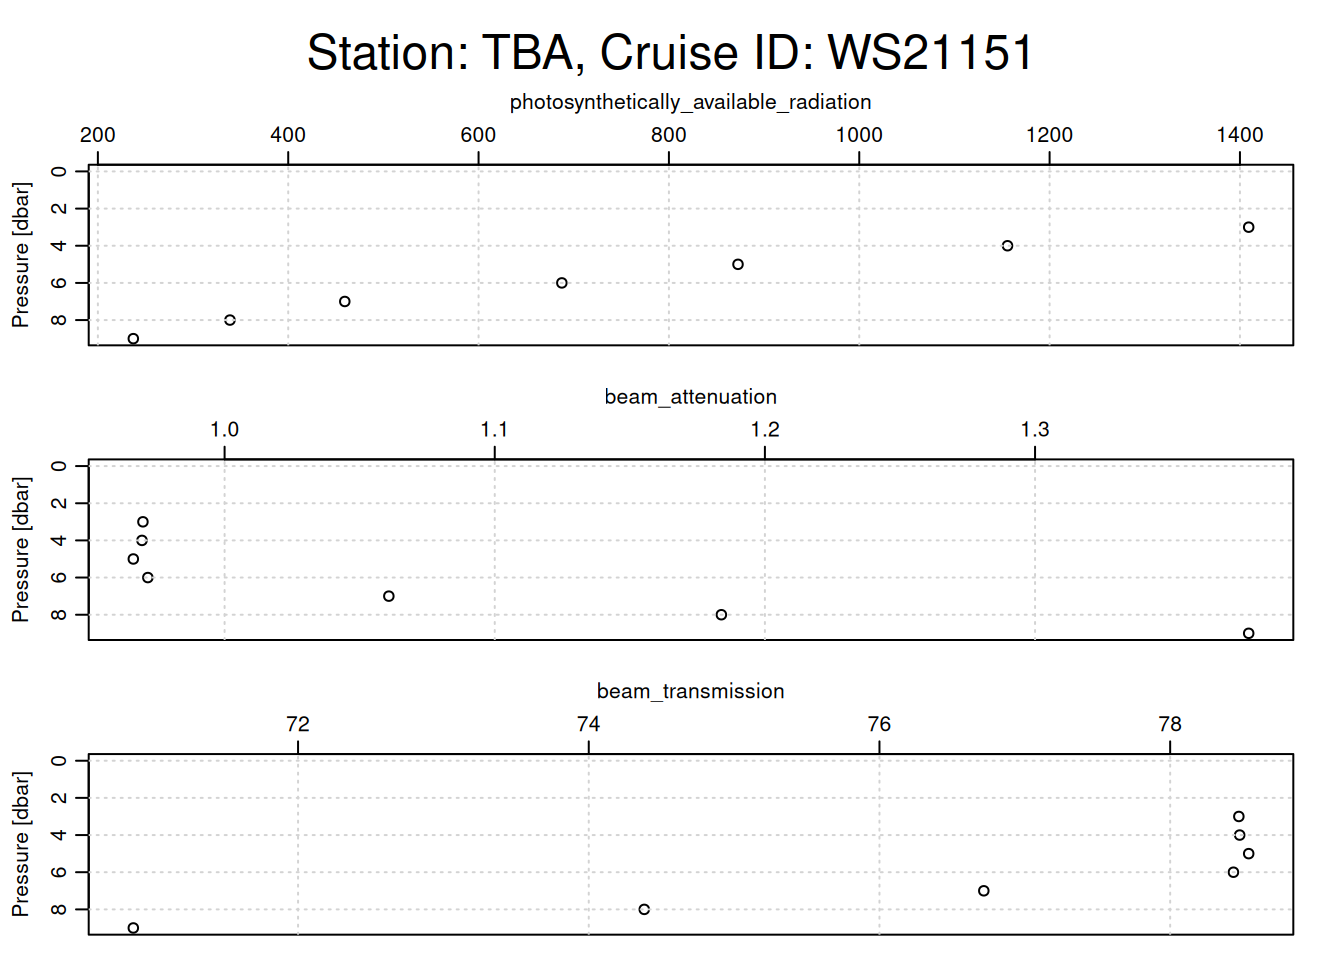
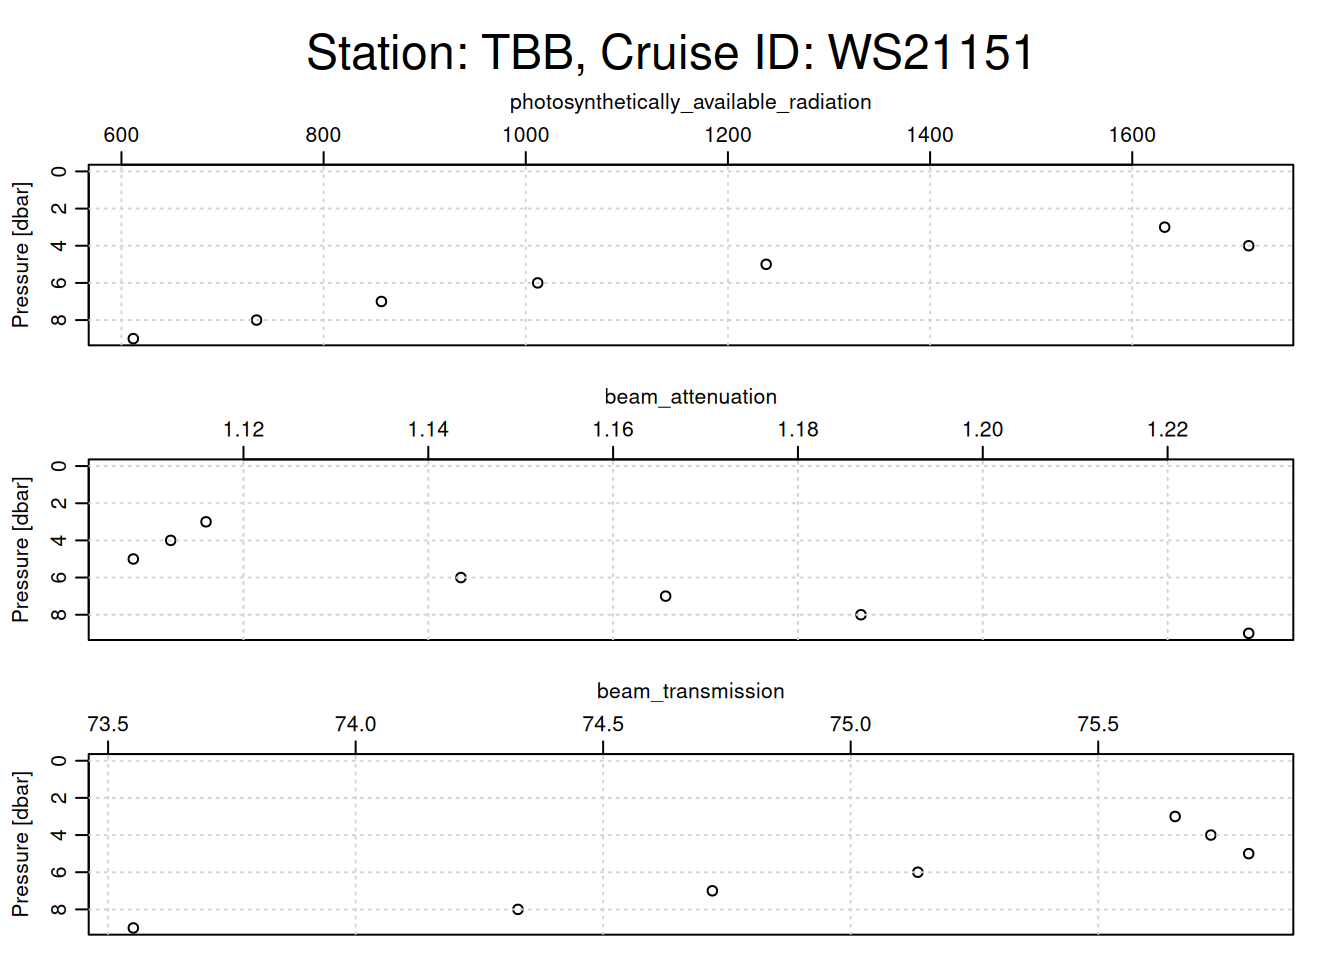
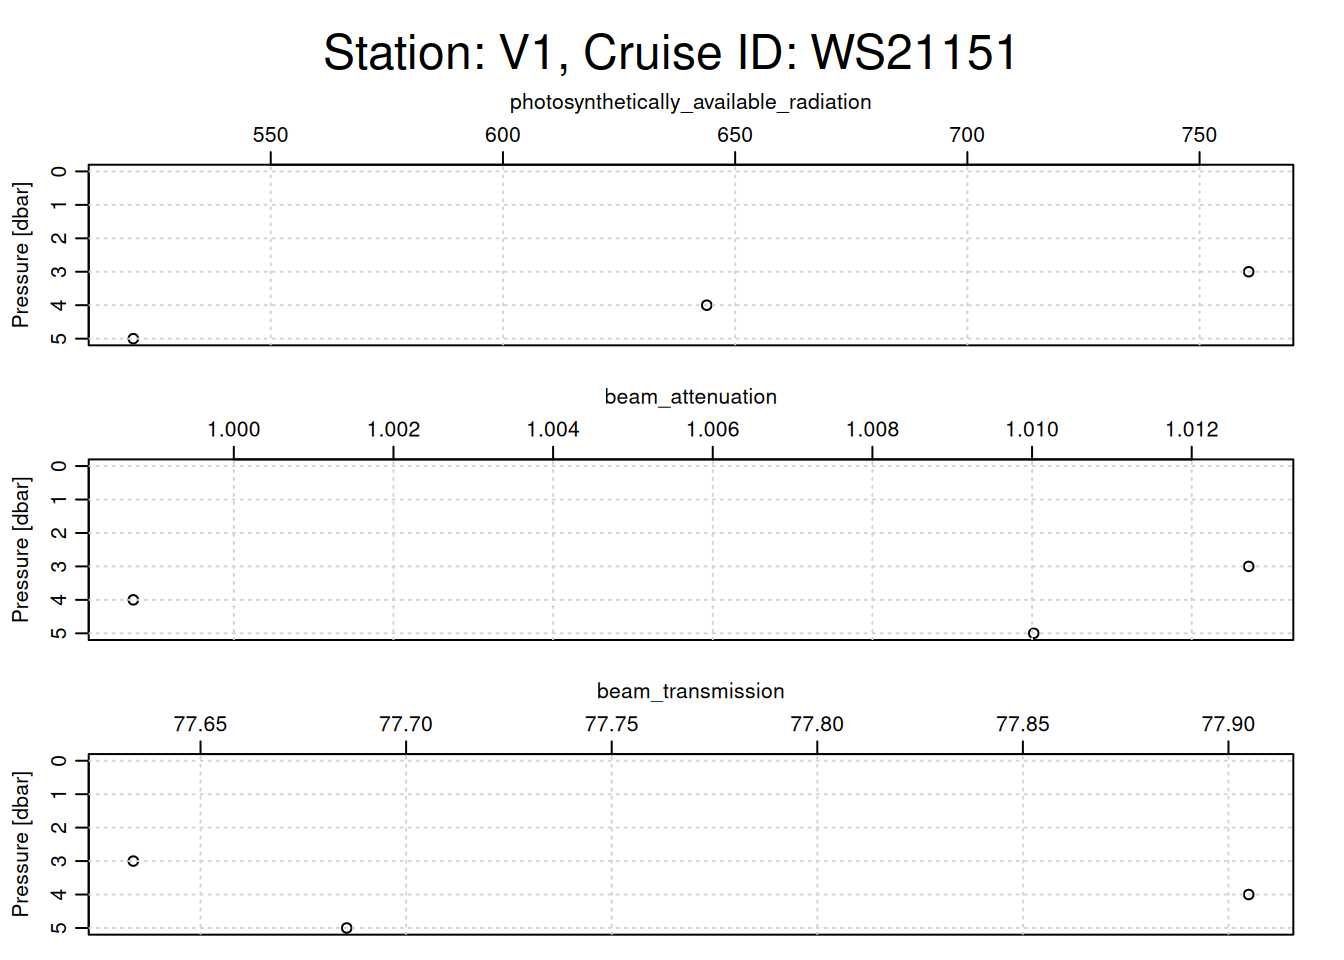
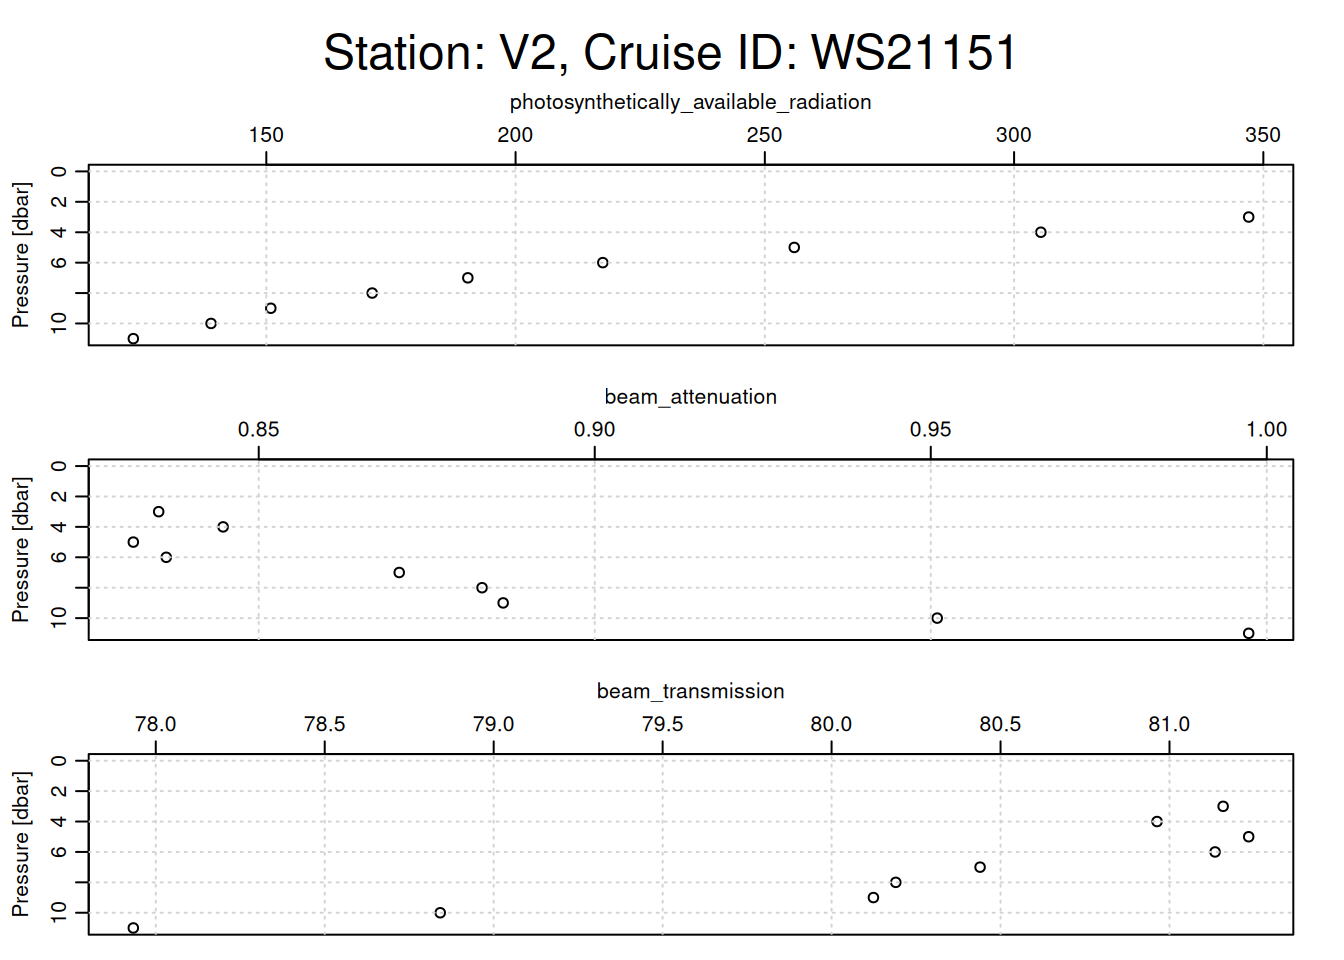
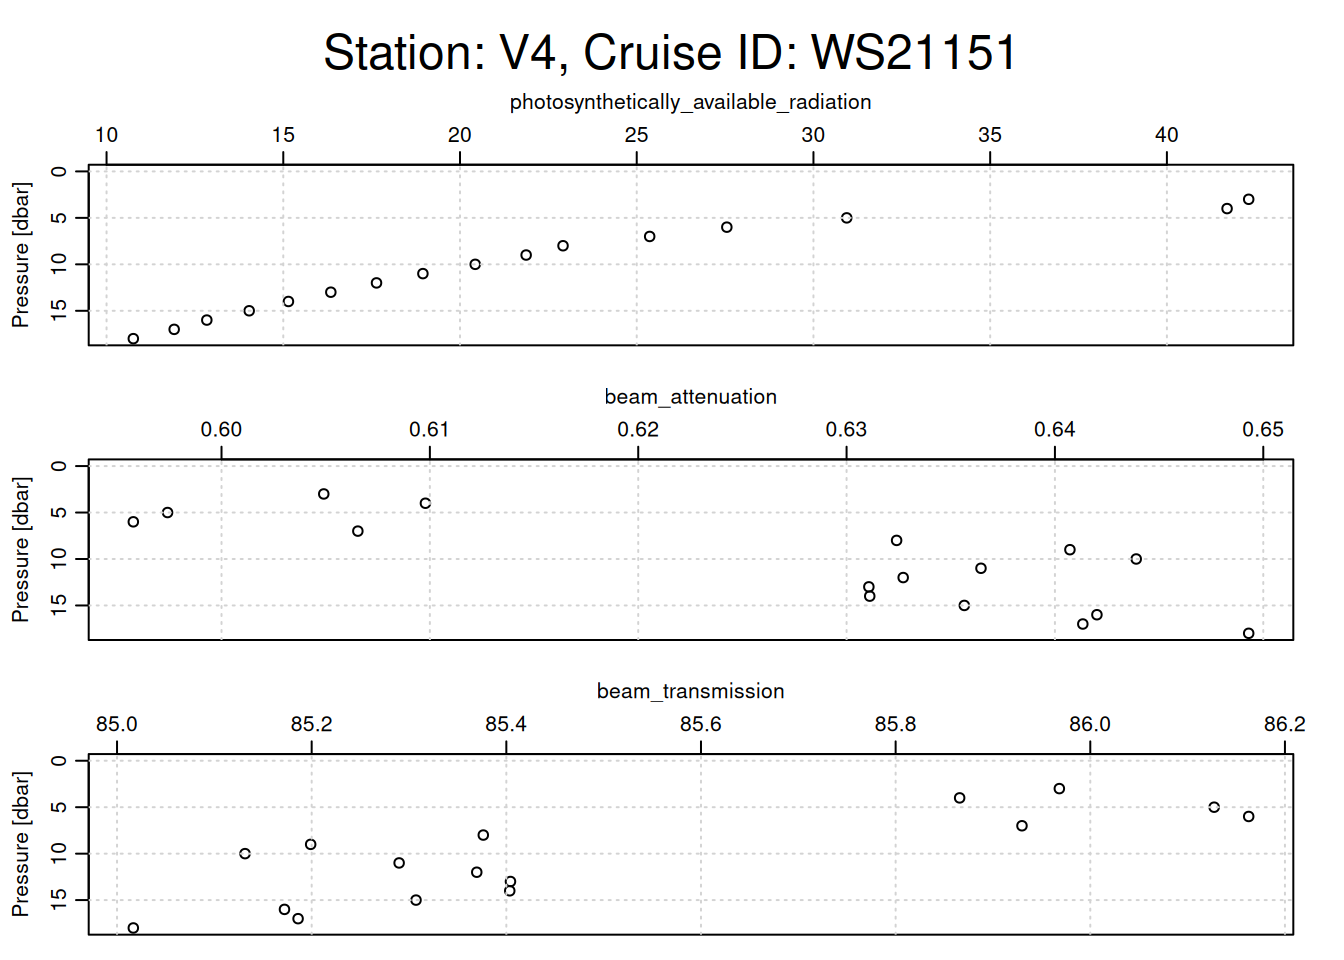
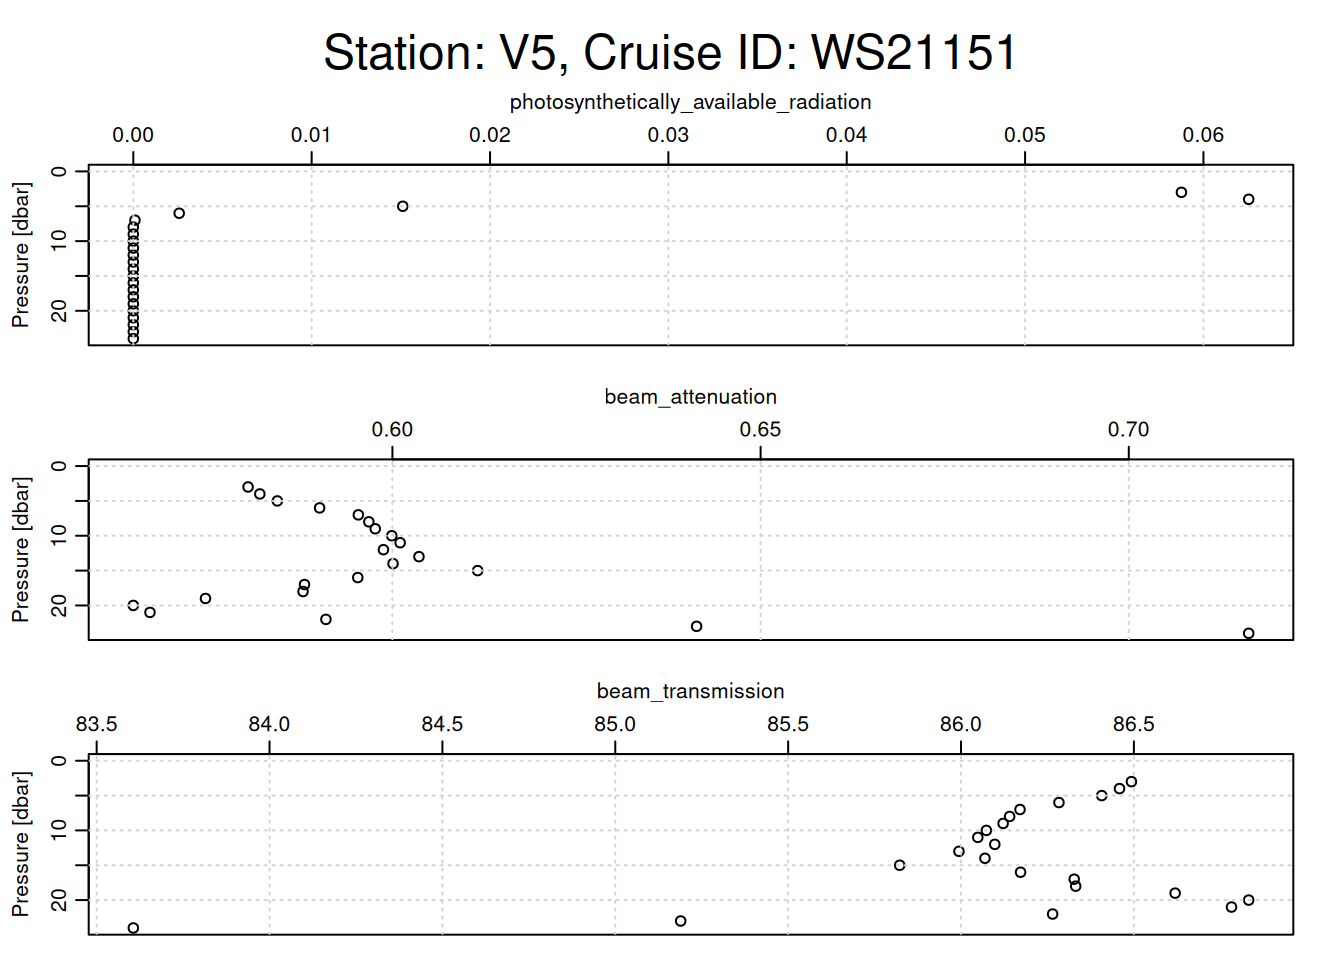
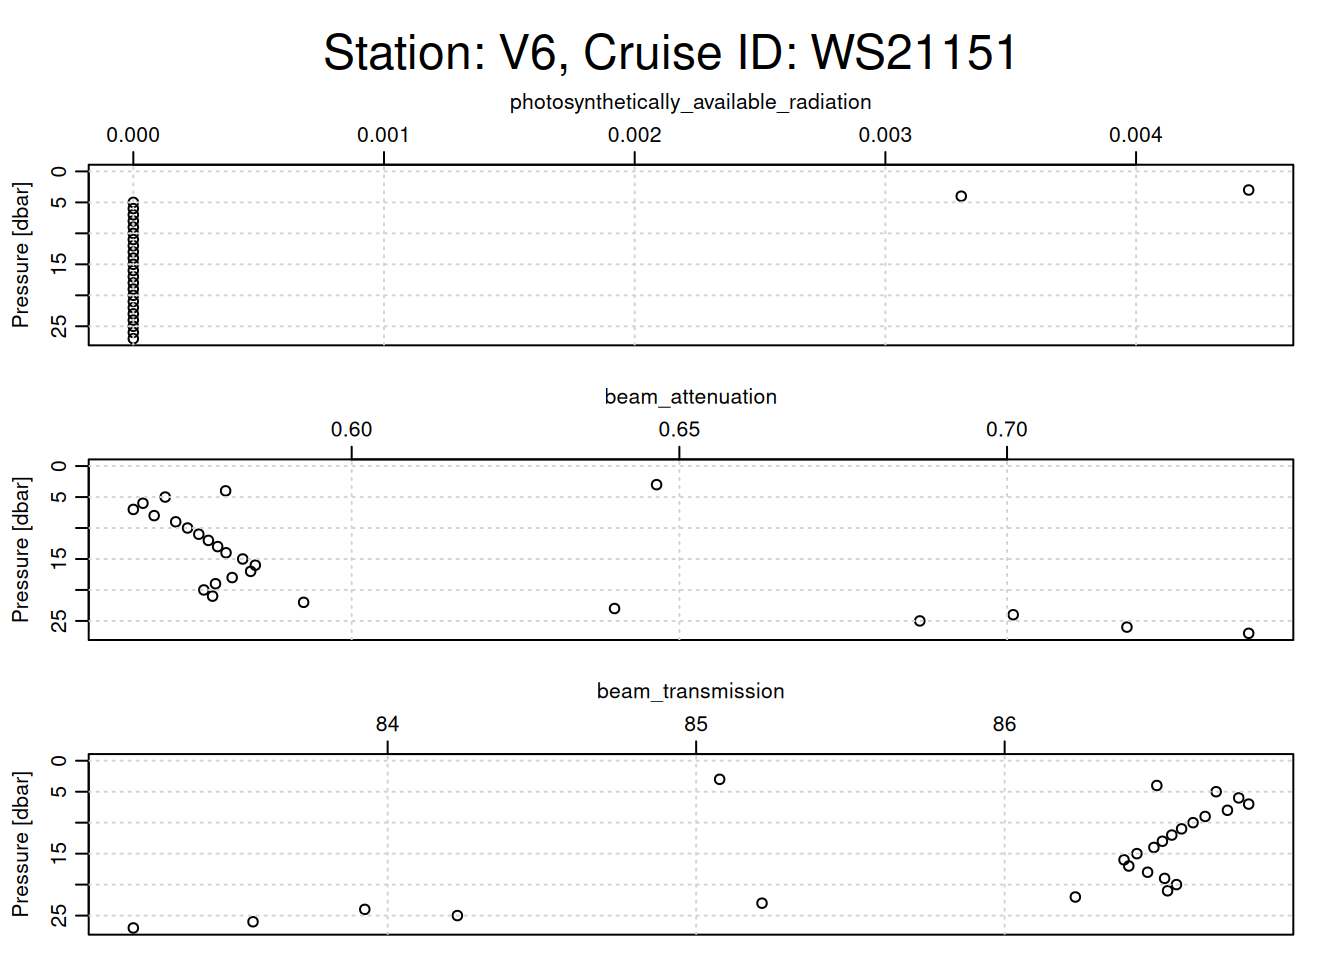
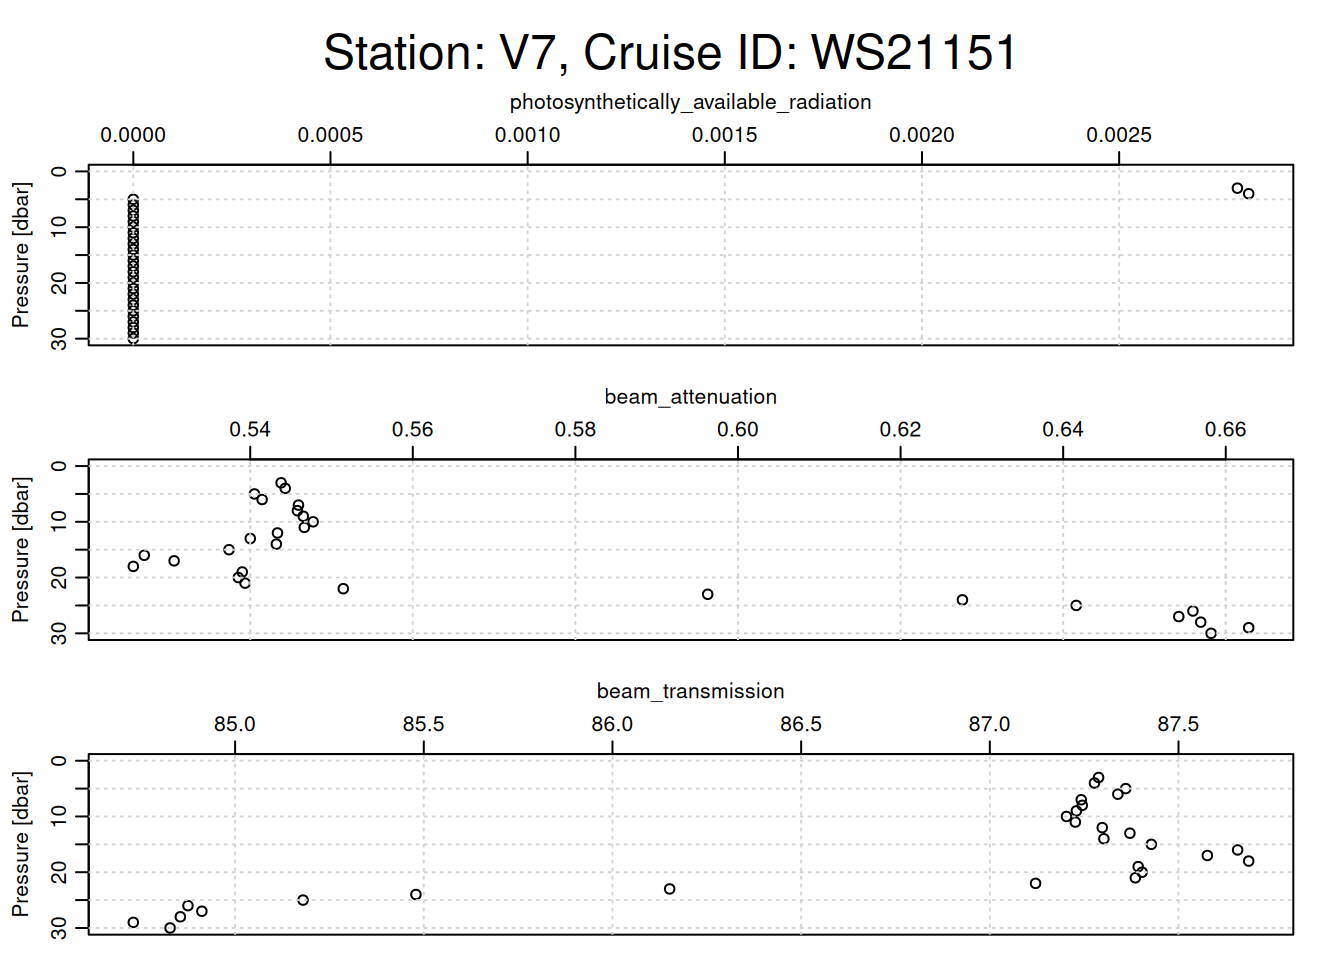
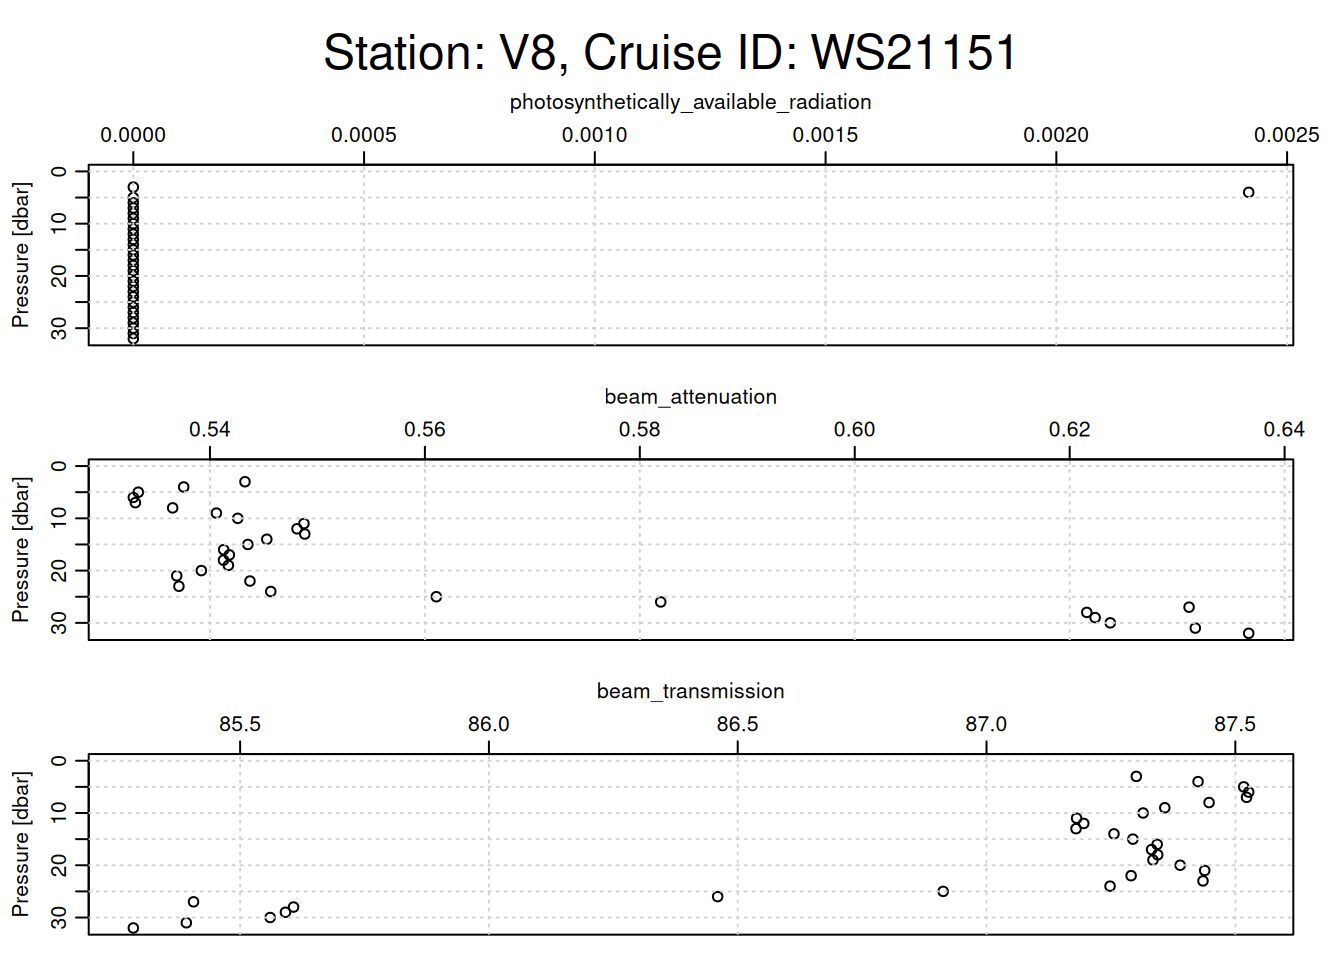
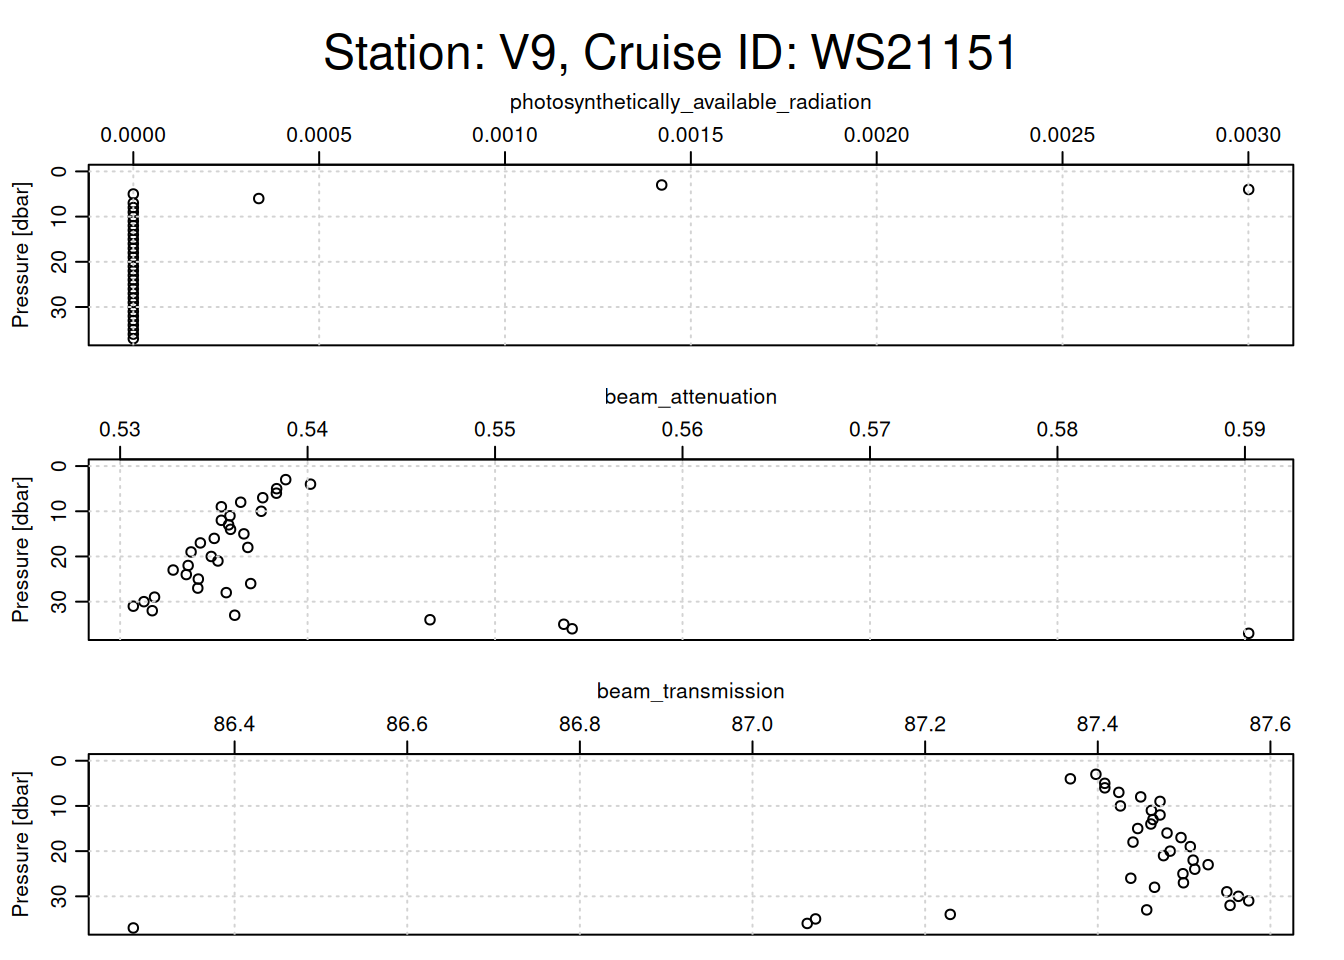
plotting other optical parameters for each cast
# Loop through each CTD castfor (i inseq(ctd_FK)){ cast <- ctd_FK[[i]] # Assuming each sublist contains only one relevant CTD objecttryCatch({# Extract metadata for station name and cruise ID station_name <- cast@metadata$station[1] cruise_id <- cast@data$cruise_id[1]# Generate a title with station name and cruise ID overall_title <- glue::glue("Station: {station_name}, Cruise ID: {cruise_id}")# Set margins: increase the outer margin for the titlepar(oma =c(0, 0, 3, 0)) # Top outer margin increased for title# Plotting function with specific parameters oce::plot(x =ctdDecimate(ctdTrim(cast)),which =c("photosynthetically_available_radiation","beam_attenuation","beam_transmission" ),main =""# No main title for individual subplots )# Place a single overall title at the top of the plot framemtext(overall_title, side =3, line =1, outer =TRUE, cex =1.5)# Reset outer margins to defaultpar(oma =c(0, 0, 0, 0)) }, error =function(e) {print(e$message) # Print any errors that occur during plotting })}
[1] "unknown xtype value (\"12.588\")"
loop through every cast, clean, & save
combined_df <-data.frame()for (i inseq(ctd_FK)){tryCatch({ cast <- ctd_FK[[i]] # 1 is selecting only the first sublist# print(class(cast))# clean cast trimmed_cast <-ctdTrim(cast) decimated_cast <-ctdDecimate(trimmed_cast, p =0.5) # binned to 0.5 m# convert to df cast_df <-as.data.frame(decimated_cast@data)# Add metadata# assumes station ID and cruise ID the same for all & just uses 1st one cast_df <-mutate( cast_df,station = cast@data$station[1],cruise_id = cast@data$cruise_id[1] )# drop NA rows left by cleaning cast_df <-subset(cast_df, !is.na(scan))# Append the data to the combined dataframe combined_df <-rbind(combined_df, cast_df) }, error =function(e){print(glue("error in cast {cast@metadata$station[1]}"))print(e) })}# Save to CSVfile_path <-here(glue("data/cleaned/{cruise_id}.csv"))write.csv(combined_df, file_path, row.names =FALSE)