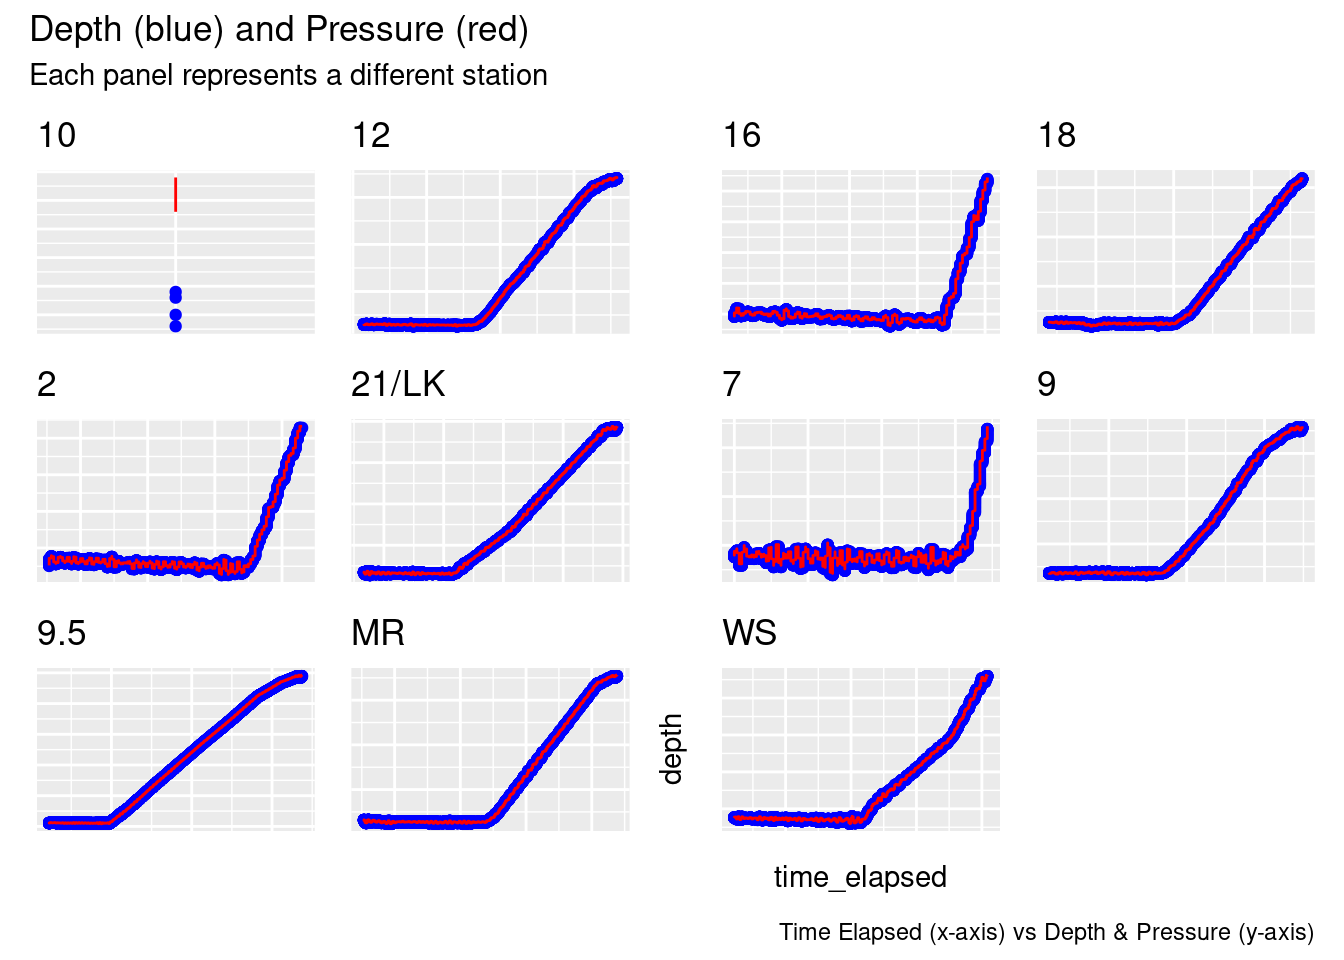
tryCatch({ plots <-list()for (station_name inunique(cruise_df$station)) { subset_df <-filter(cruise_df, station == station_name) plots[[station_name]] <-ggplot(subset_df, aes(x = time_elapsed)) +geom_point(aes(y = depth), color ="blue") +# Plot depth in bluegeom_line(aes(y = sea_water_pressure), color ="red") +# Plot sea water pressure in redggtitle(glue("{station_name}")) +theme(axis.title.x =element_blank(),axis.title.y =element_blank(),axis.text.x =element_blank(),axis.text.y =element_blank(),axis.ticks.x =element_blank(),axis.ticks.y =element_blank() ) # Remove individual axis titles and text }# drop nulls plots <- purrr::compact(plots)# Combine all plots into a grid combined_plot <-wrap_plots(plots) +plot_layout(ncol =4) +# Adjust ncol to set number of columns in the gridplot_annotation(title ="Depth (blue) and Pressure (red)",subtitle ="Each panel represents a different station",caption ="Time Elapsed (x-axis) vs Depth & Pressure (y-axis)" ) +theme(plot.tag =element_text(size =12, face ="bold"),plot.tag.position ="topleft",axis.title.x =element_text(margin =margin(t =10)),axis.title.y =element_text(margin =margin(r =10)) )print(combined_plot)}, error =function(er){print(er)});
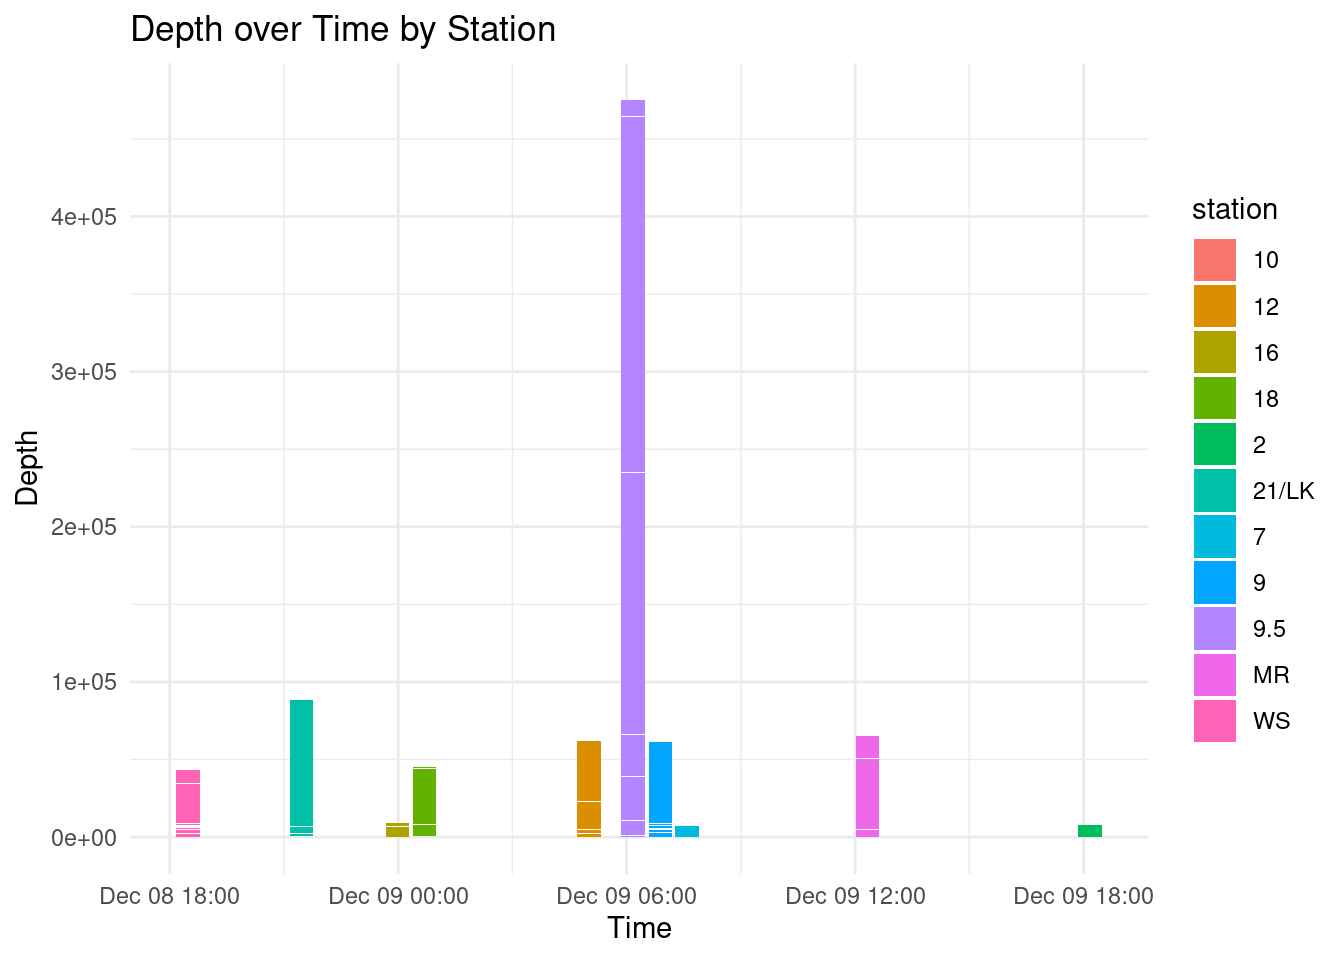
plot across all stations
p <-ggplot(cruise_df, aes(x = time, y = depth, fill = station)) +geom_col() +# This creates the bars# geom_text(aes(label = station), vjust = -0.3) + # This adds labels to each bar, adjust vjust for positionlabs(x ="Time", y ="Depth", title ="Depth over Time by Station") +# Set labels and titletheme_minimal() # Use a minimal themeprint(p)
create oce.ctd objects from dataframes
ctd_load <-function(data, other_params =NULL) {# create csv into ctd object test_ctd <-as.ctd(salinity = data$sea_water_salinity,temperature = data$sea_water_temperature,pressure = data$sea_water_pressure,station = data$station )# add additional columns to ctd objectif (!is.null(other_params)) {for (param_name in other_params) { test_ctd <-oceSetData(object = test_ctd,name = param_name,value = data[[param_name]] ) } }print(glue("{data$station[1]}:\t{length(test_ctd@data$scan)} scans"))return(test_ctd)}# Define other parameters to addother_params <-c("cruise_id", "station", "time", "time_elapsed", "latitude", "longitude", "sea_water_electrical_conductivity", "CDOM", "dissolved_oxygen","oxygen_saturation", "chlorophyll_concentration", "chlorophyll_fluorescence", "photosynthetically_available_radiation", "beam_attenuation","beam_transmission", "depth", "sea_water_sigma_t","descent_rate", "sound_velocity","altimeter")# Split data by station and create data listctd_FK <- cruise_df %>%split(.$station) %>%map(~ctd_load(.x, other_params = other_params)) # ~ is a lambda(x)
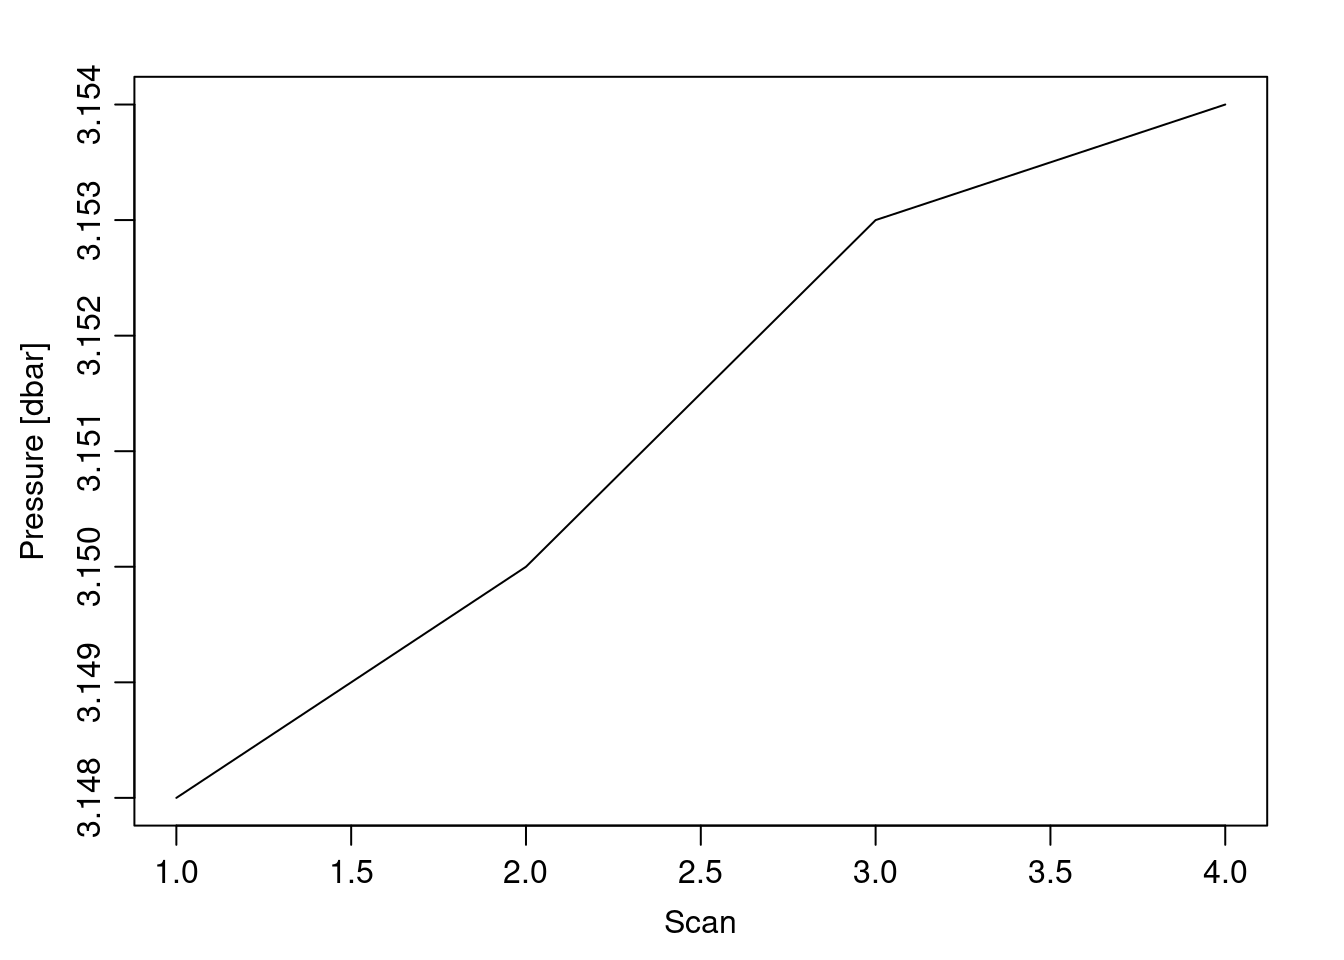
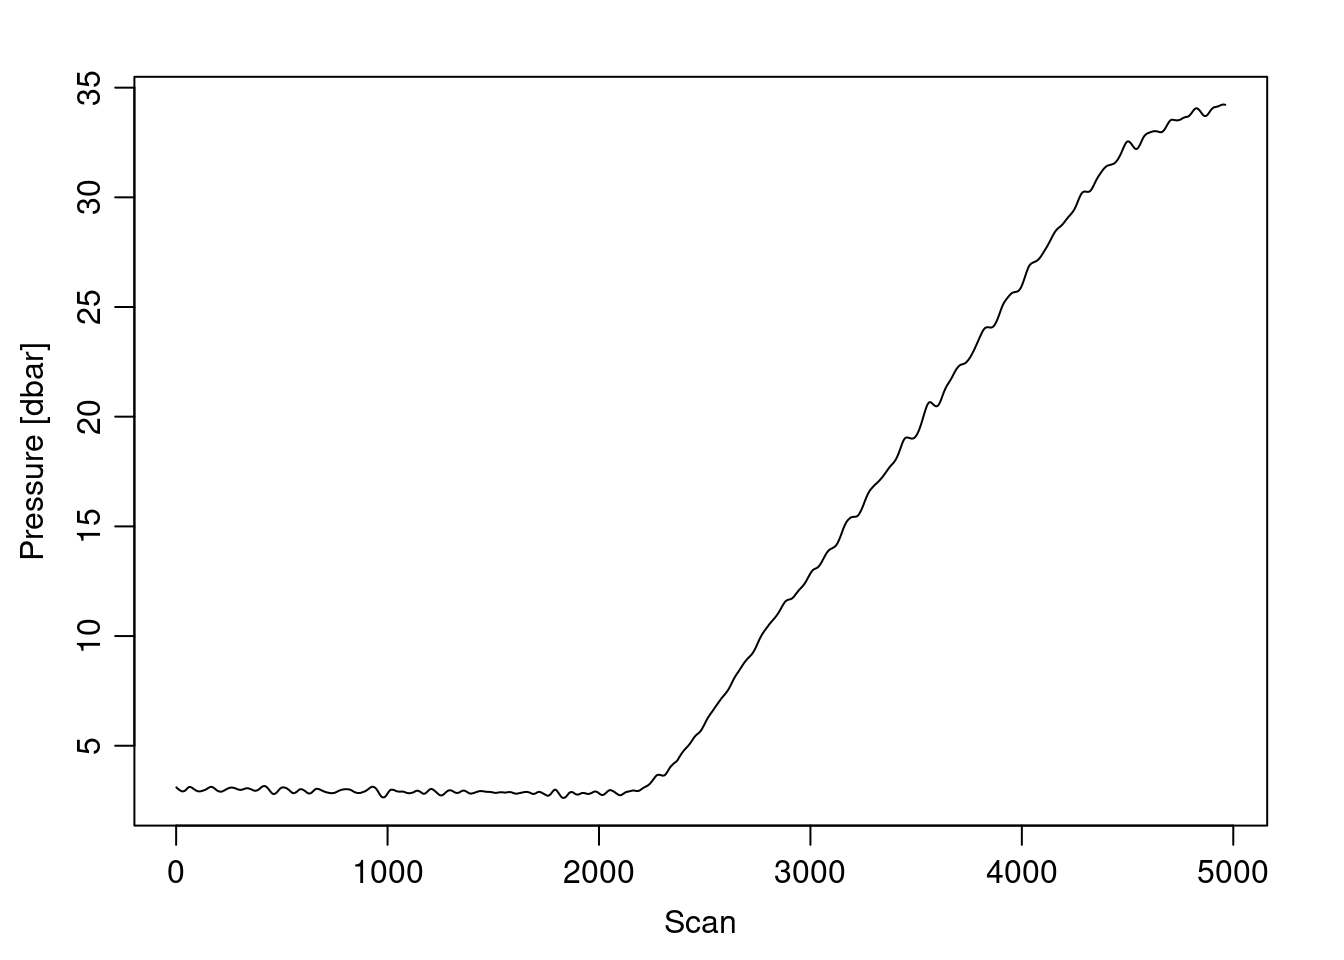
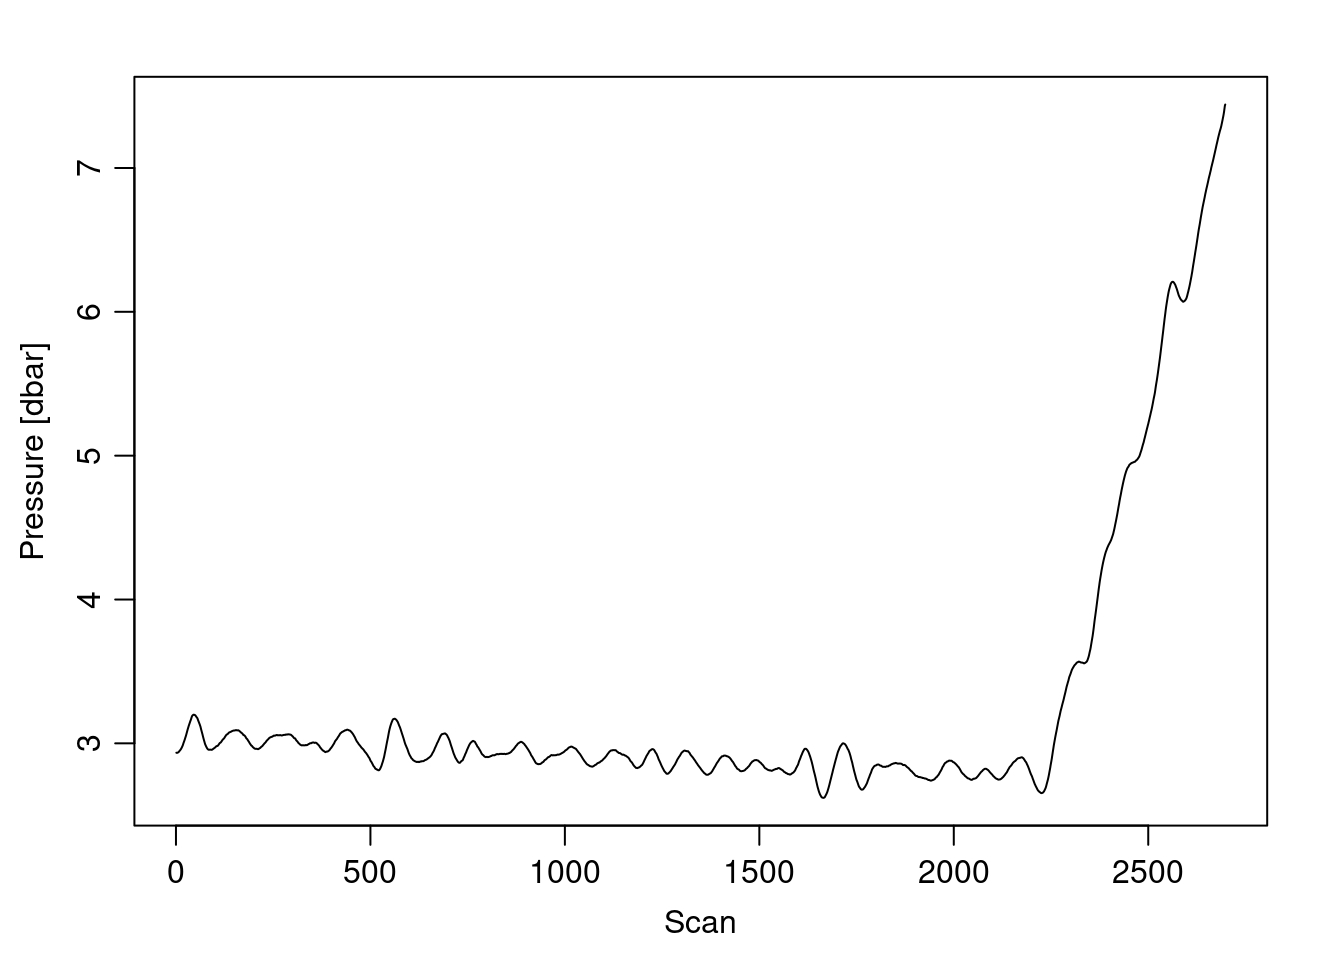
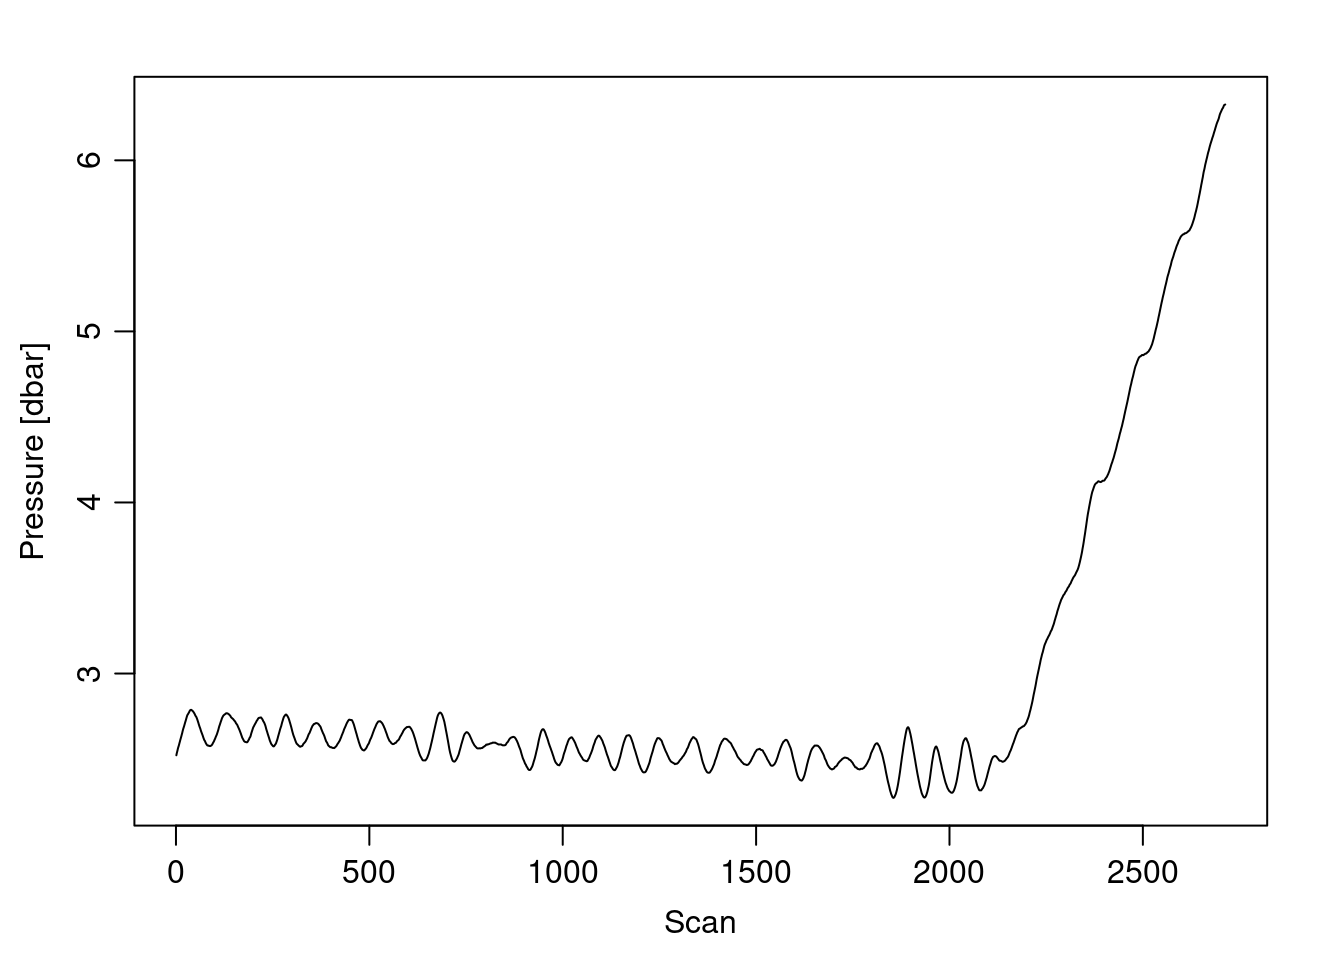
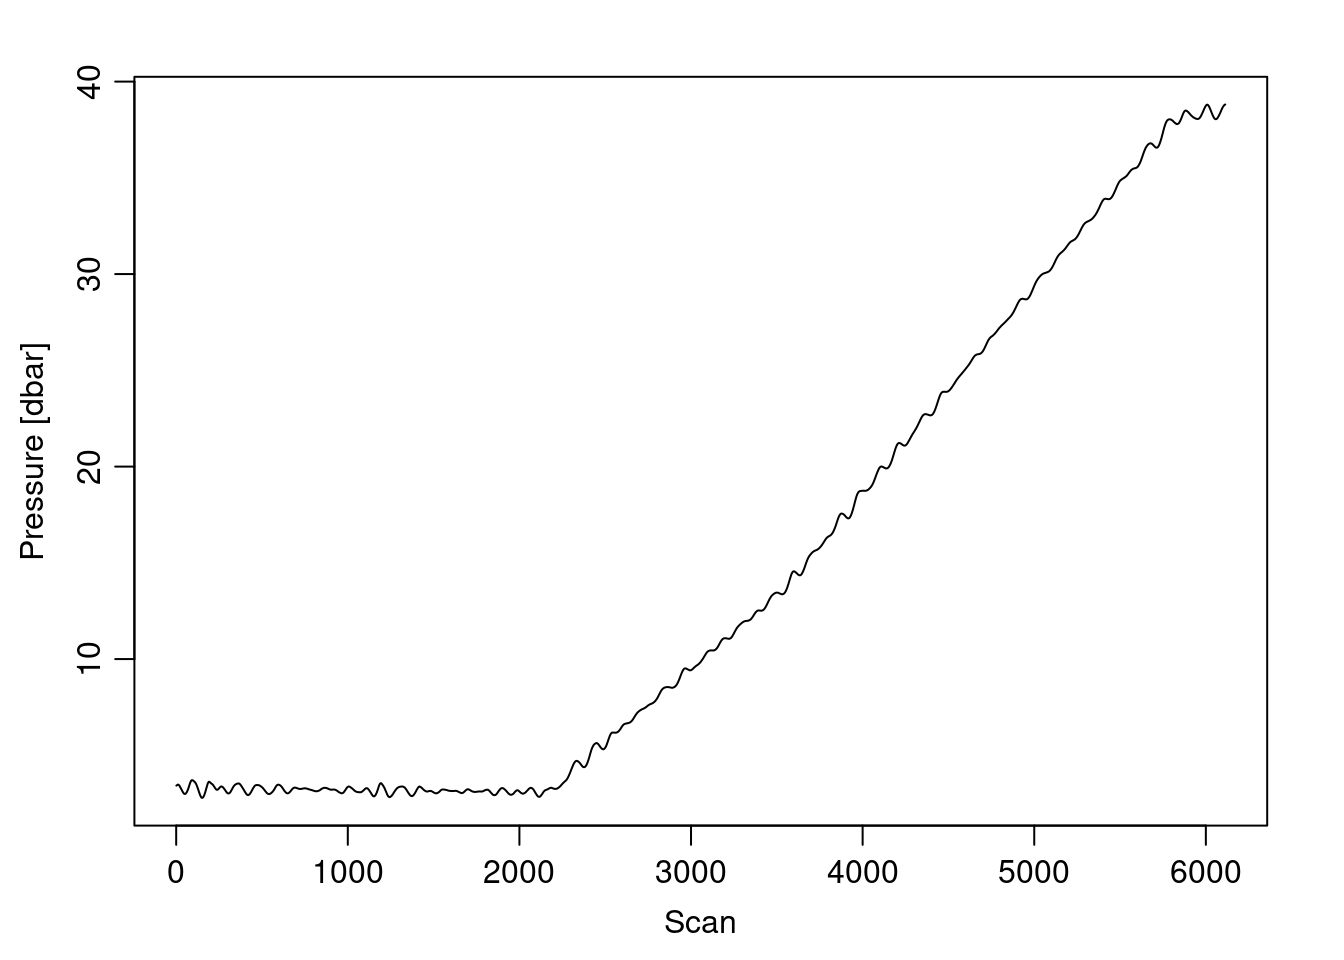
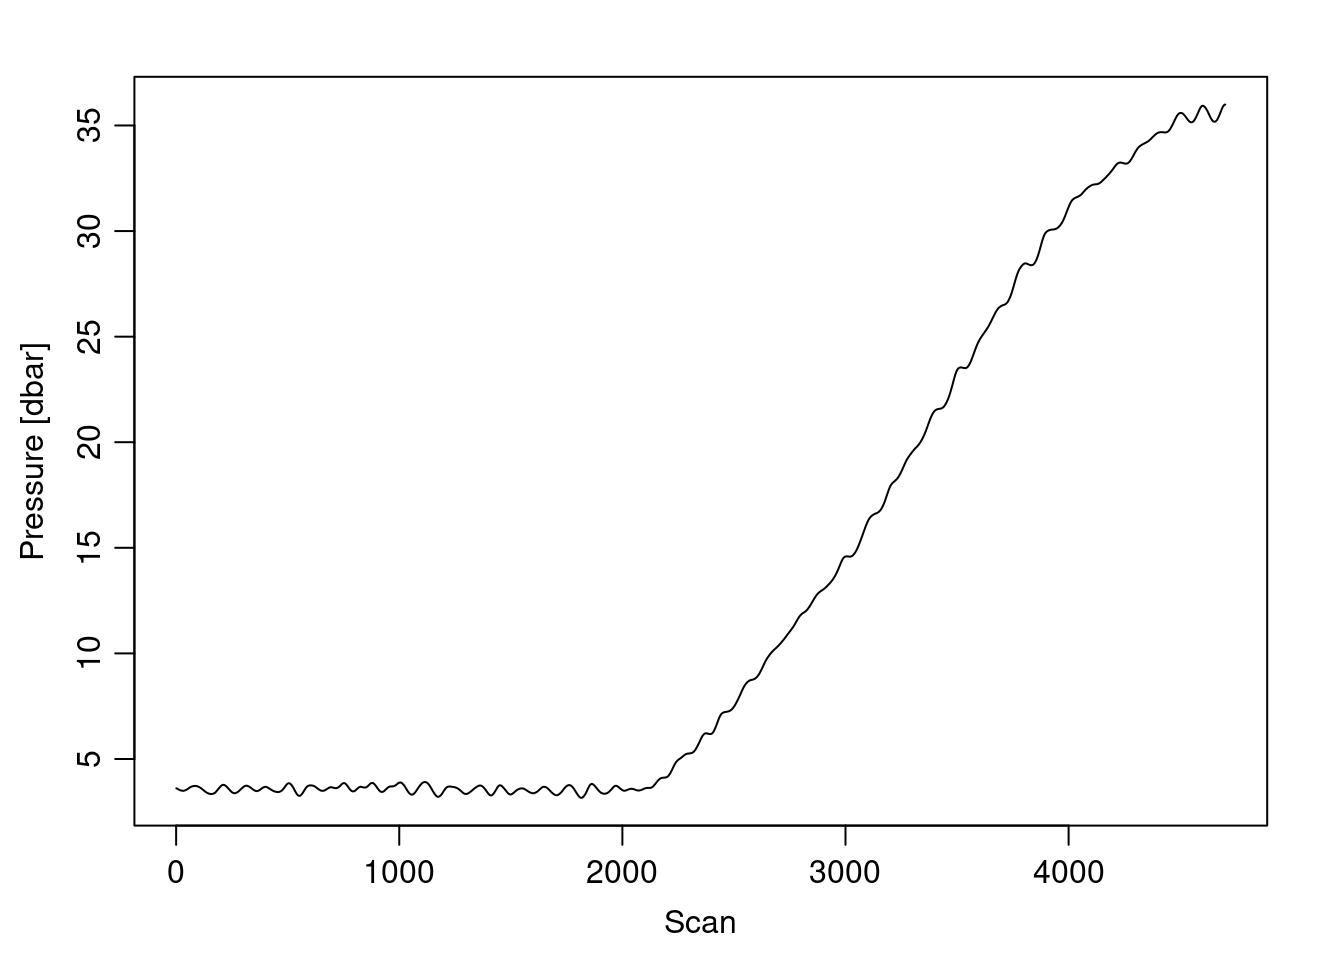
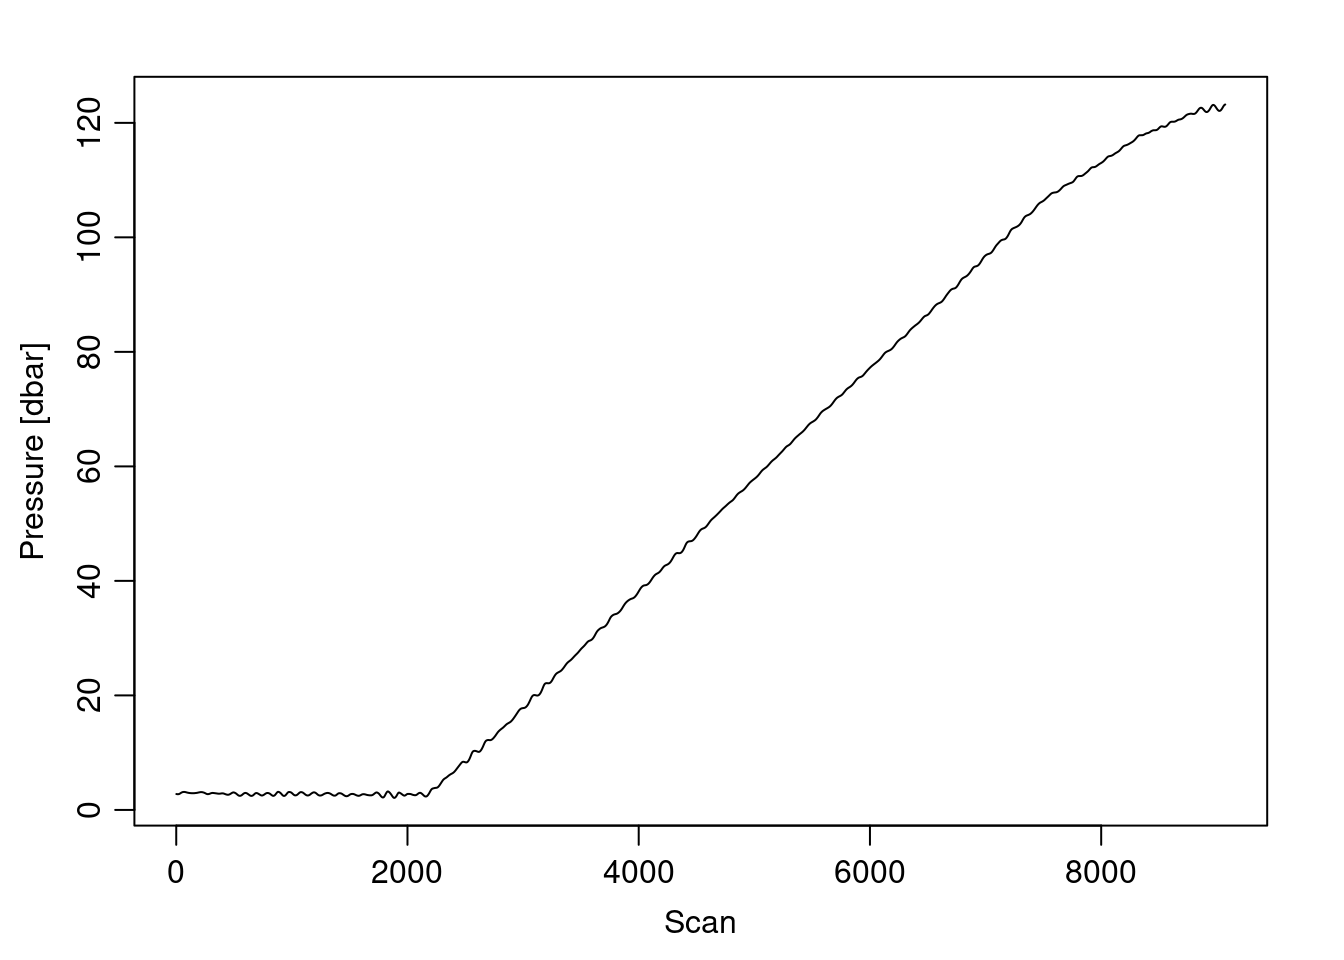
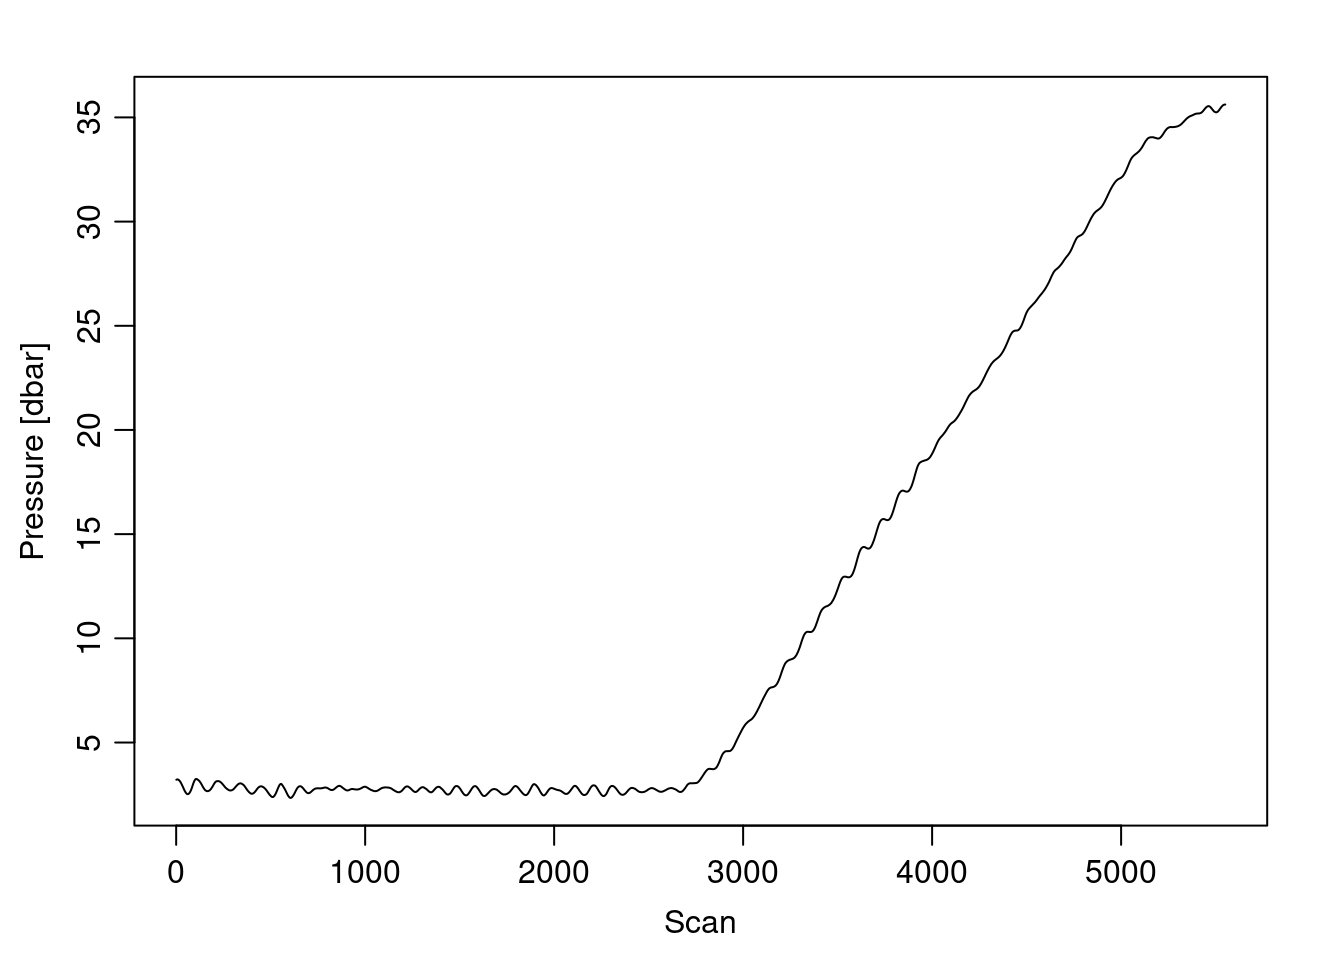
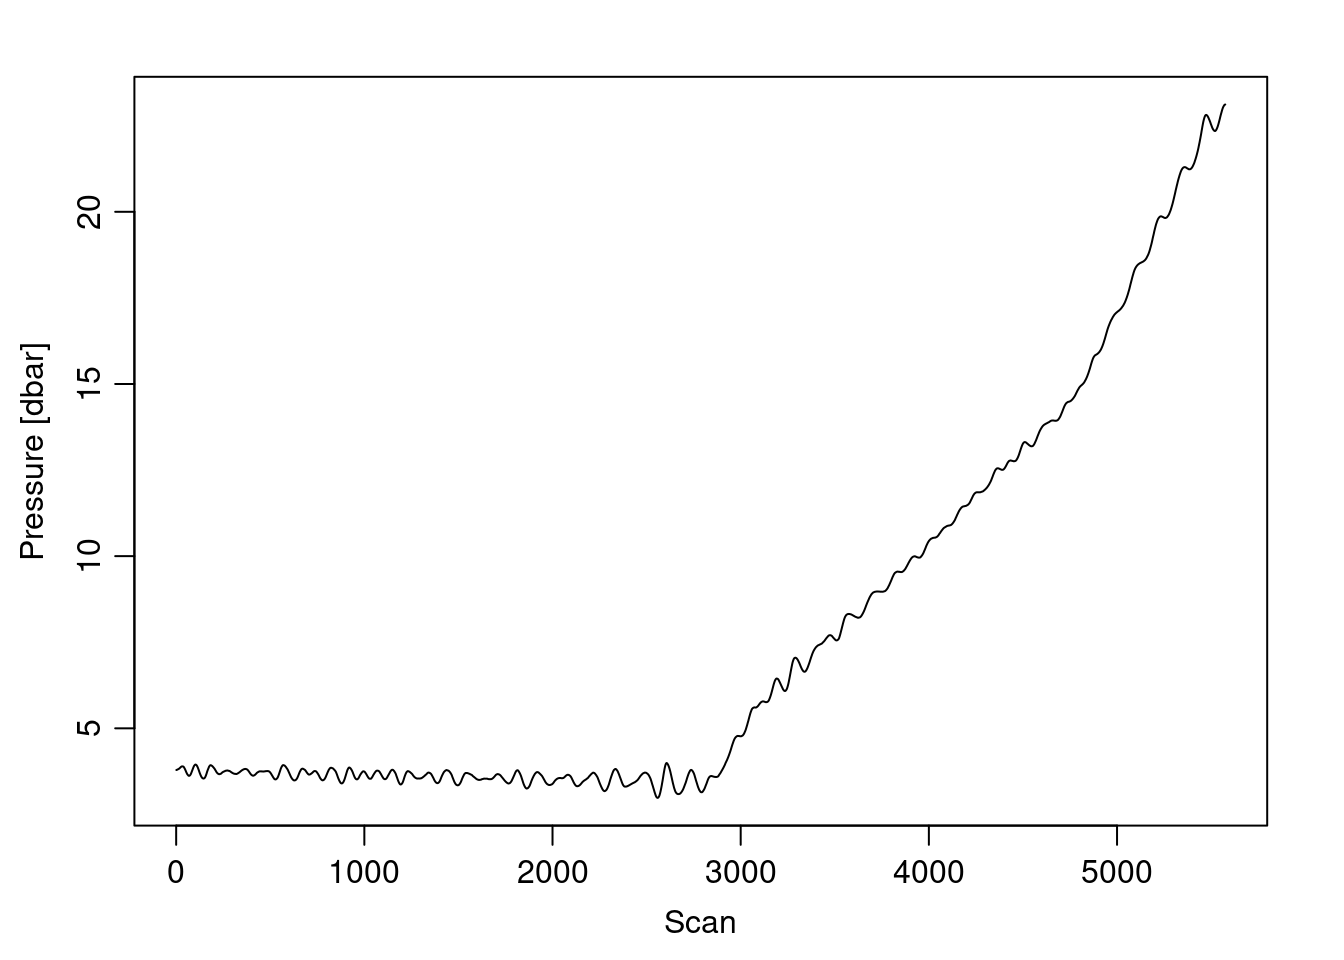
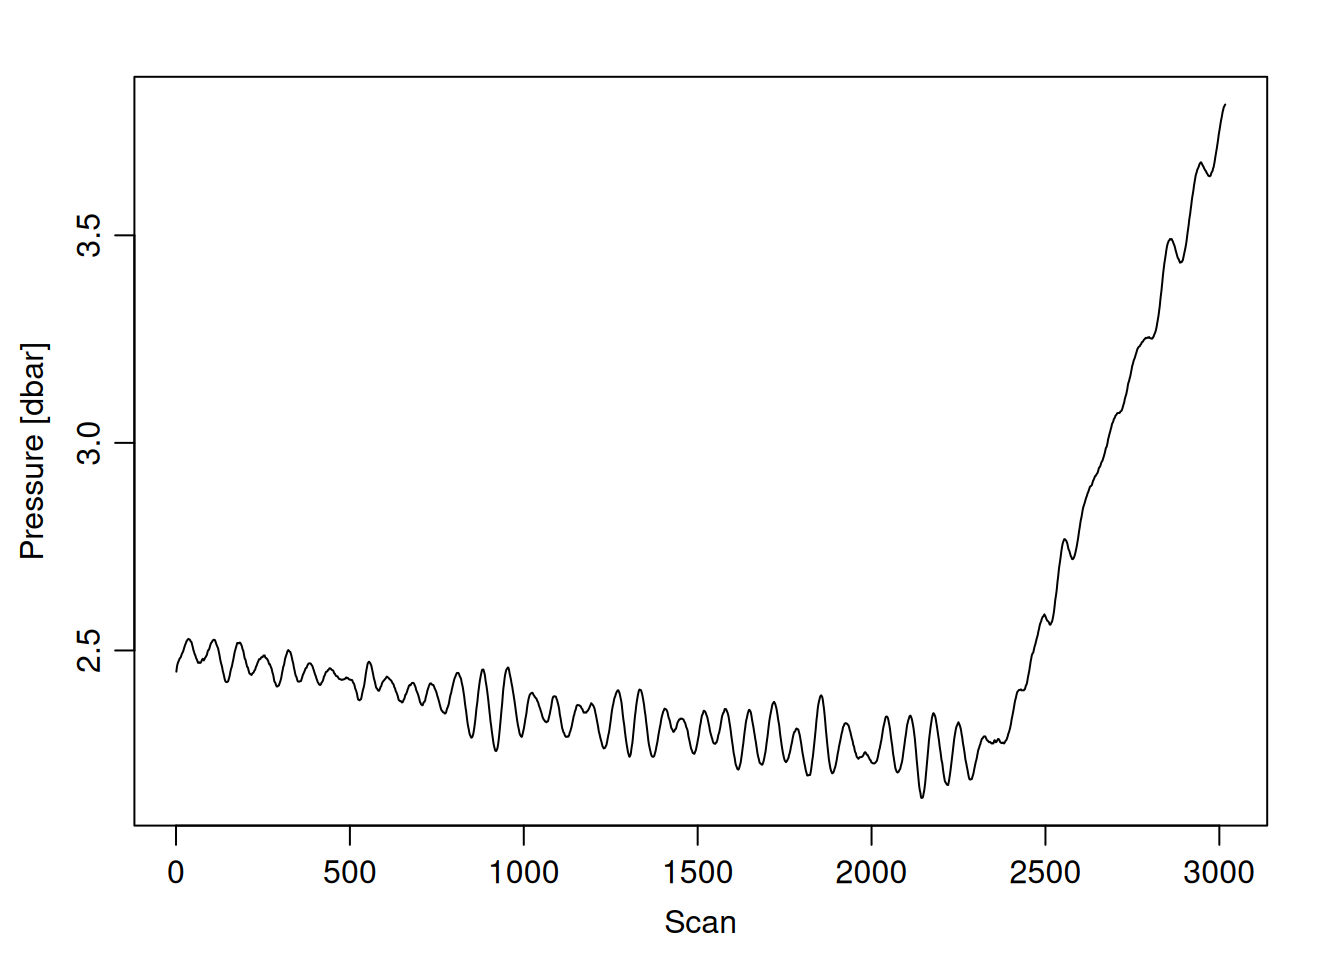
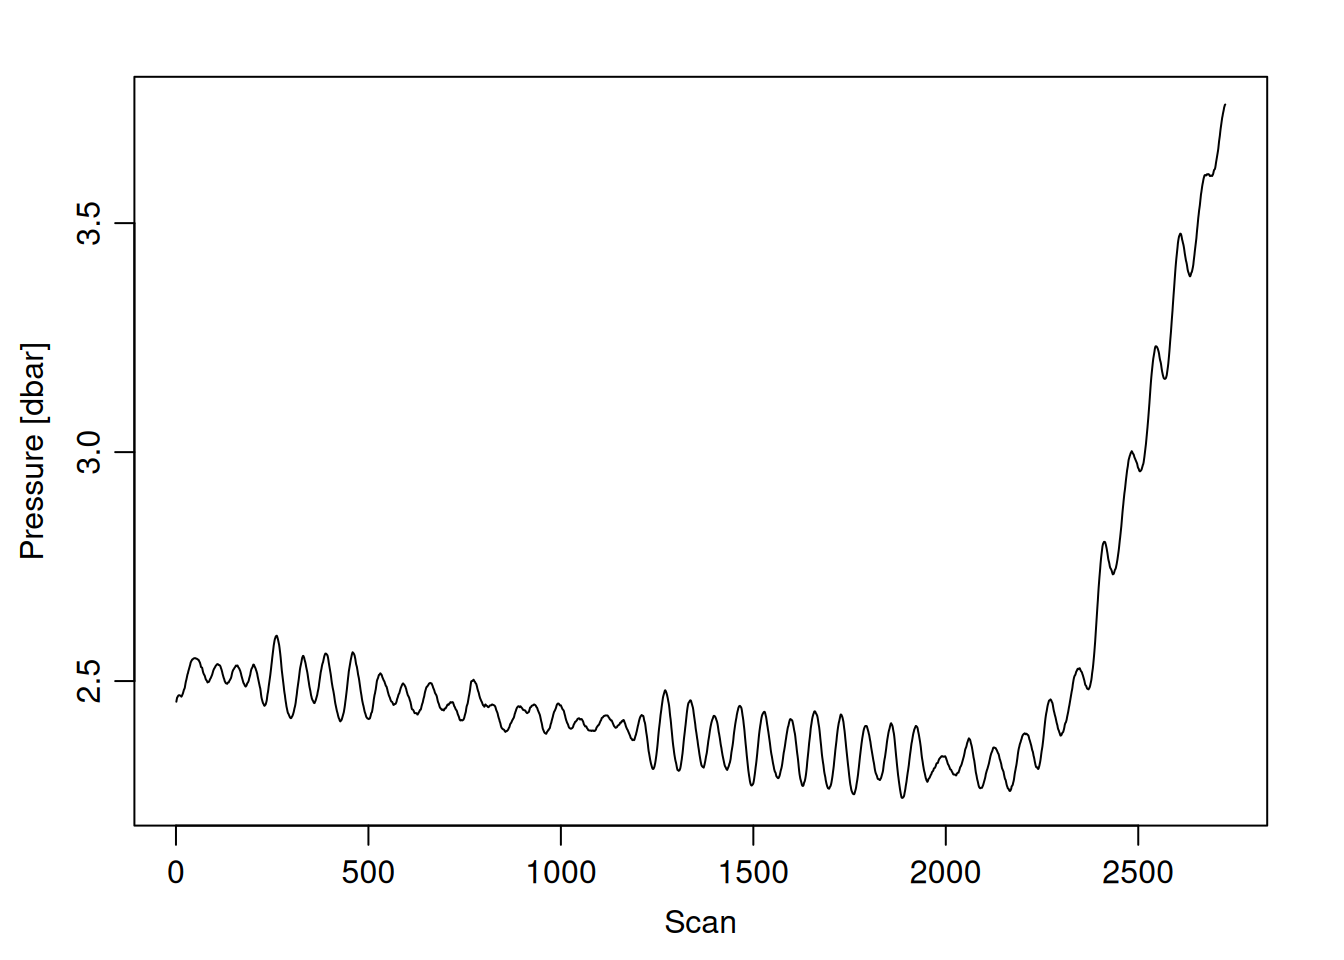
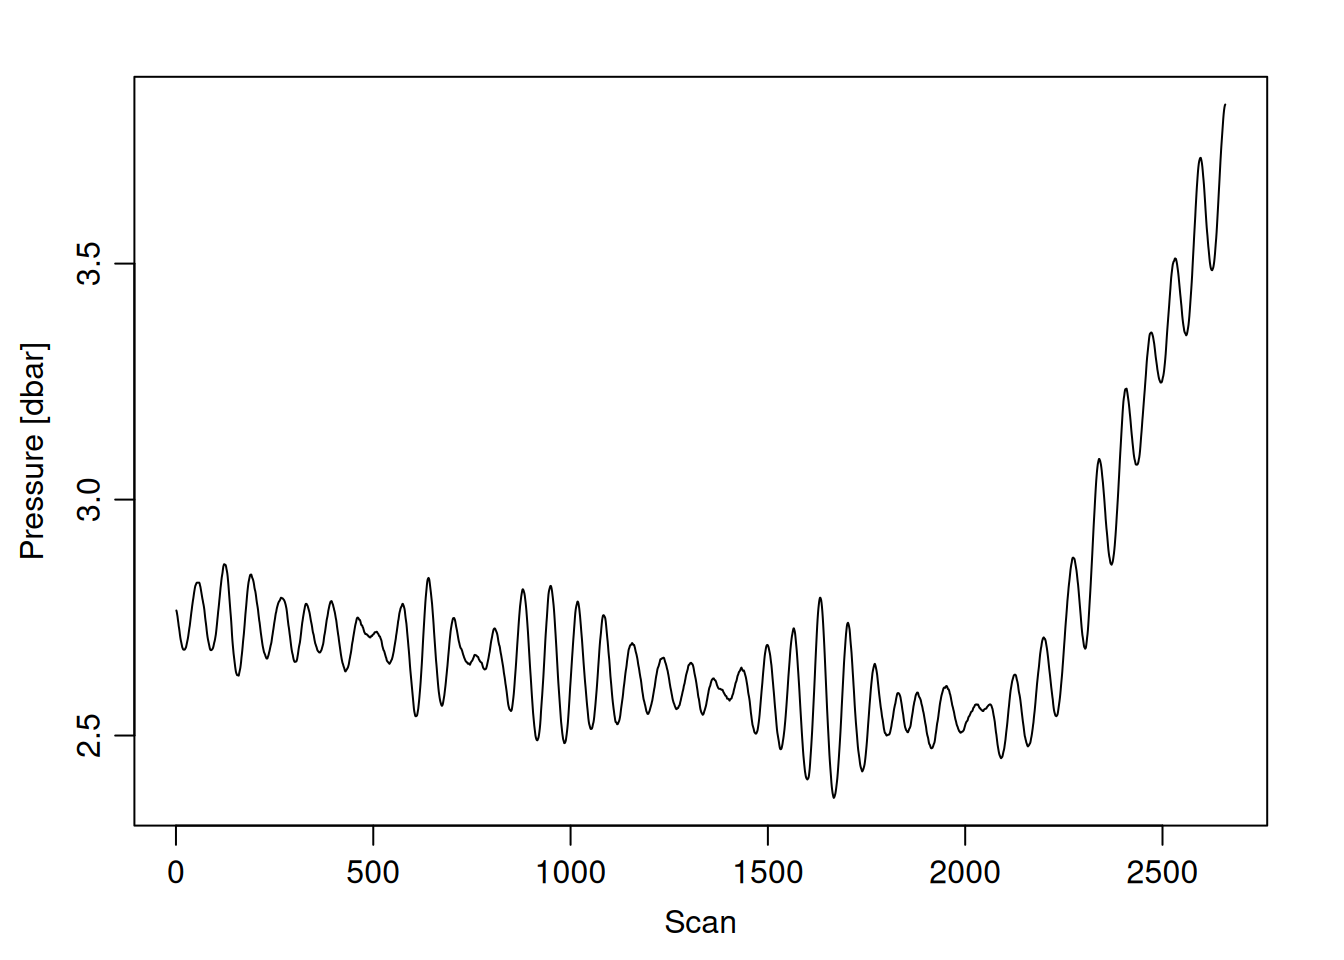
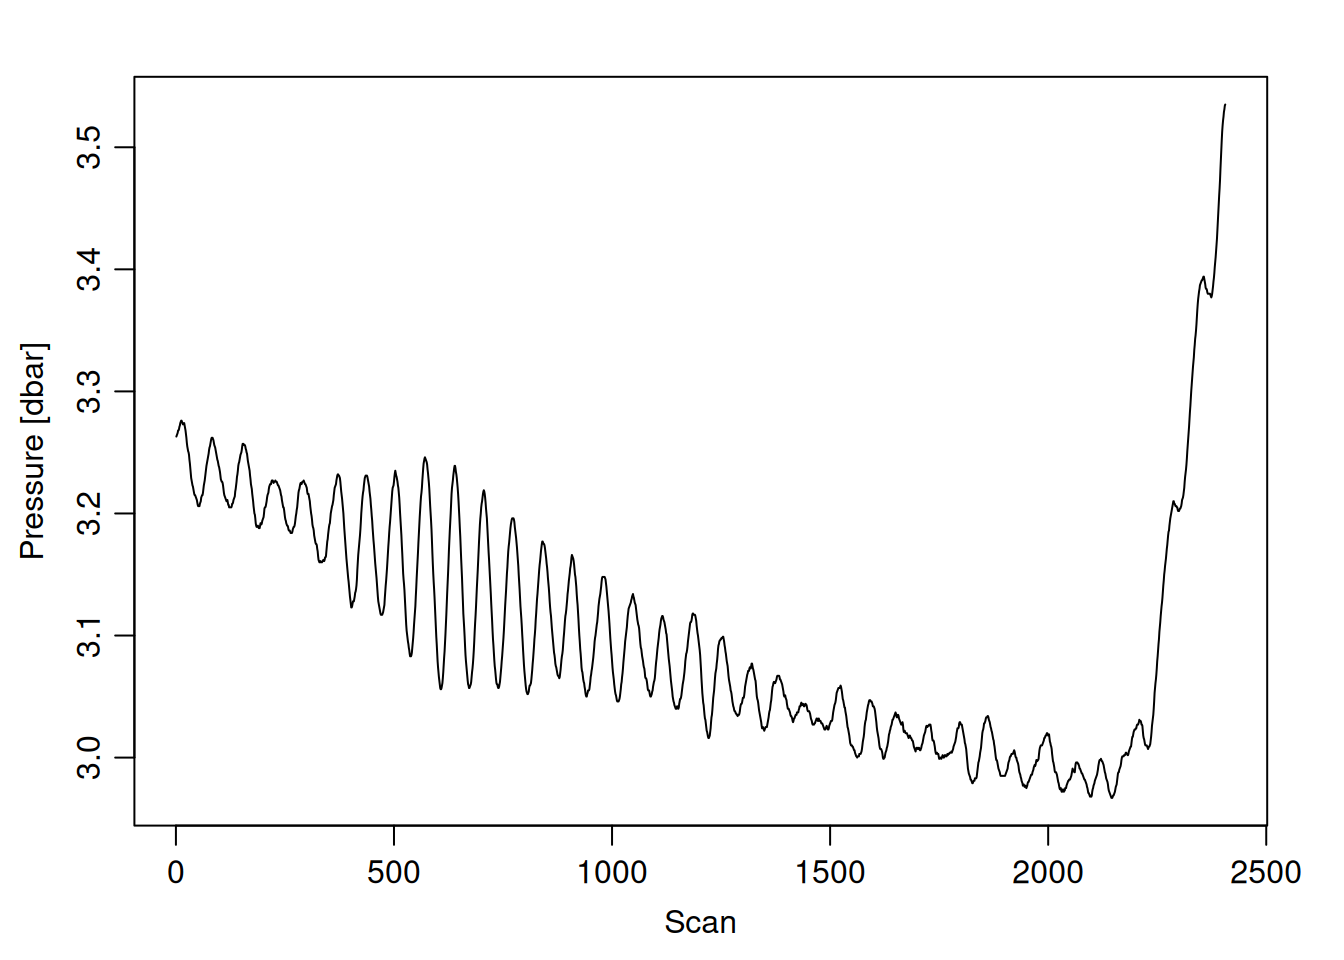
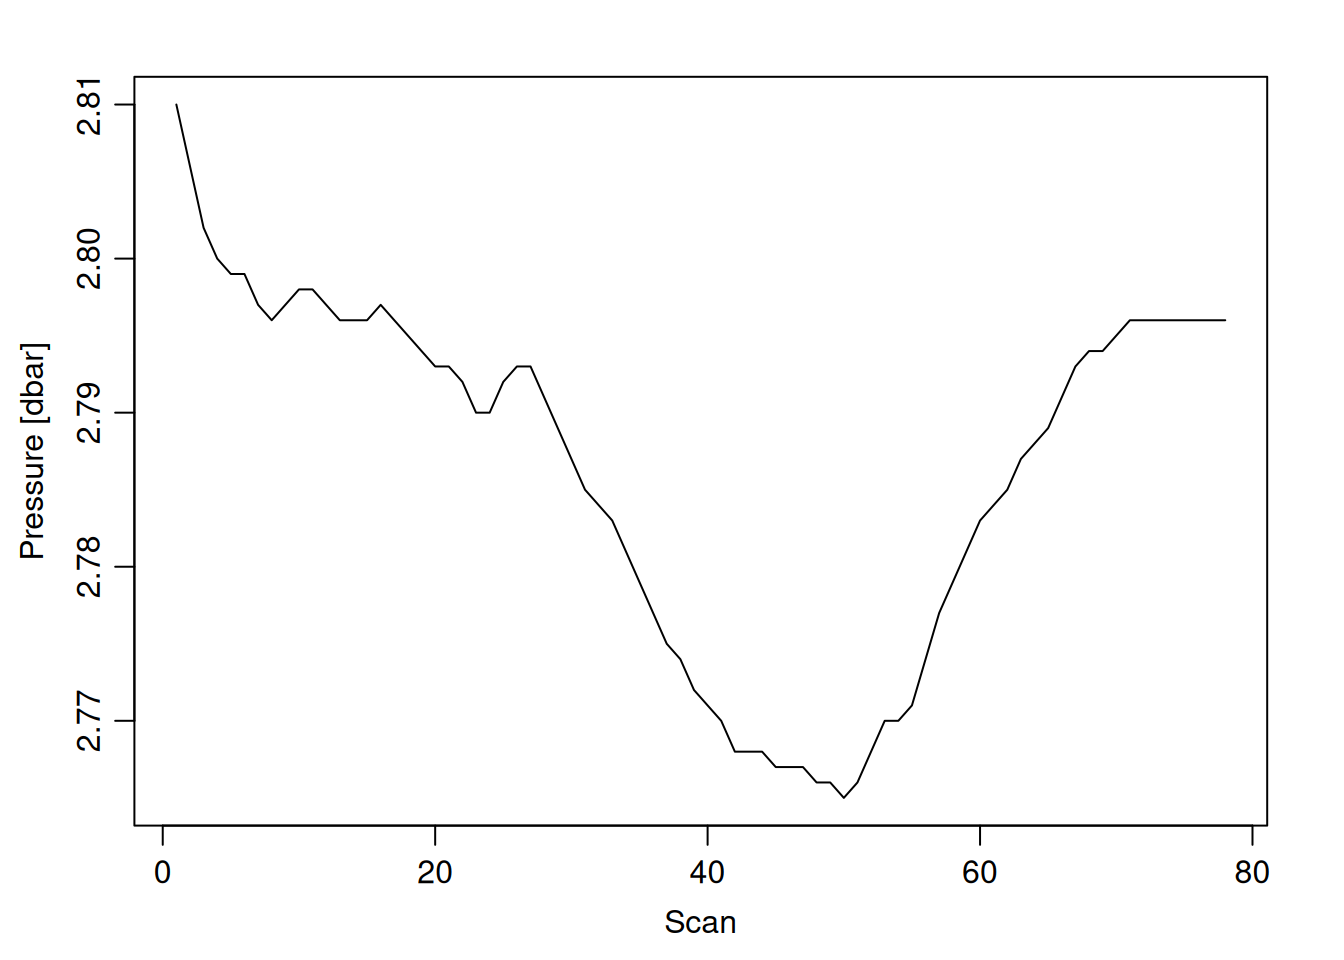
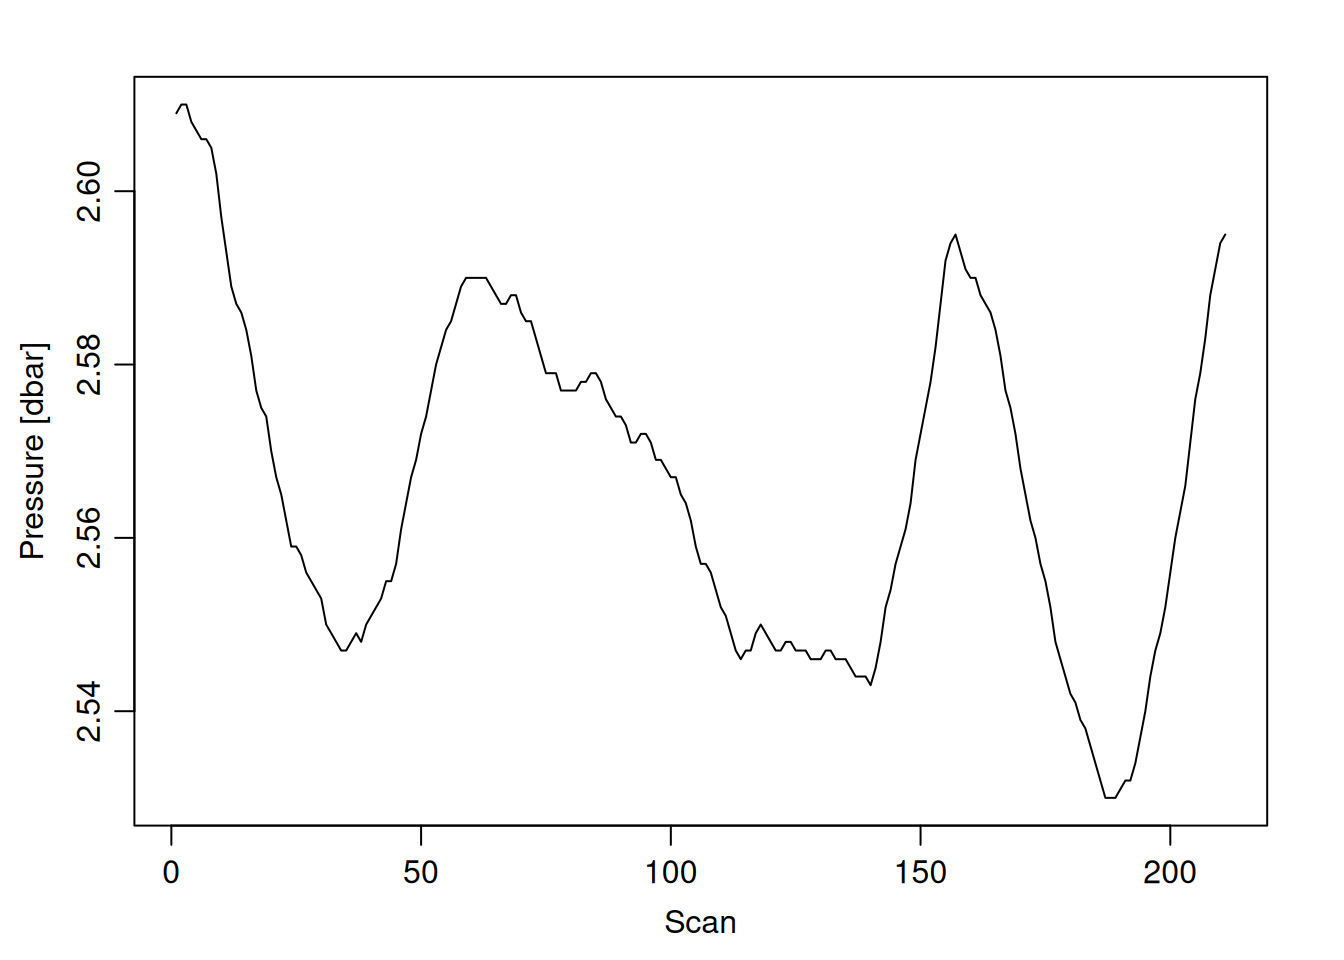
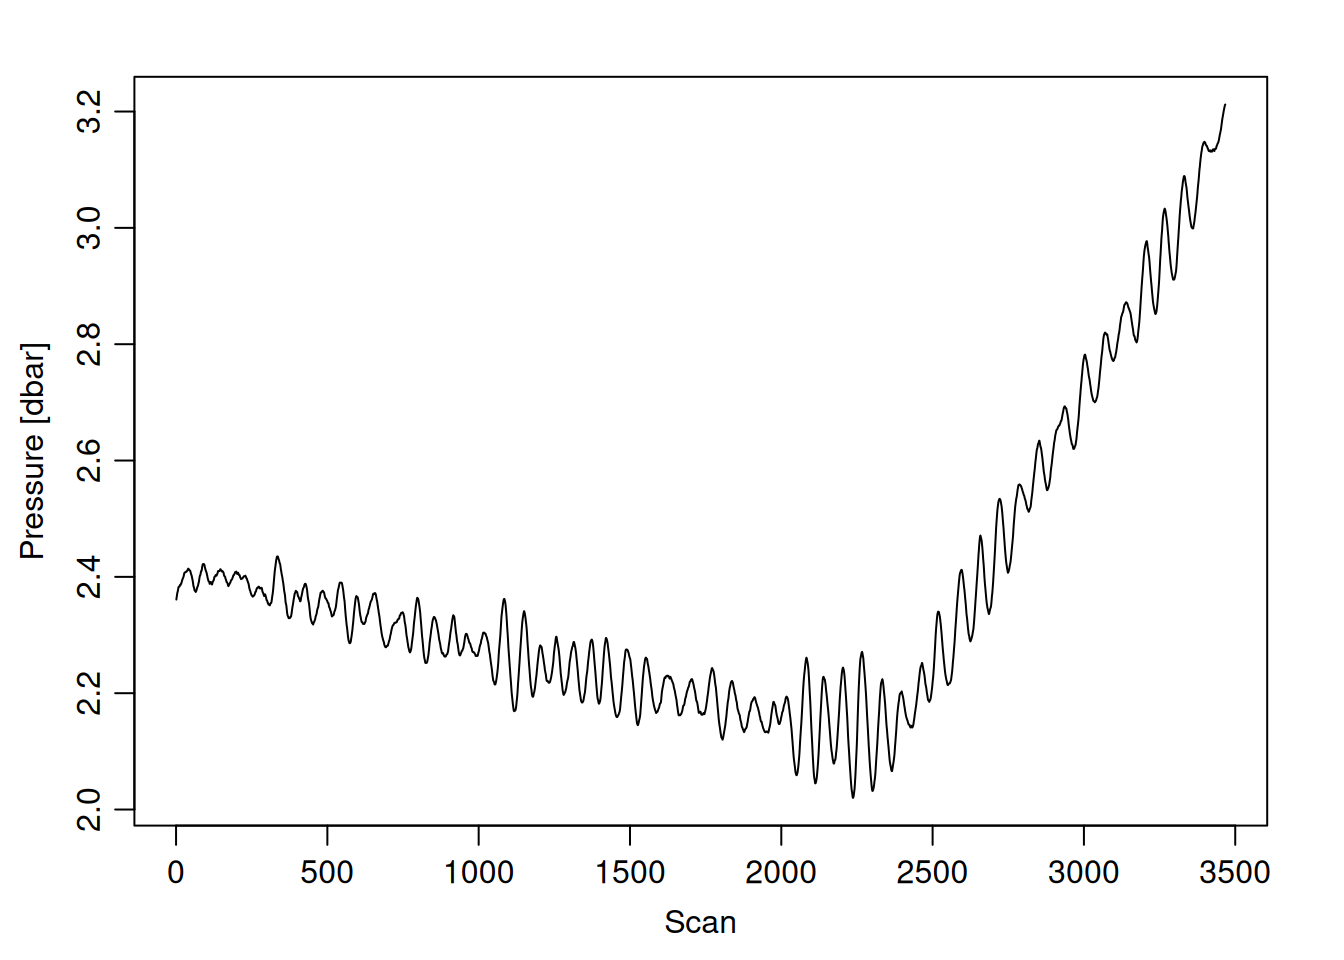
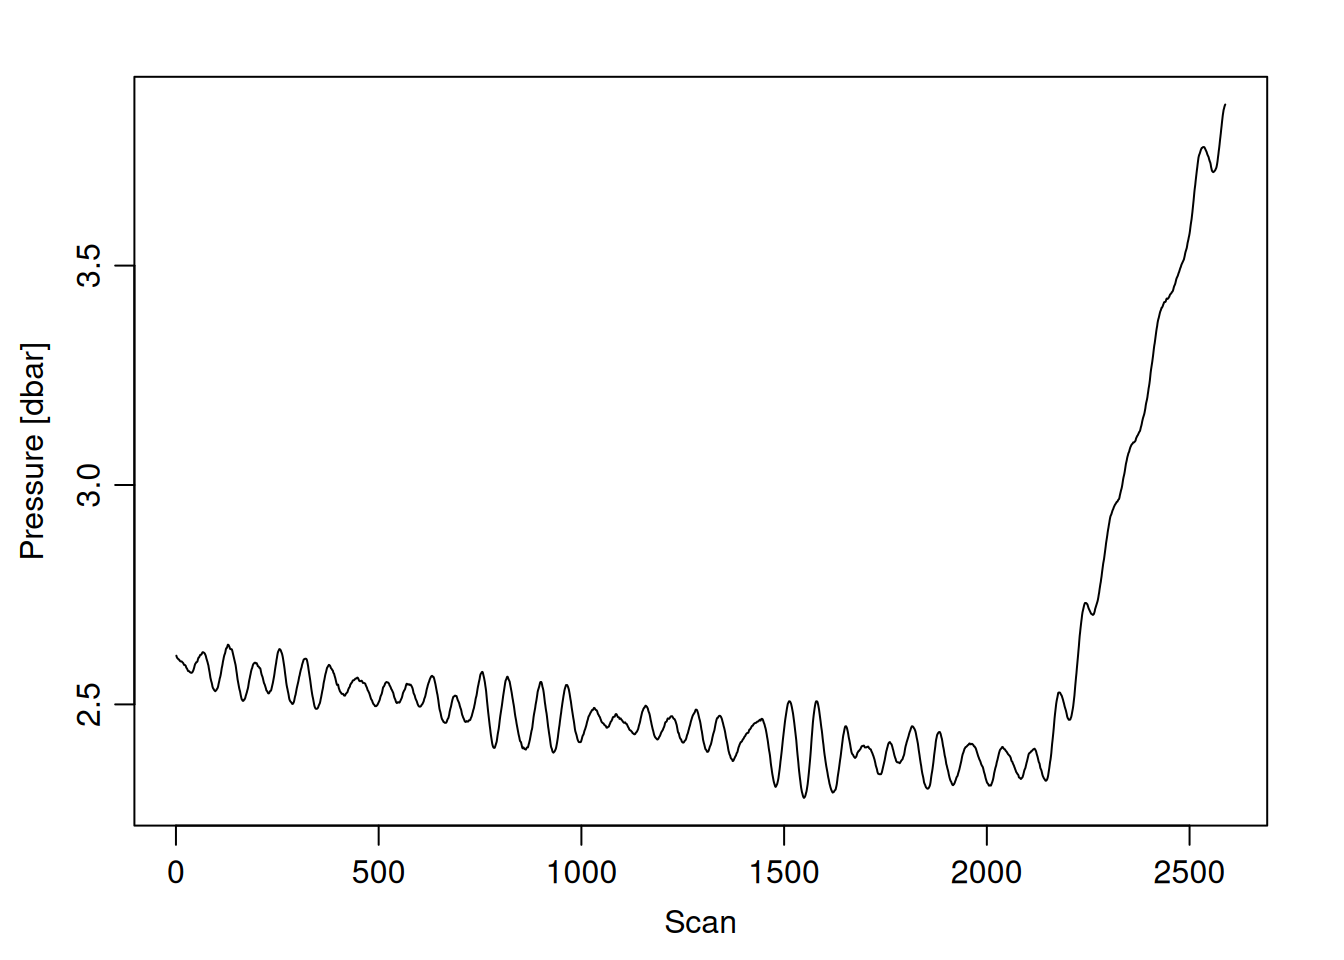
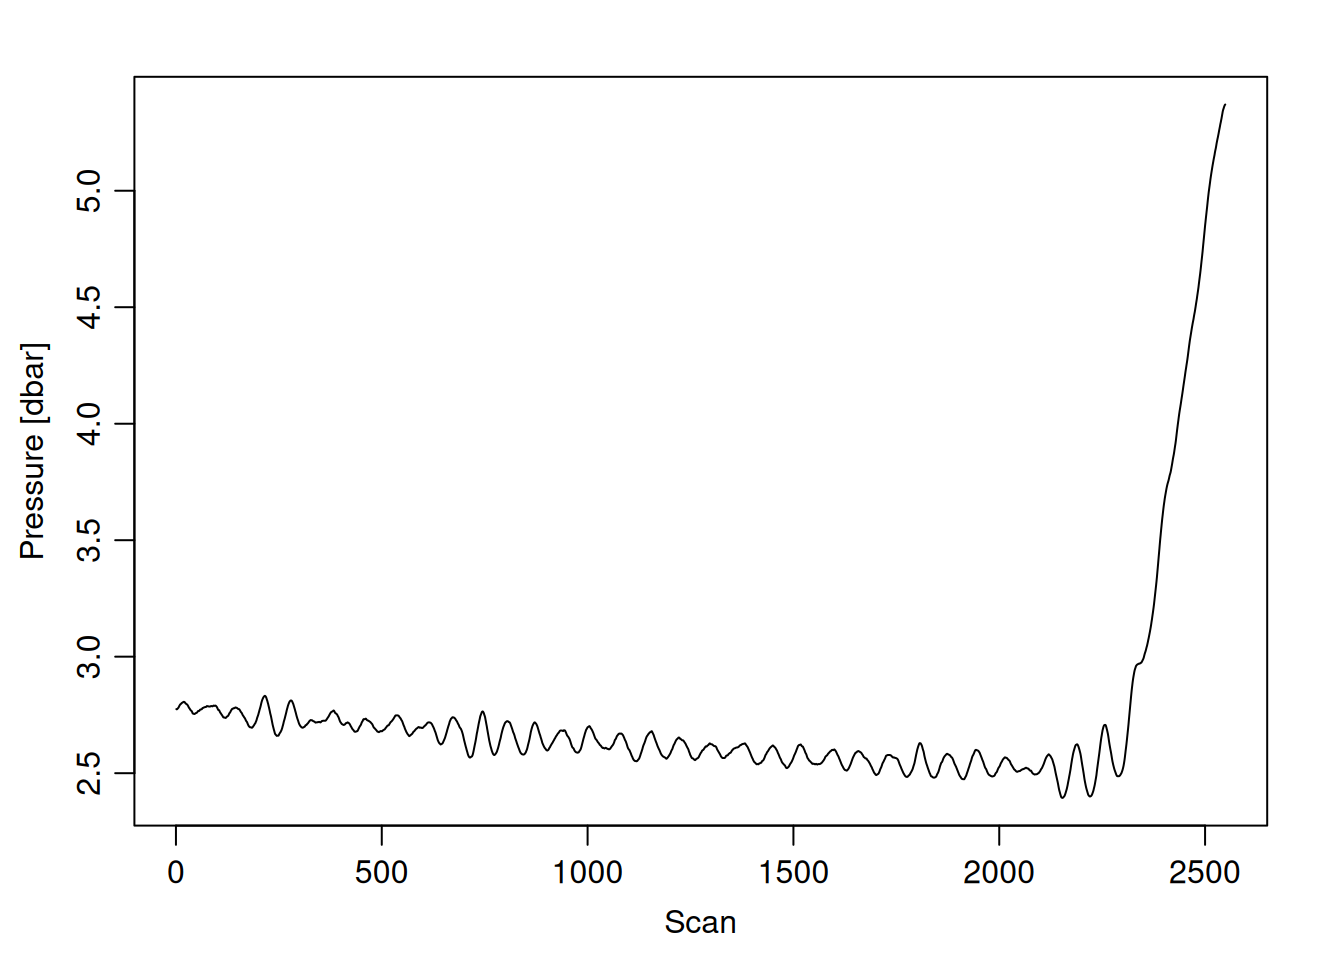
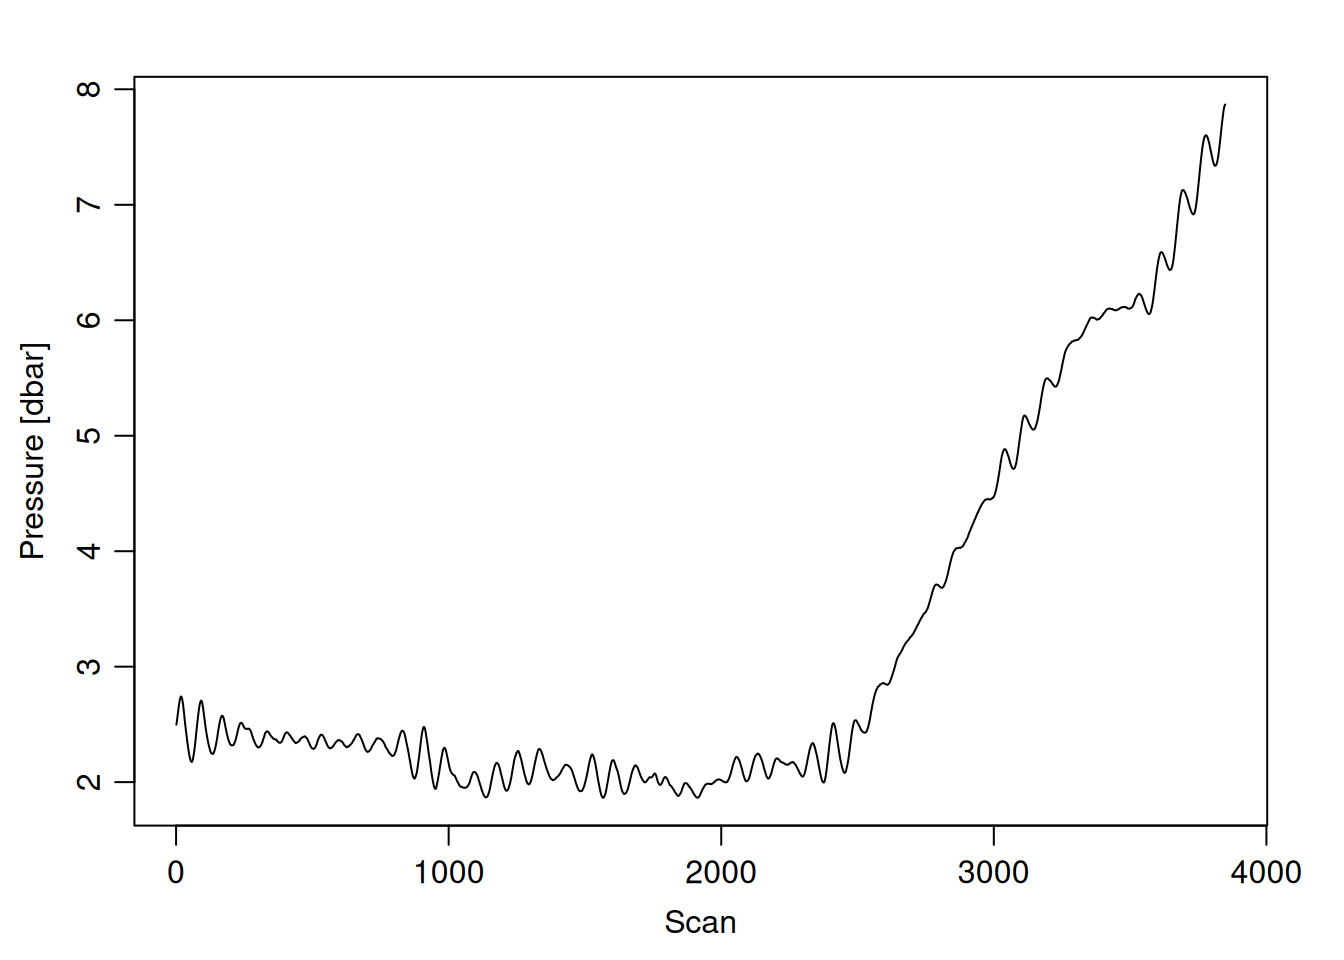
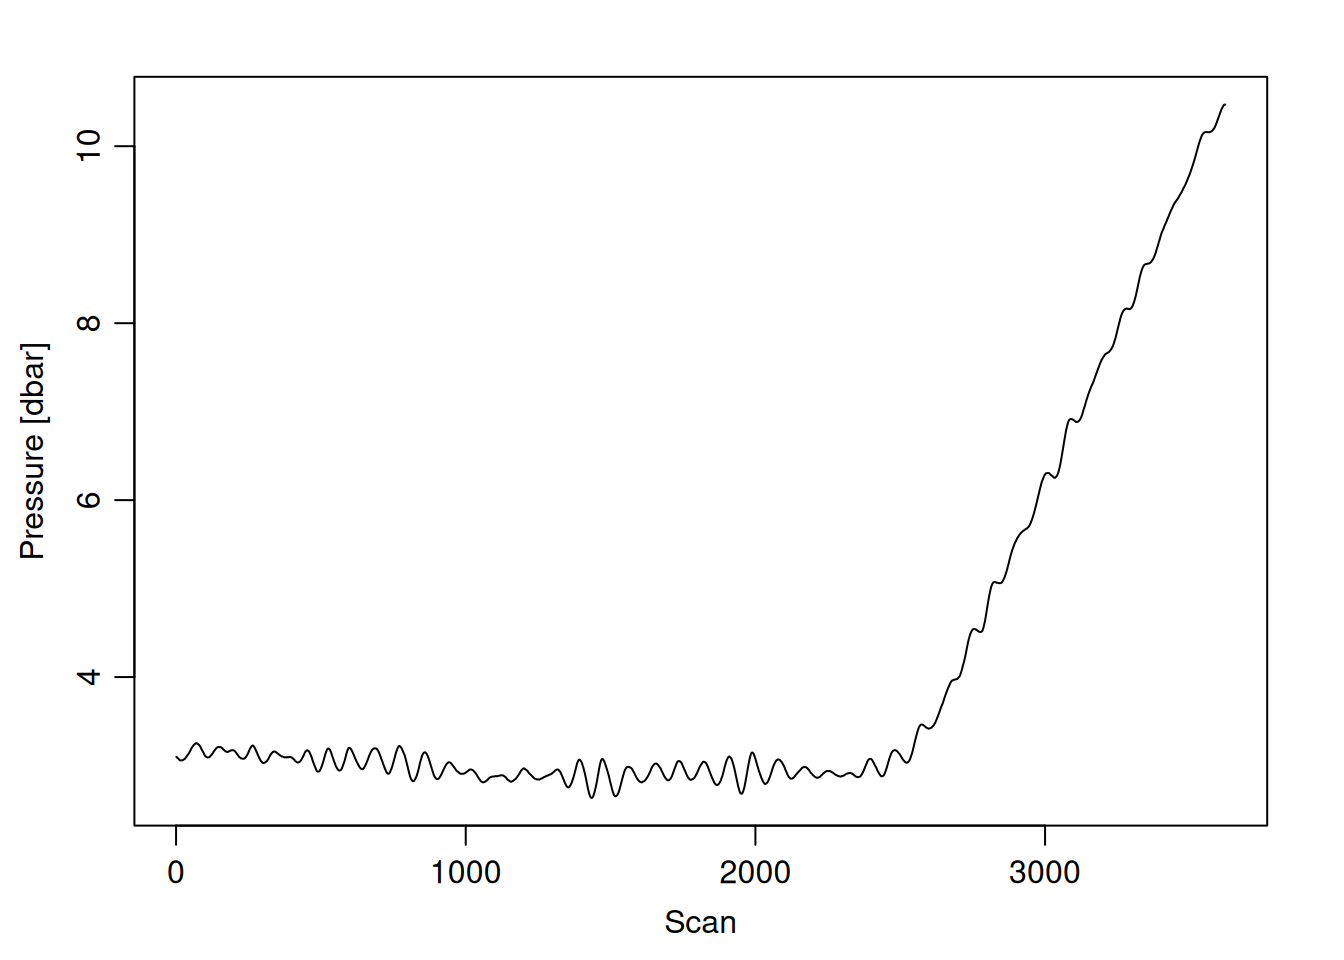
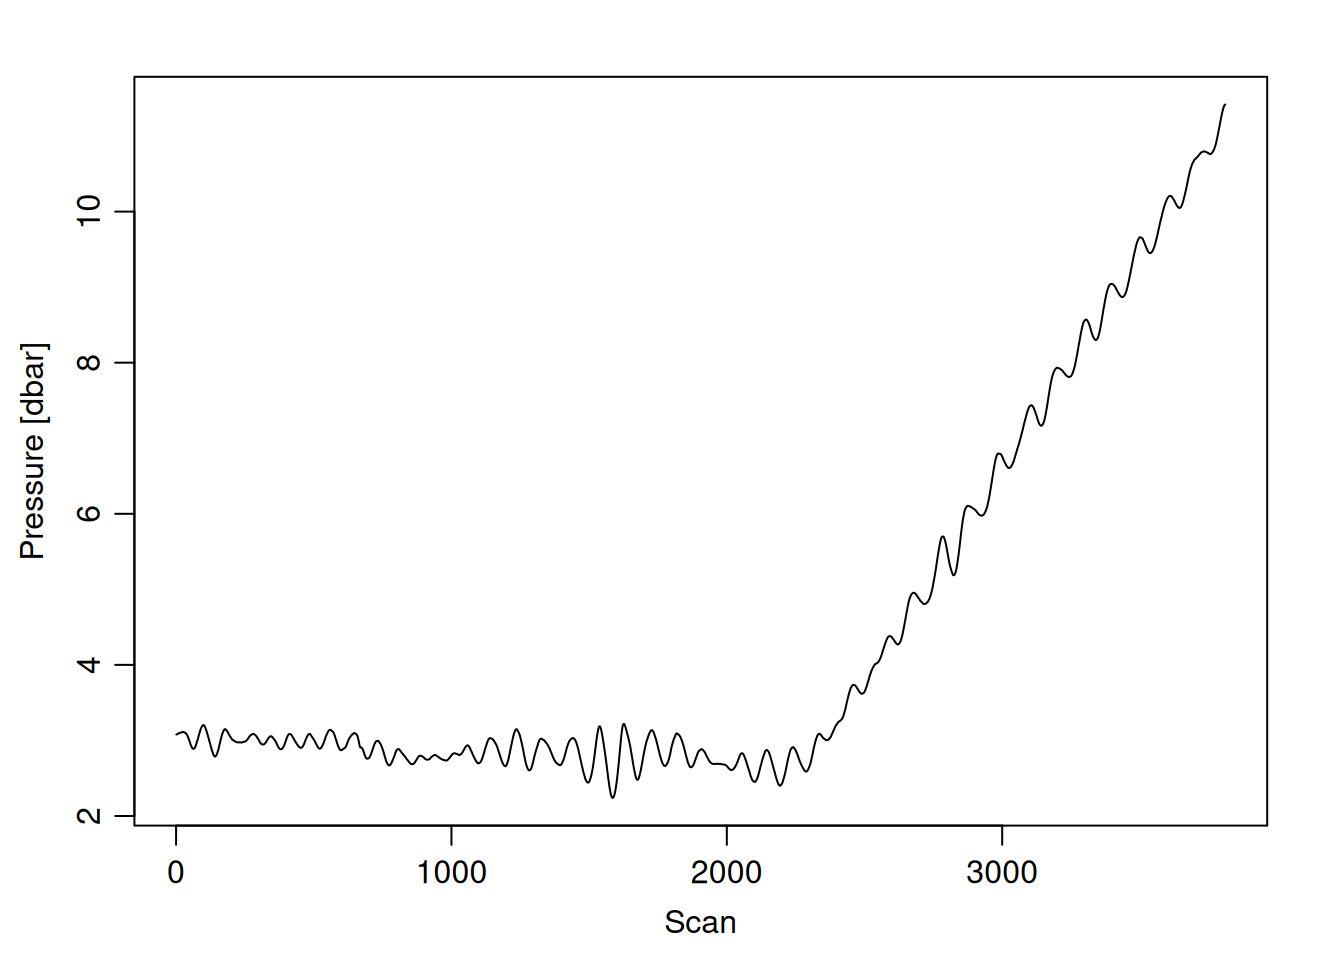
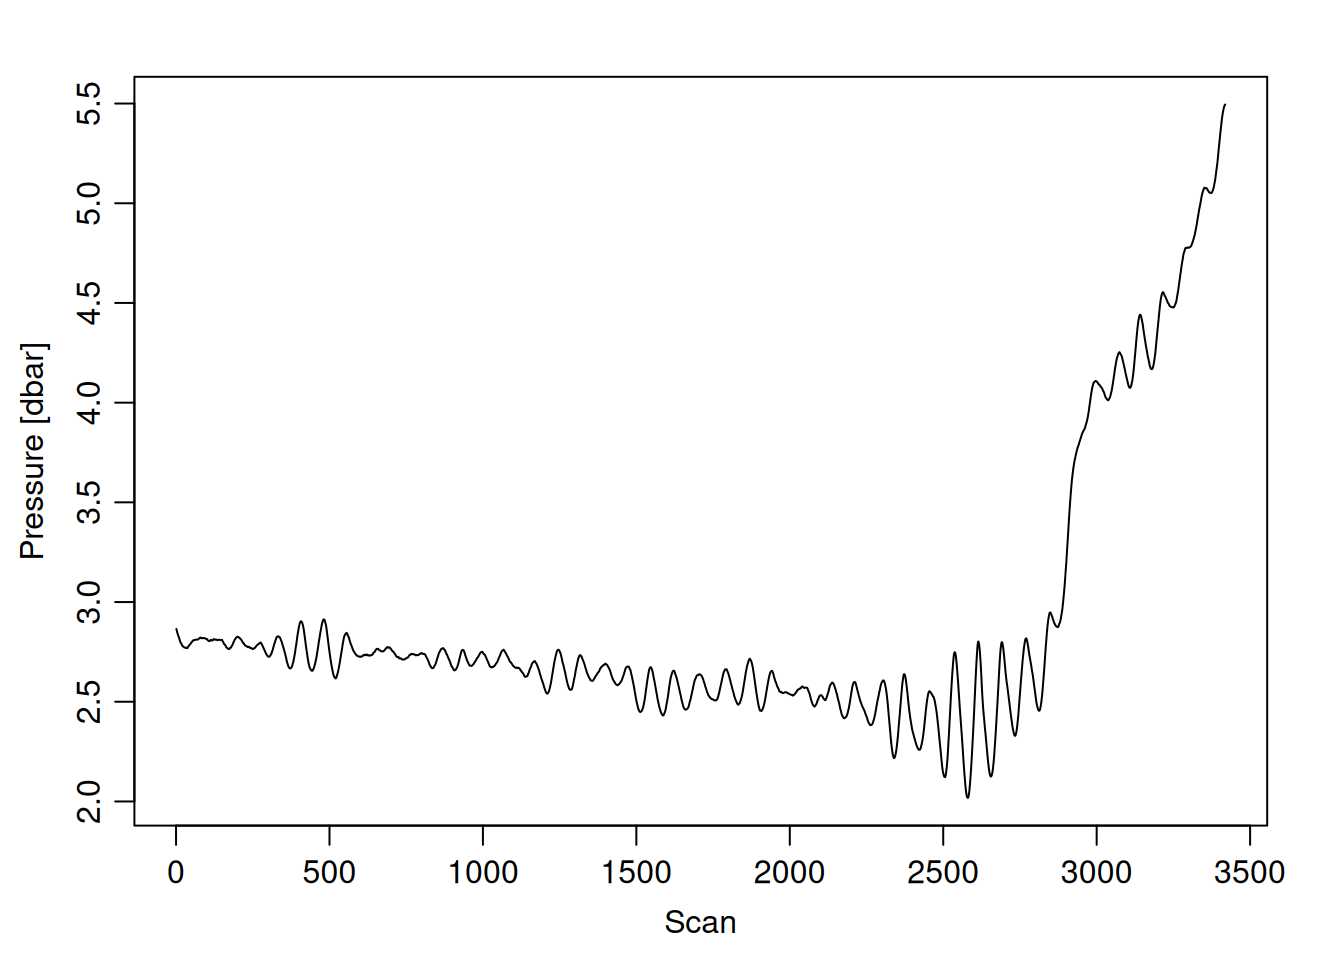
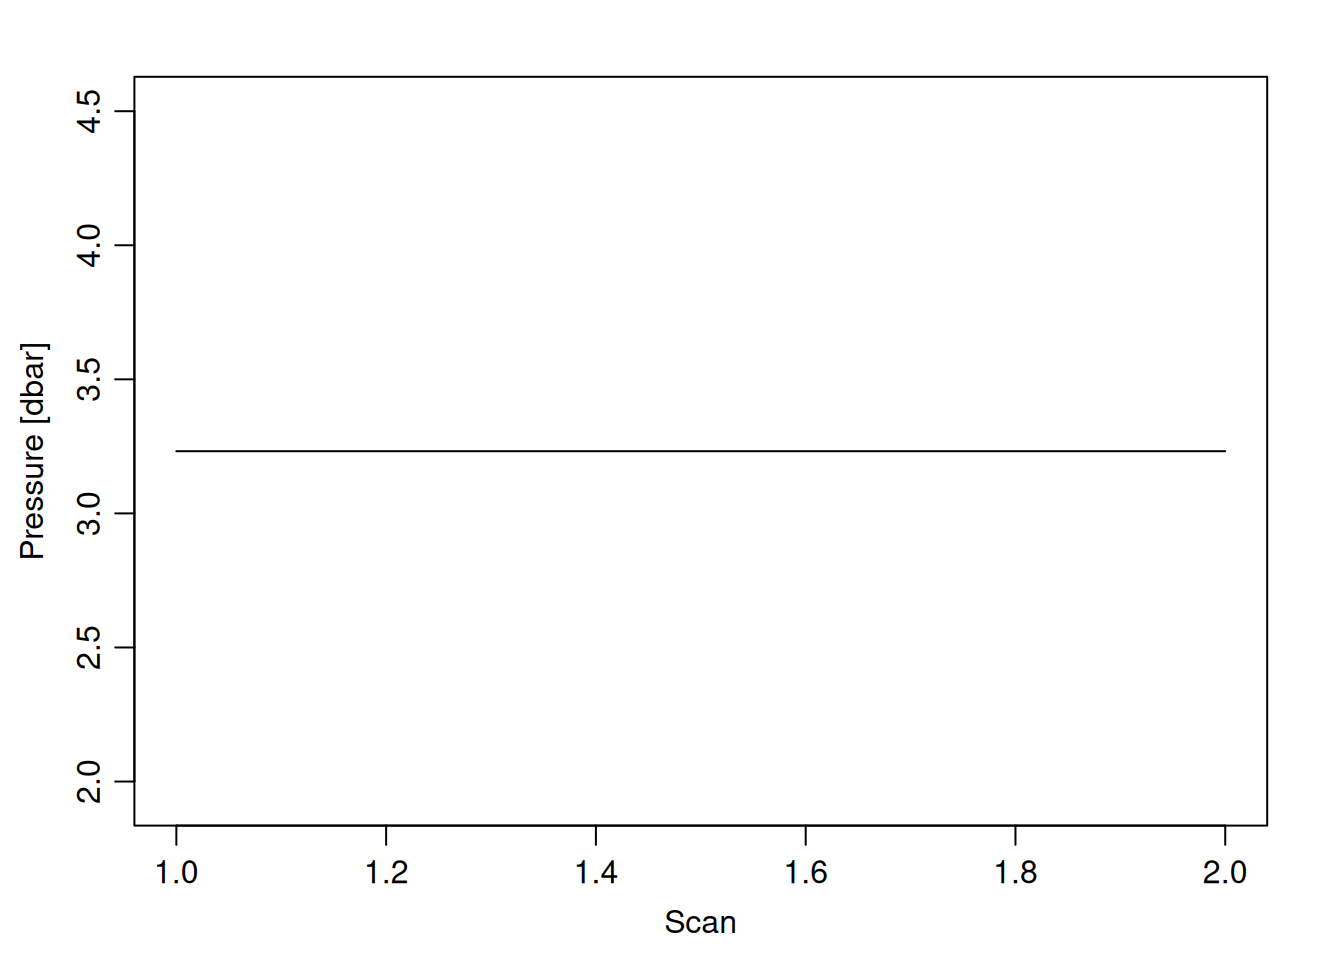
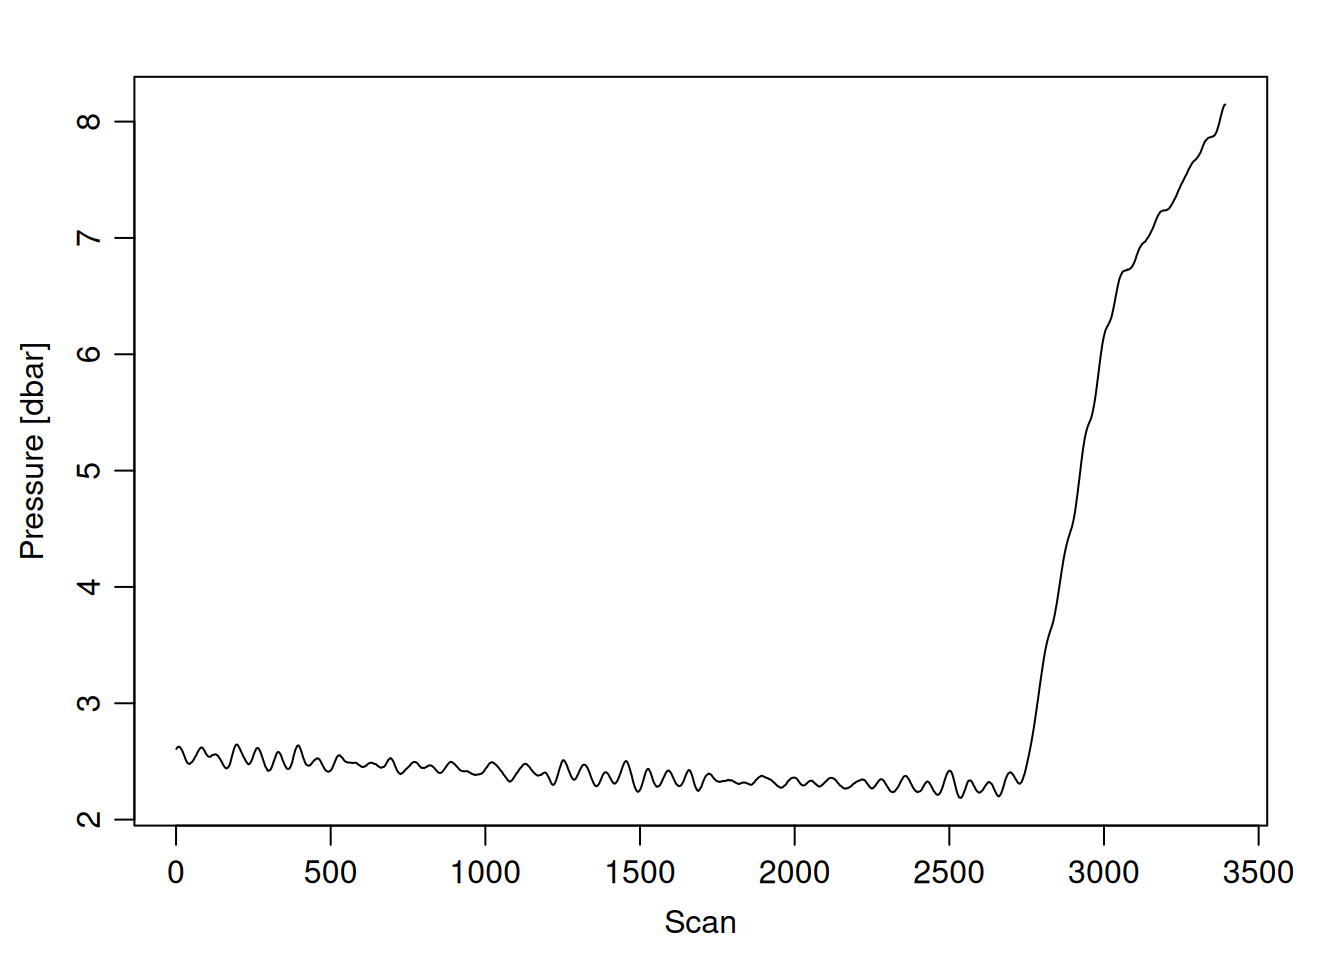
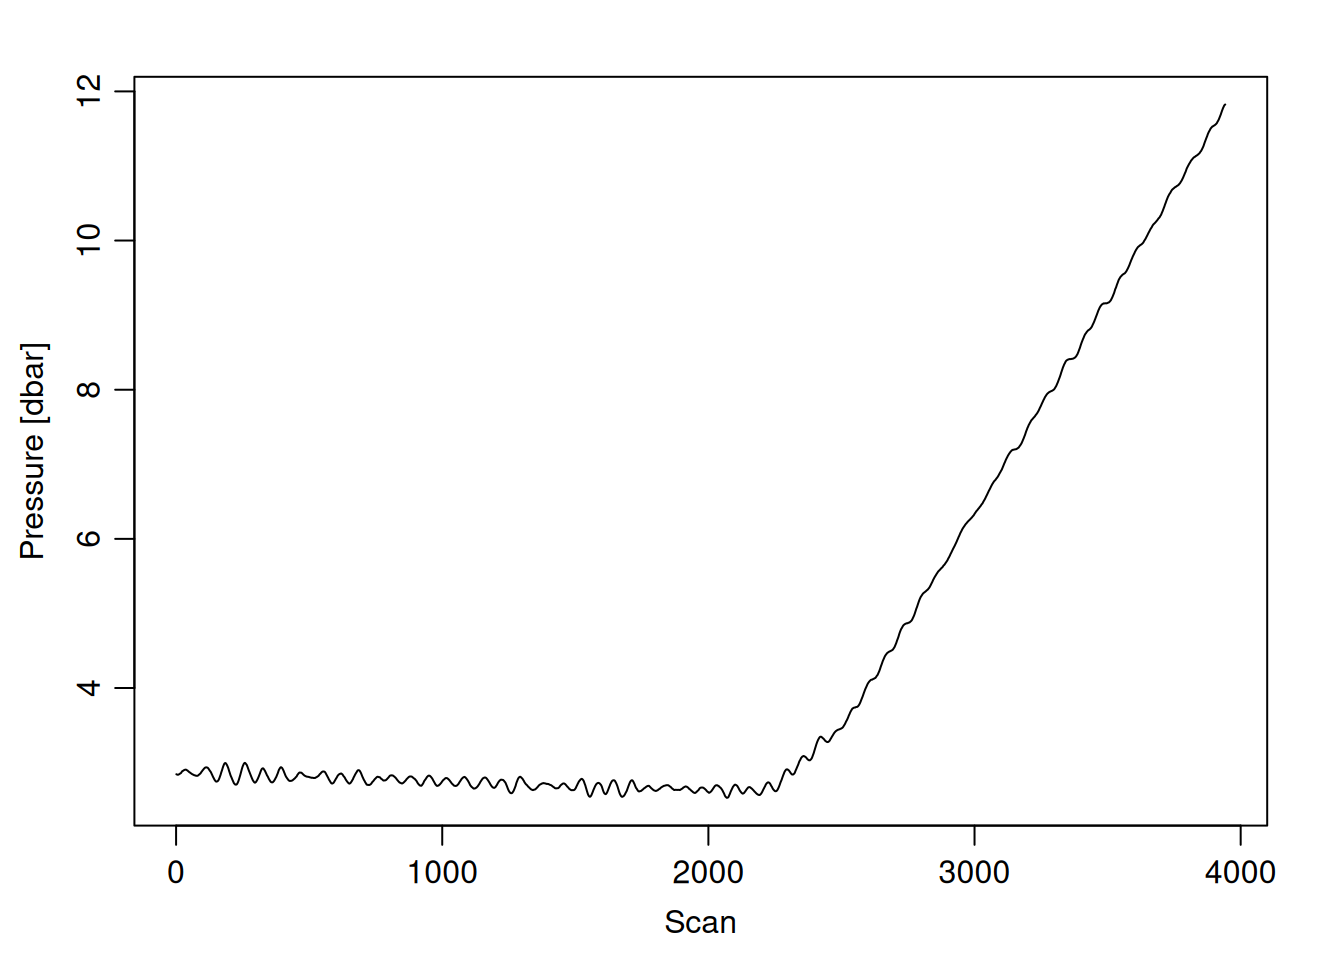
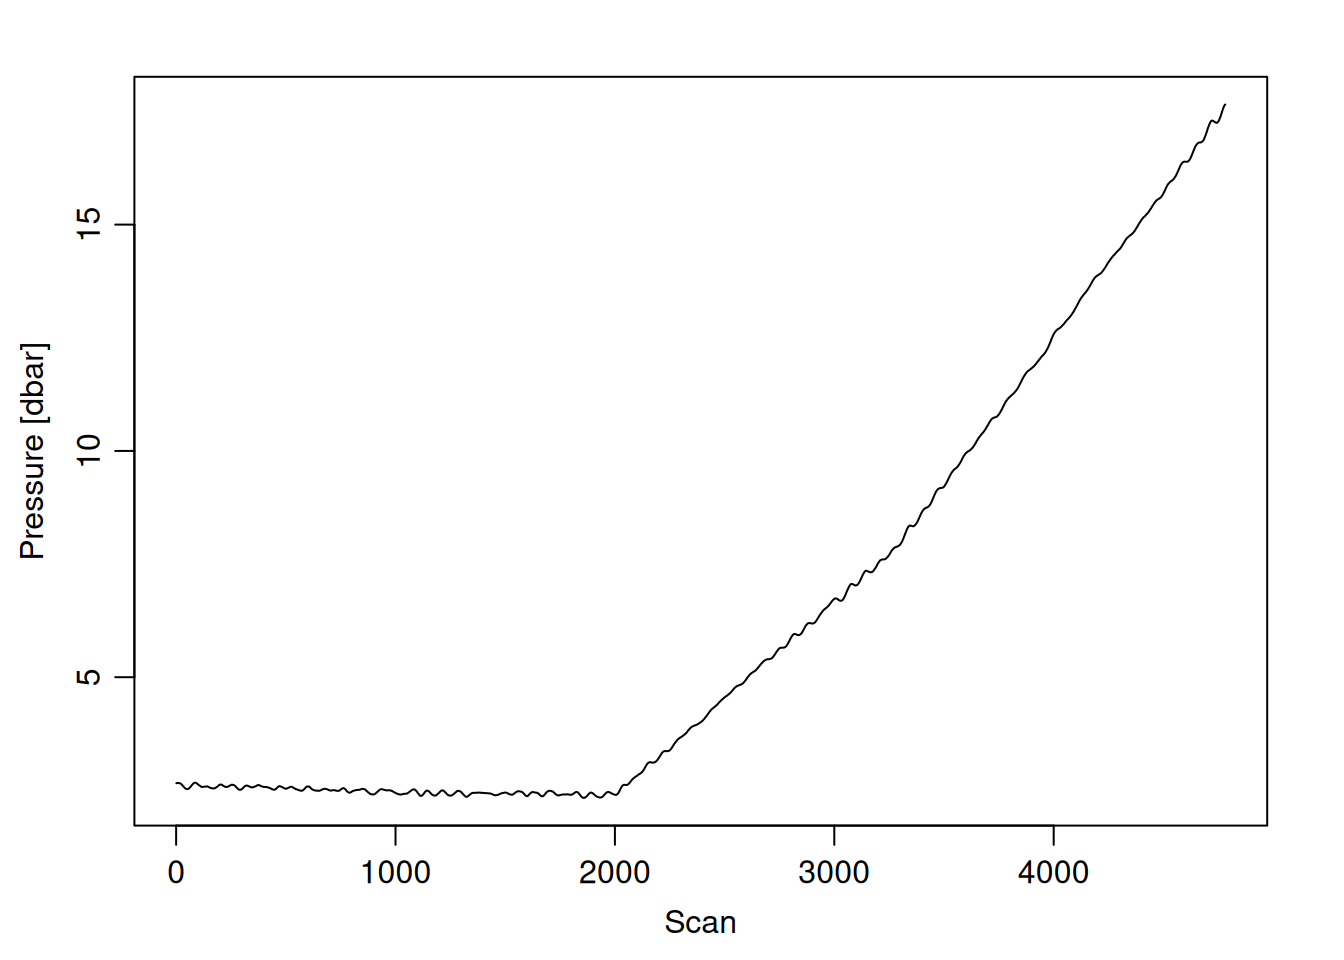
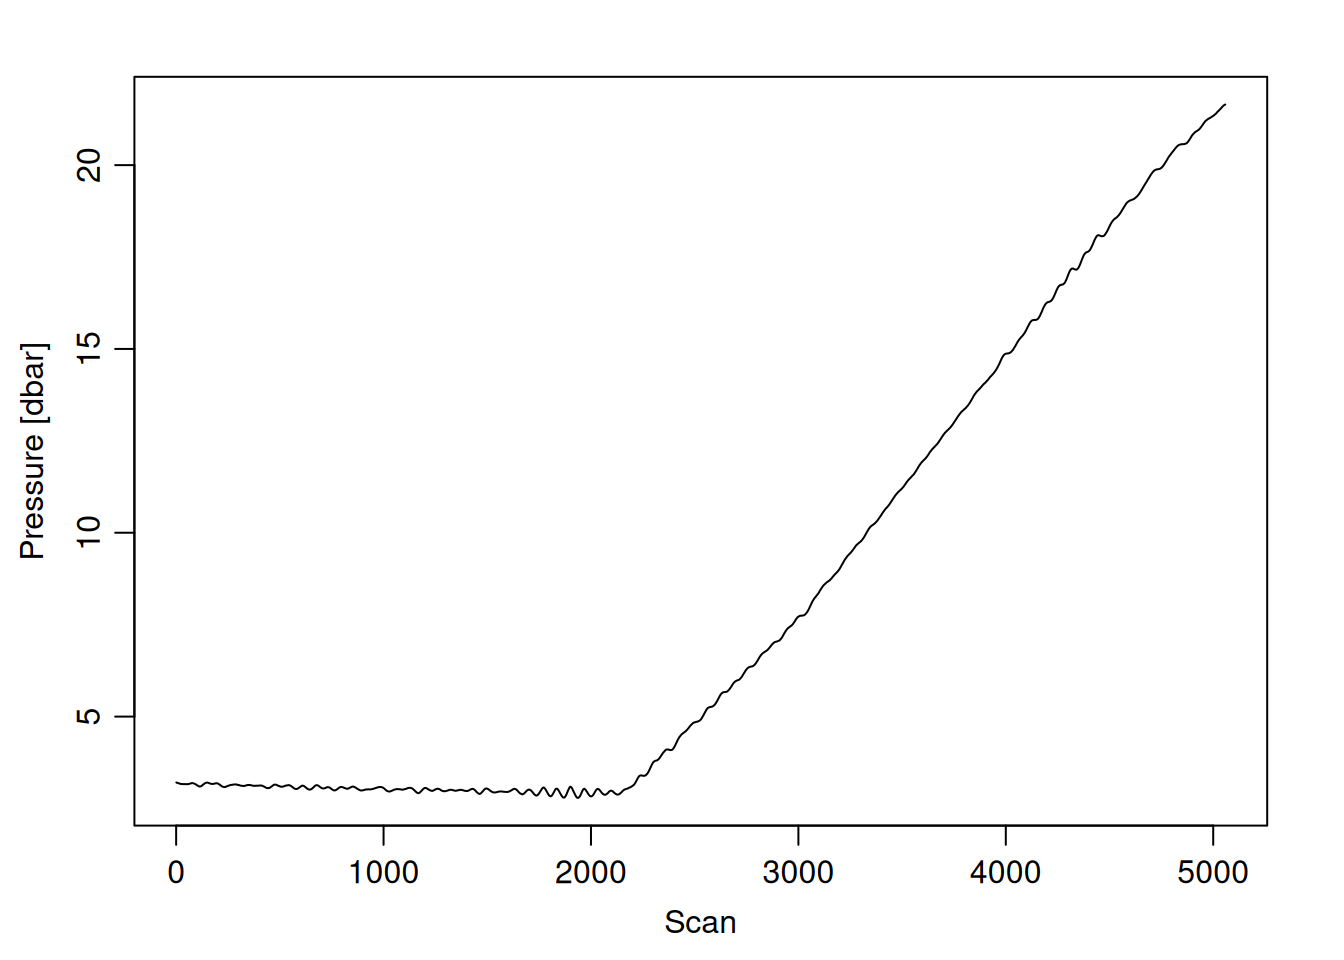
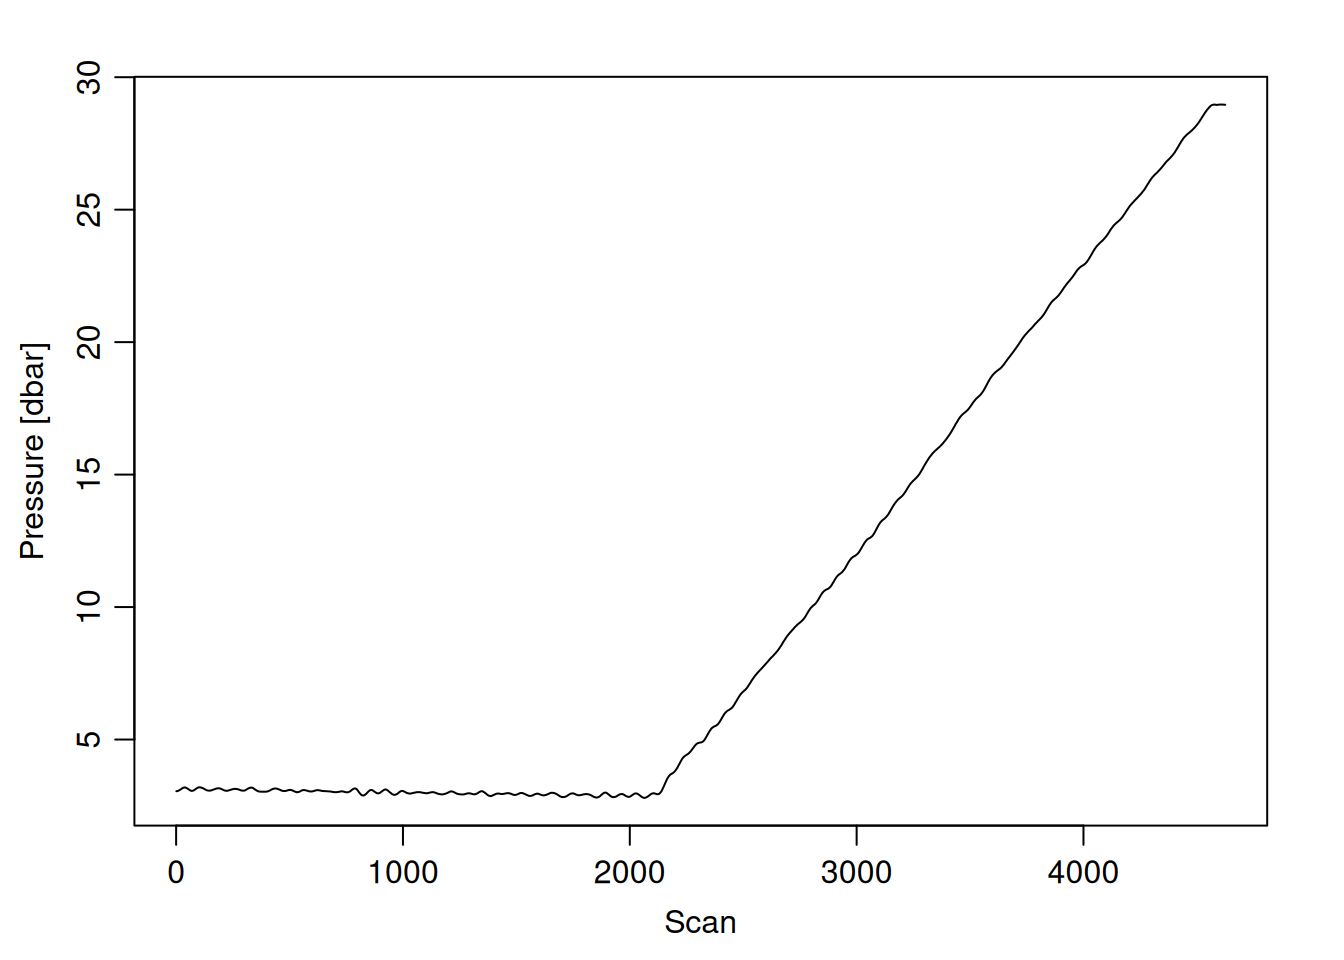
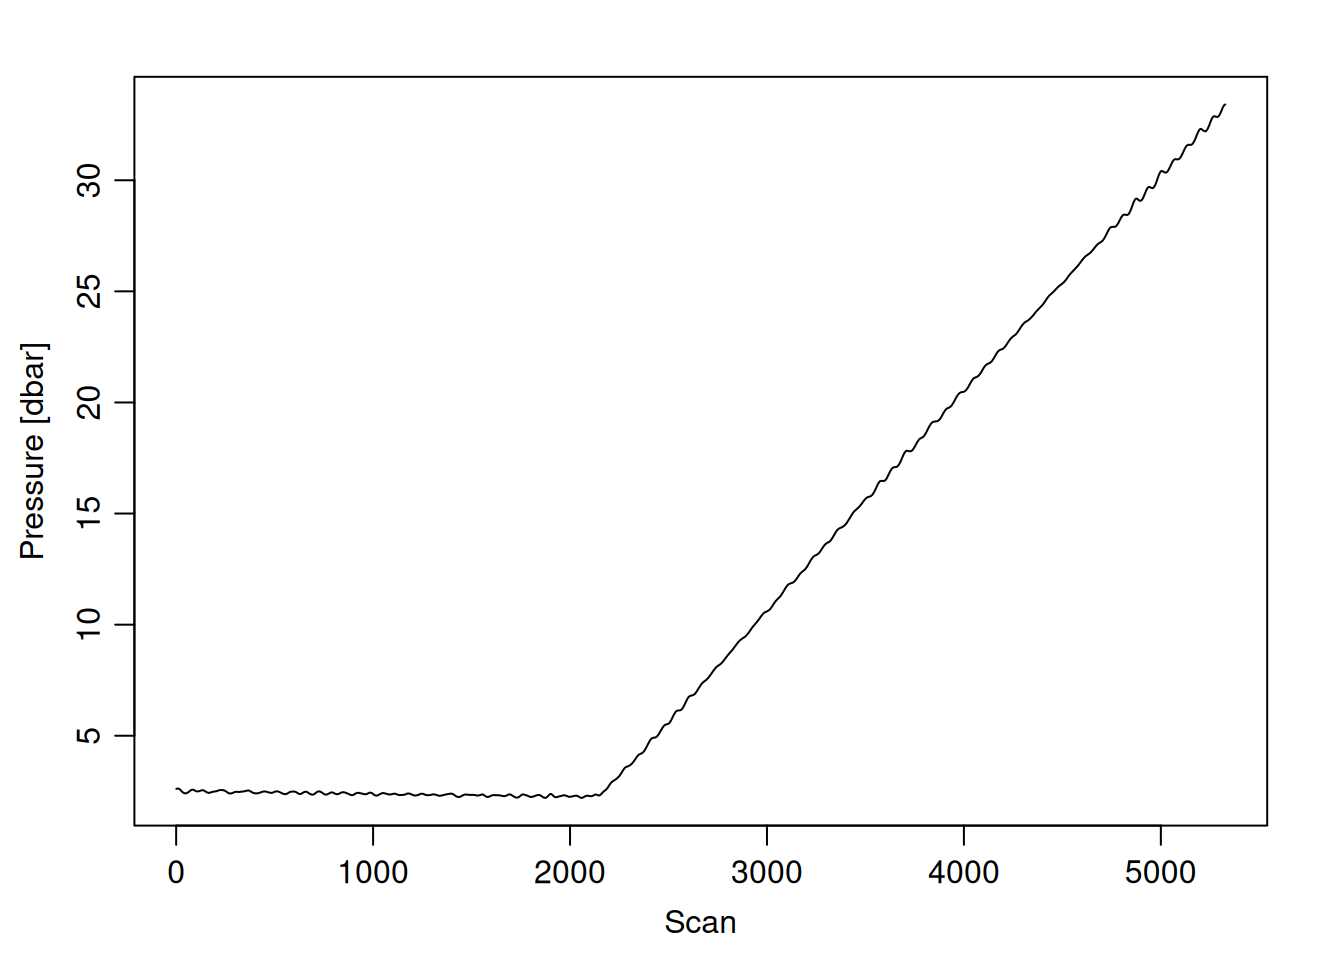
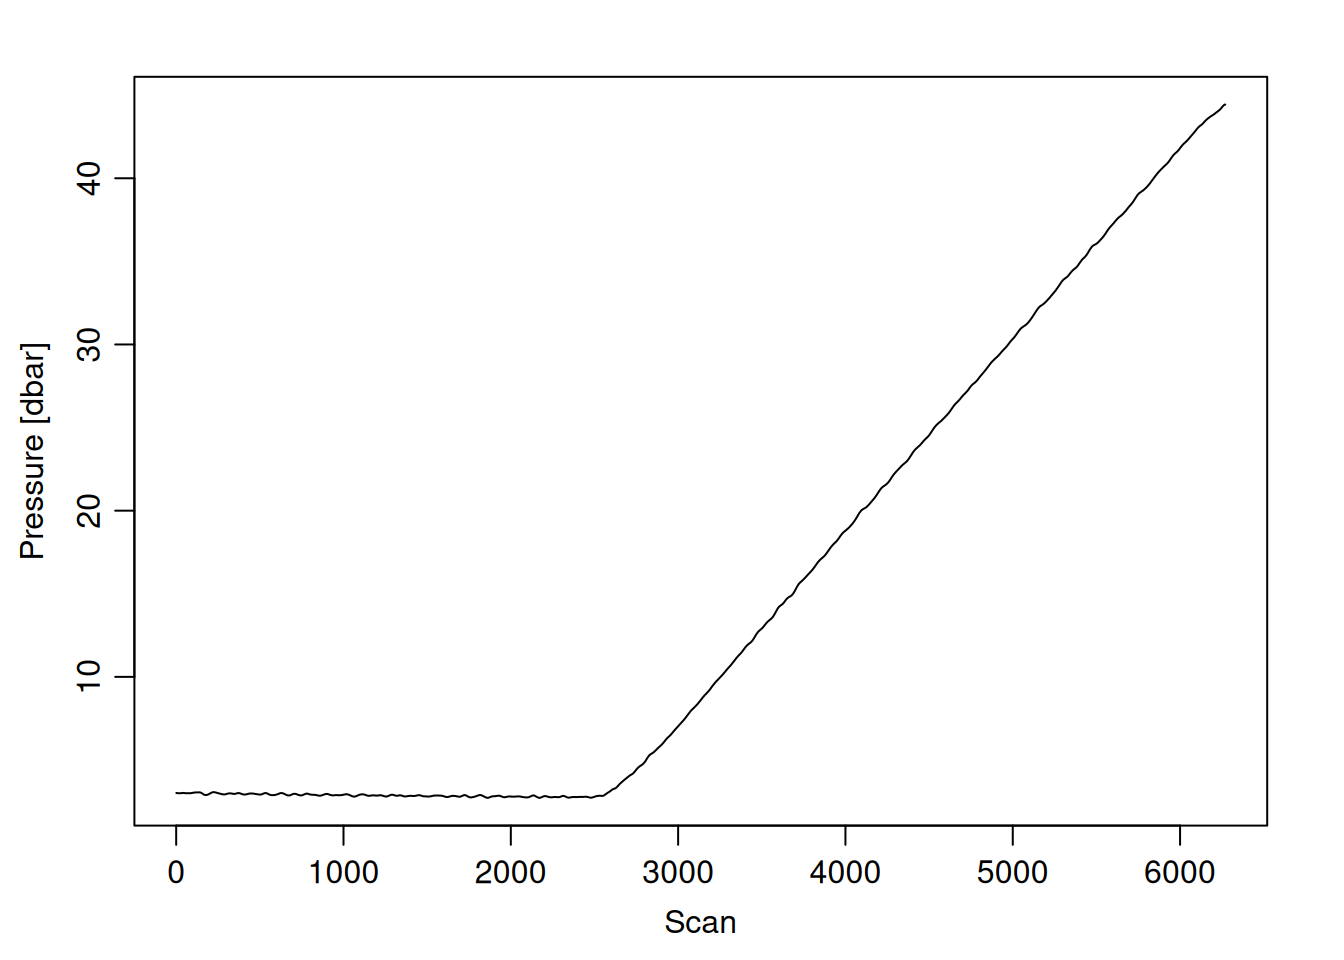
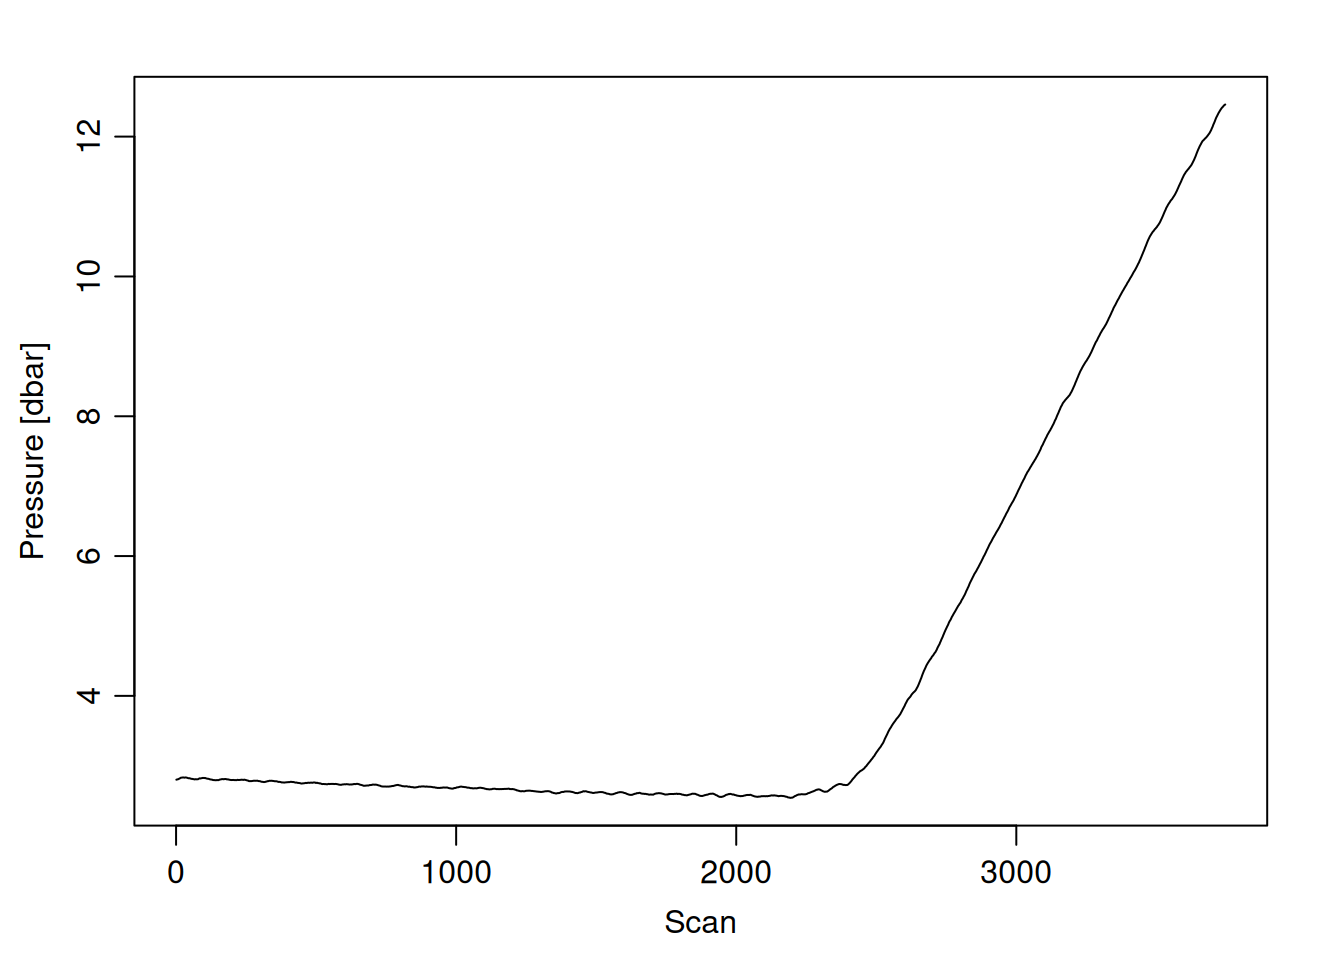
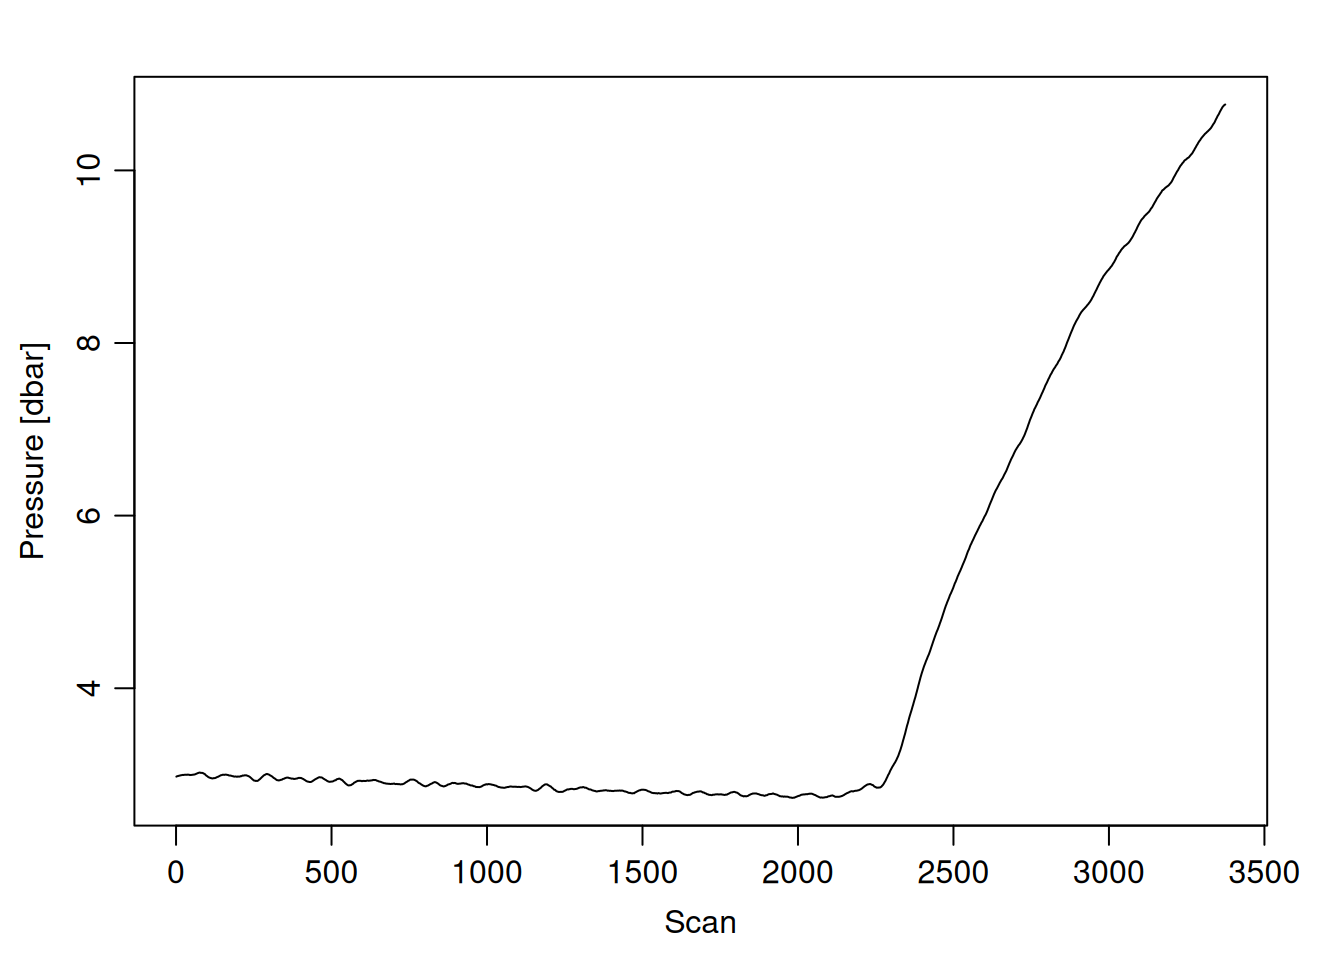
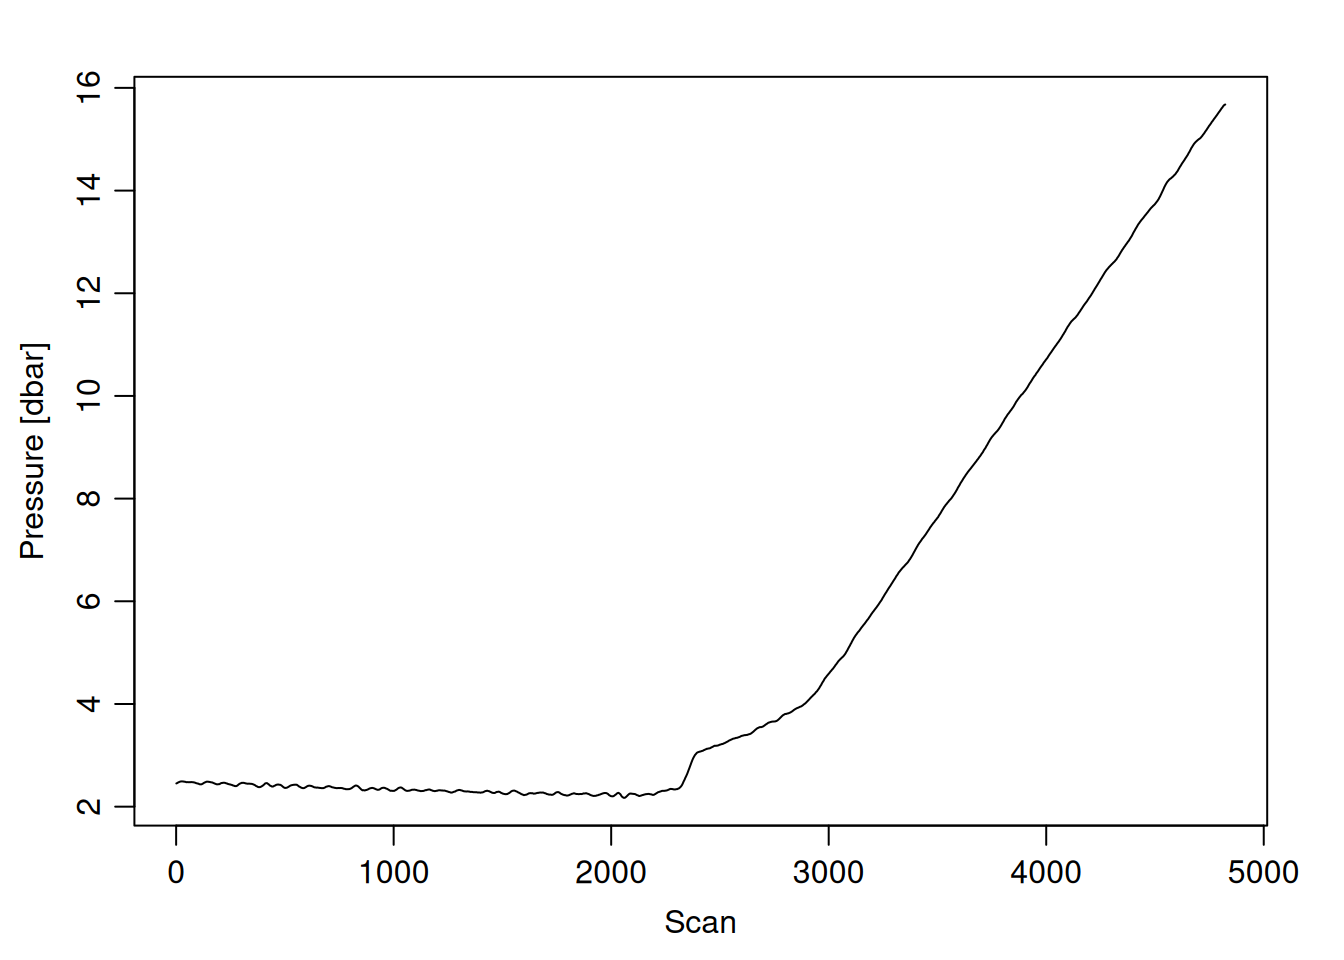
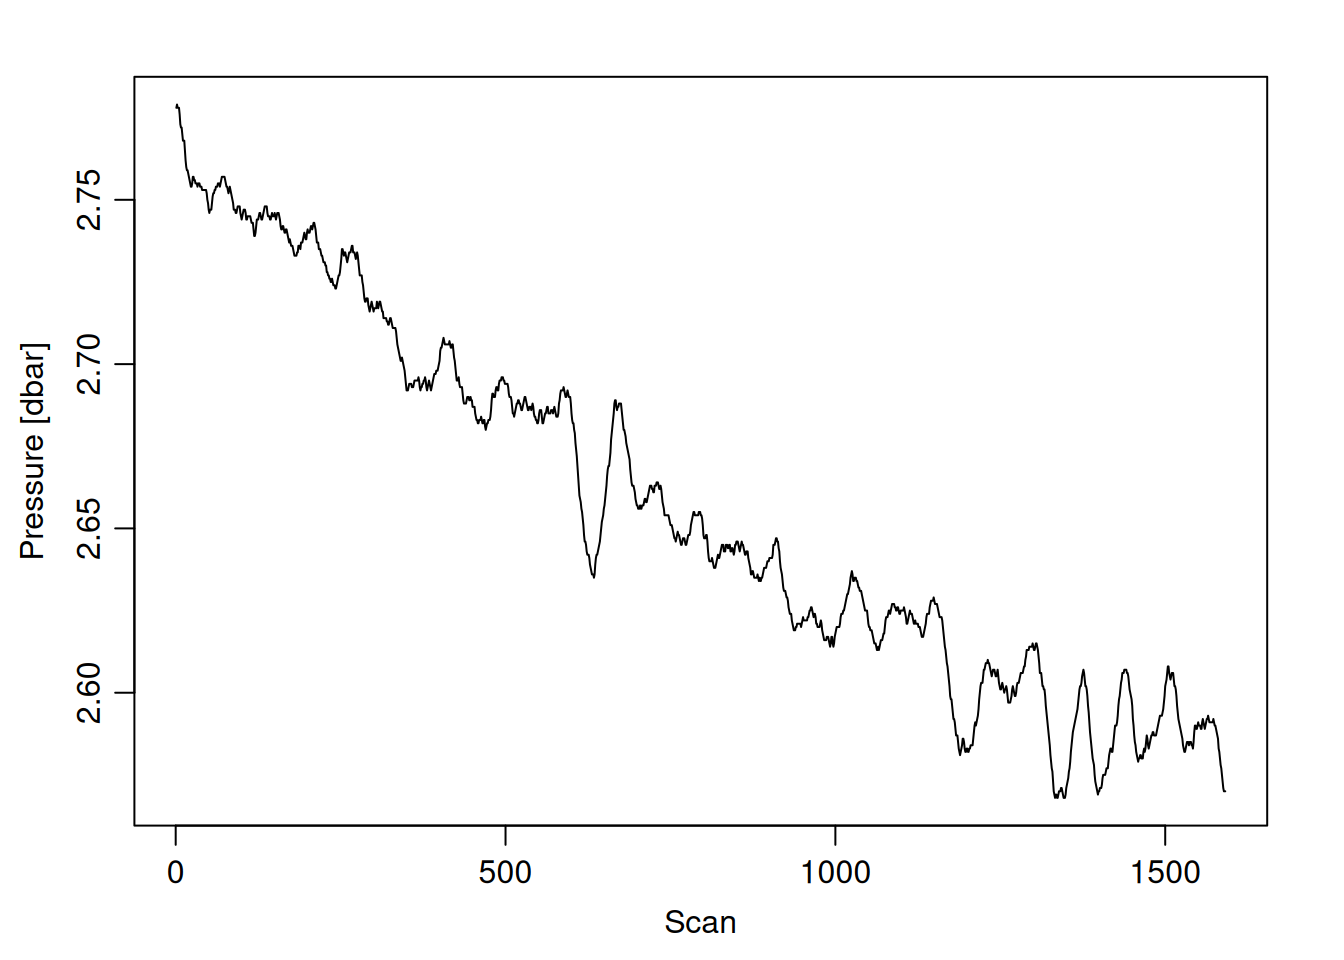
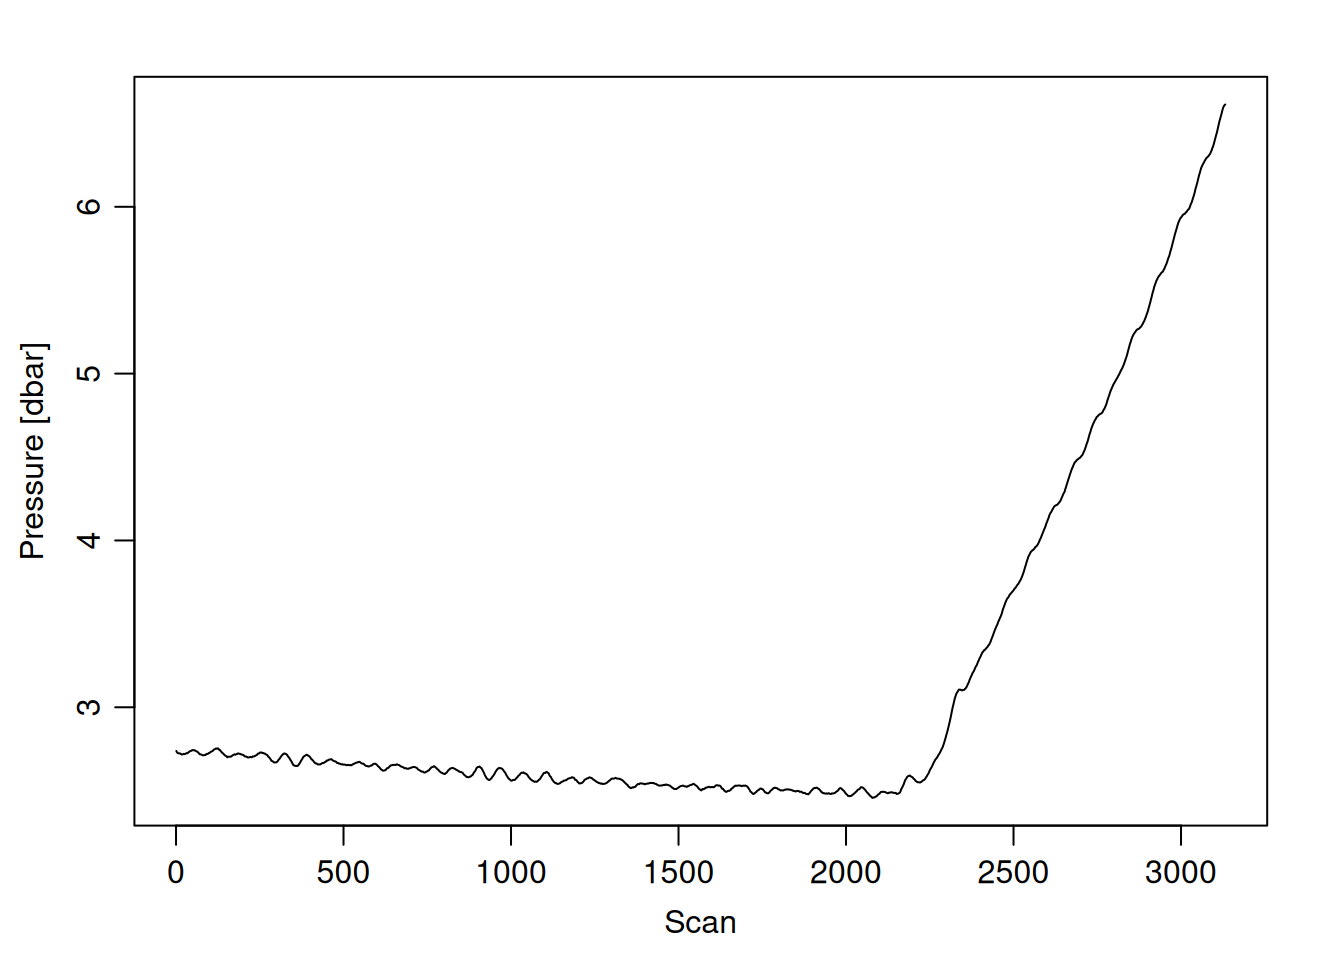
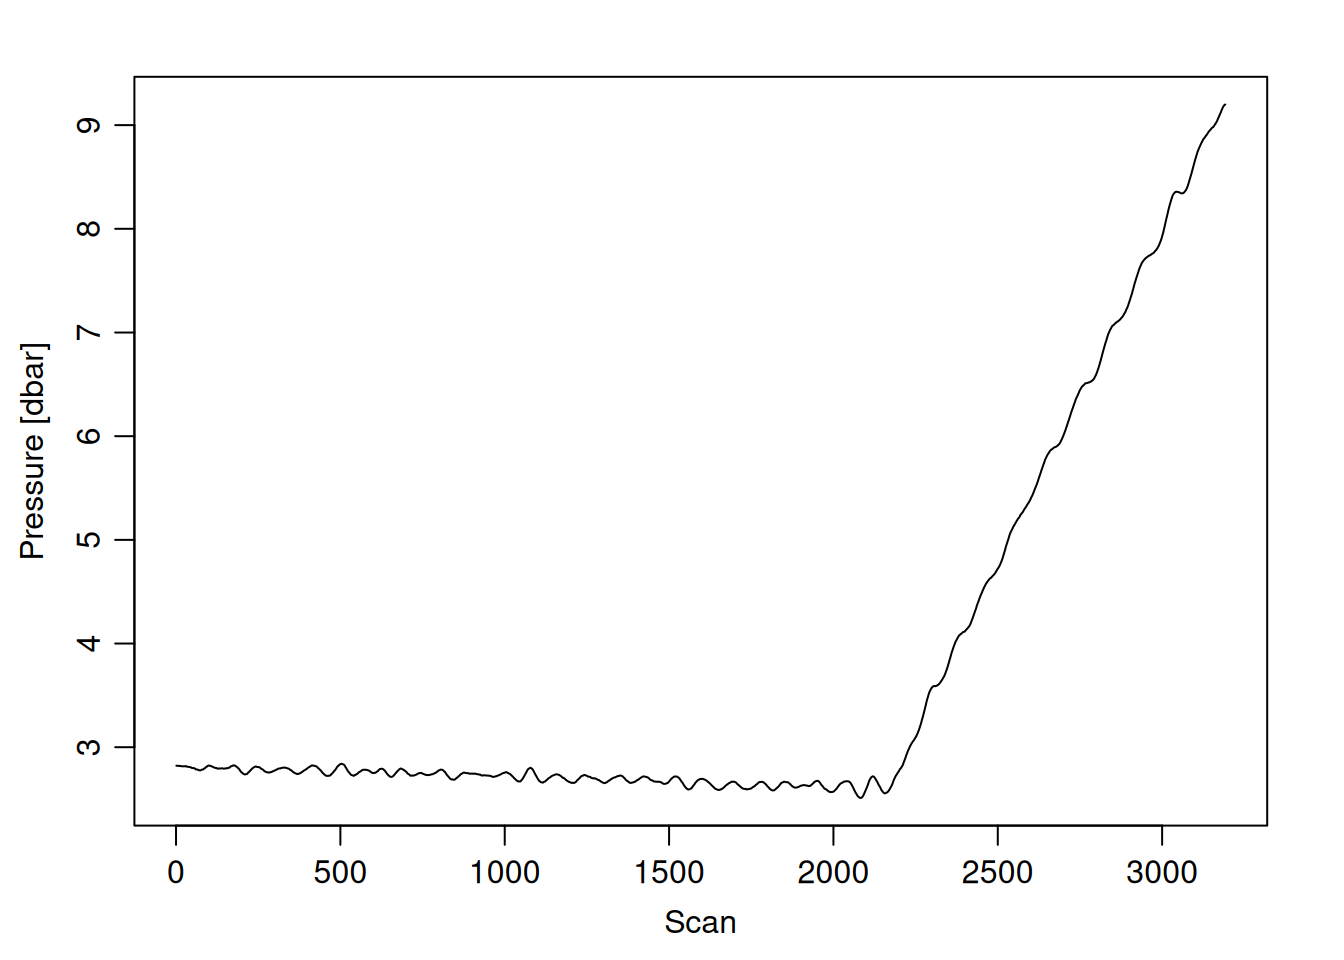
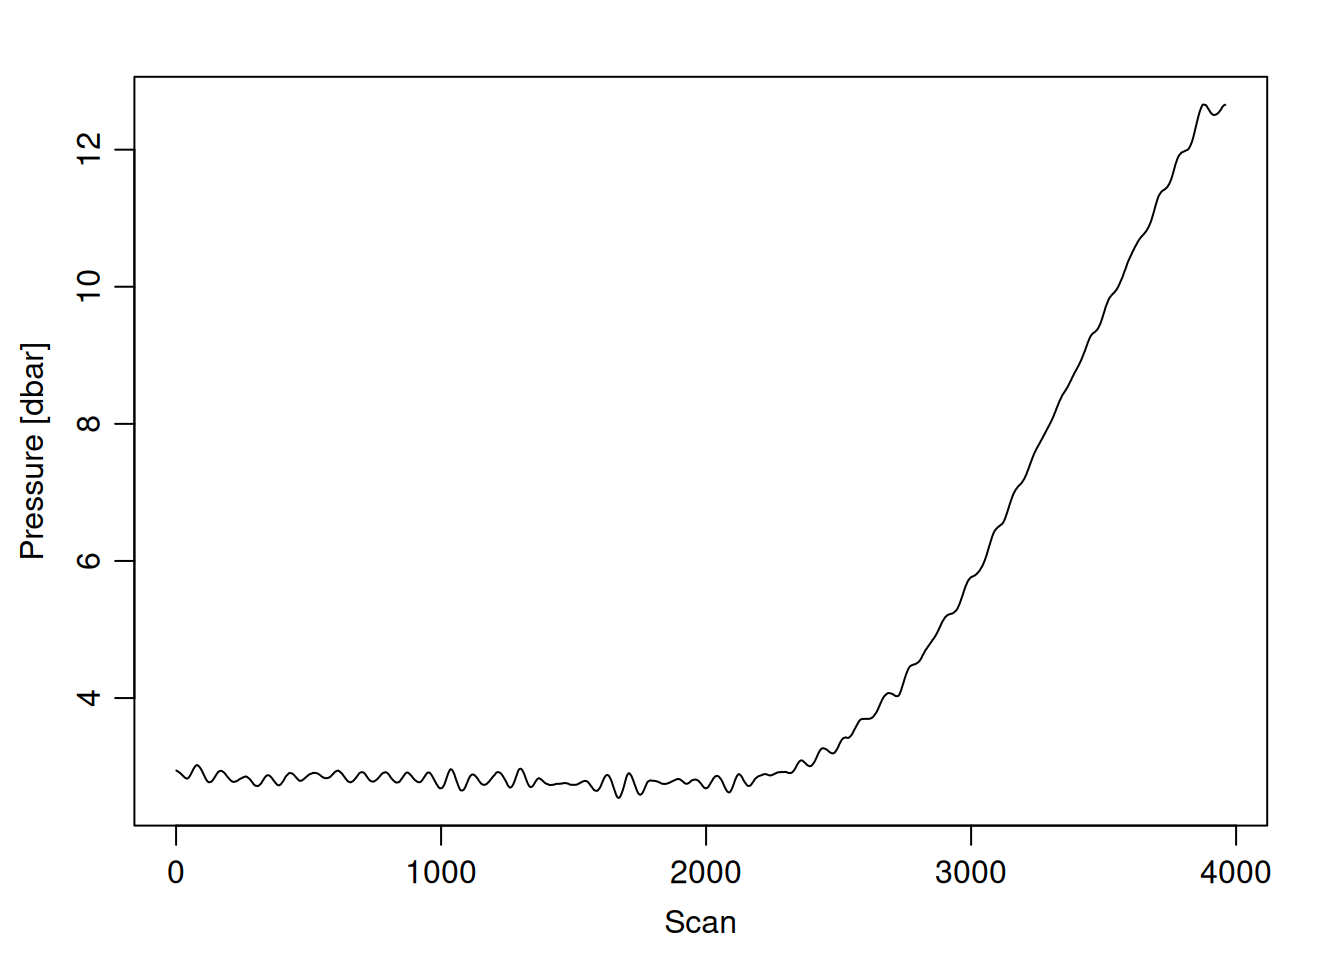
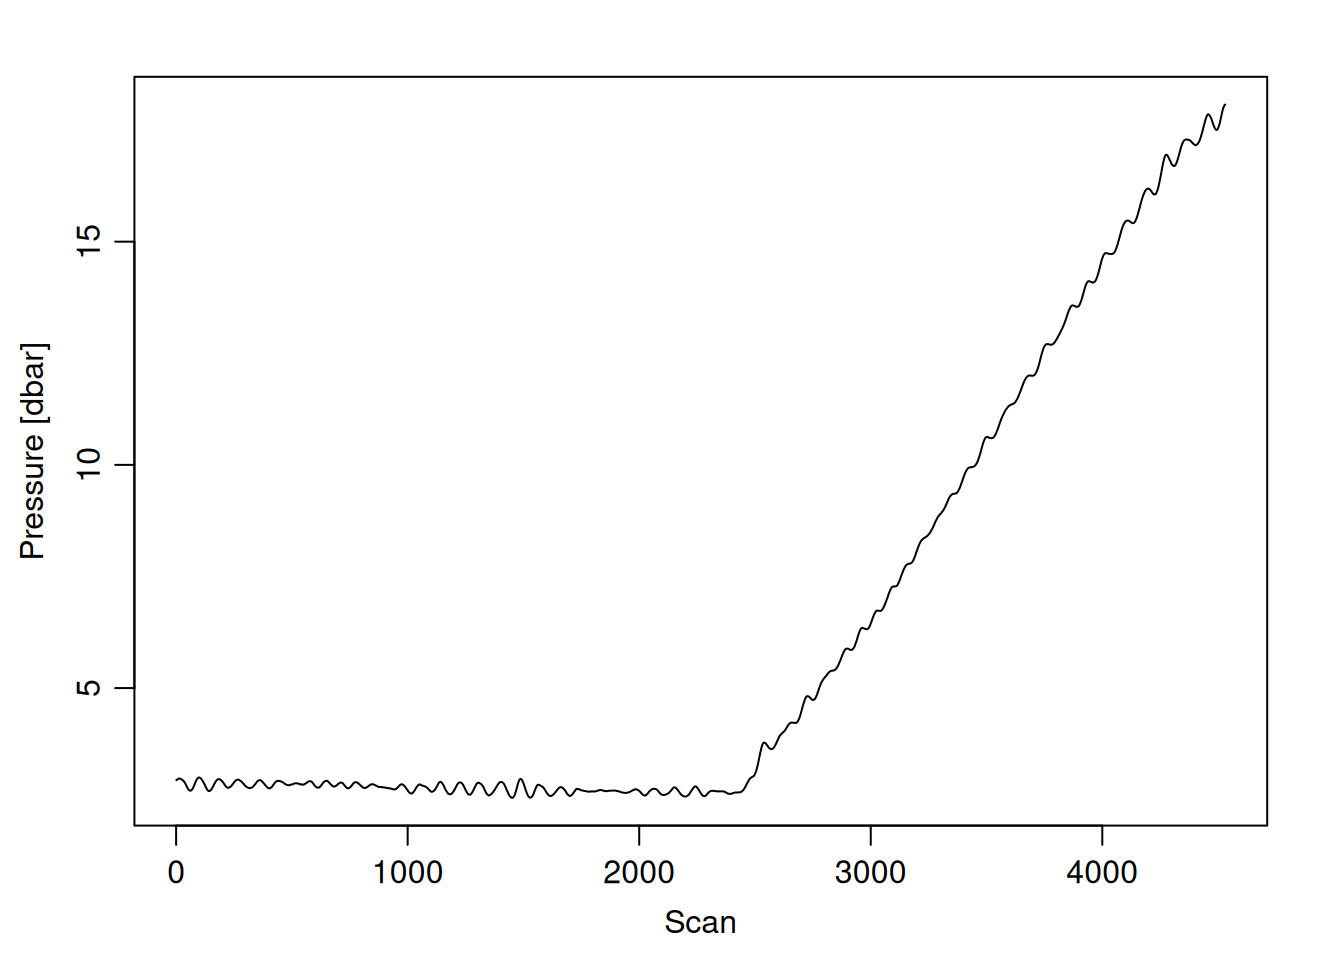
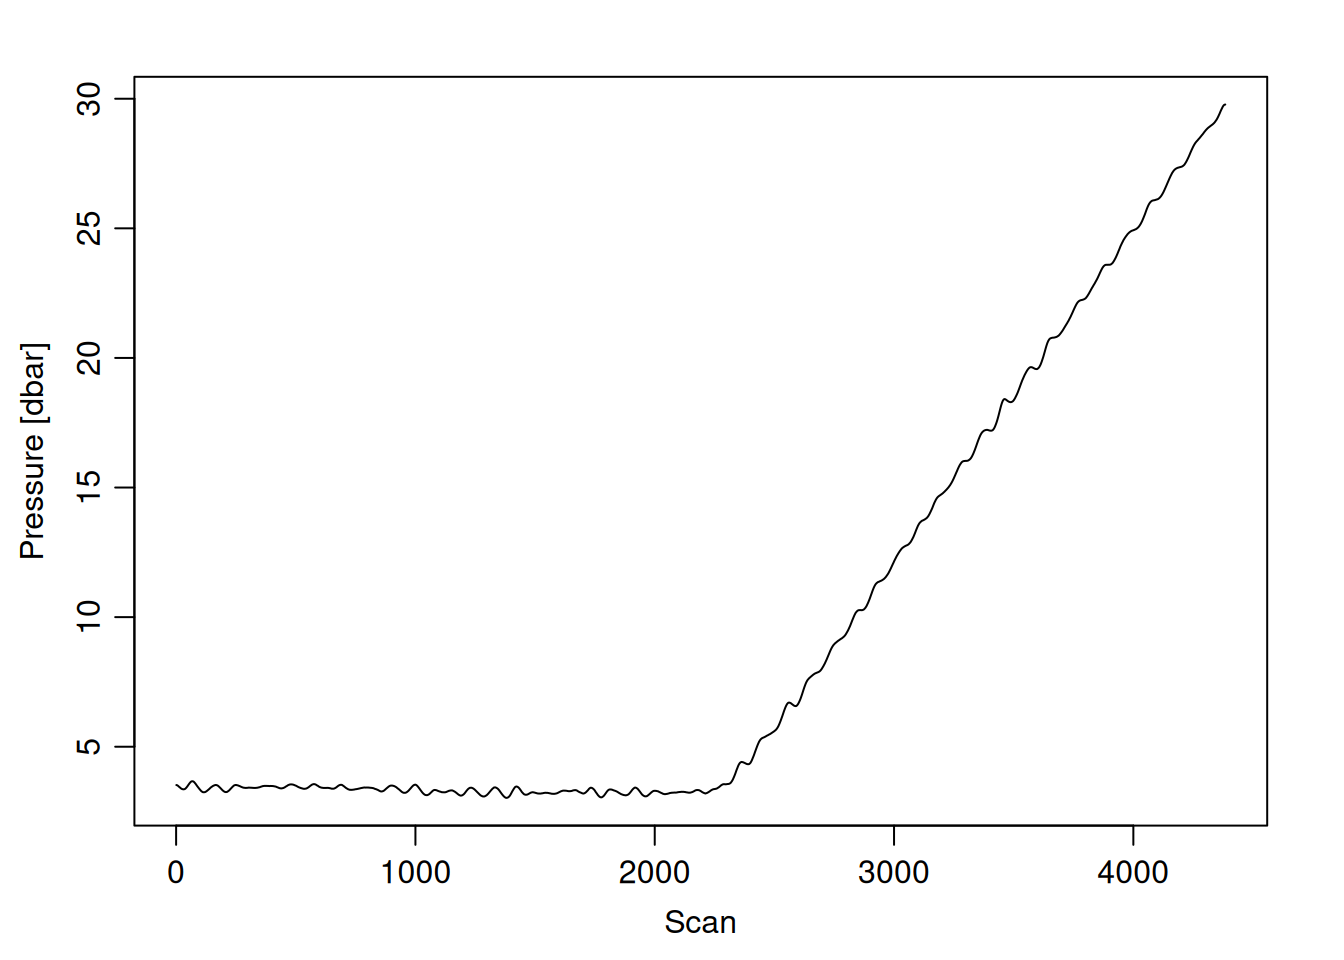
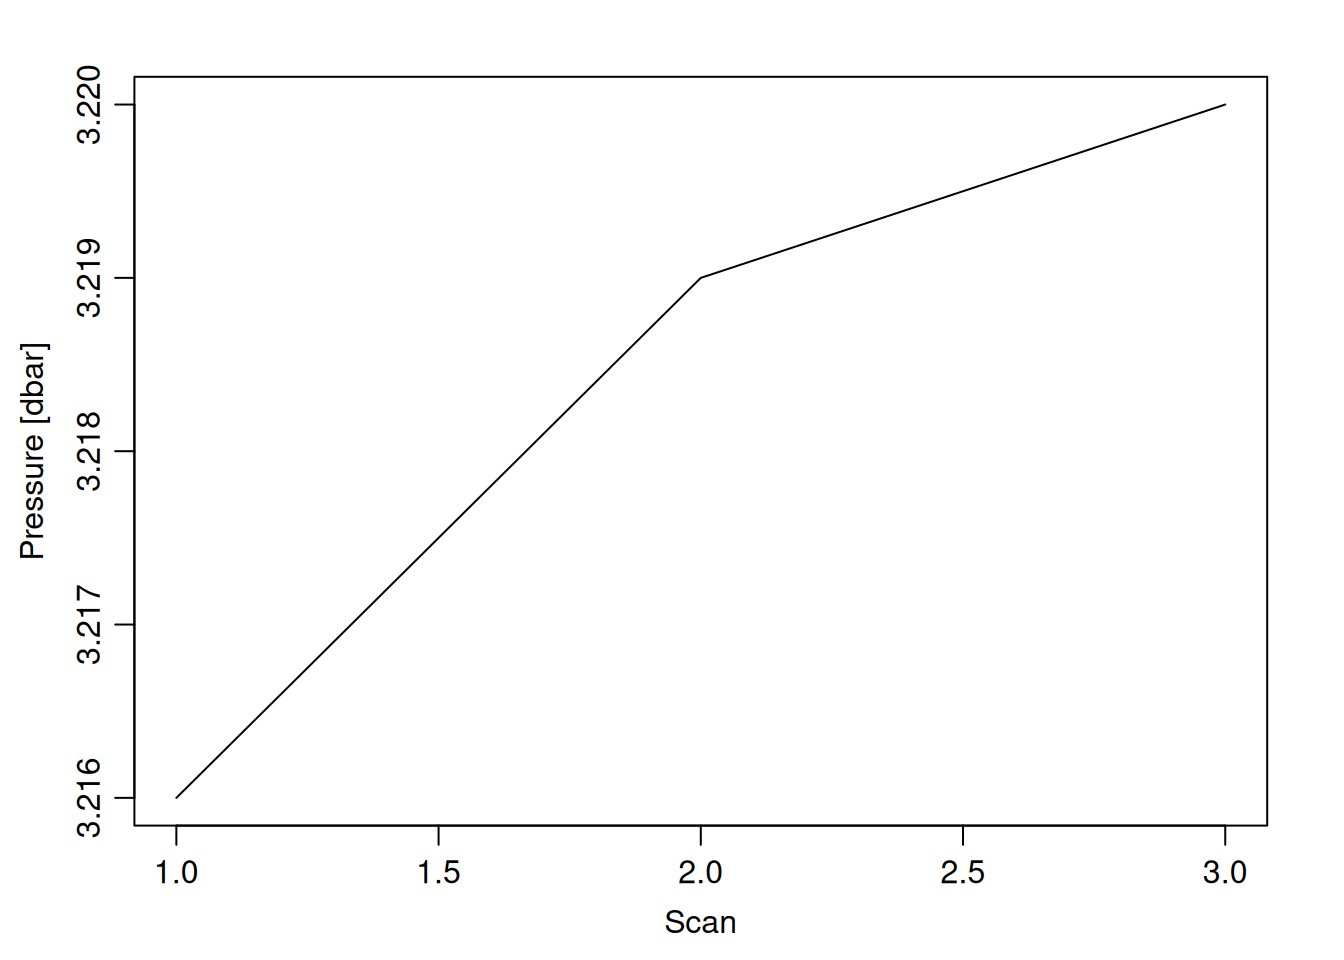
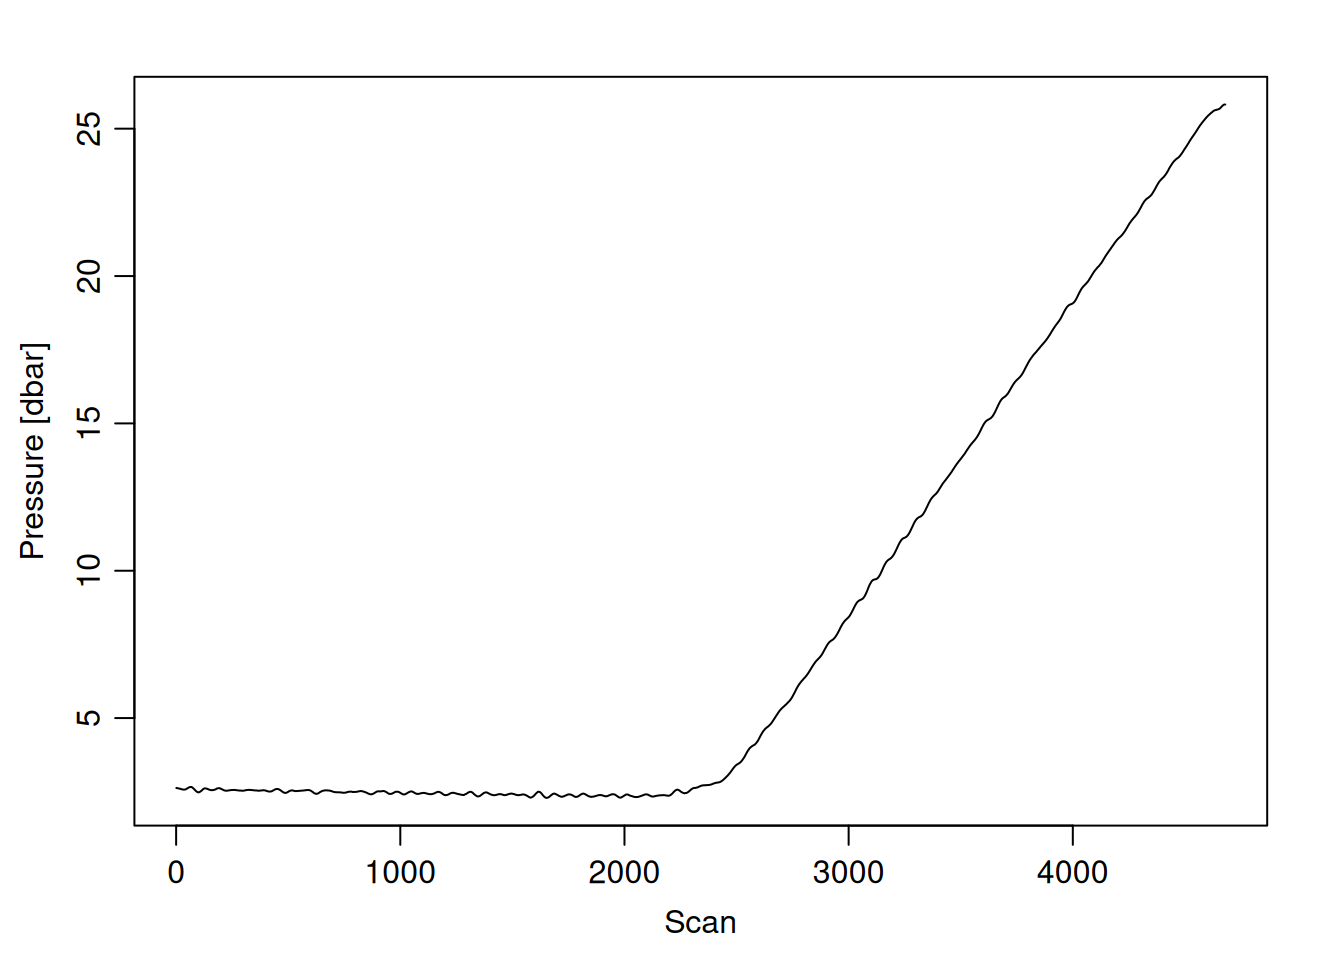
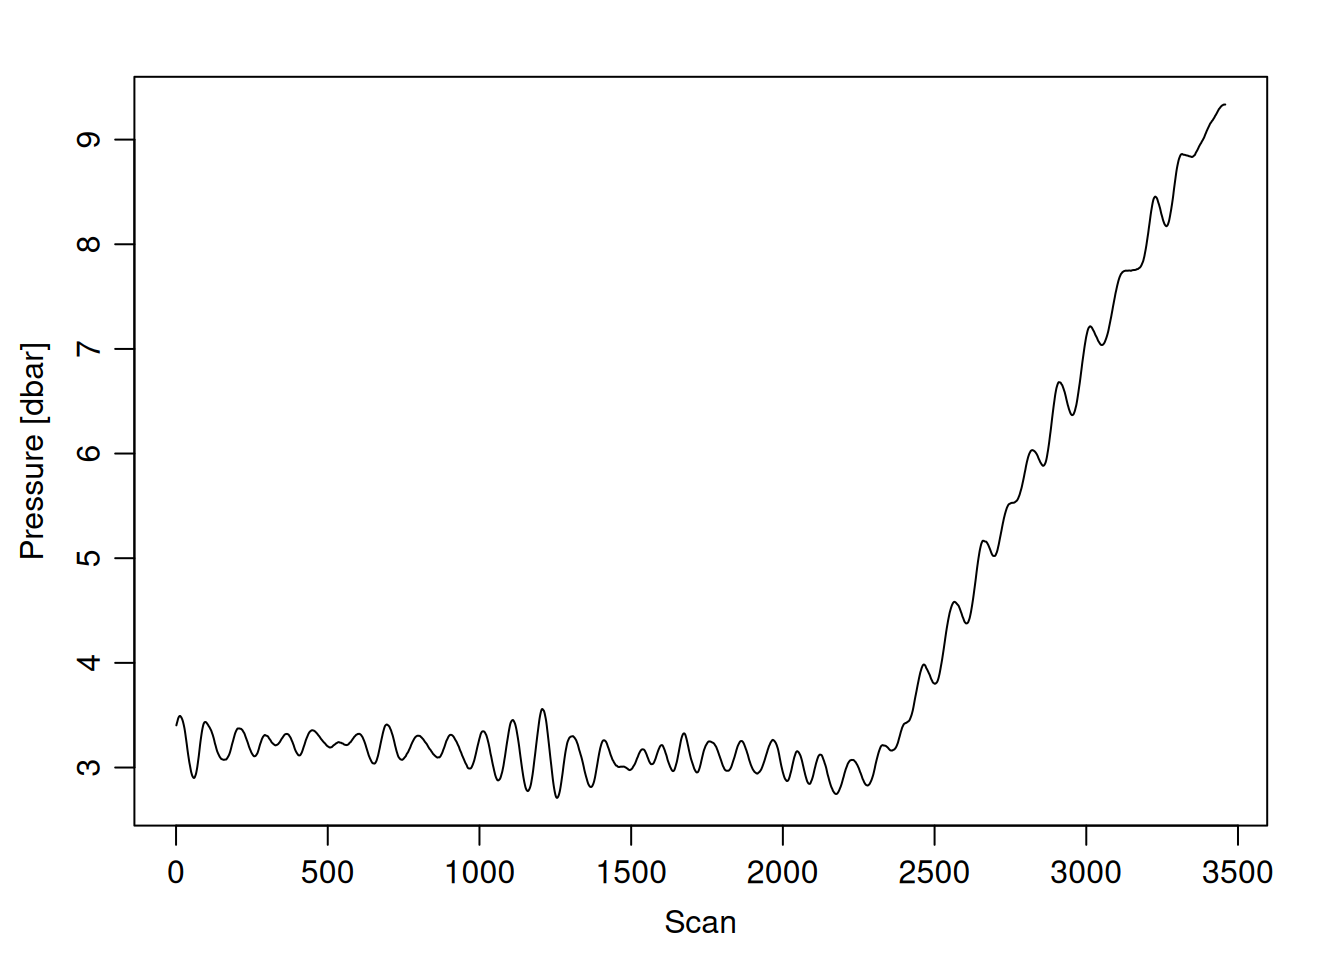
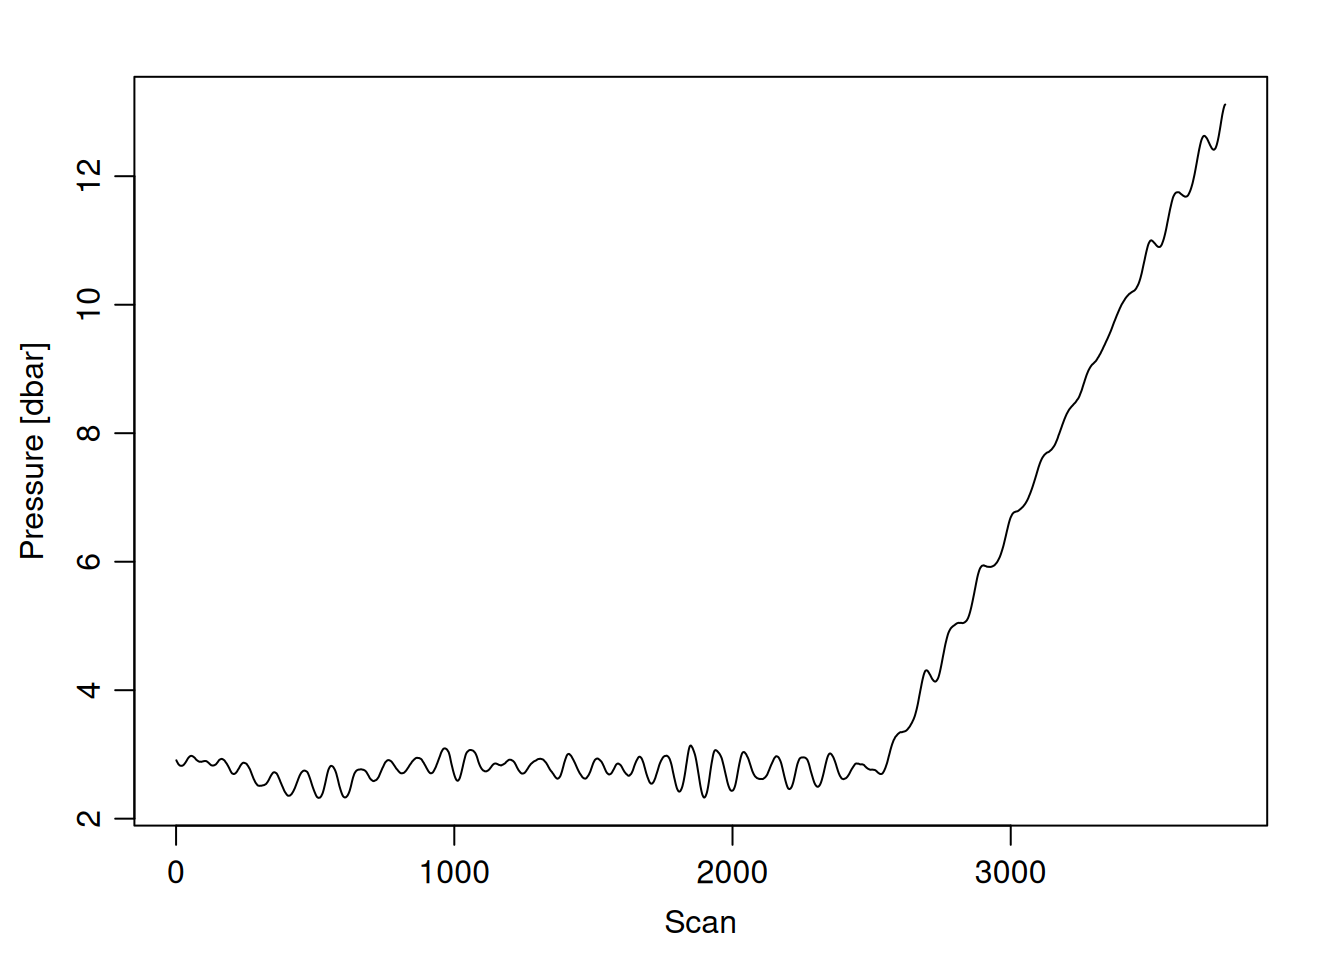
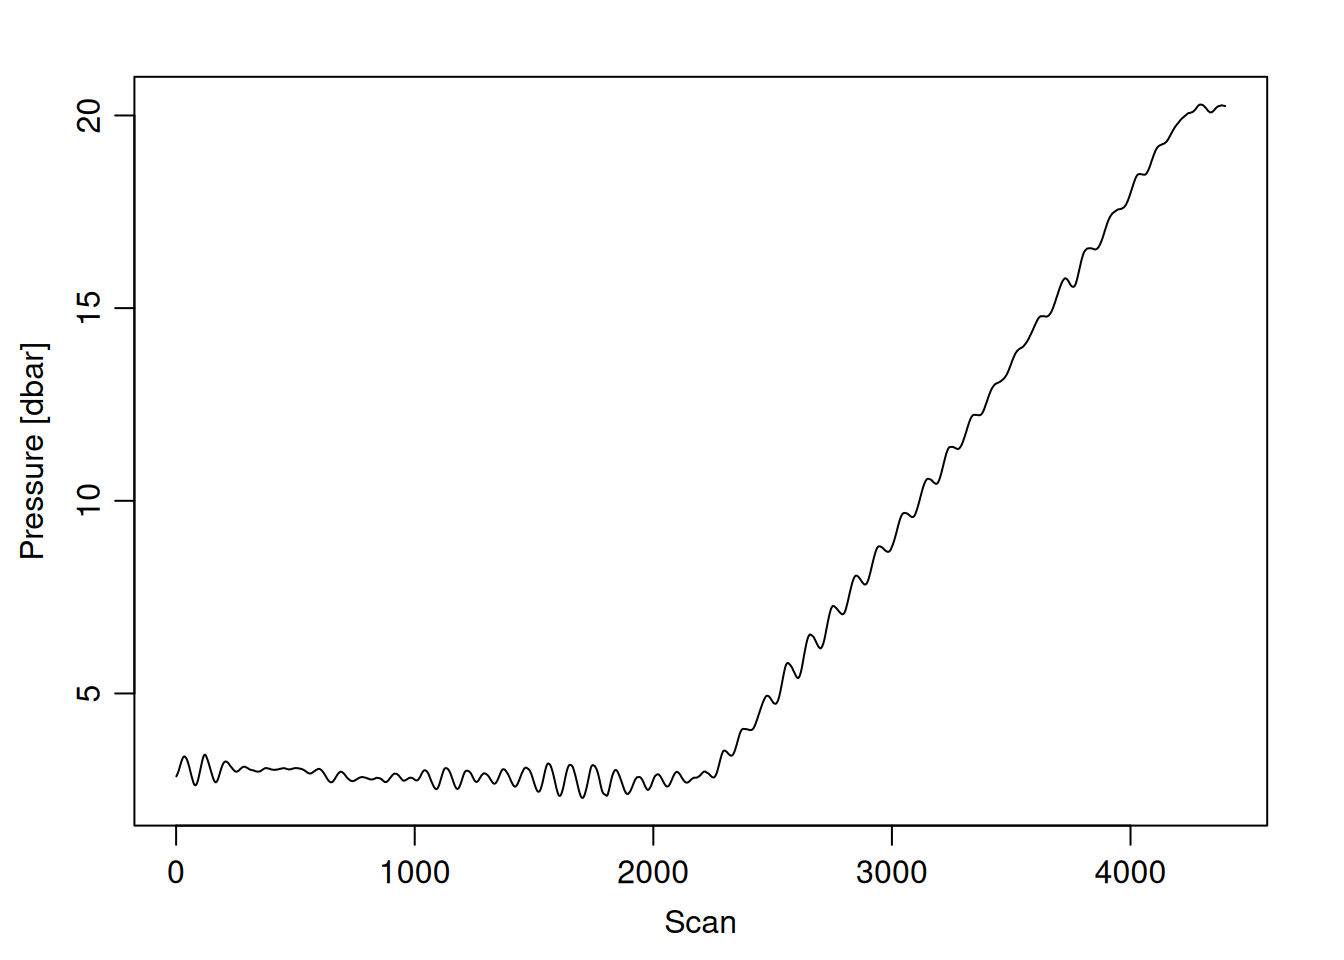
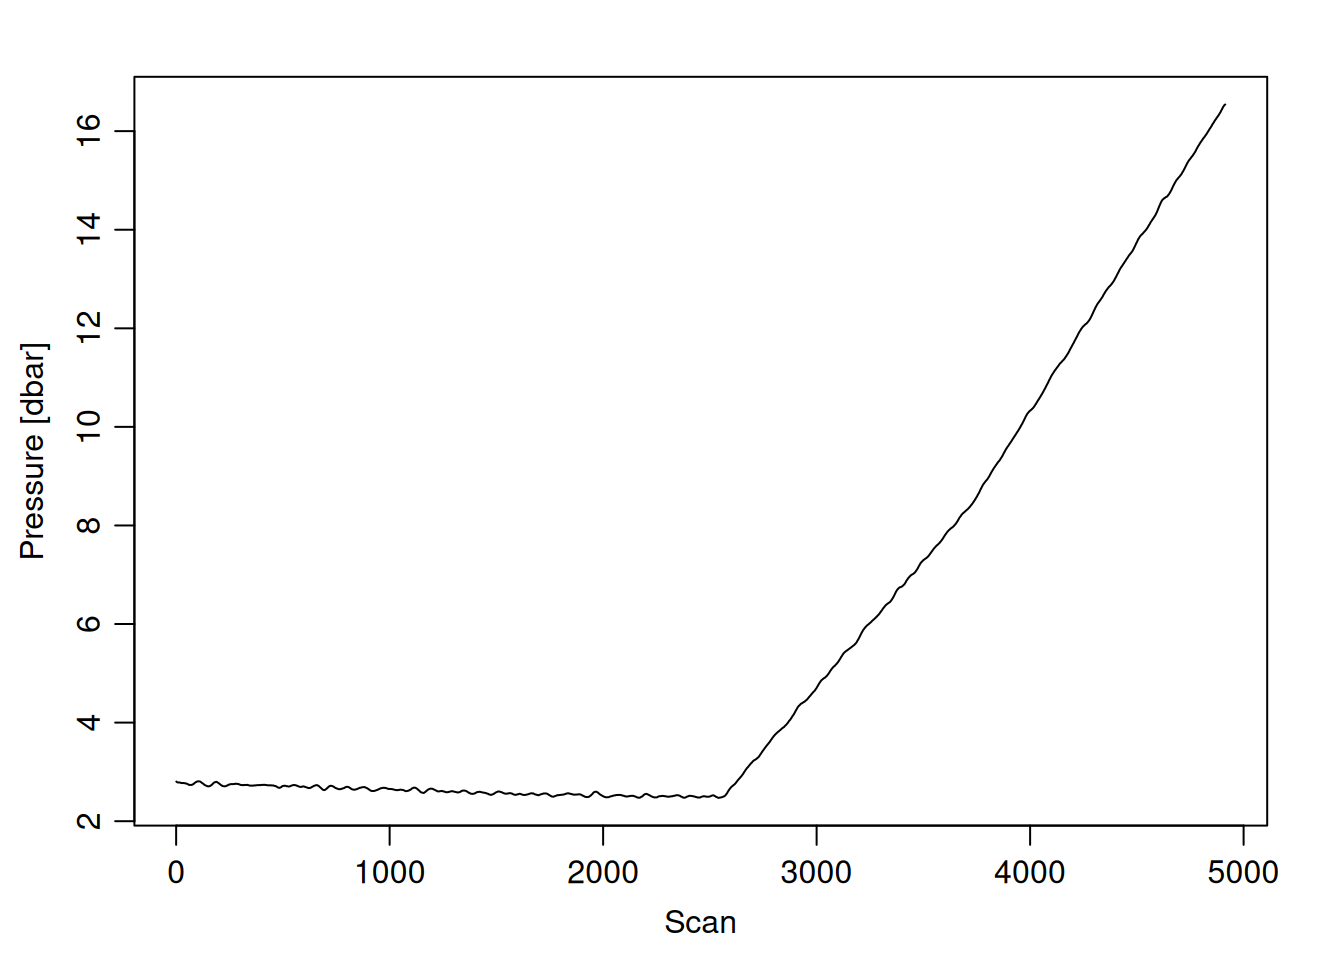
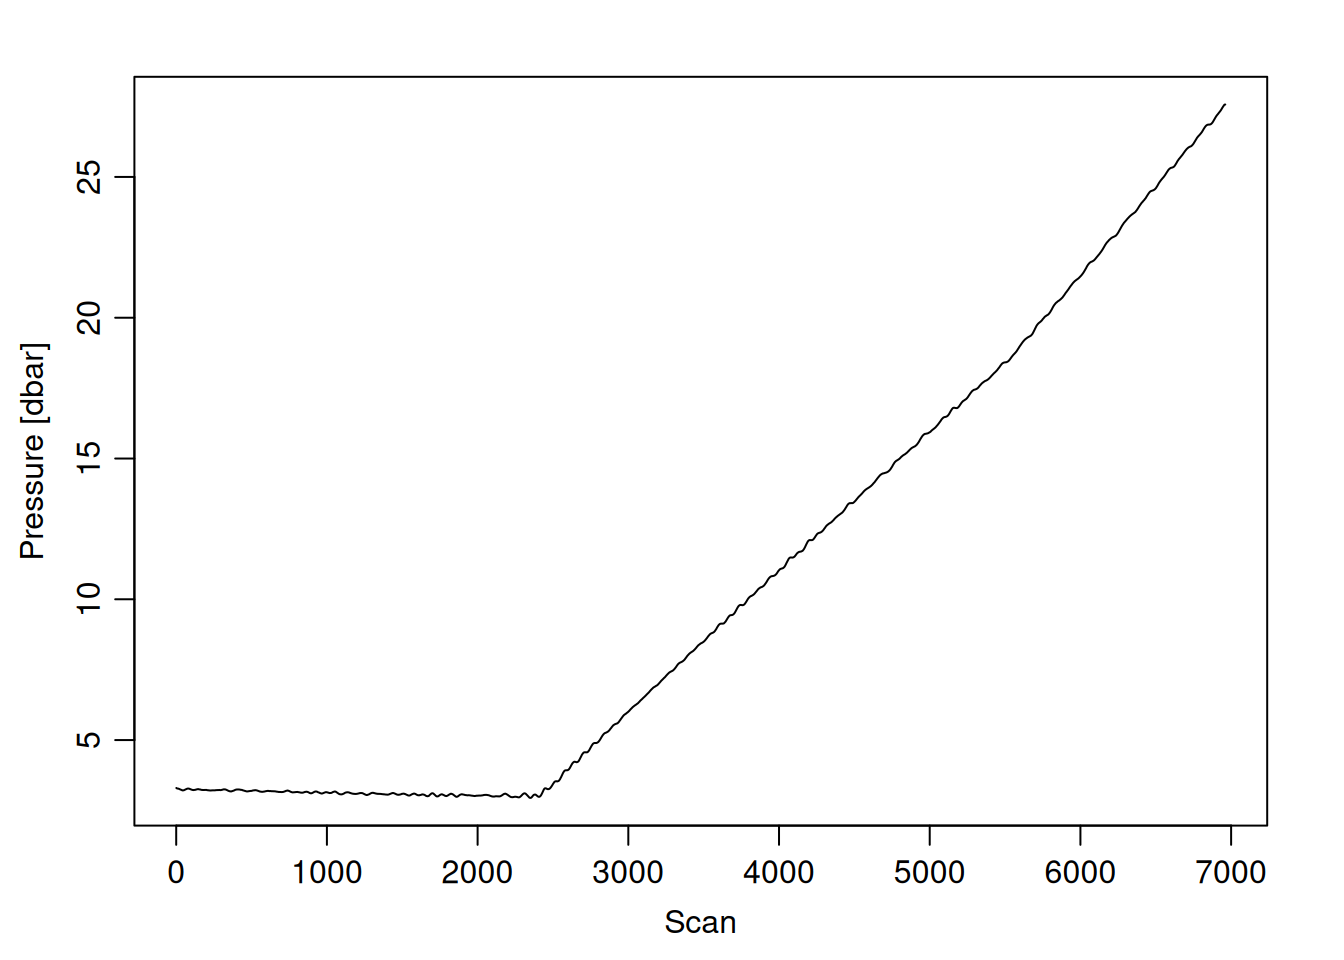
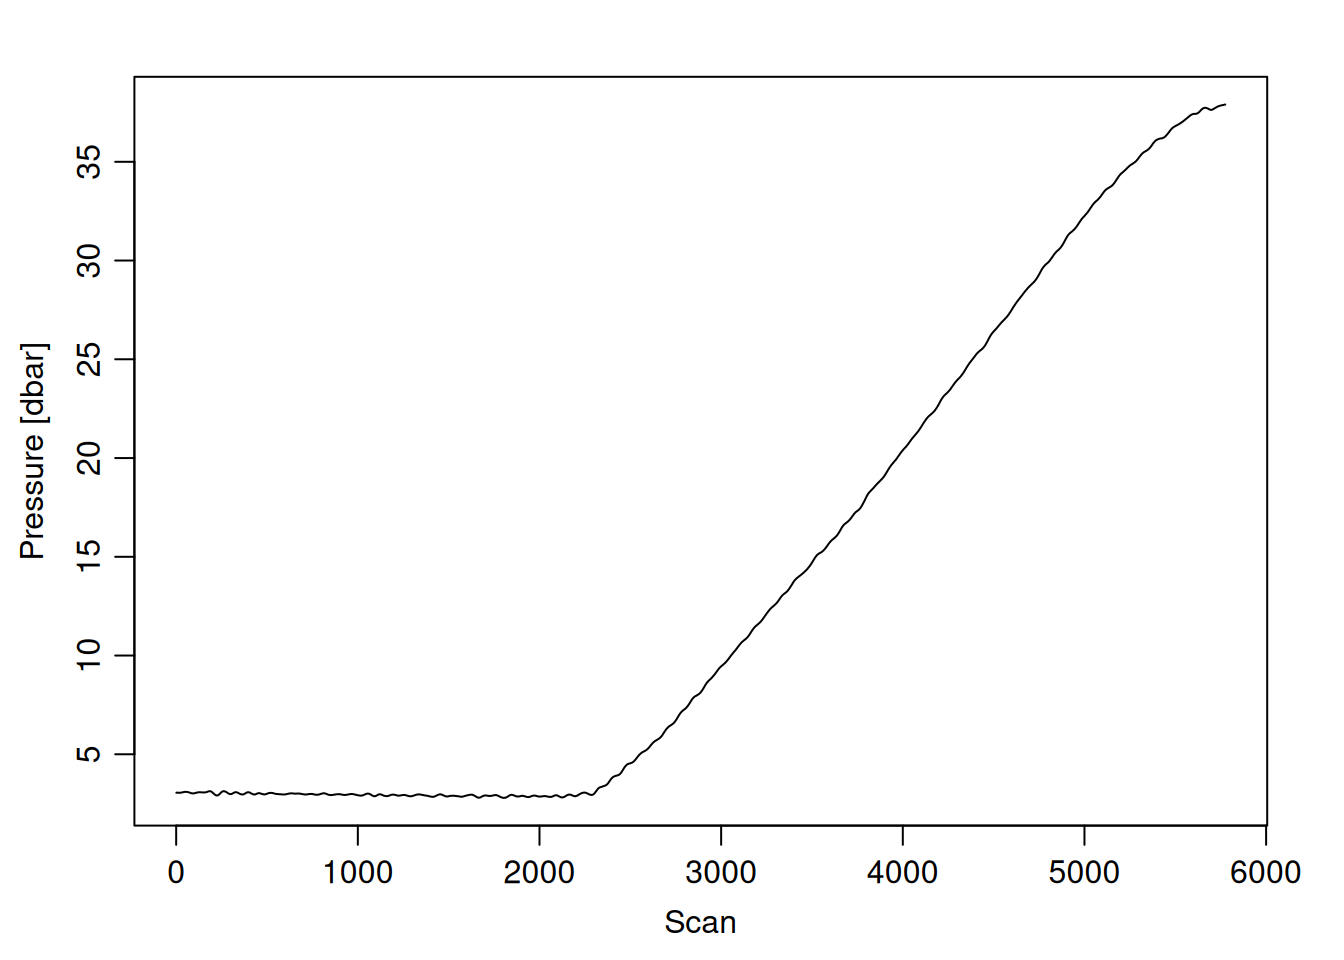
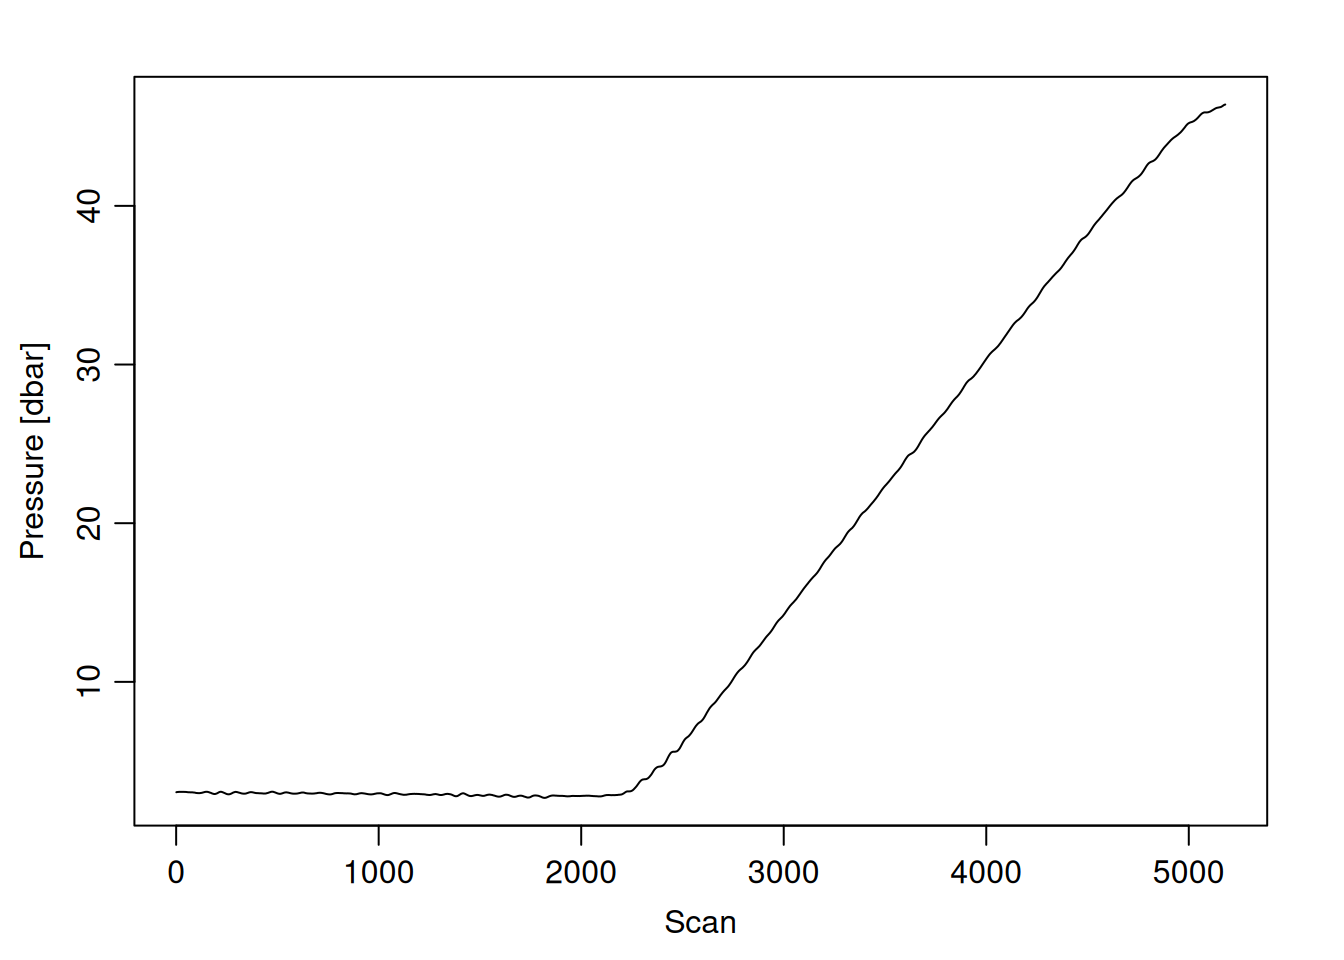
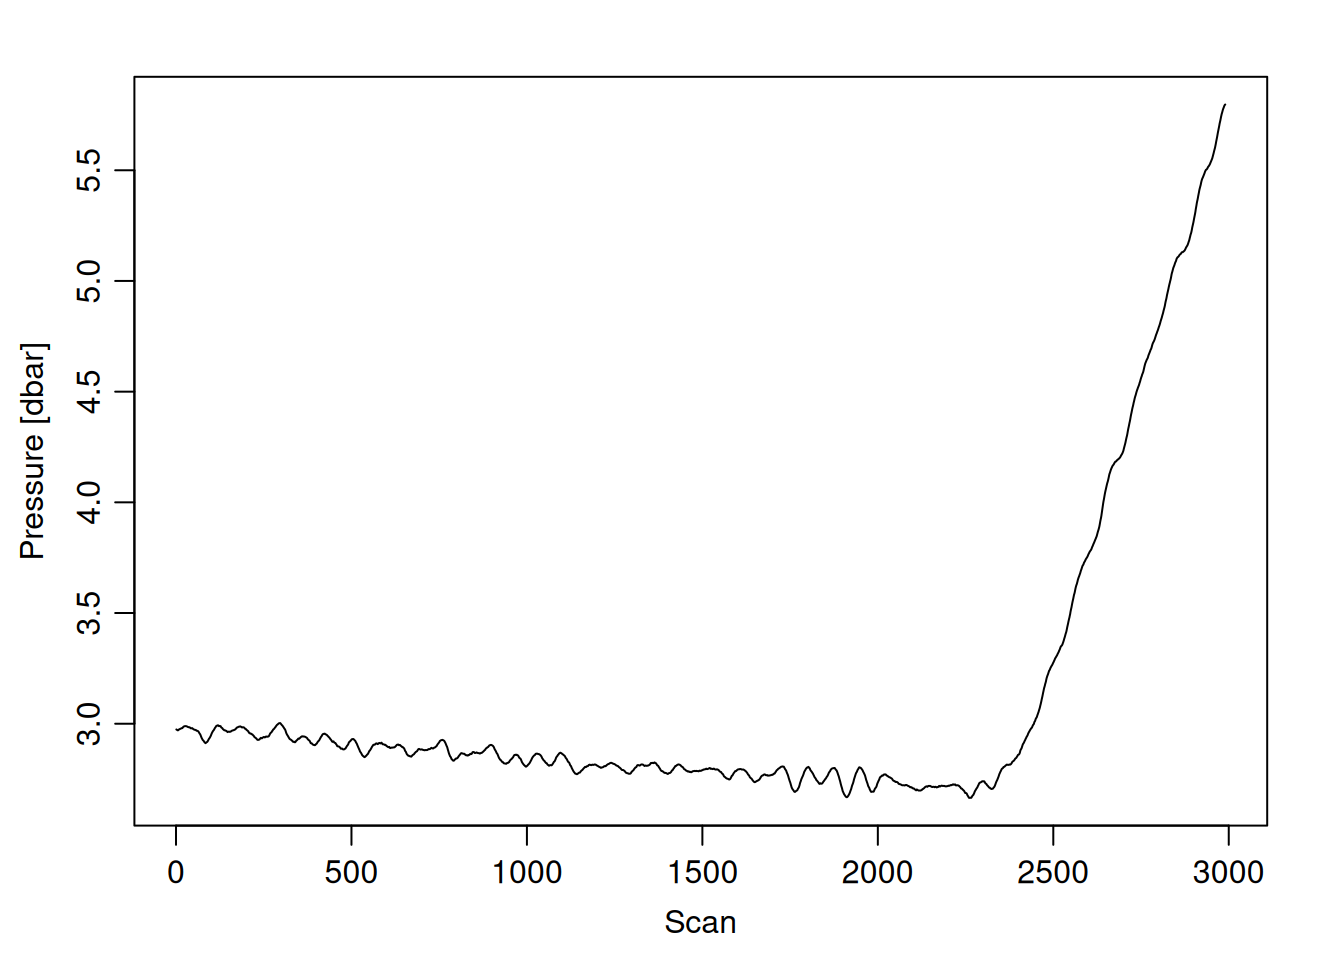
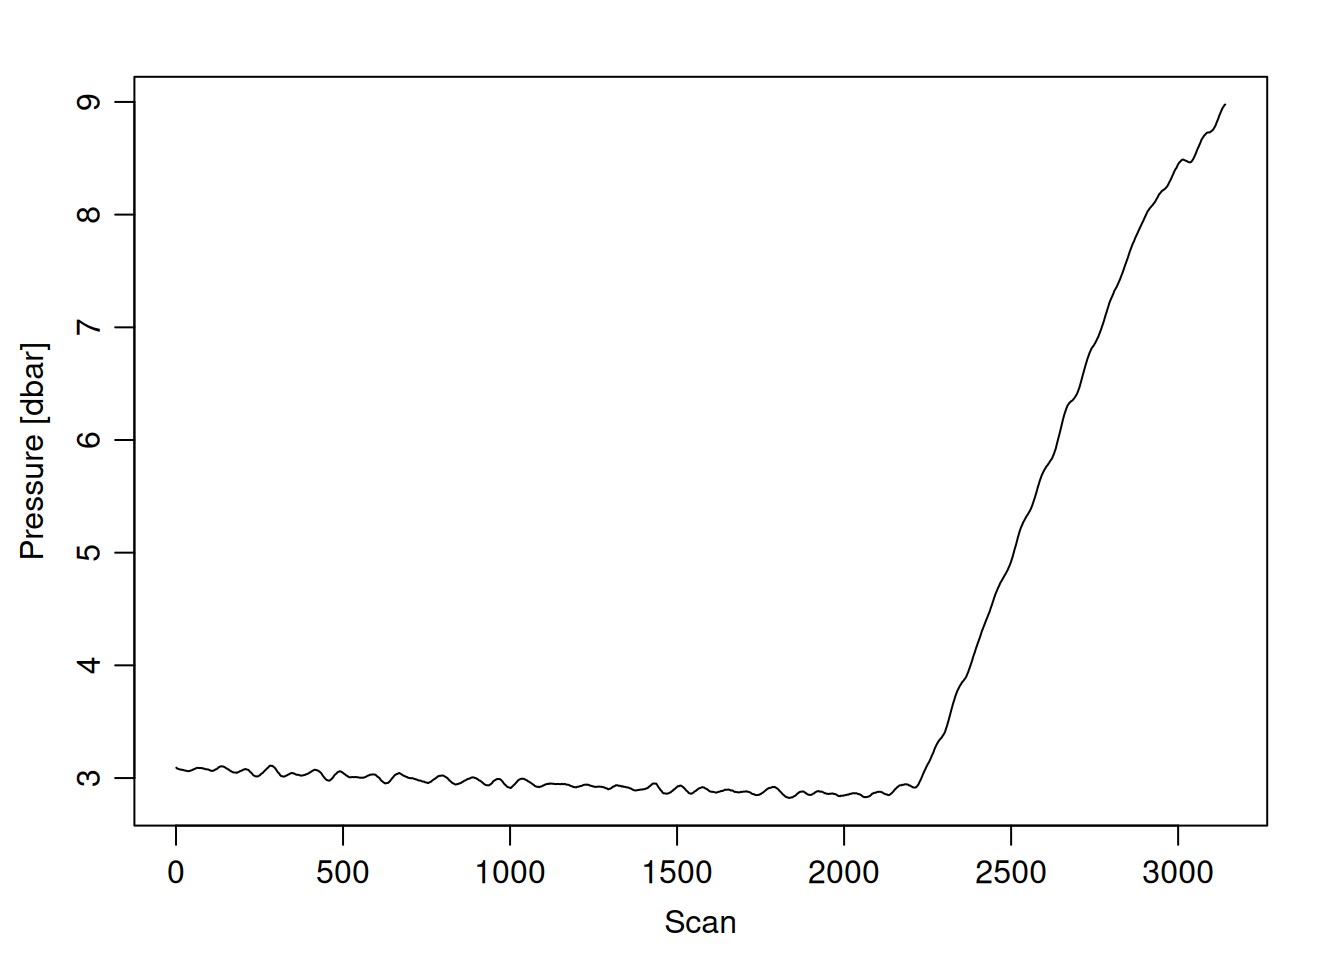
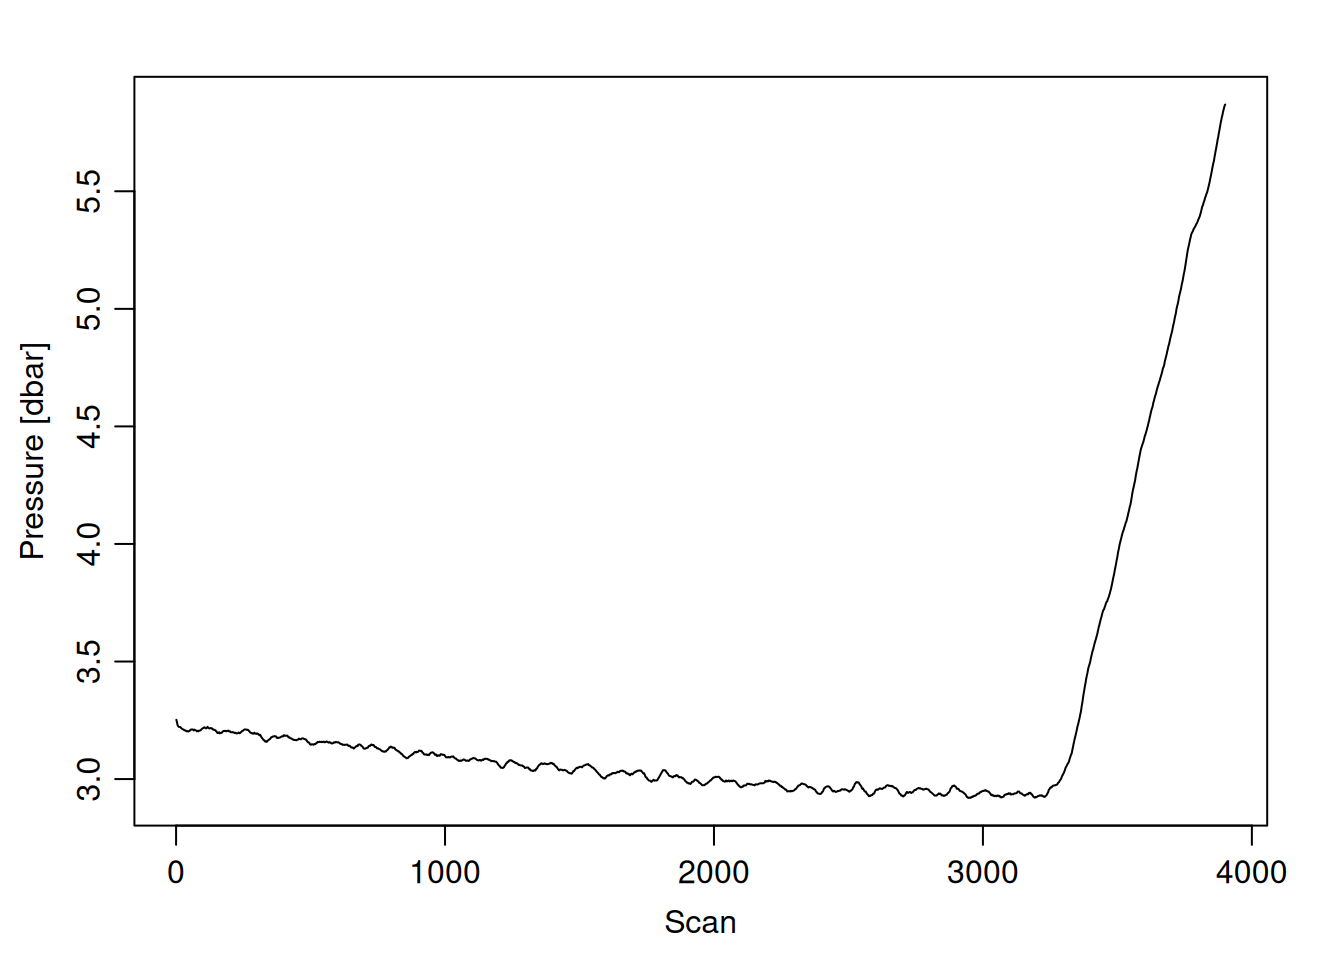
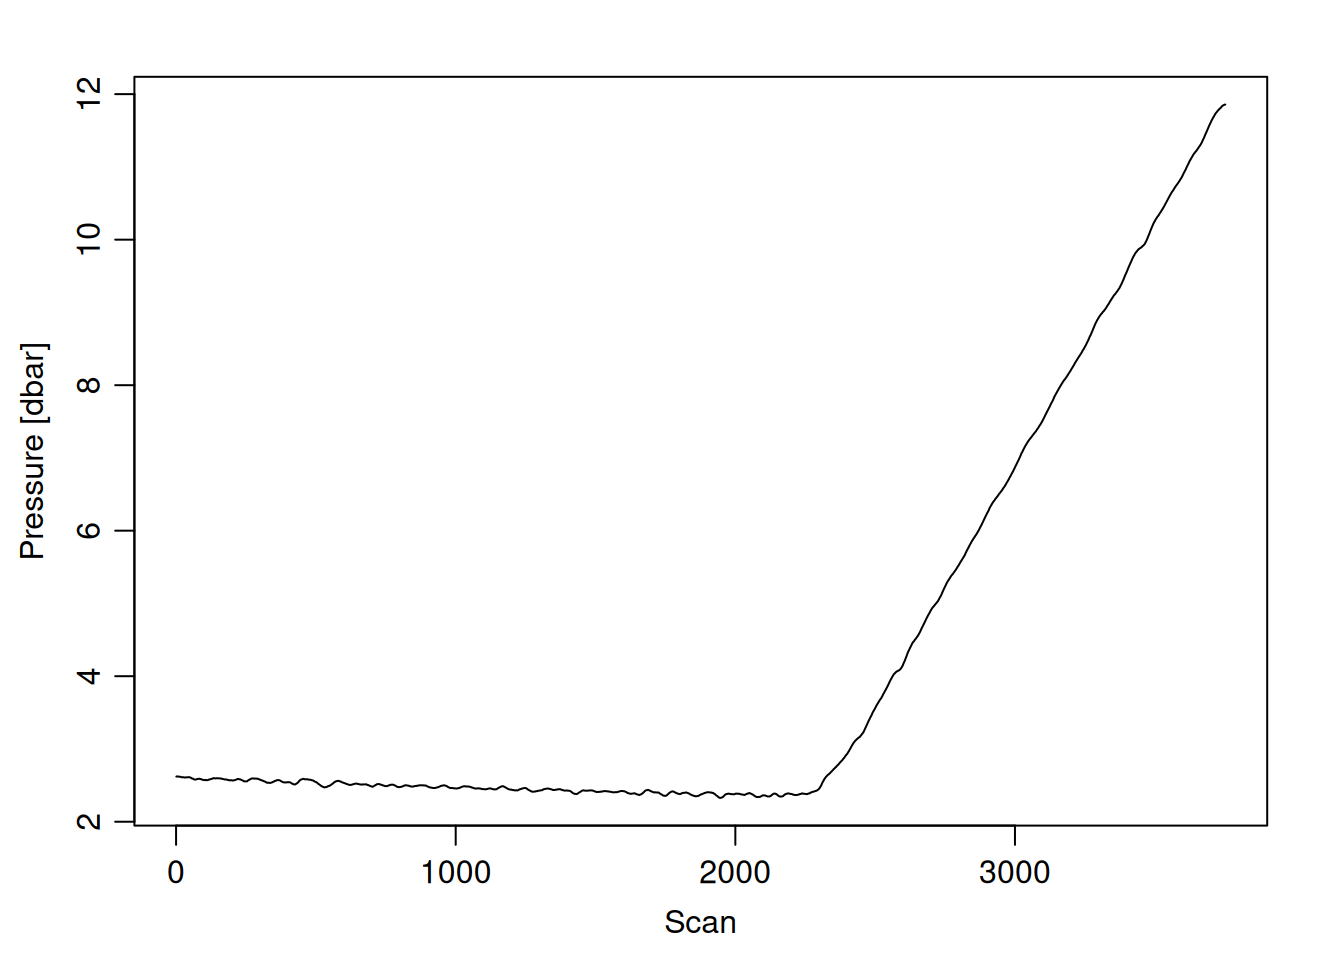
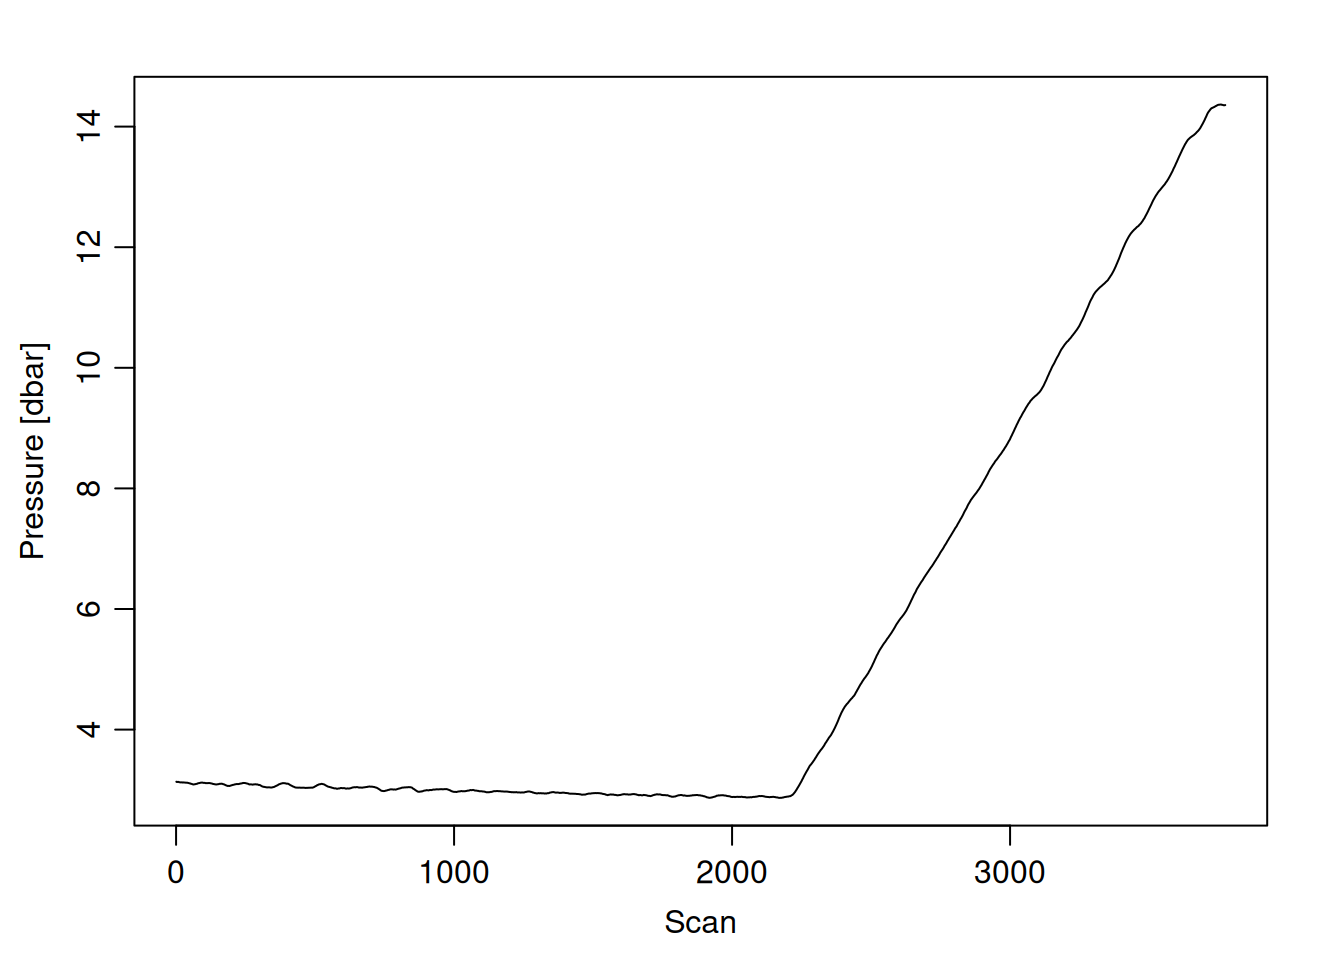
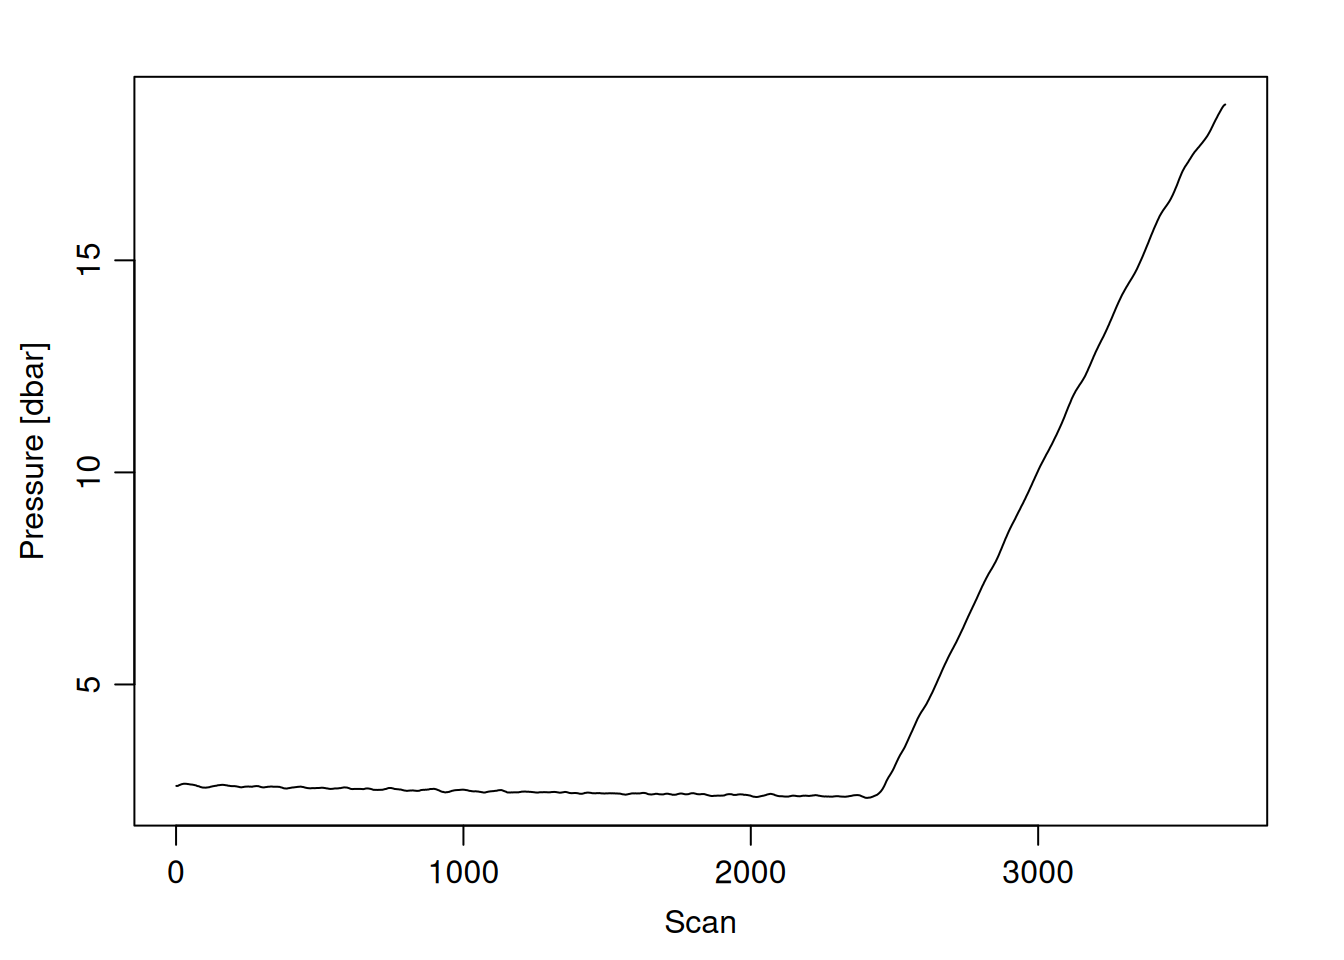
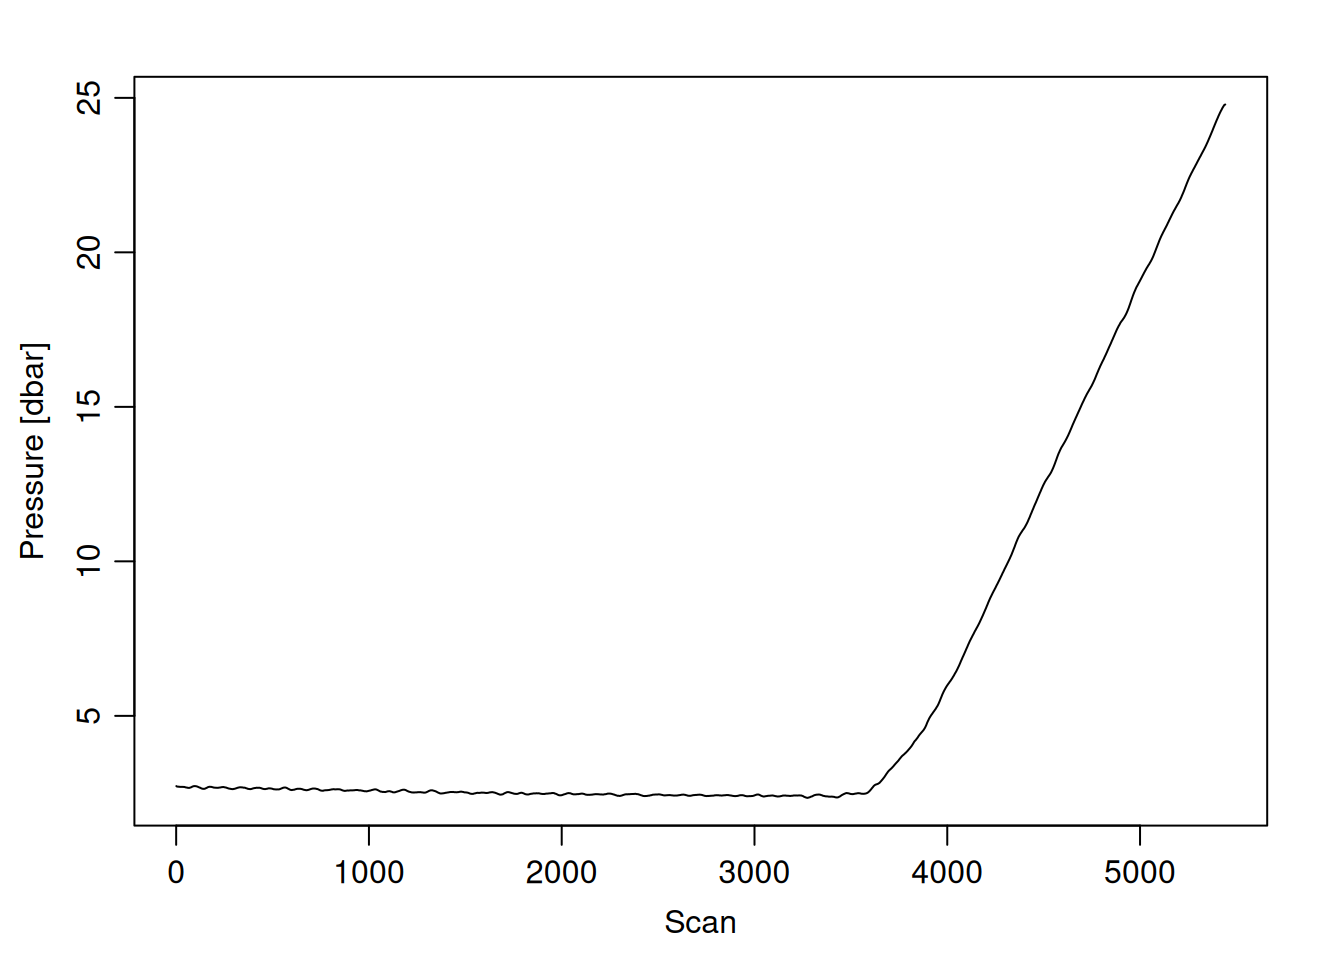
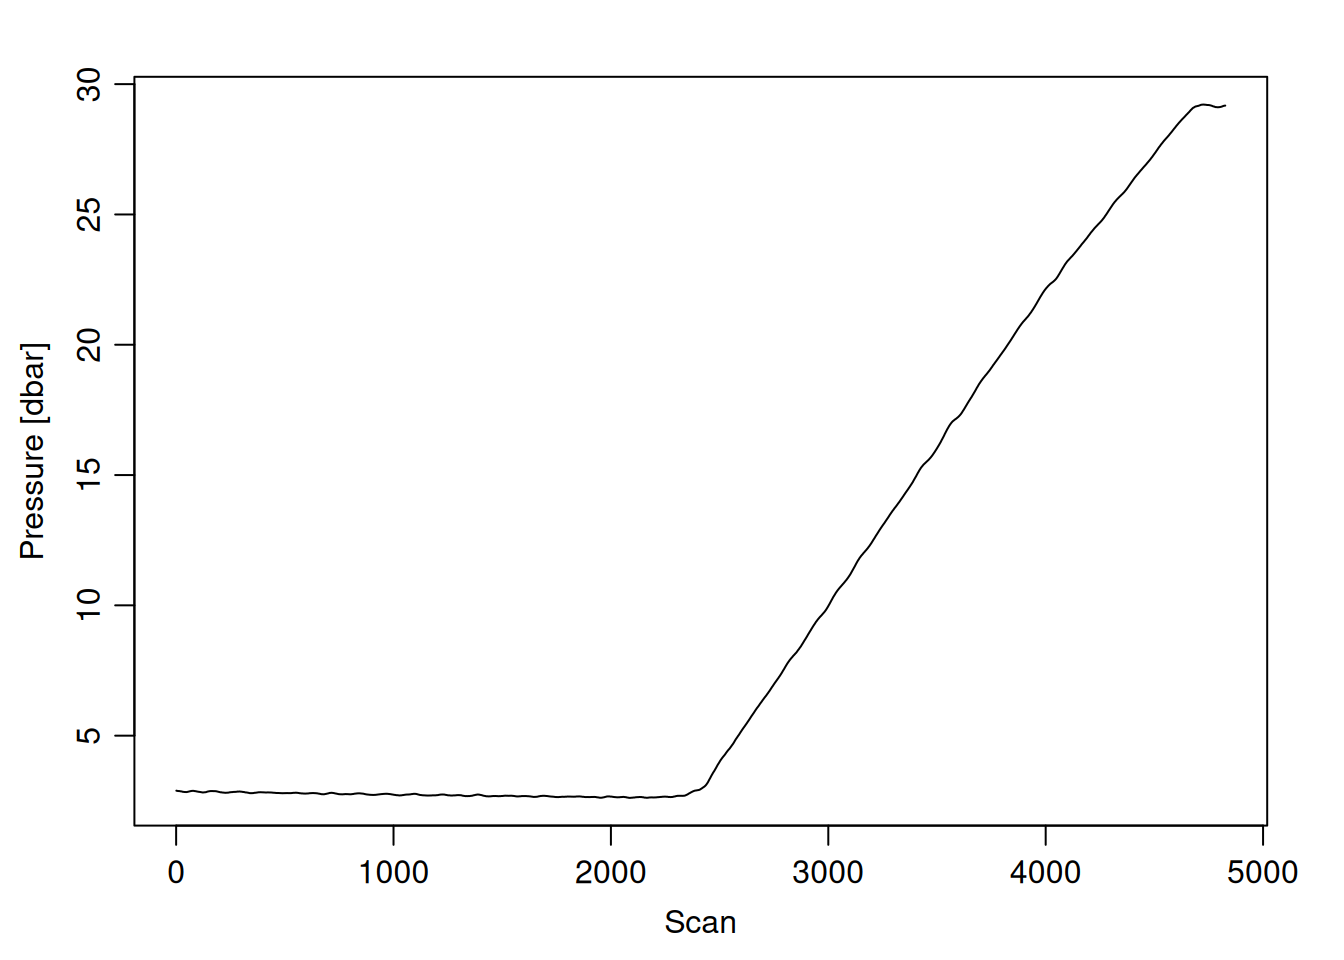
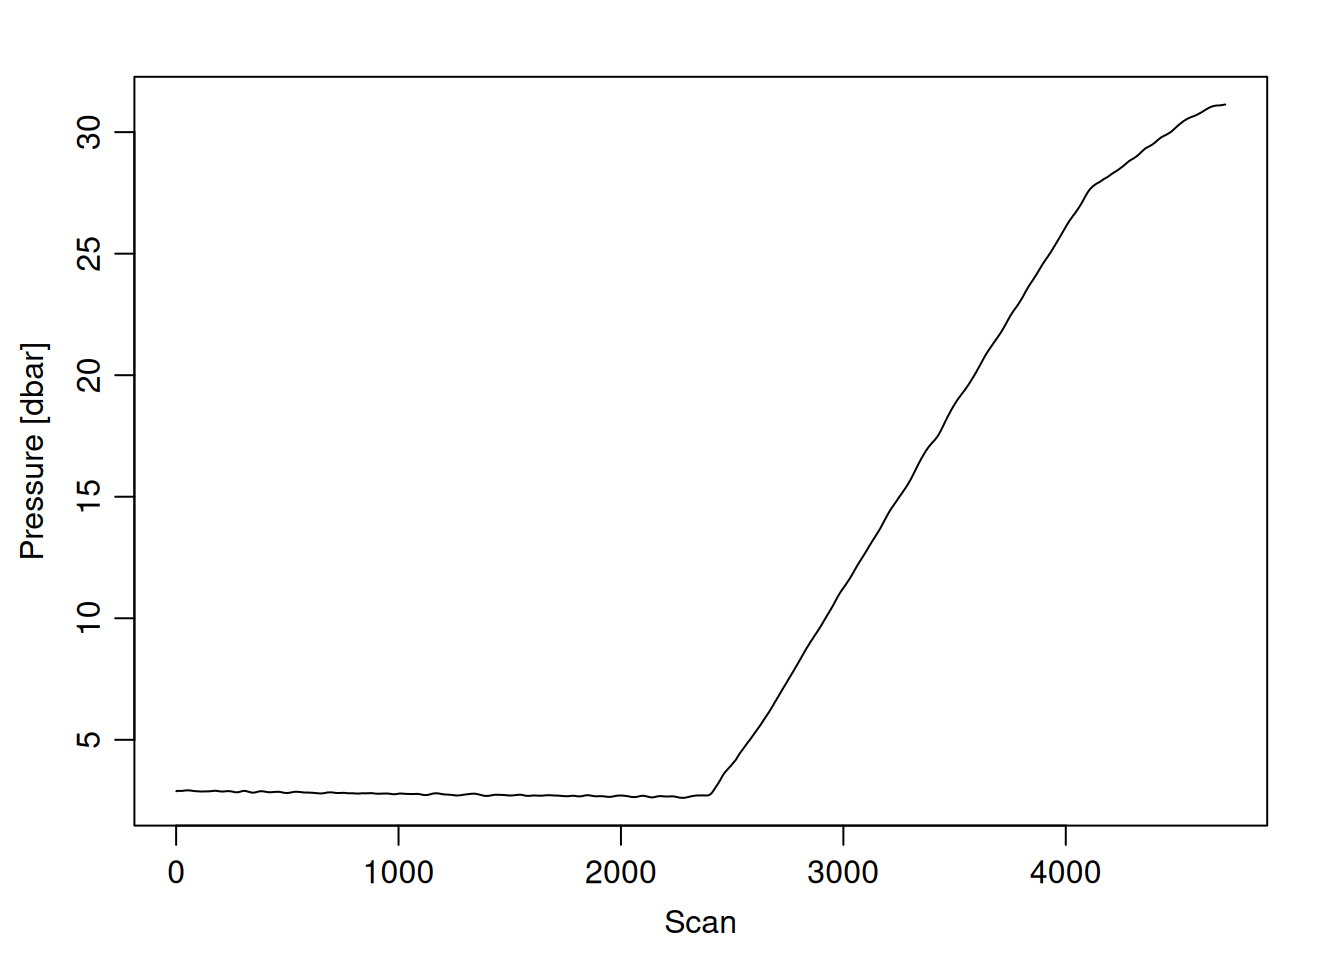
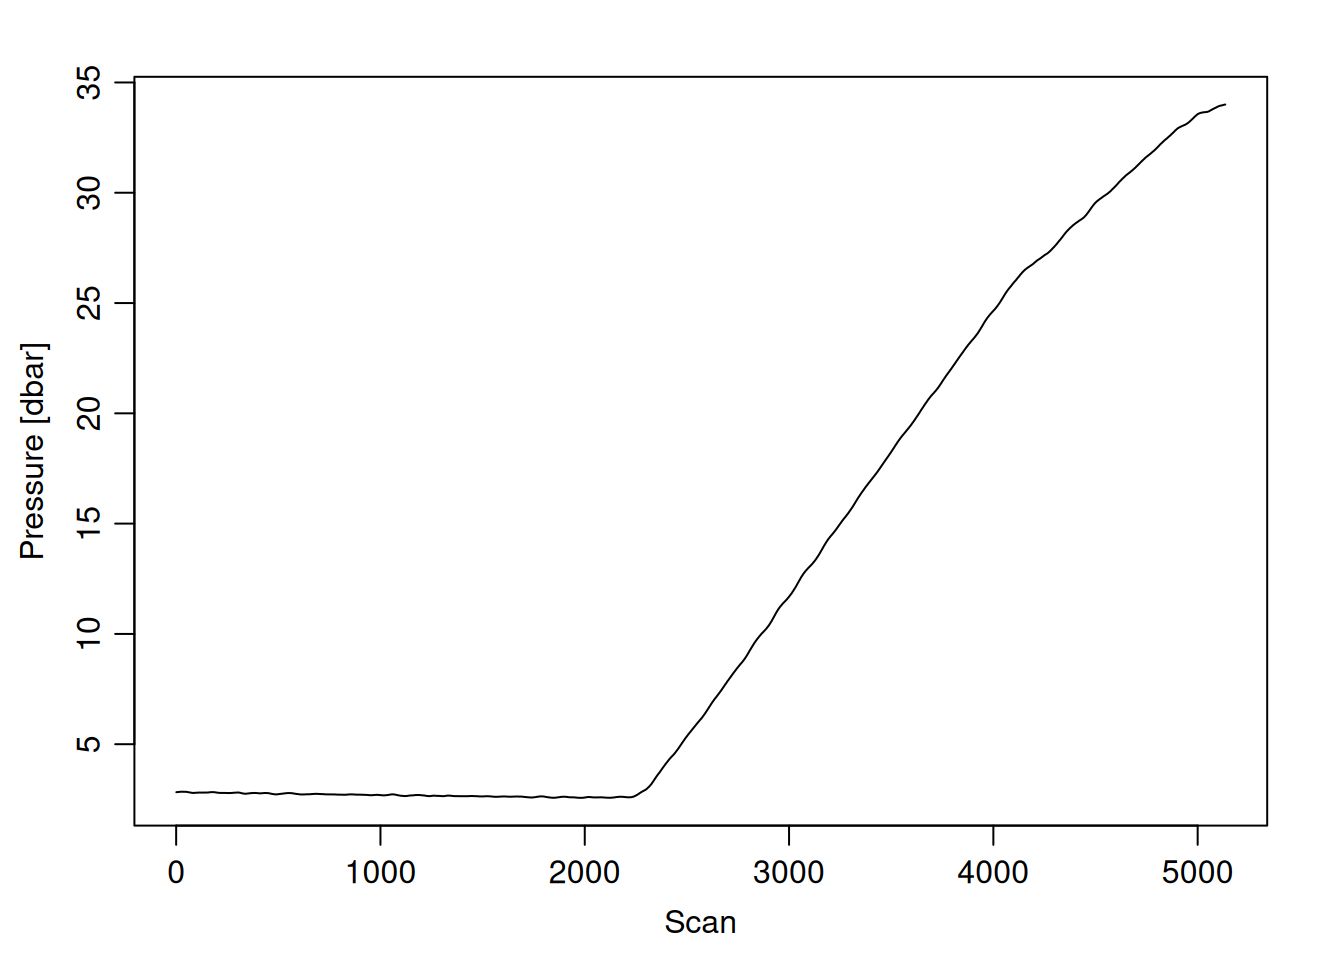
for (i inseq(ctd_FK)){ cast <- ctd_FK[[i]] # 1 is selecting only the first sublist# print(i)print(glue("=== station: {cast@metadata$station[1]}"))print(glue("# scans: {length(cast@data$scan)}"))plotScan(cast)}
=== station: .10
# scans: 4
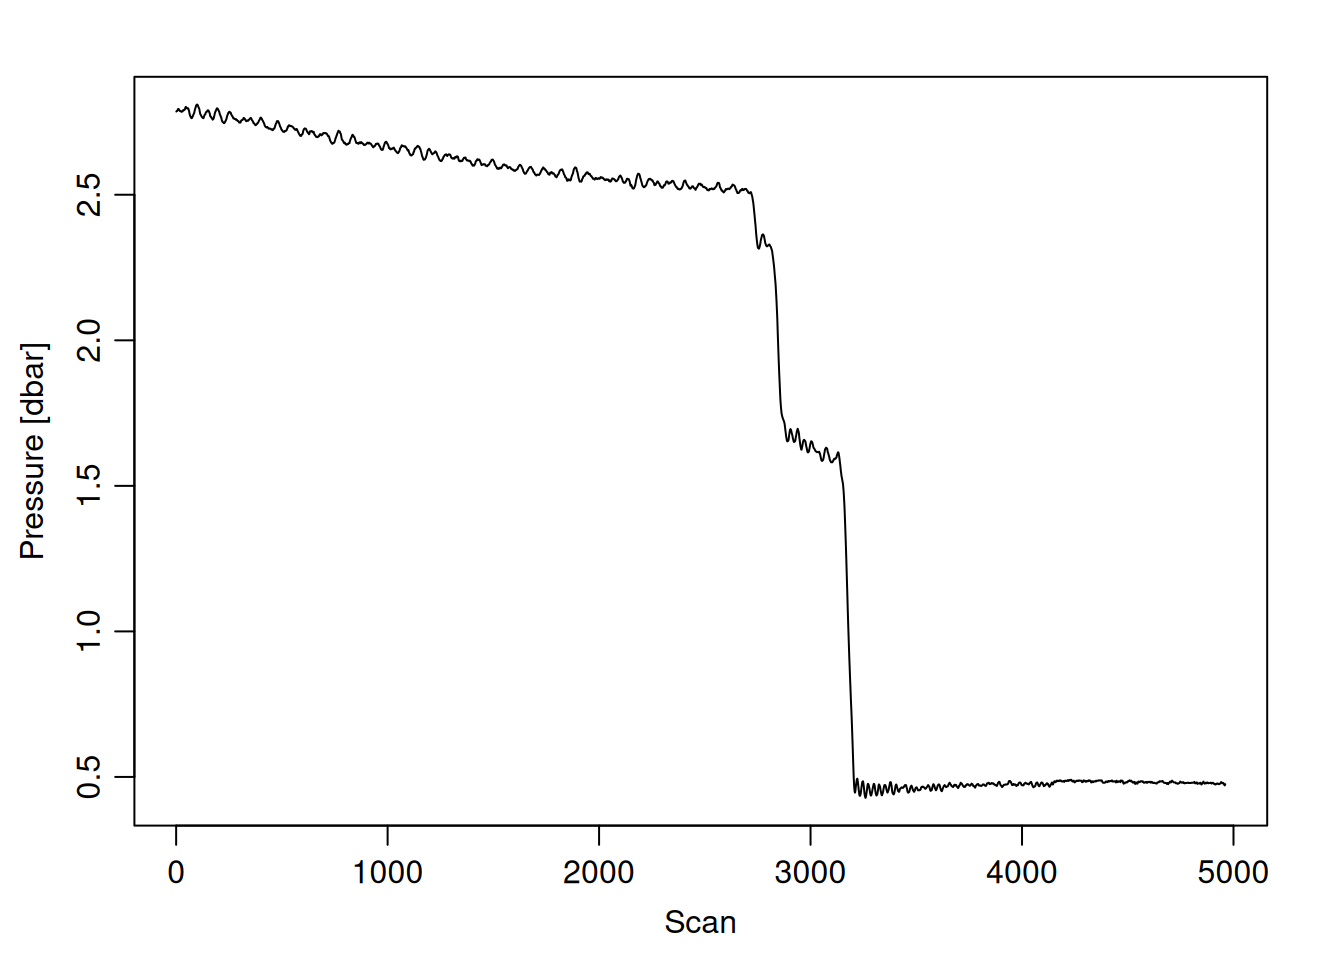
=== station: .12
# scans: 4962
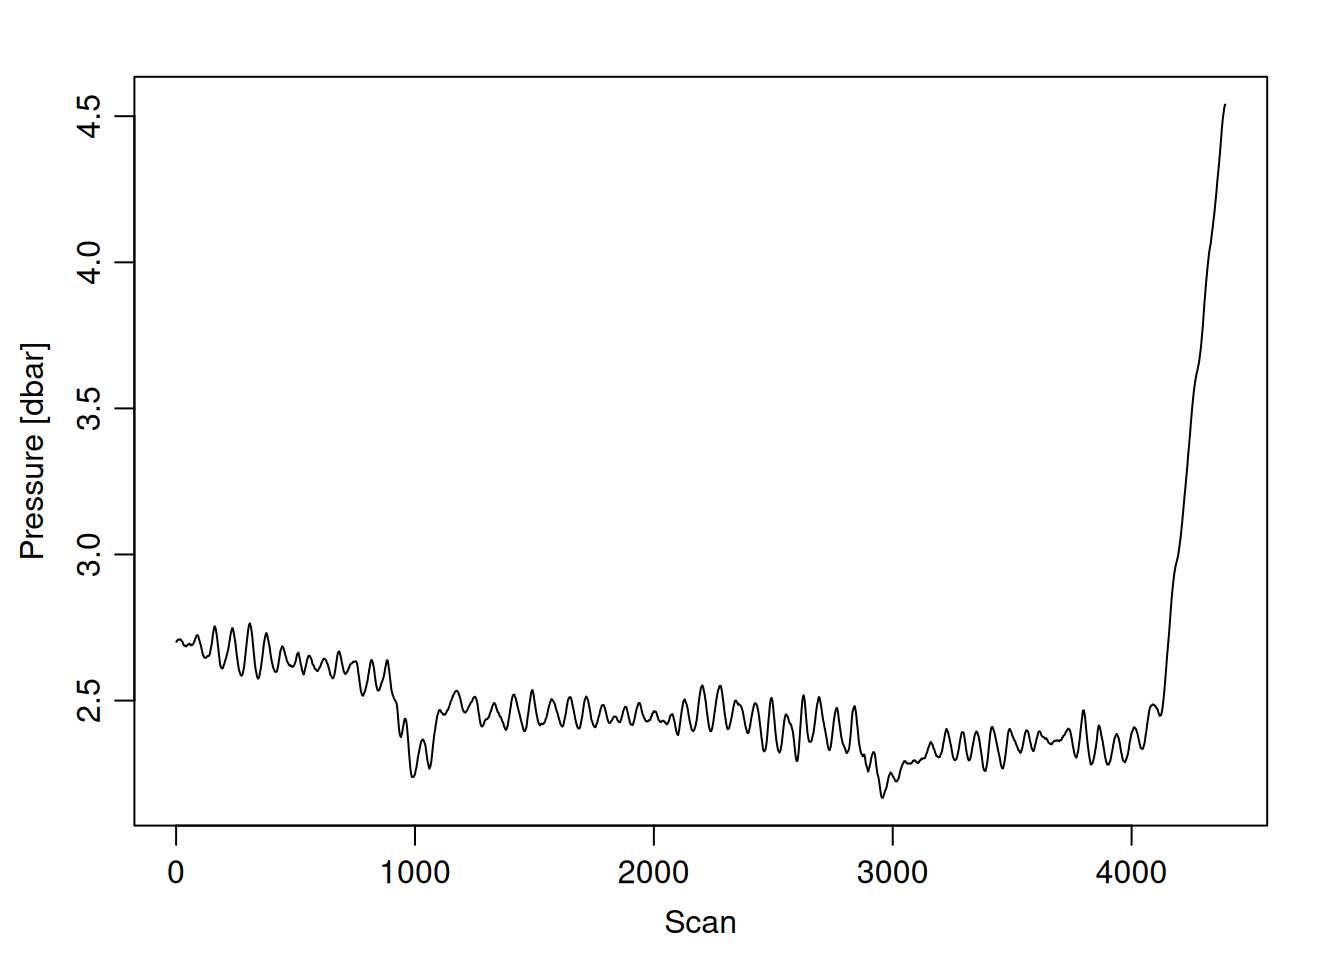
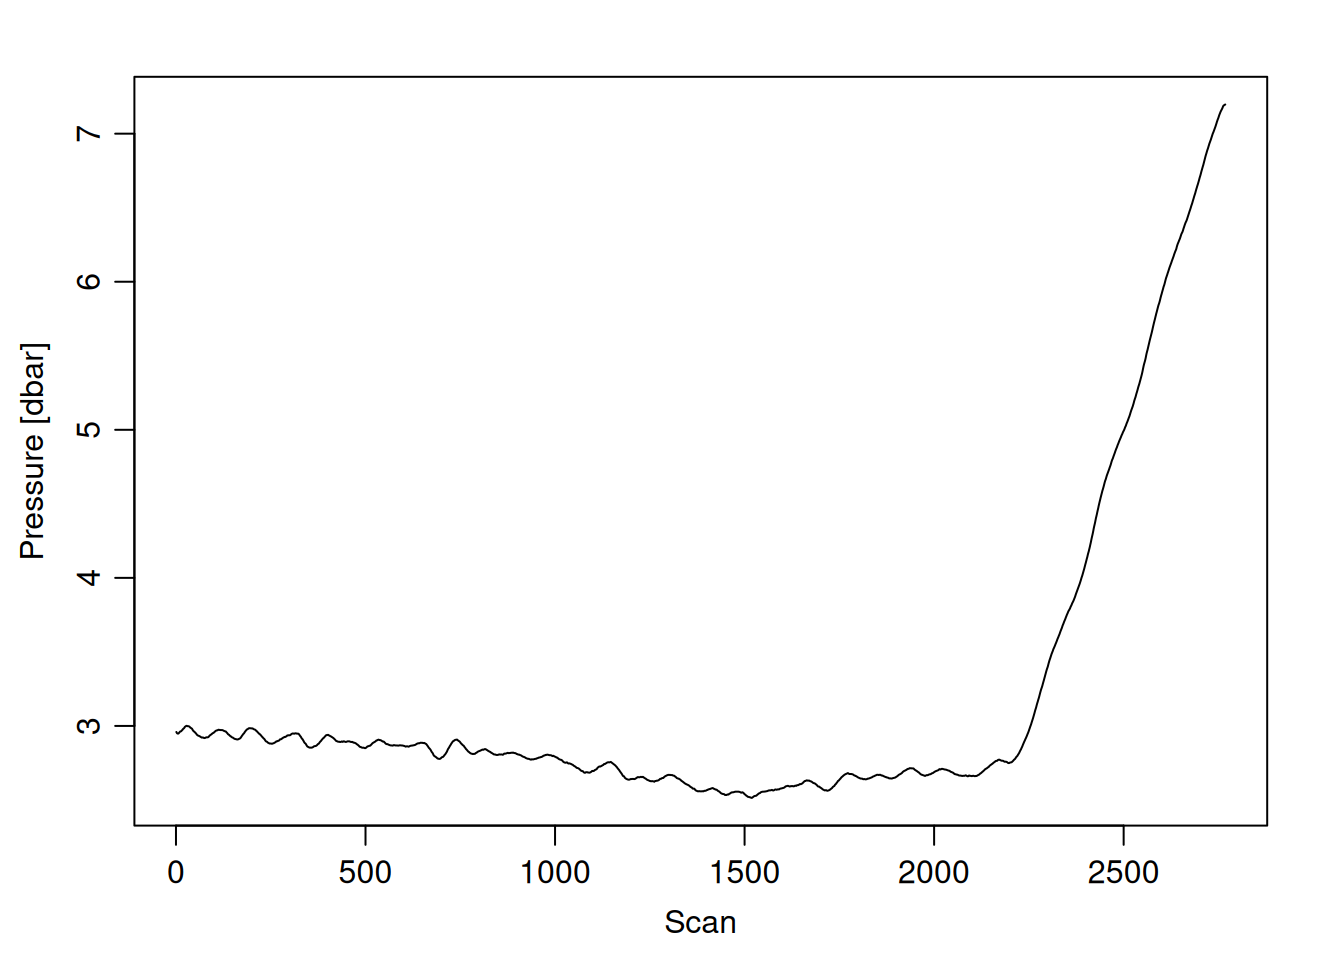
=== station: .16
# scans: 2698
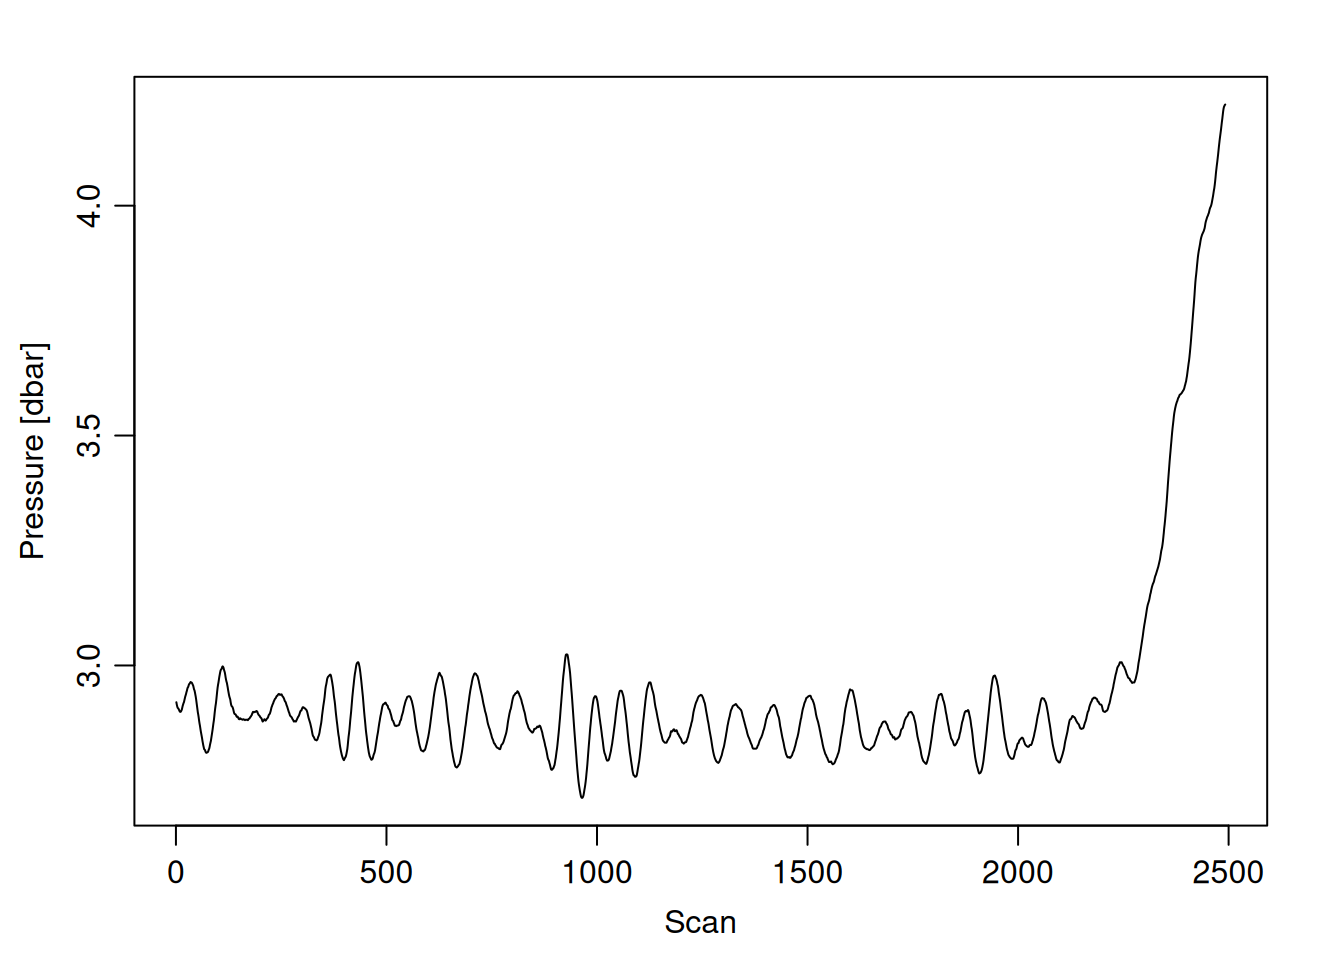
=== station: .18
# scans: 4697
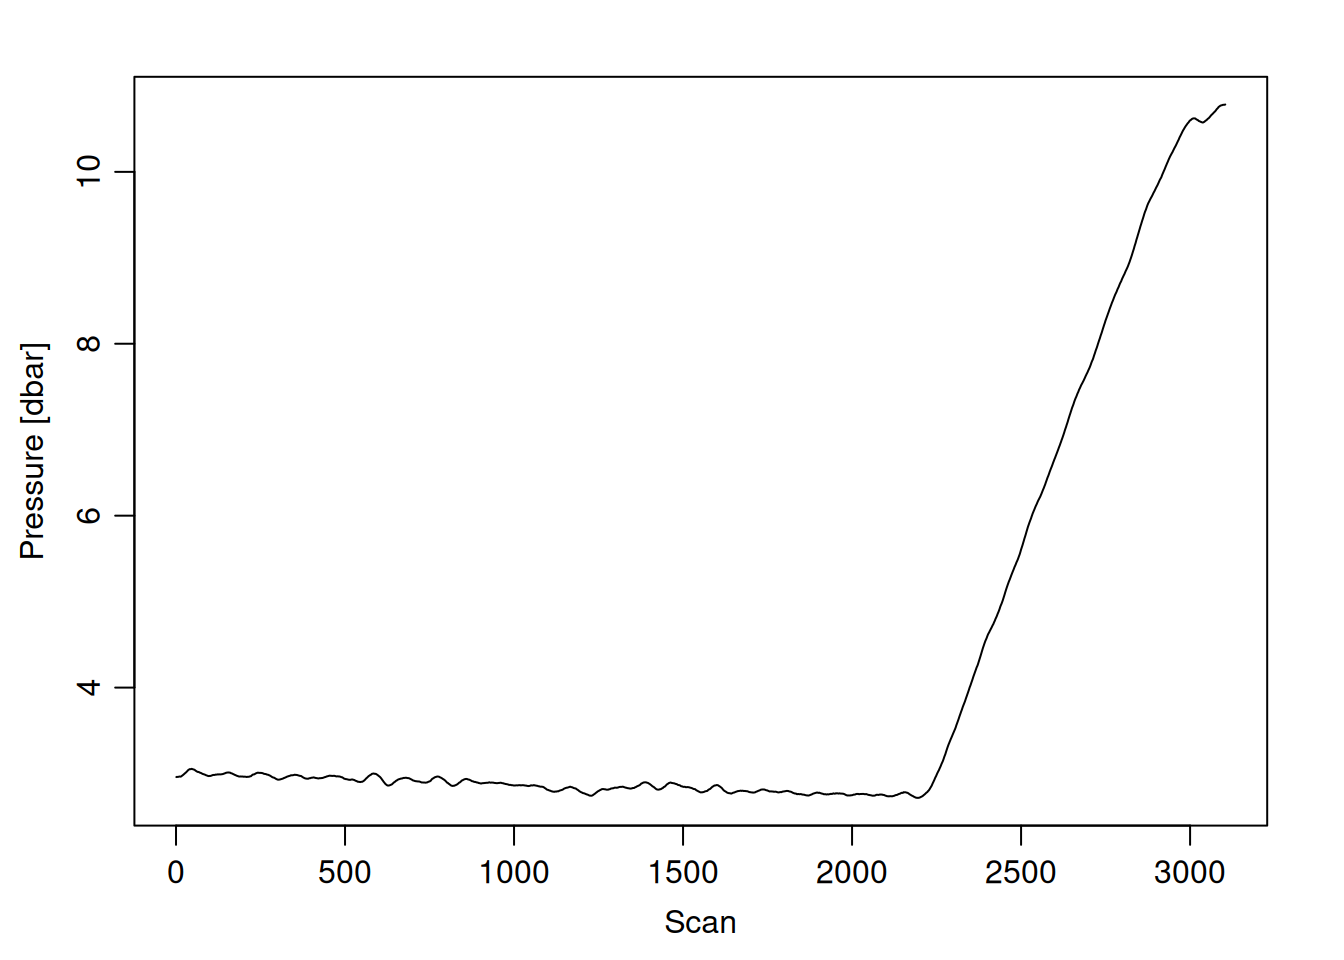
=== station: .2
# scans: 2713
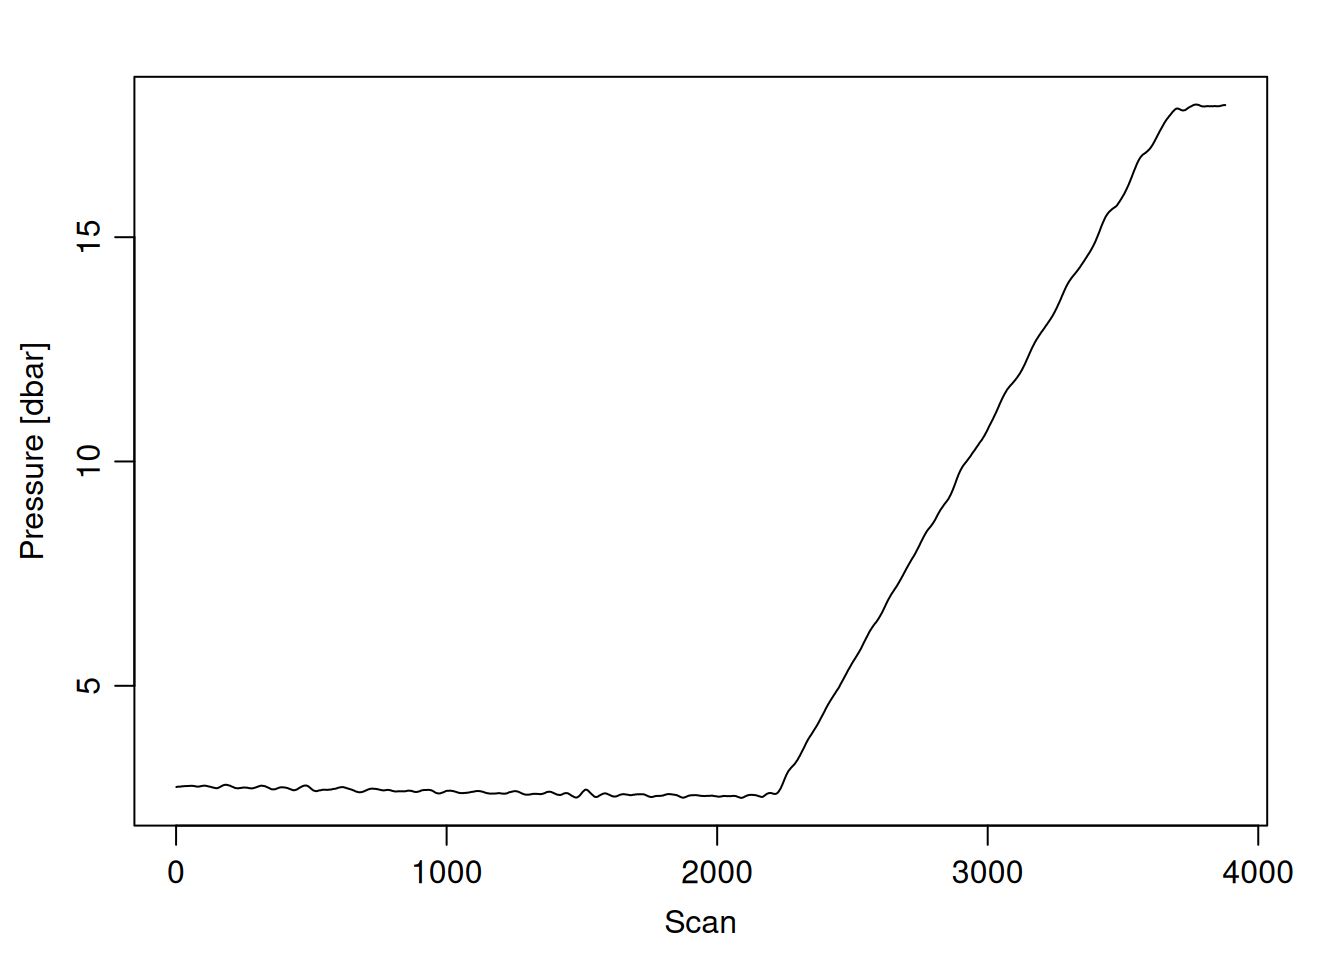
=== station: .21
# scans: 6113
=== station: .30
# scans: 4387
=== station: .31
# scans: 4676
=== station: .33
# scans: 3281
=== station: .41
# scans: 2893
=== station: .45
# scans: 2880
=== station: .47
# scans: 3017
=== station: .49
# scans: 2726
=== station: .51
# scans: 2659
=== station: .53
# scans: 2406
=== station: .54
# scans: 78
=== station: .55
# scans: 211
=== station: .56
# scans: 3467
=== station: .57
# scans: 2588
=== station: .57_1
# scans: 2549
=== station: .57_2
# scans: 3849
=== station: .57_3
# scans: 3622
=== station: .58
# scans: 3810
=== station: .60
# scans: 3419
=== station: .64
# scans: 2
=== station: .65
# scans: 4961
=== station: .68
# scans: 4392
=== station: .7
# scans: 2492
=== station: .9
# scans: 4702
=== station: .9_5
# scans: 9073
=== station: .AMI1
# scans: 3392
=== station: .AMI2
# scans: 3942
=== station: .AMI3
# scans: 4782
=== station: .AMI4
# scans: 5058
=== station: .AMI5
# scans: 4625
=== station: .AMI6
# scans: 5327
=== station: .AMI7
# scans: 5106
=== station: .AMI8
# scans: 6270
=== station: .AMI9
# scans: 6002
=== station: .BG1
# scans: 3746
=== station: .BG2
# scans: 3374
=== station: .BG3
# scans: 4823
=== station: .BG4
# scans: 4014
=== station: .CAL1
# scans: 1591
=== station: .CAL2
# scans: 3132
=== station: .CAL3
# scans: 3192
=== station: .CAL4
# scans: 3959
=== station: .CAL5
# scans: 4531
=== station: .CAL6
# scans: 4384
=== station: .CW1
# scans: 3
=== station: .CW2
# scans: 2768
=== station: .CW3
# scans: 3104
=== station: .CW4
# scans: 3878
=== station: .GP5
# scans: 4680
=== station: .KW1
# scans: 3458
=== station: .KW2
# scans: 3771
=== station: .KW4
# scans: 4397
=== station: .L1
# scans: 2946
=== station: .L3
# scans: 4914
=== station: .L5
# scans: 6961
=== station: .L7
# scans: 5775
=== station: .L9
# scans: 5180
=== station: .MR
# scans: 5551
=== station: .RP1
# scans: 2990
=== station: .RP2
# scans: 3154
=== station: .RP3
# scans: 3810
=== station: .RP4
# scans: 4376
=== station: .TB1
# scans: 2848
=== station: .TB10
# scans: 5350
=== station: .TB2
# scans: 3141
=== station: .TB3
# scans: 4004
=== station: .TB4
# scans: 4058
=== station: .TB5
# scans: 5301
=== station: .V1
# scans: 3901
=== station: .V2
# scans: 3752
=== station: .V3
# scans: 3774
=== station: .V4
# scans: 3651
=== station: .V5
# scans: 5442
=== station: .V6
# scans: 4826
=== station: .V7
# scans: 4717
=== station: .V8
# scans: 5135
=== station: .V9
# scans: 5212
=== station: .WS
# scans: 5575
plotting each cast in the first list
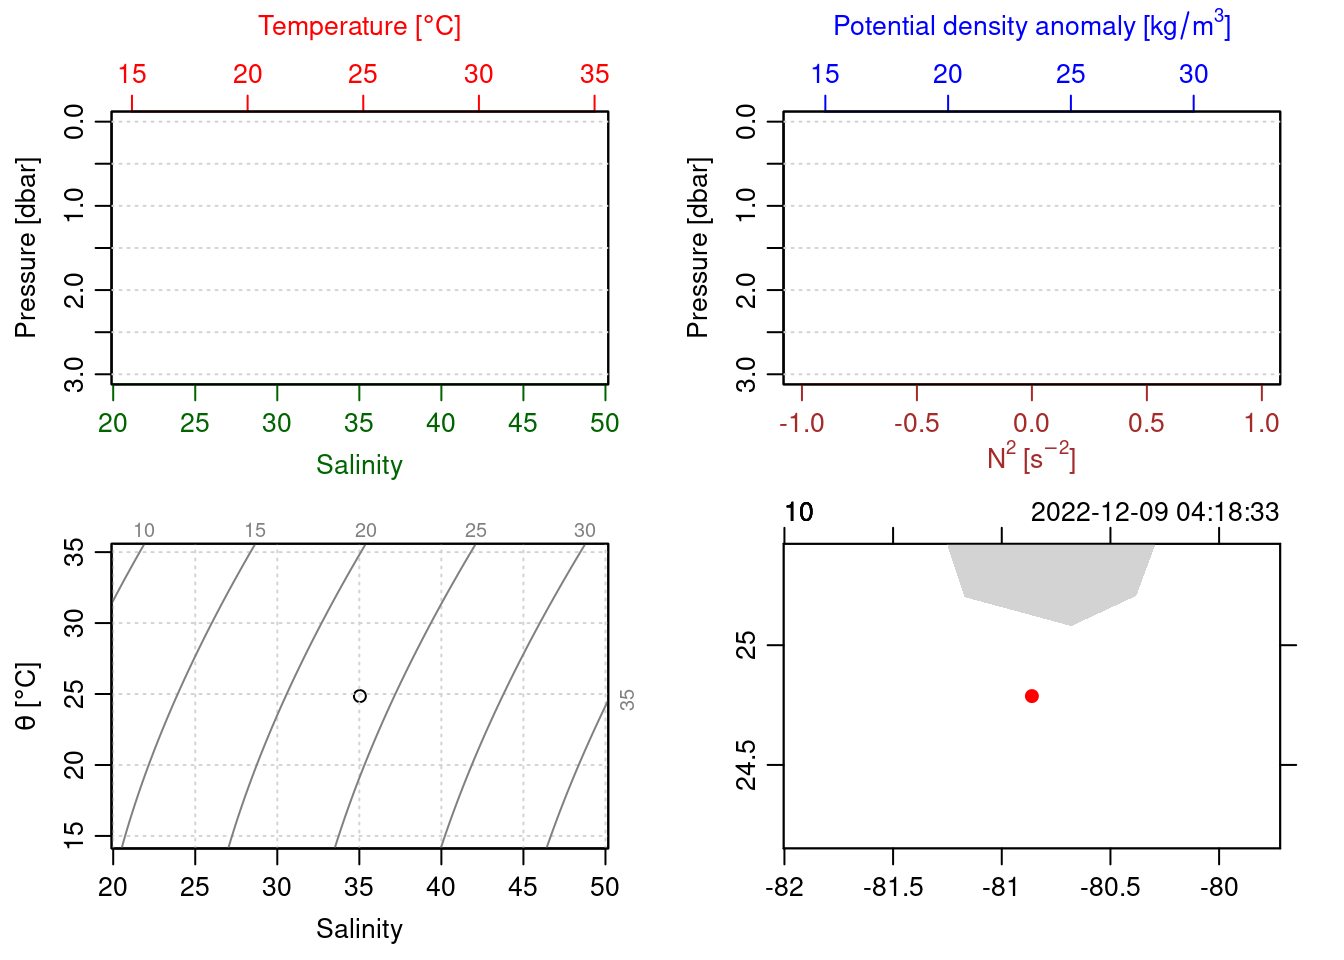
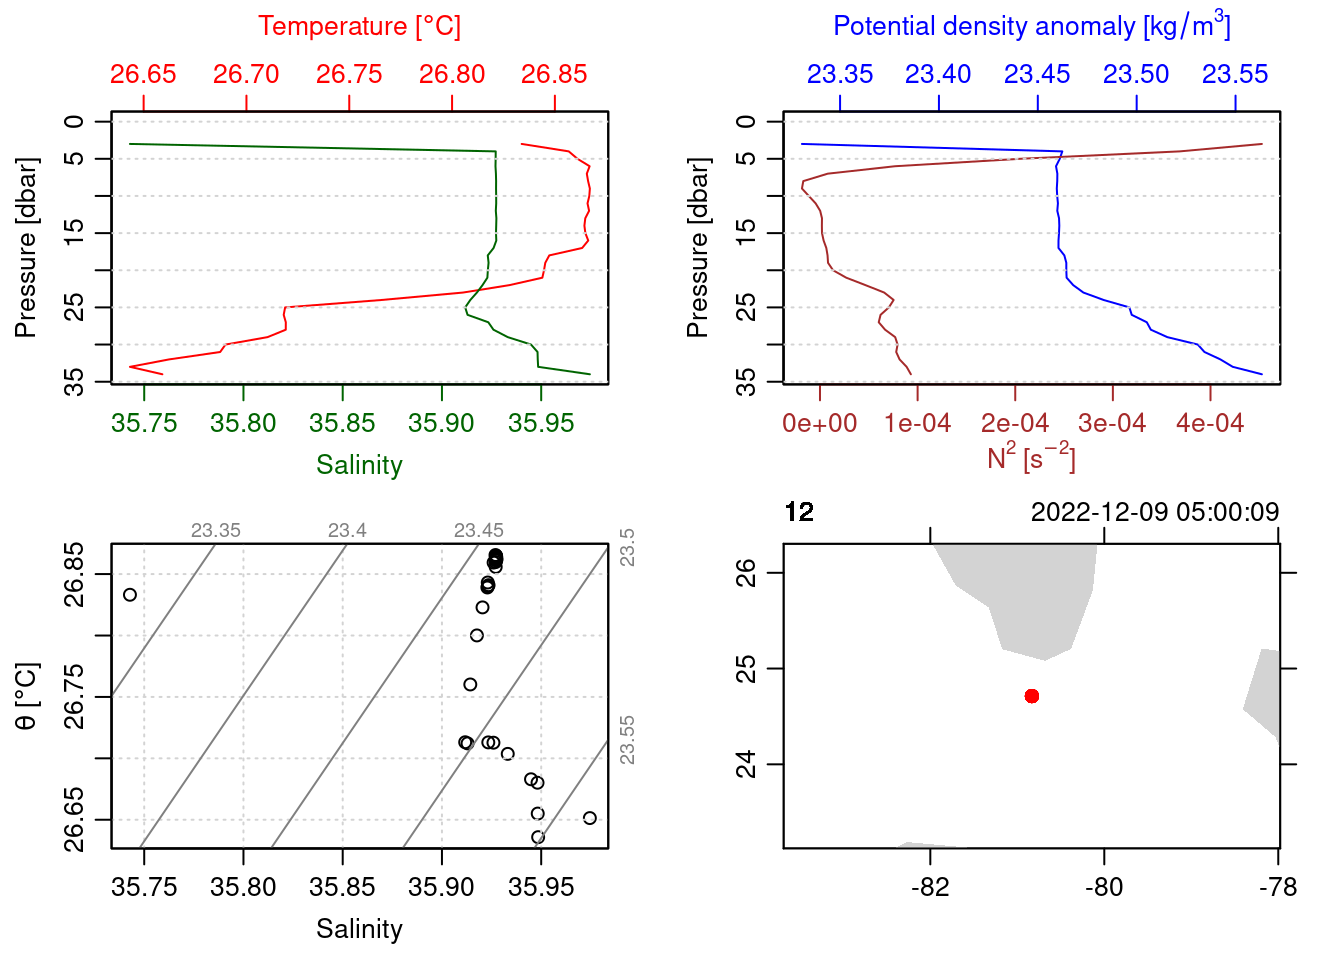
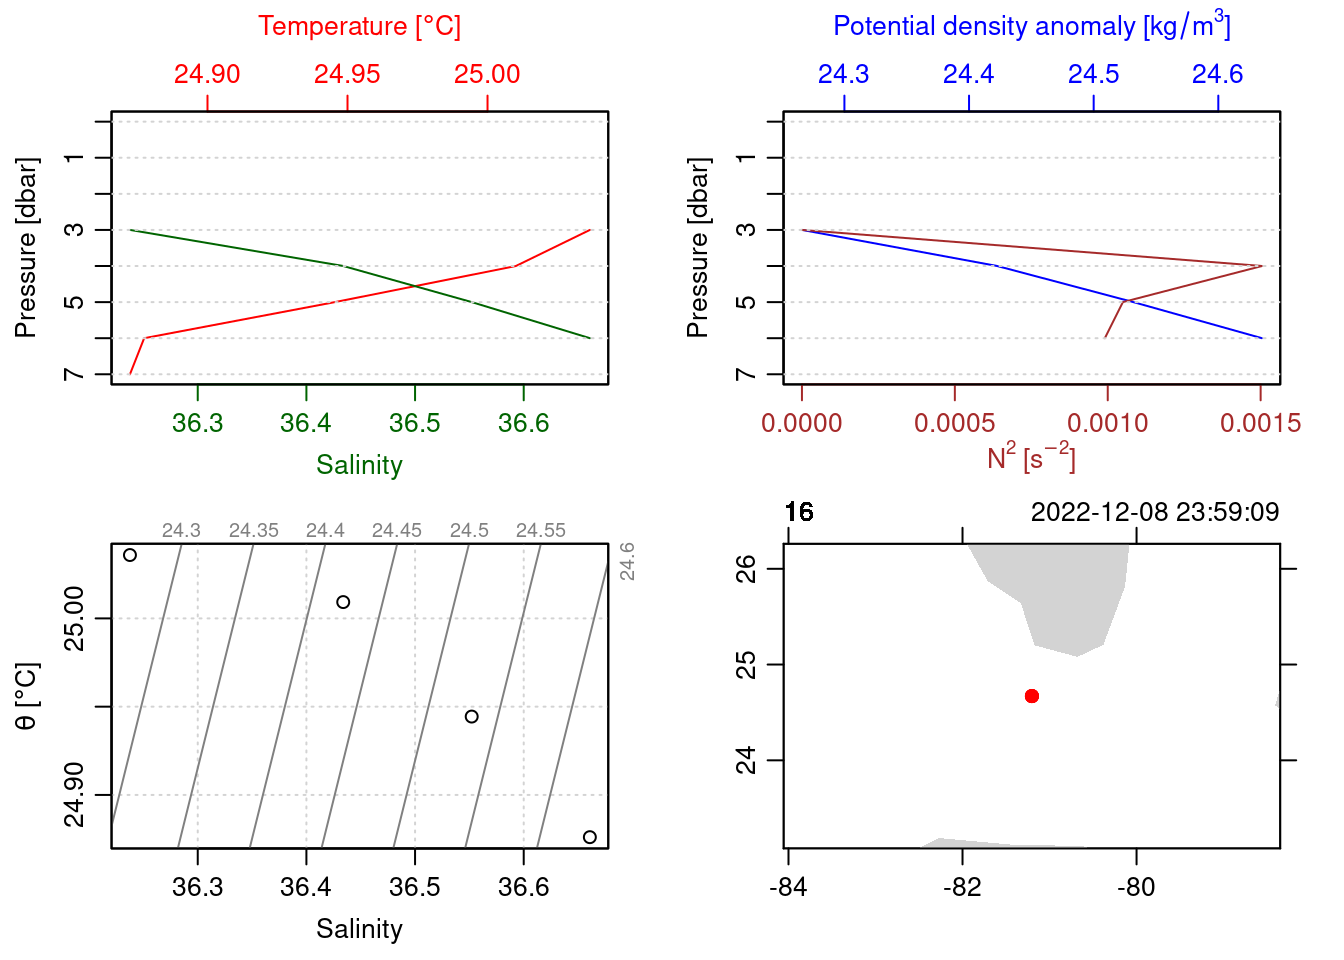
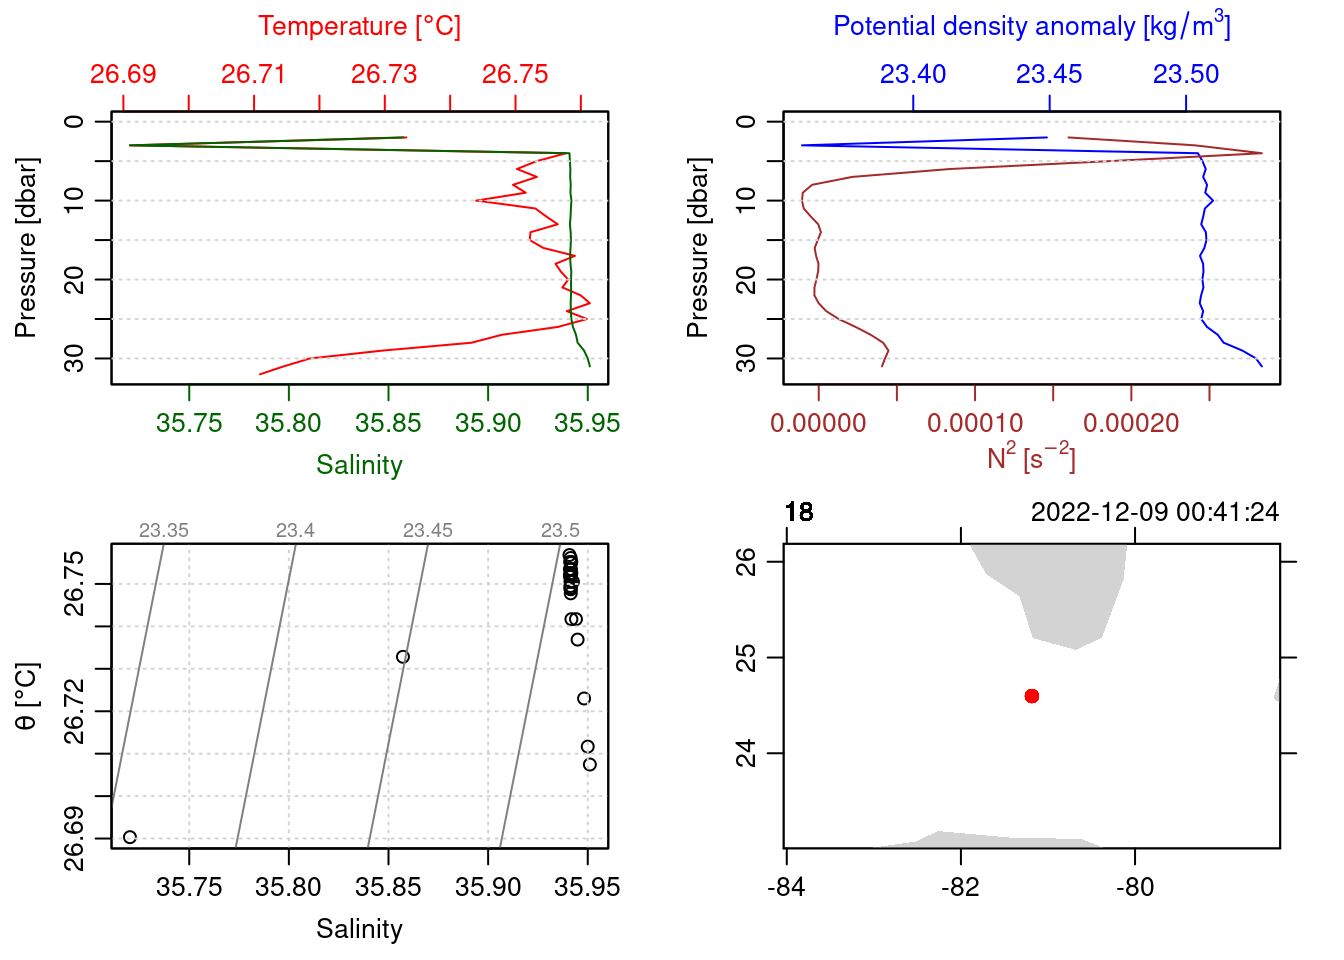
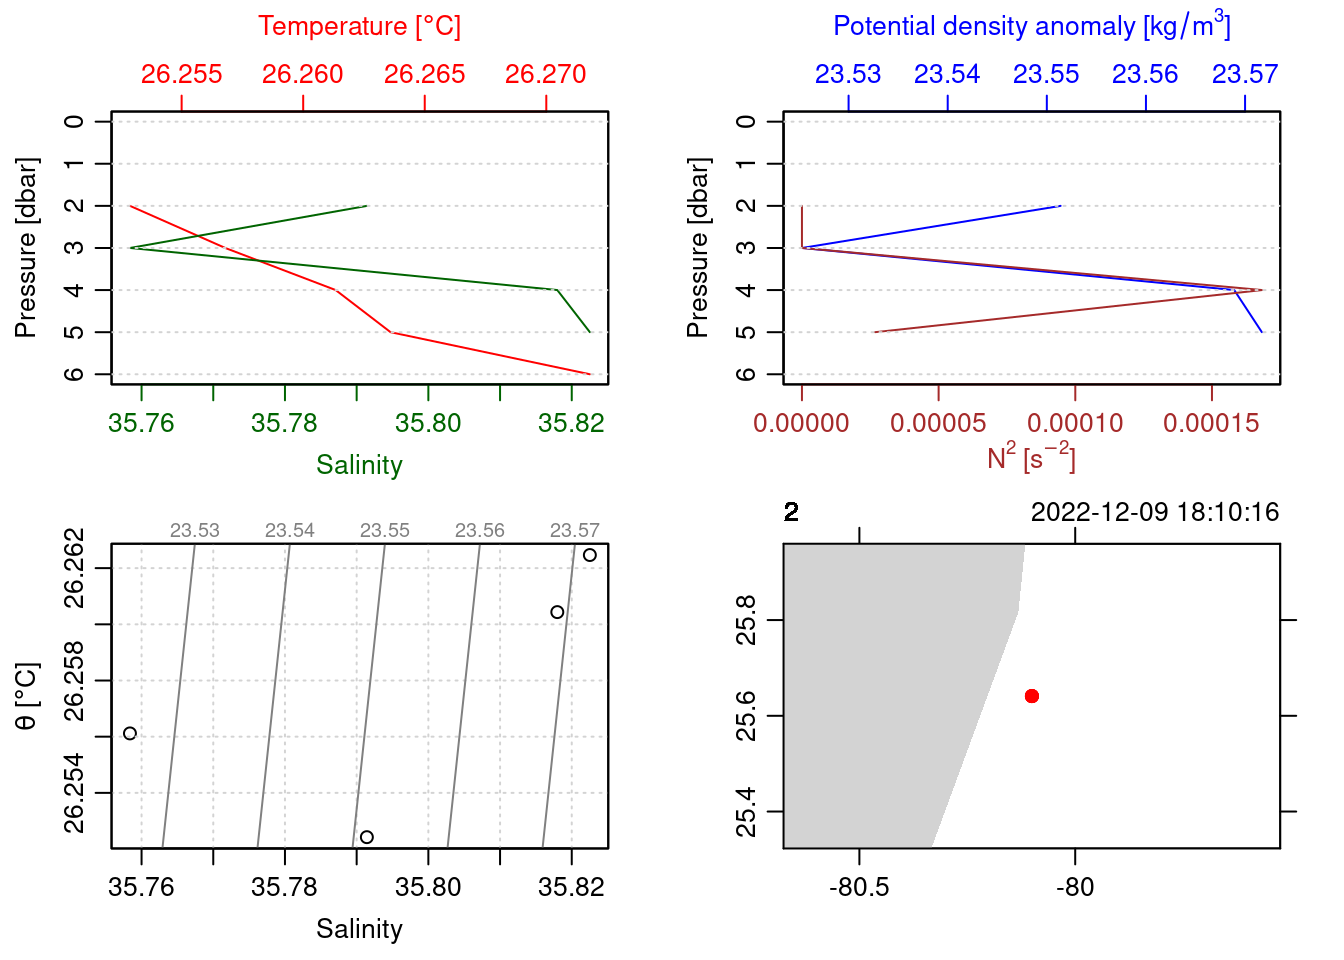
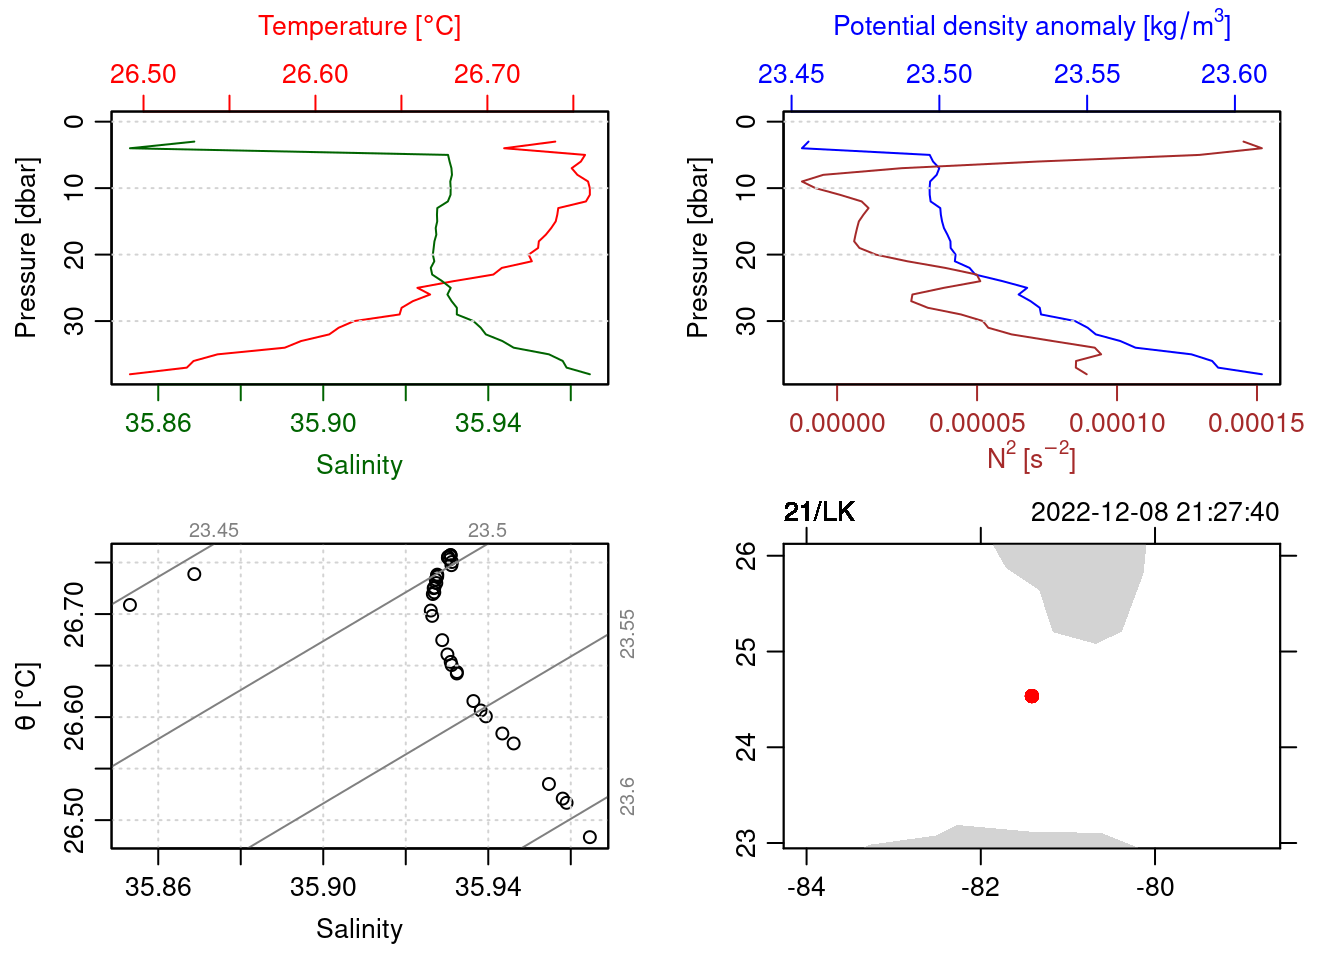
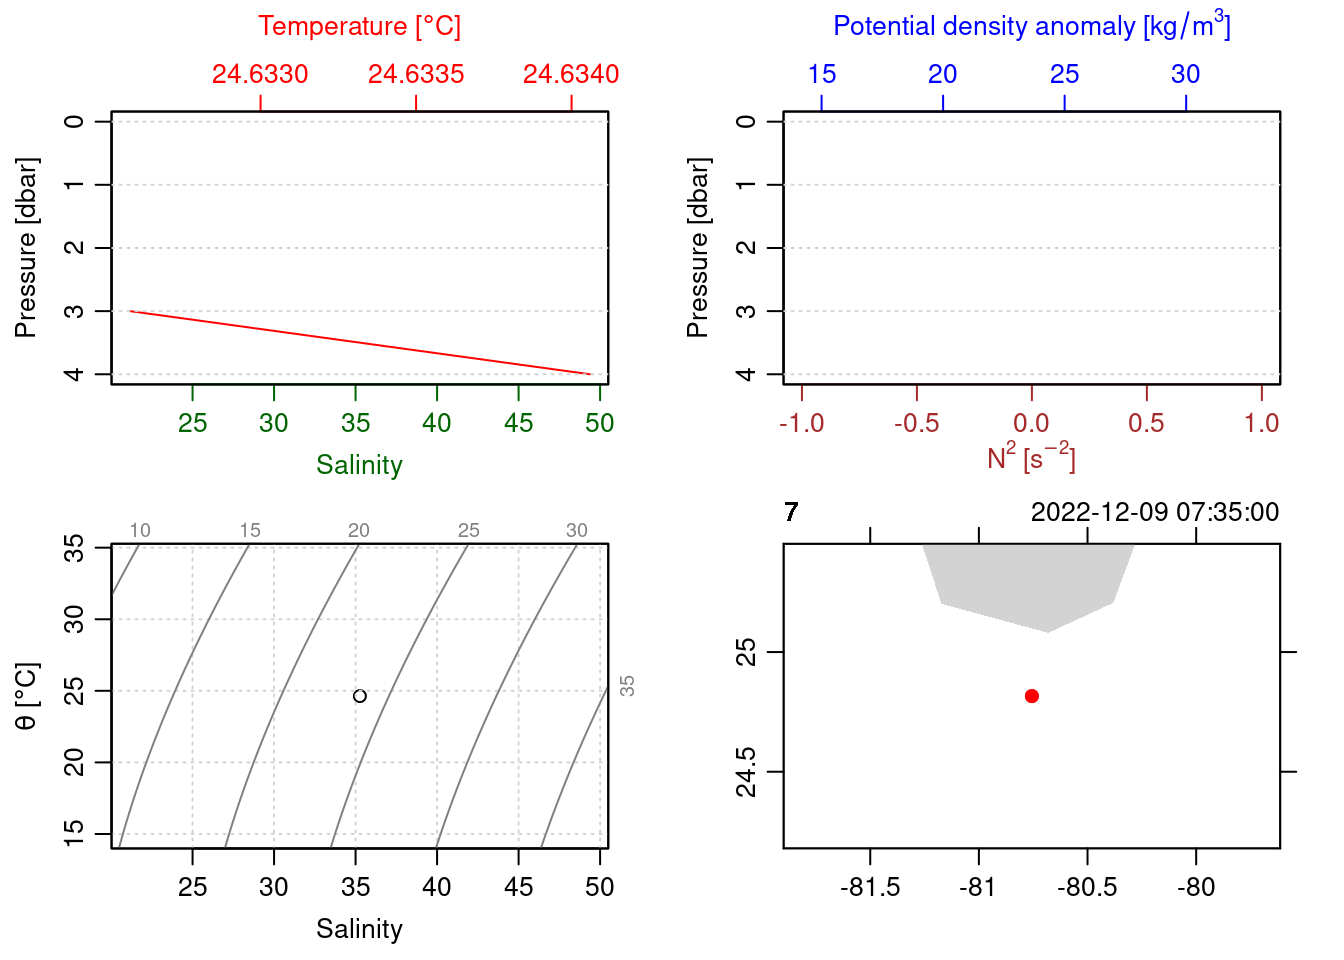
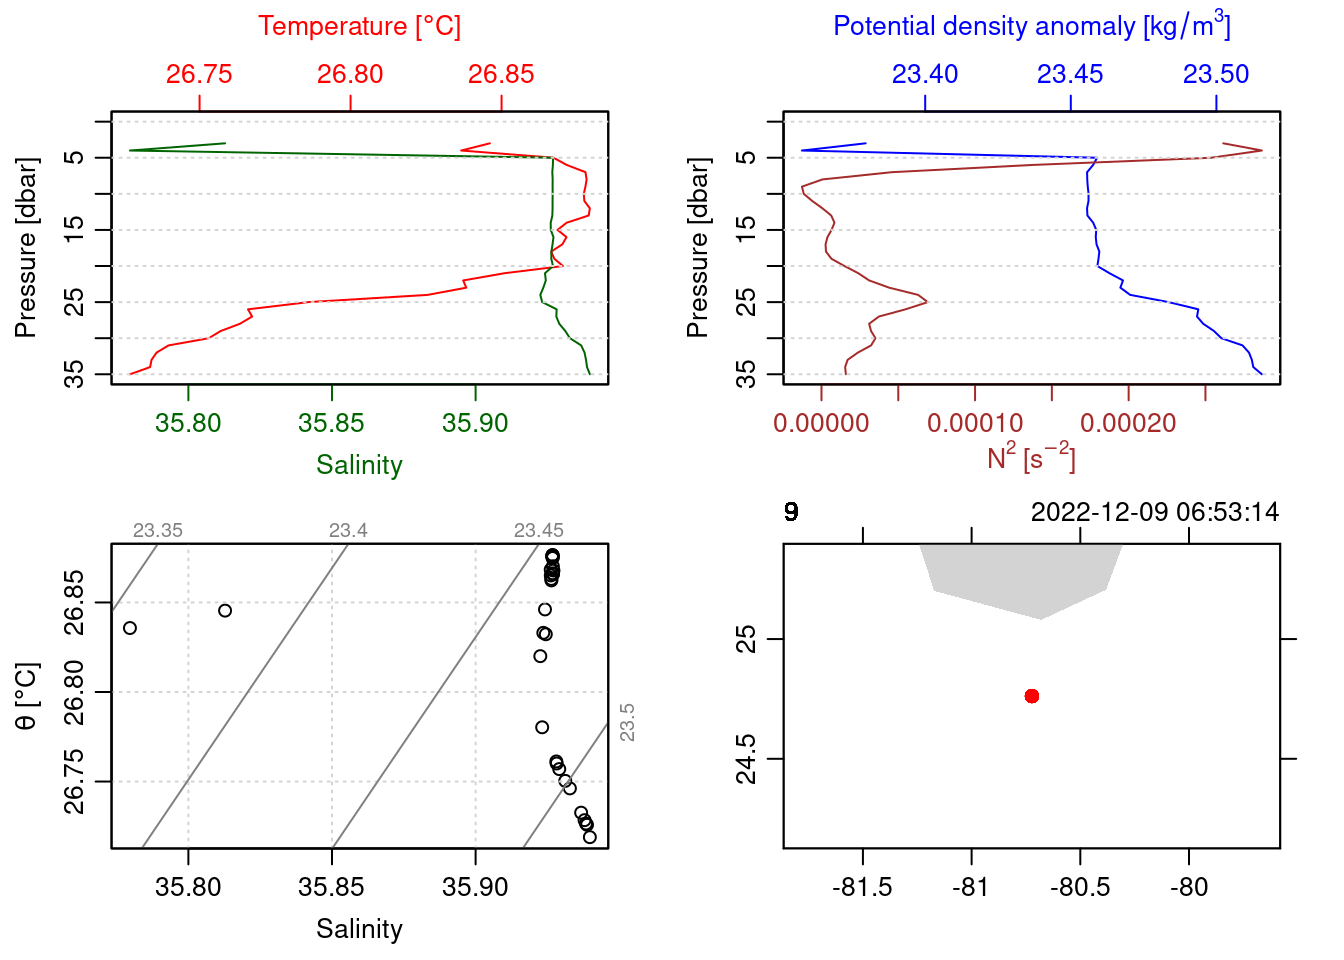
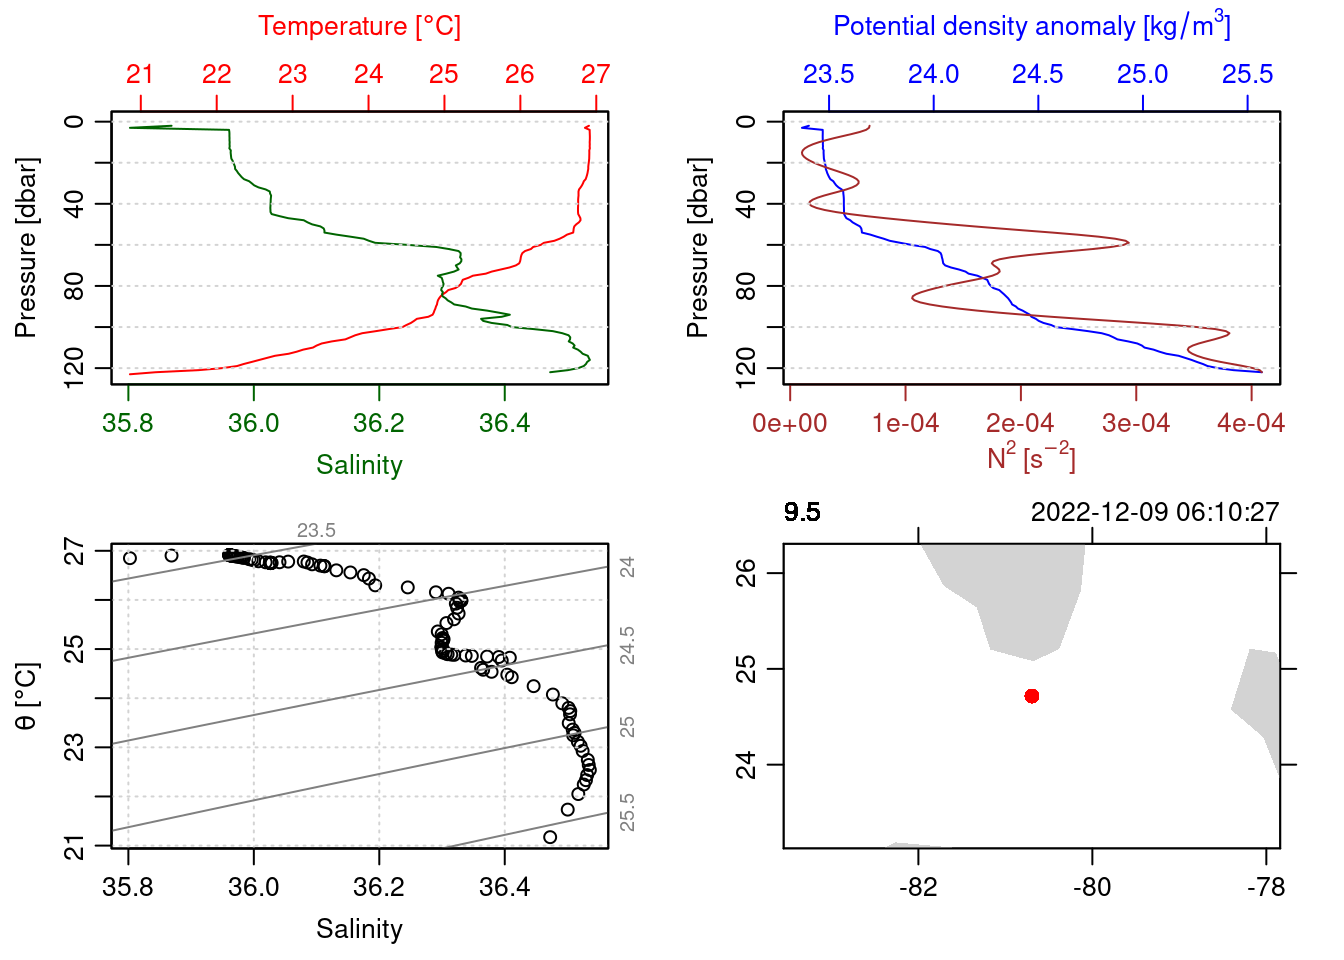
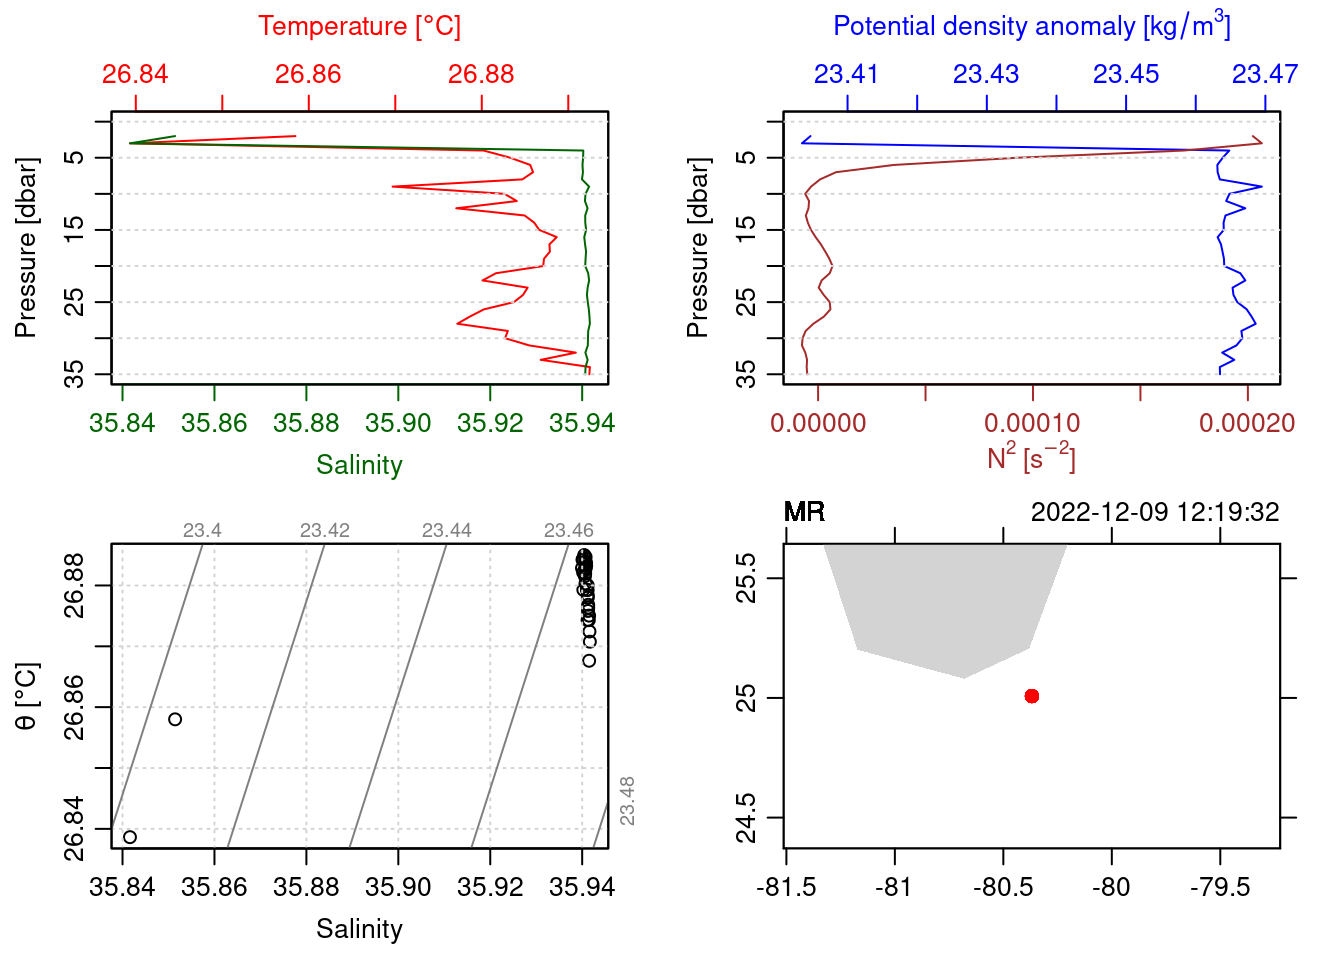
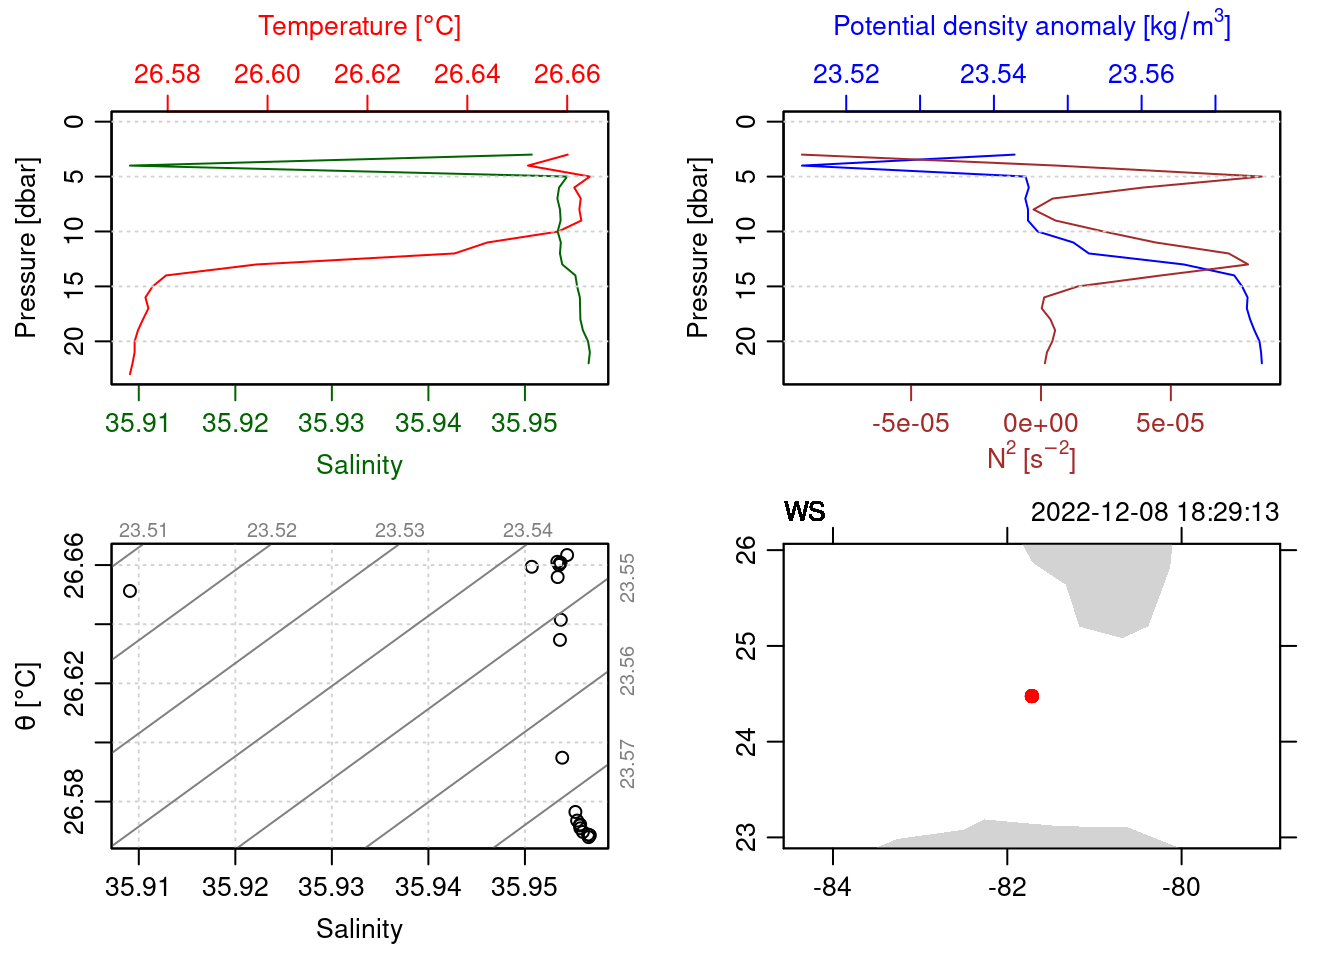
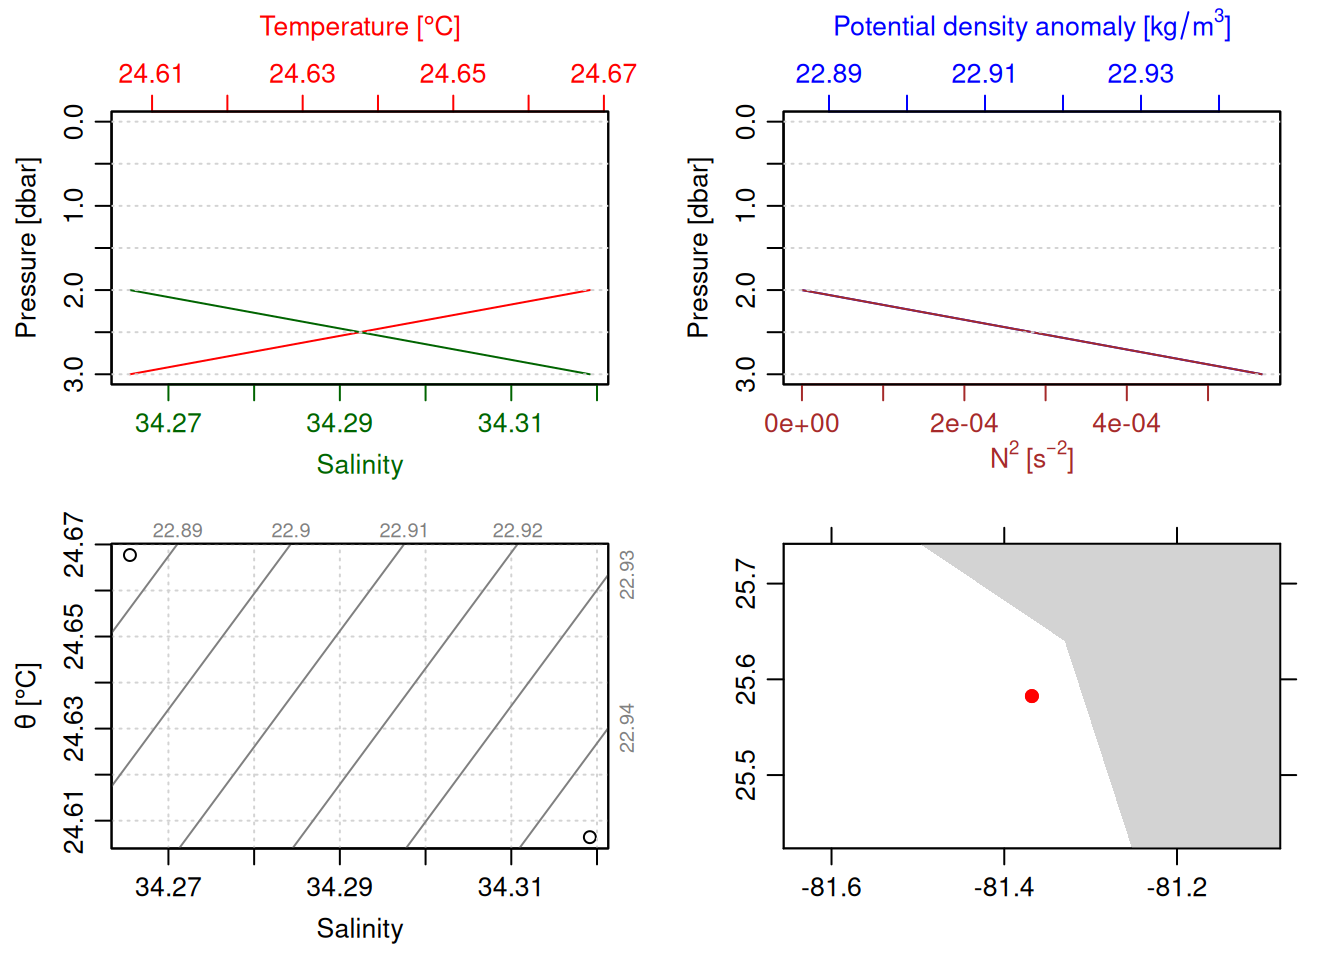
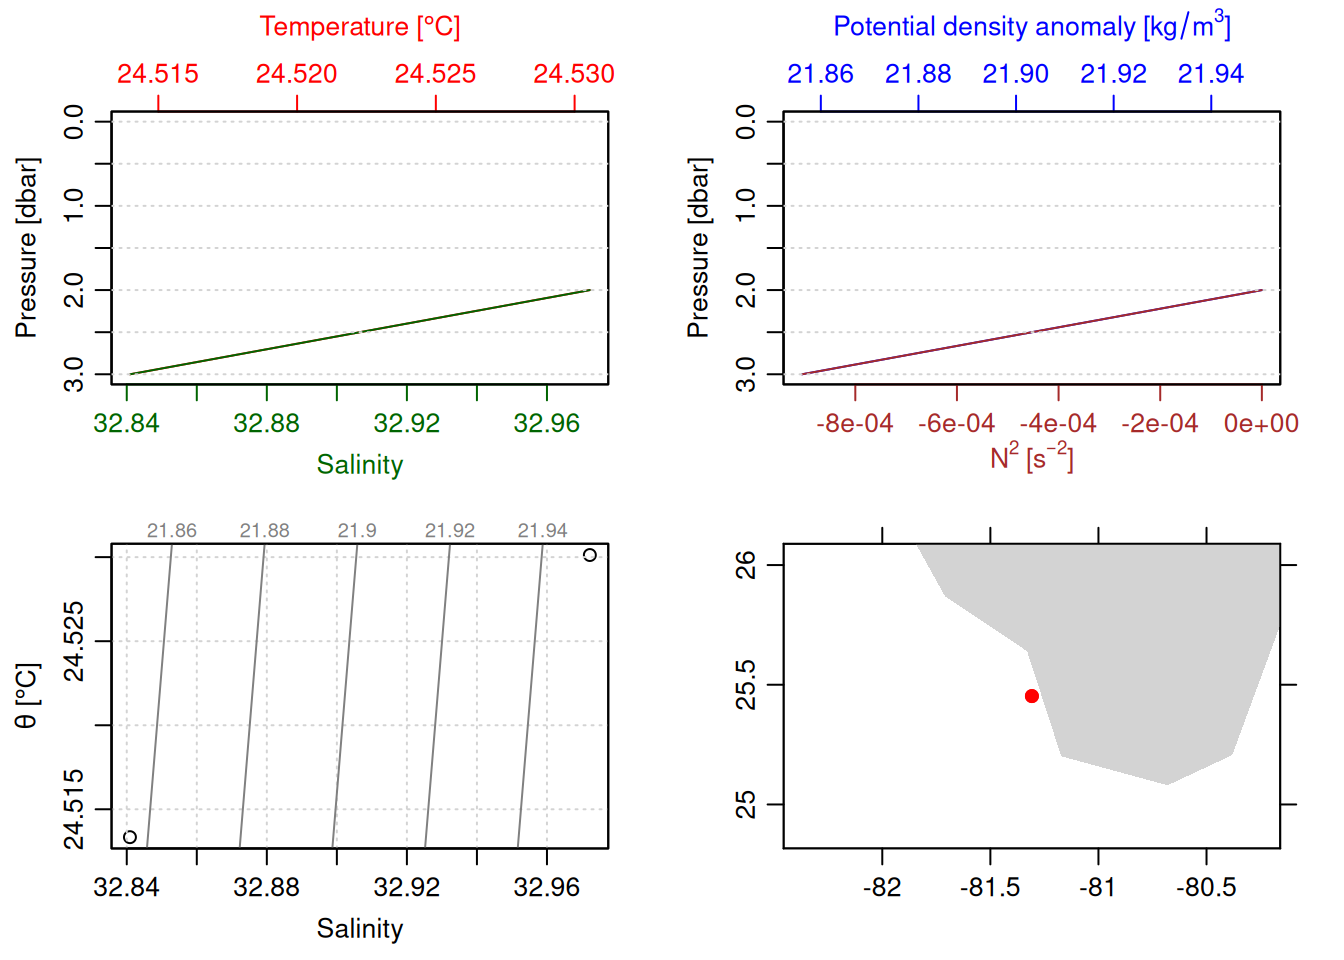
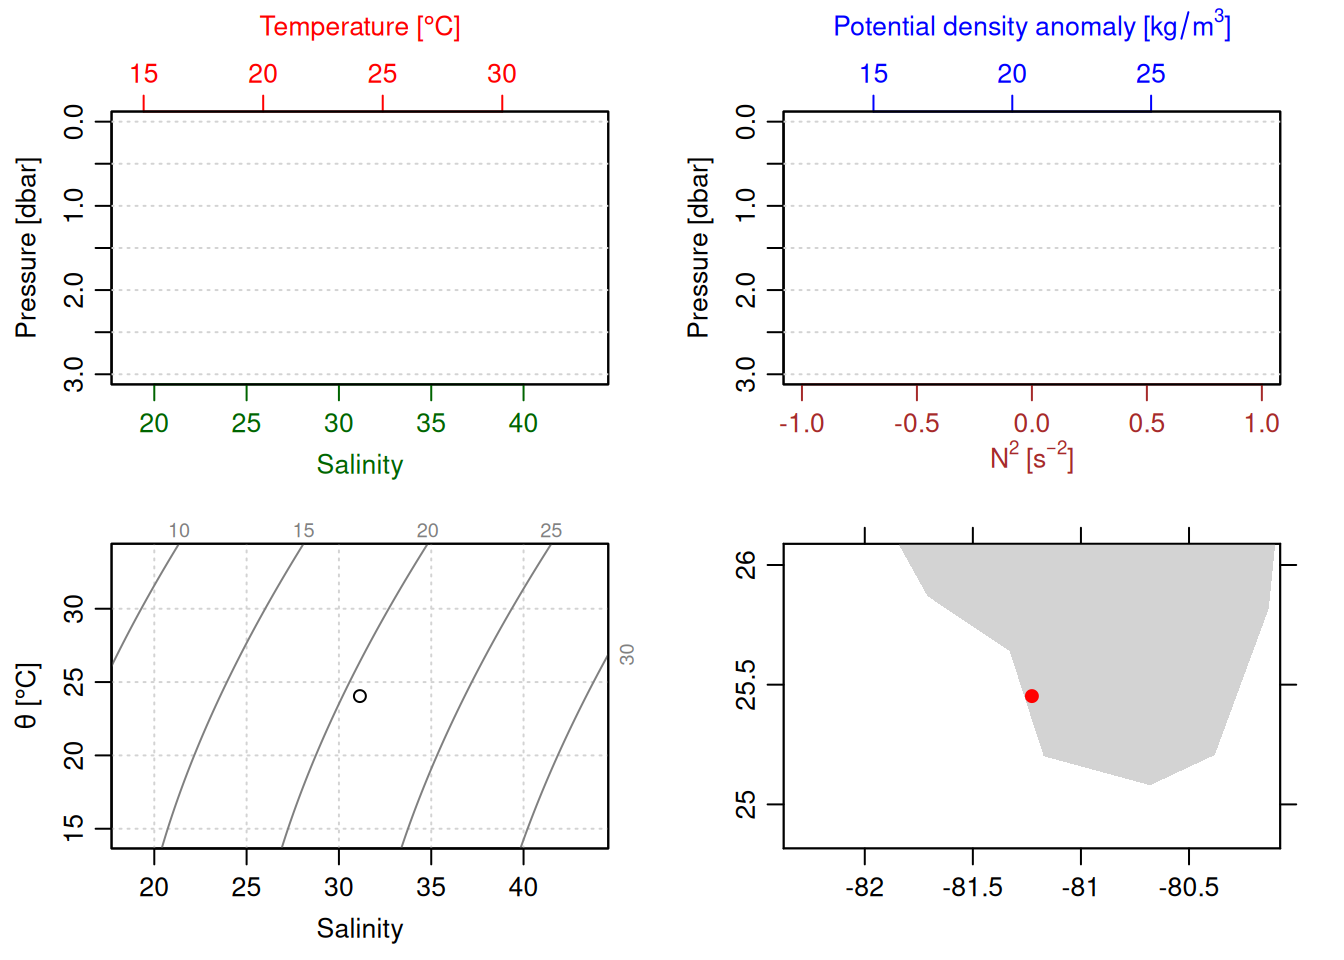
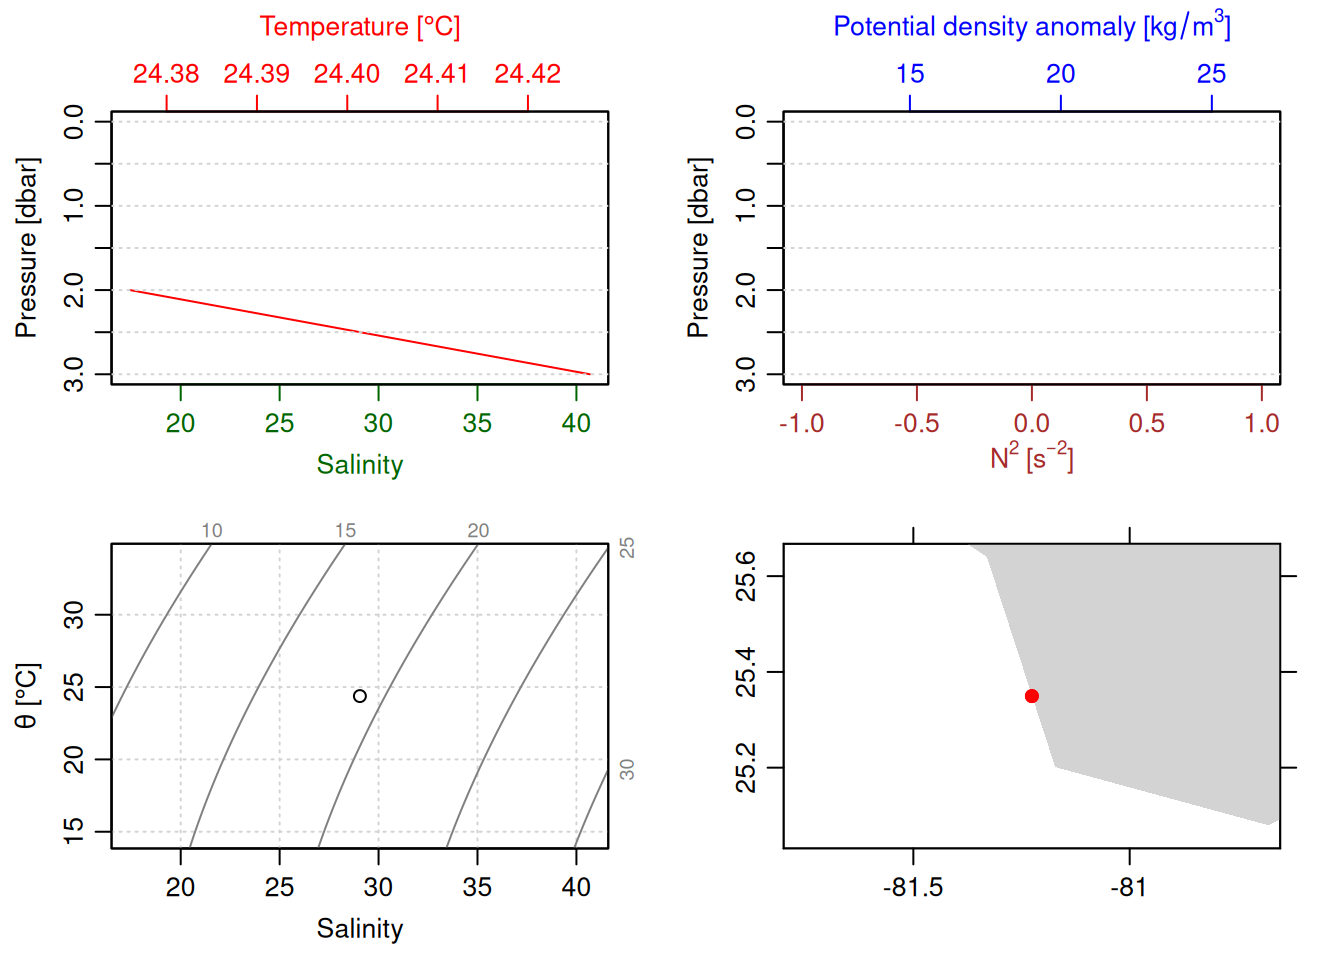
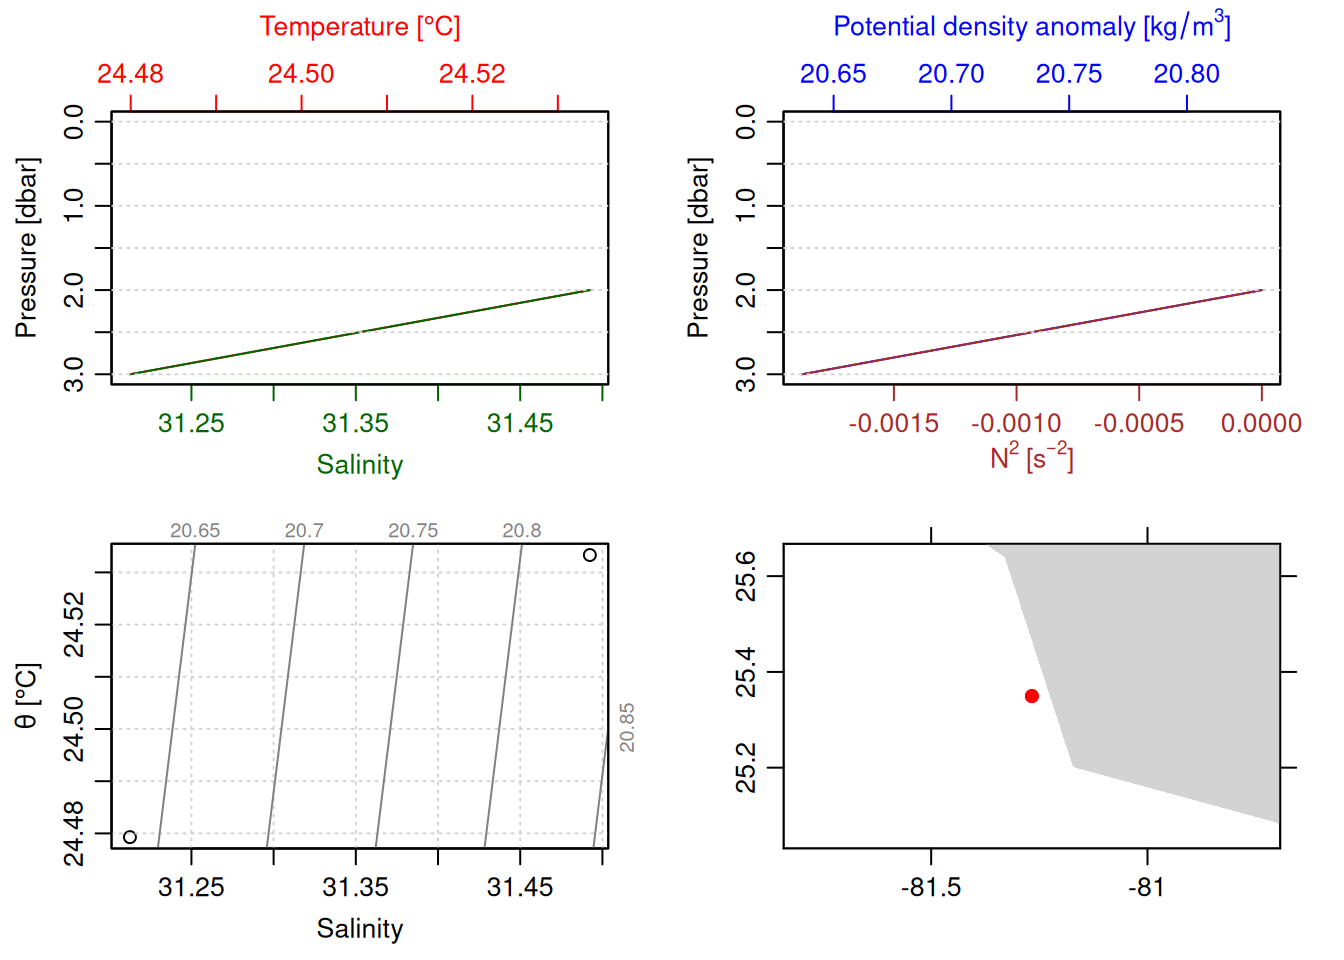
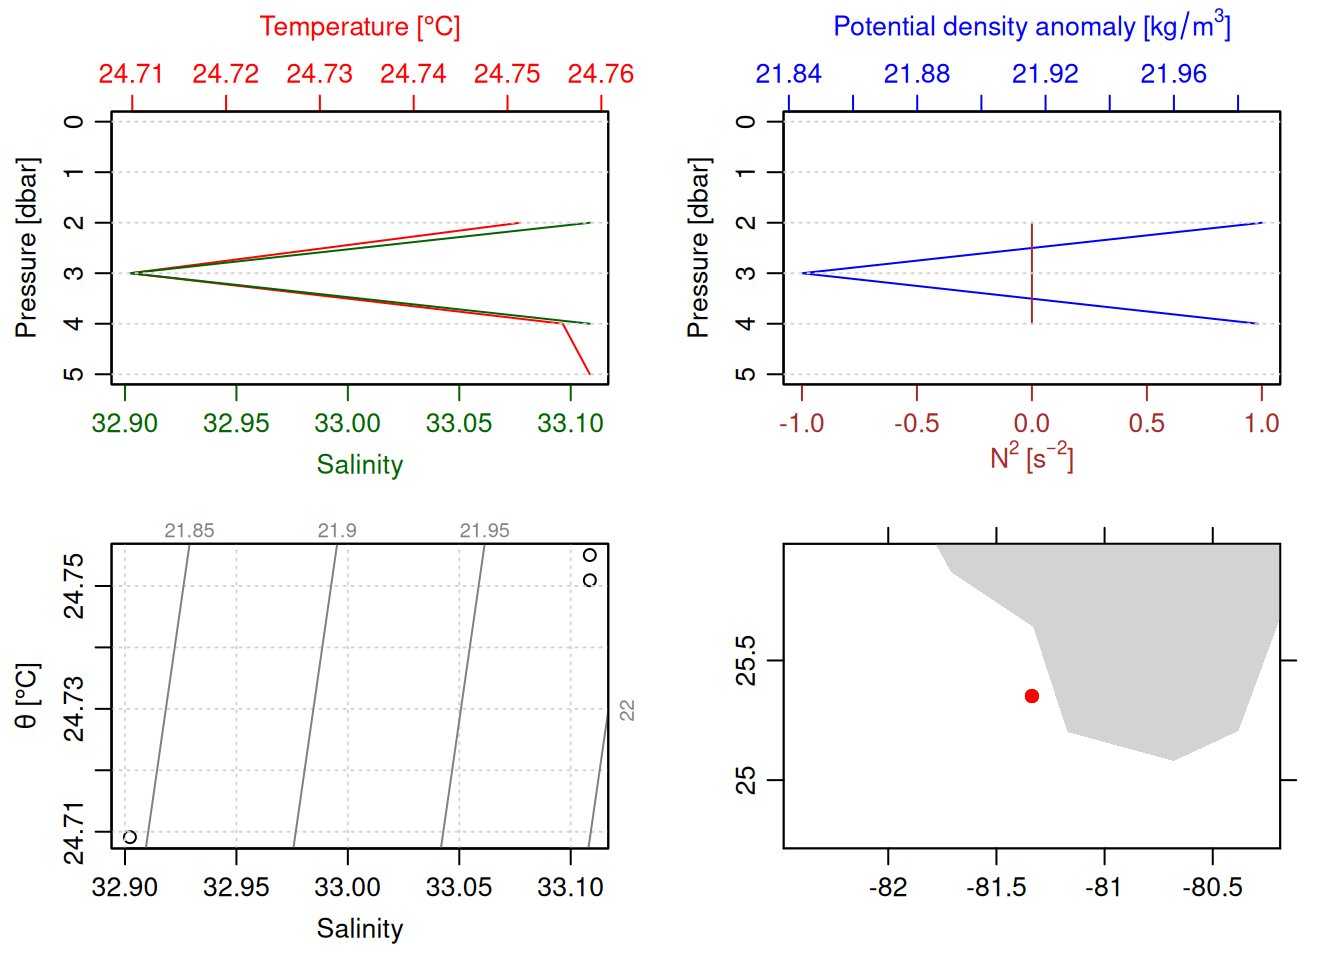
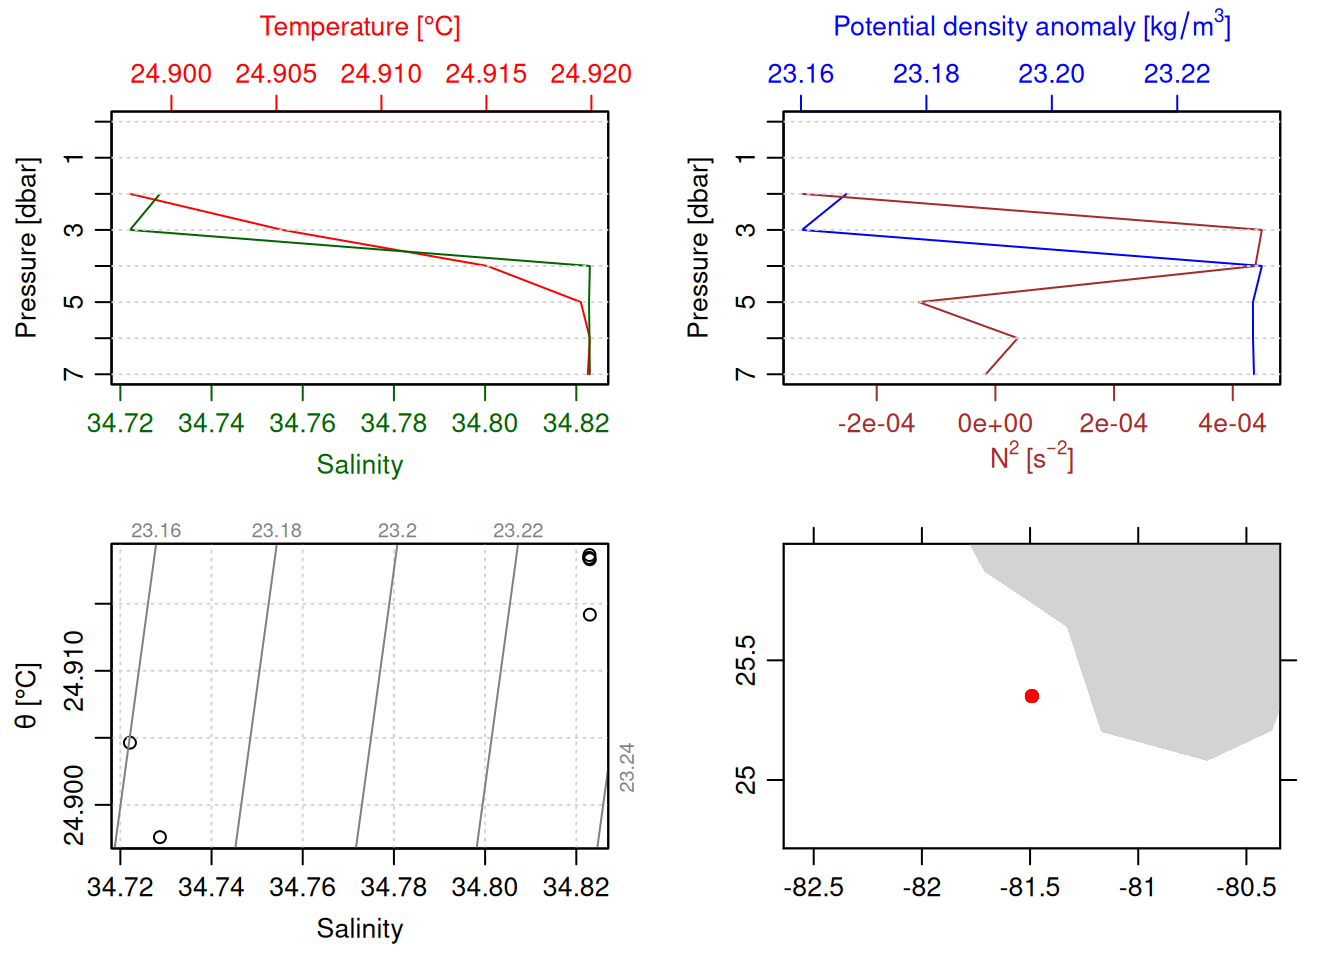
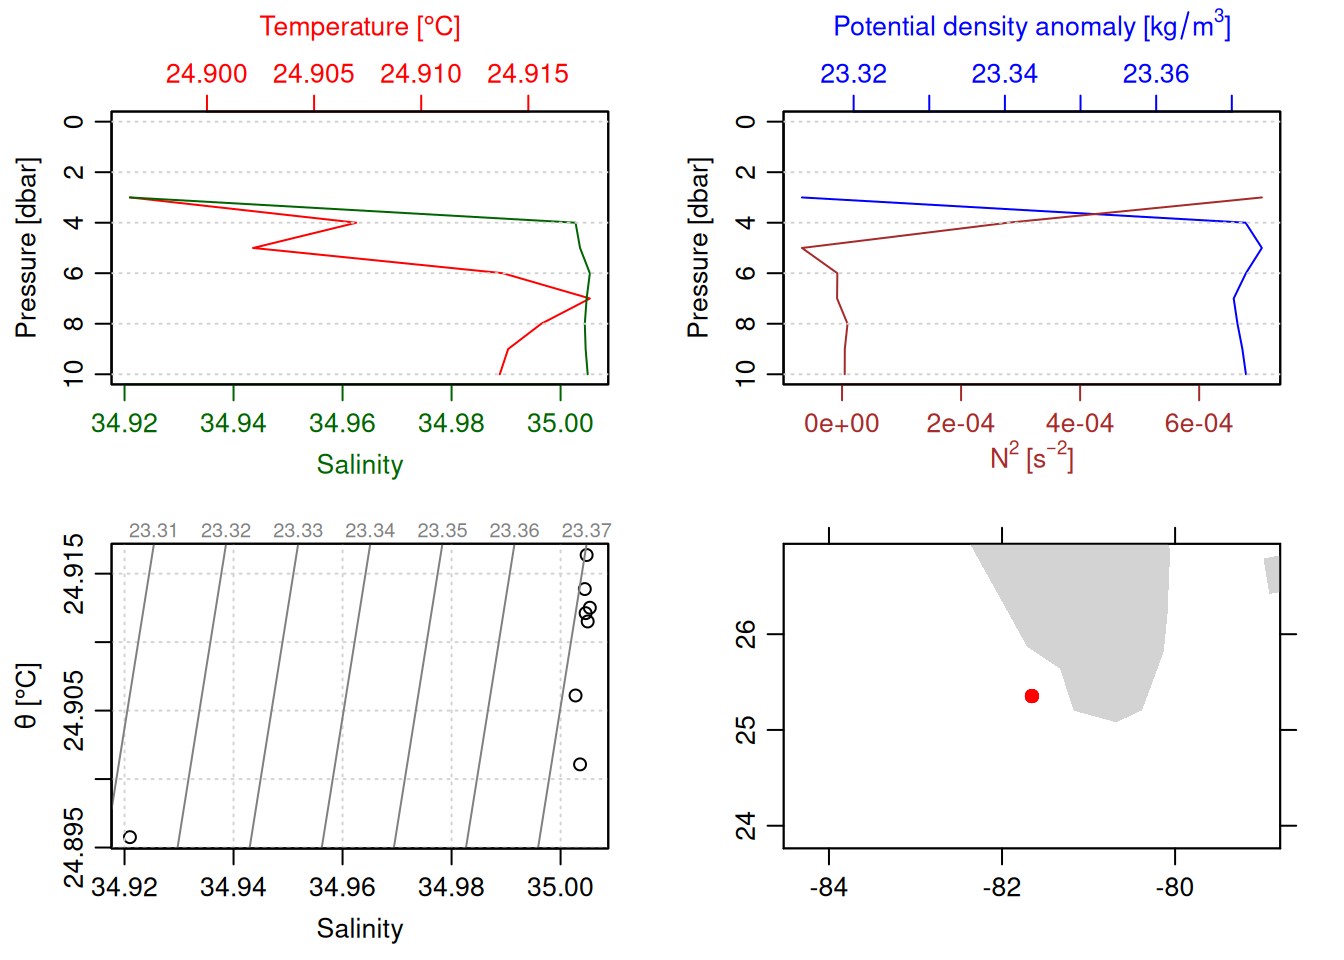
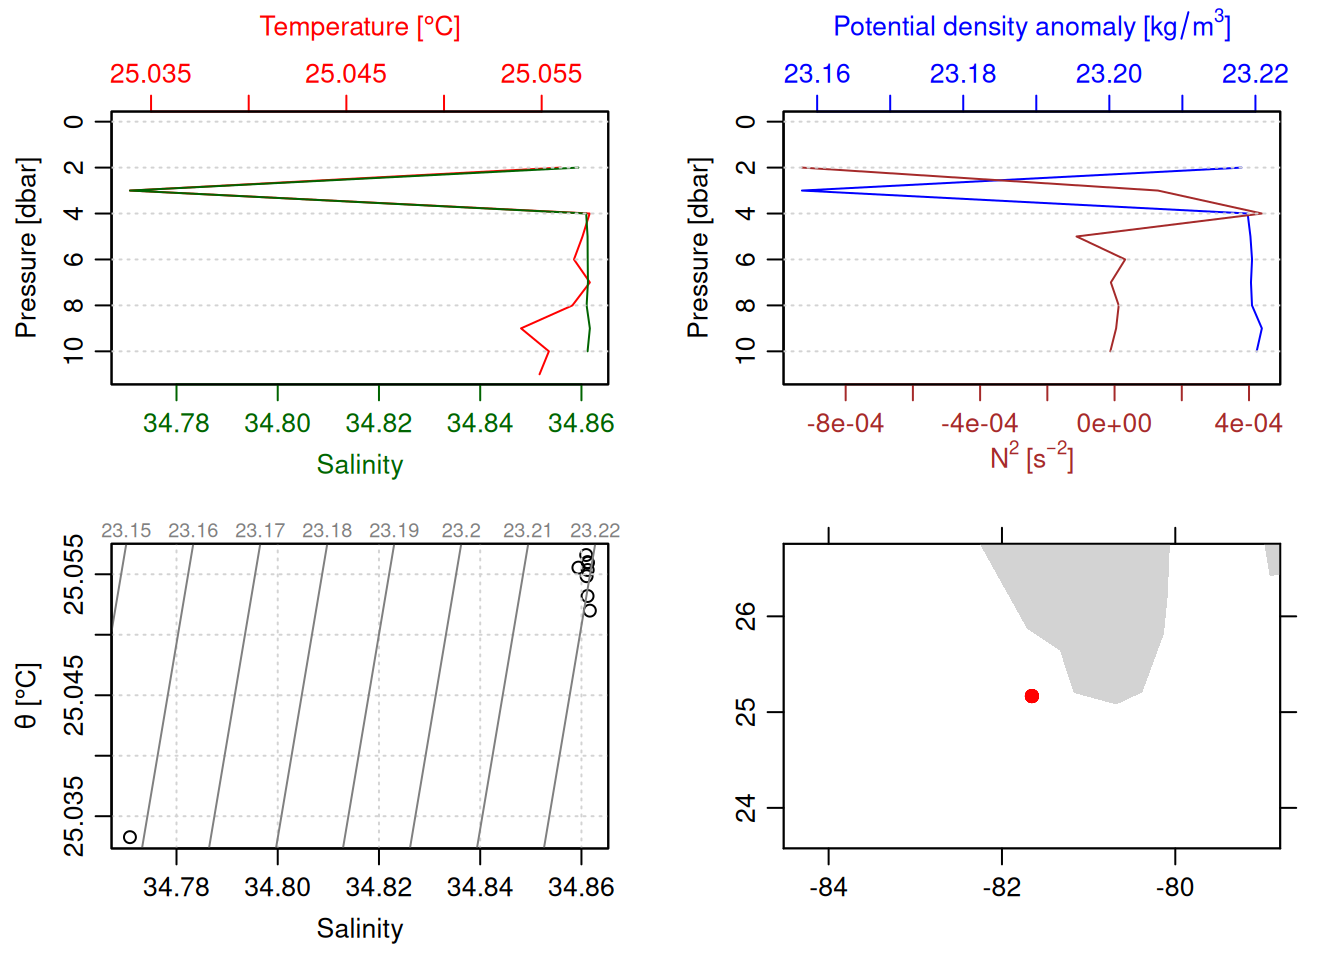
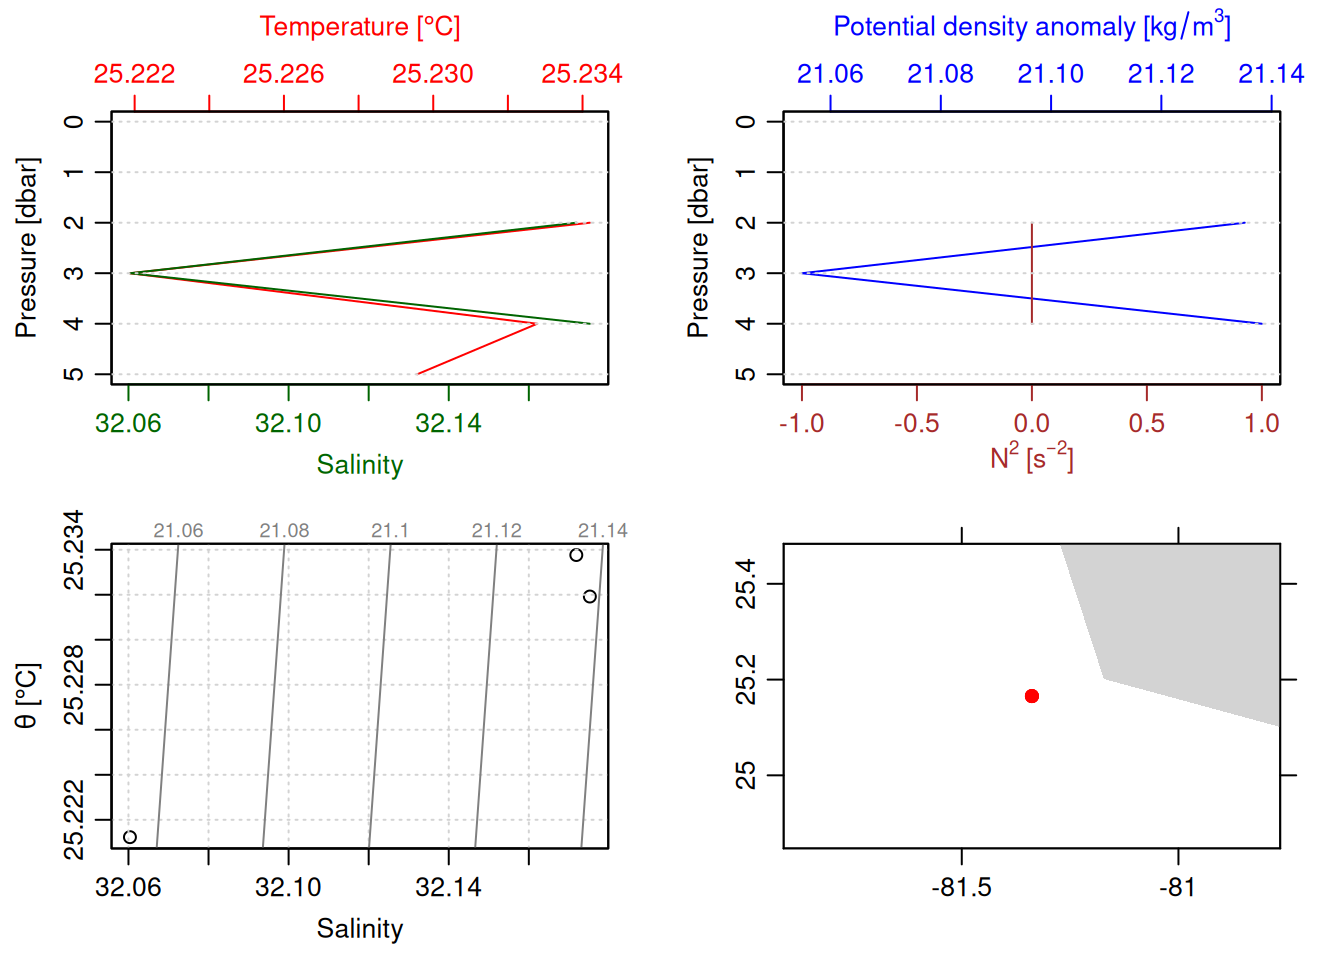
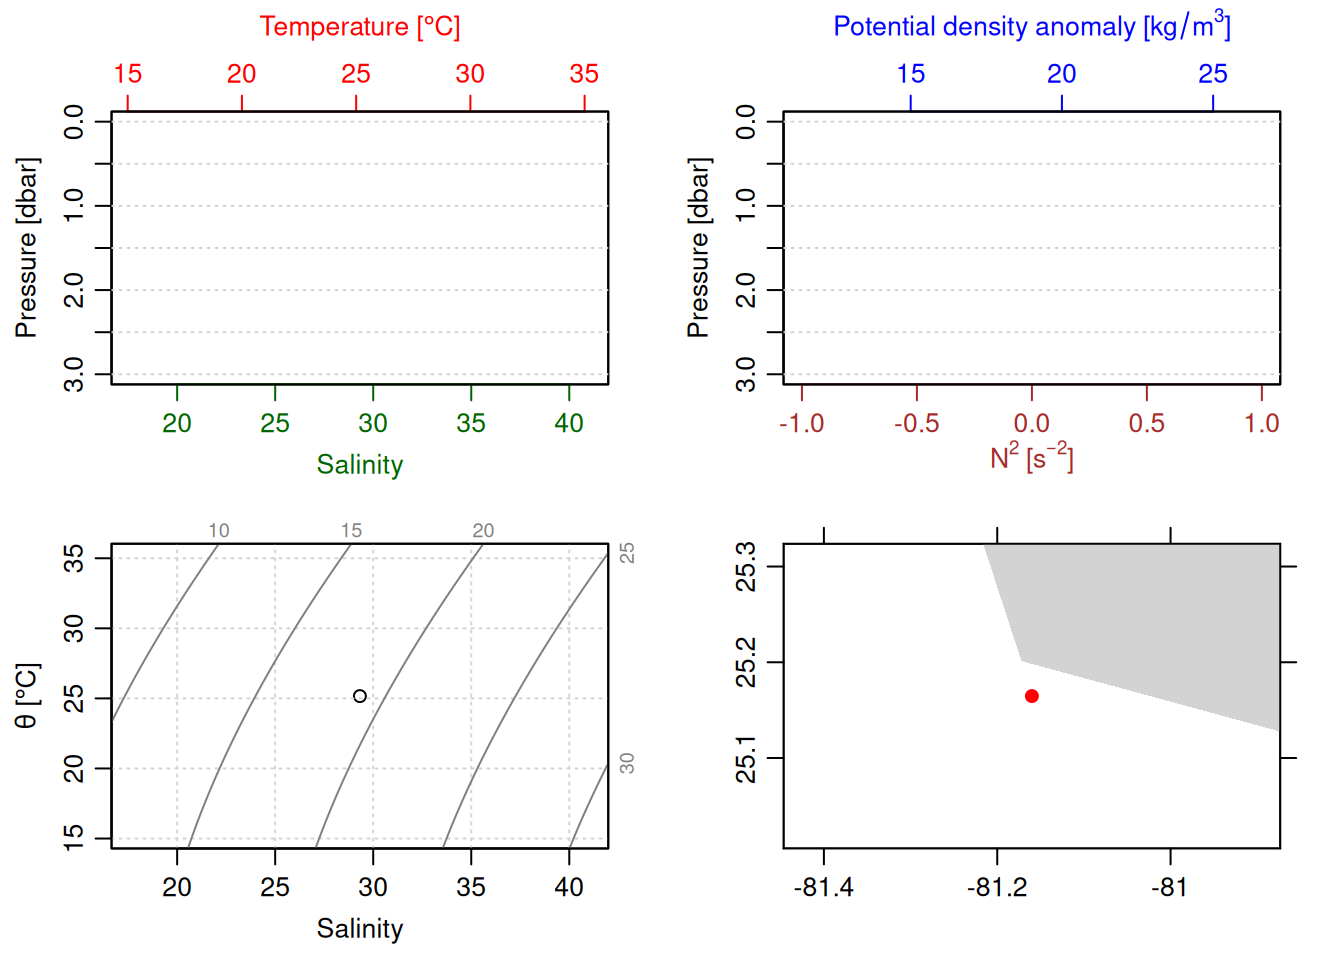
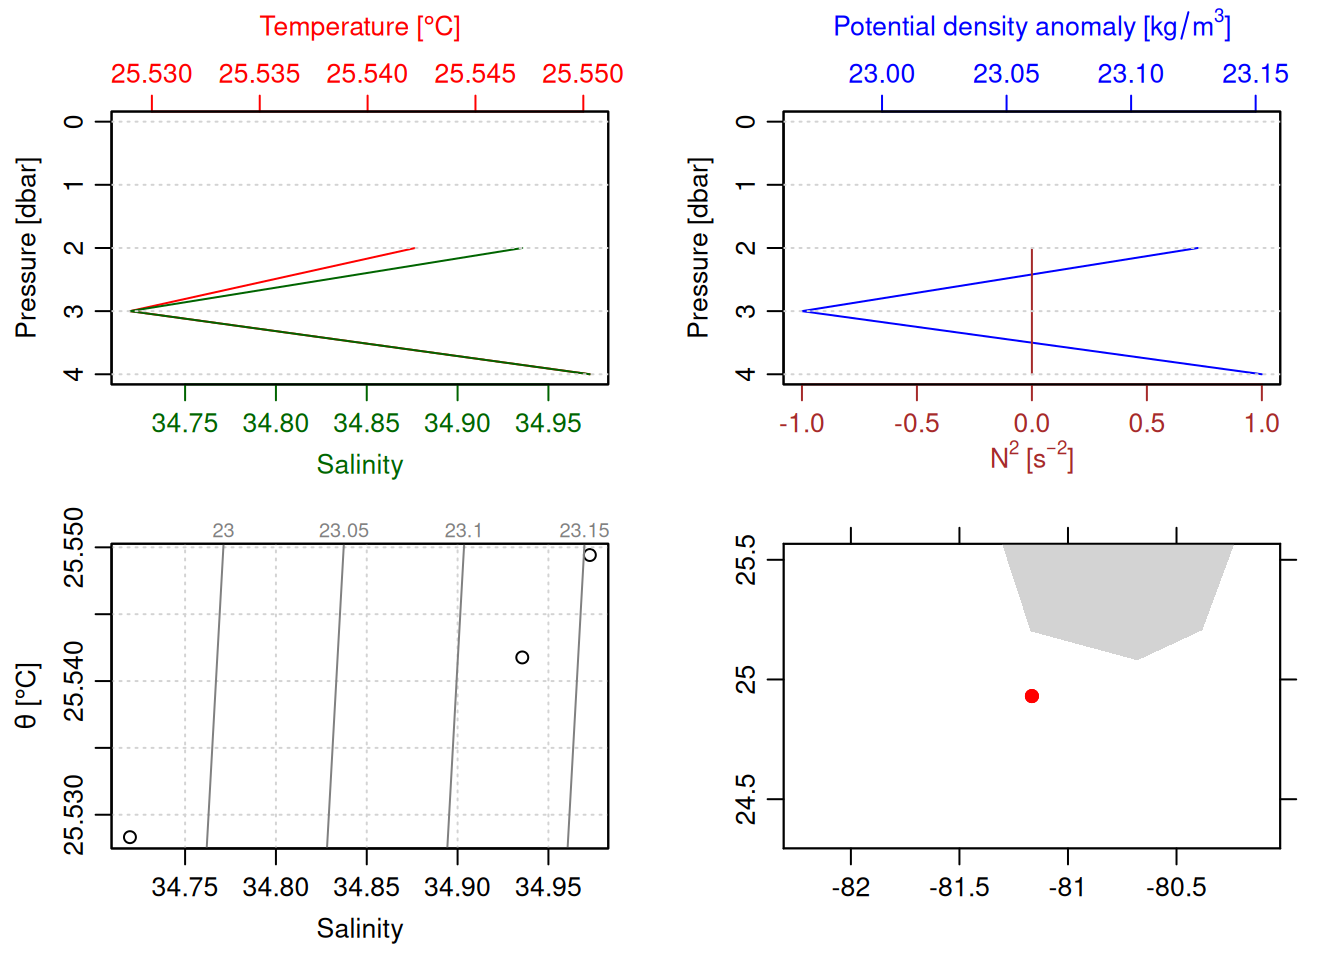
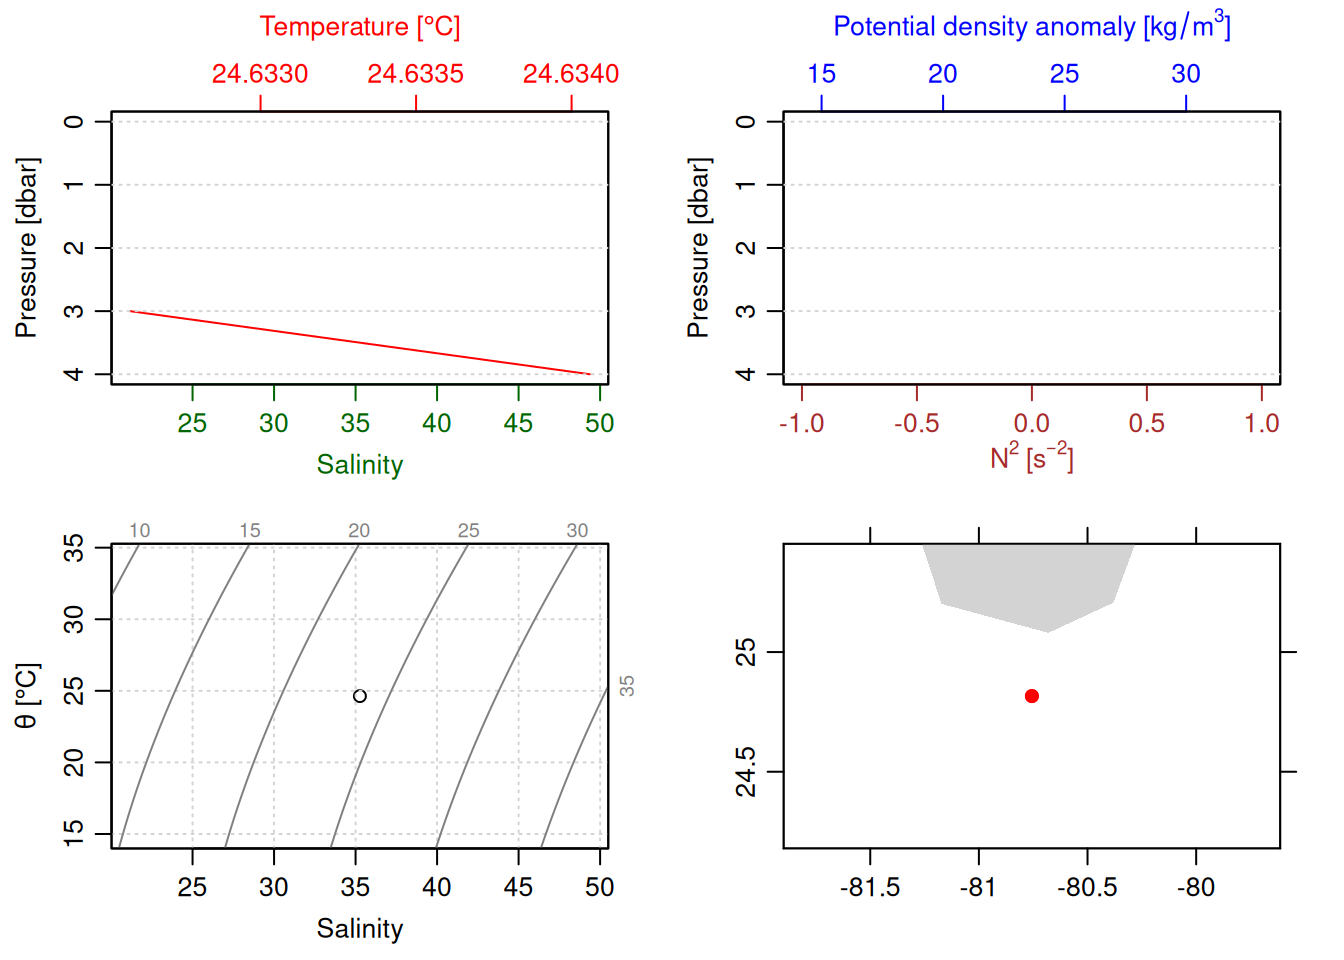
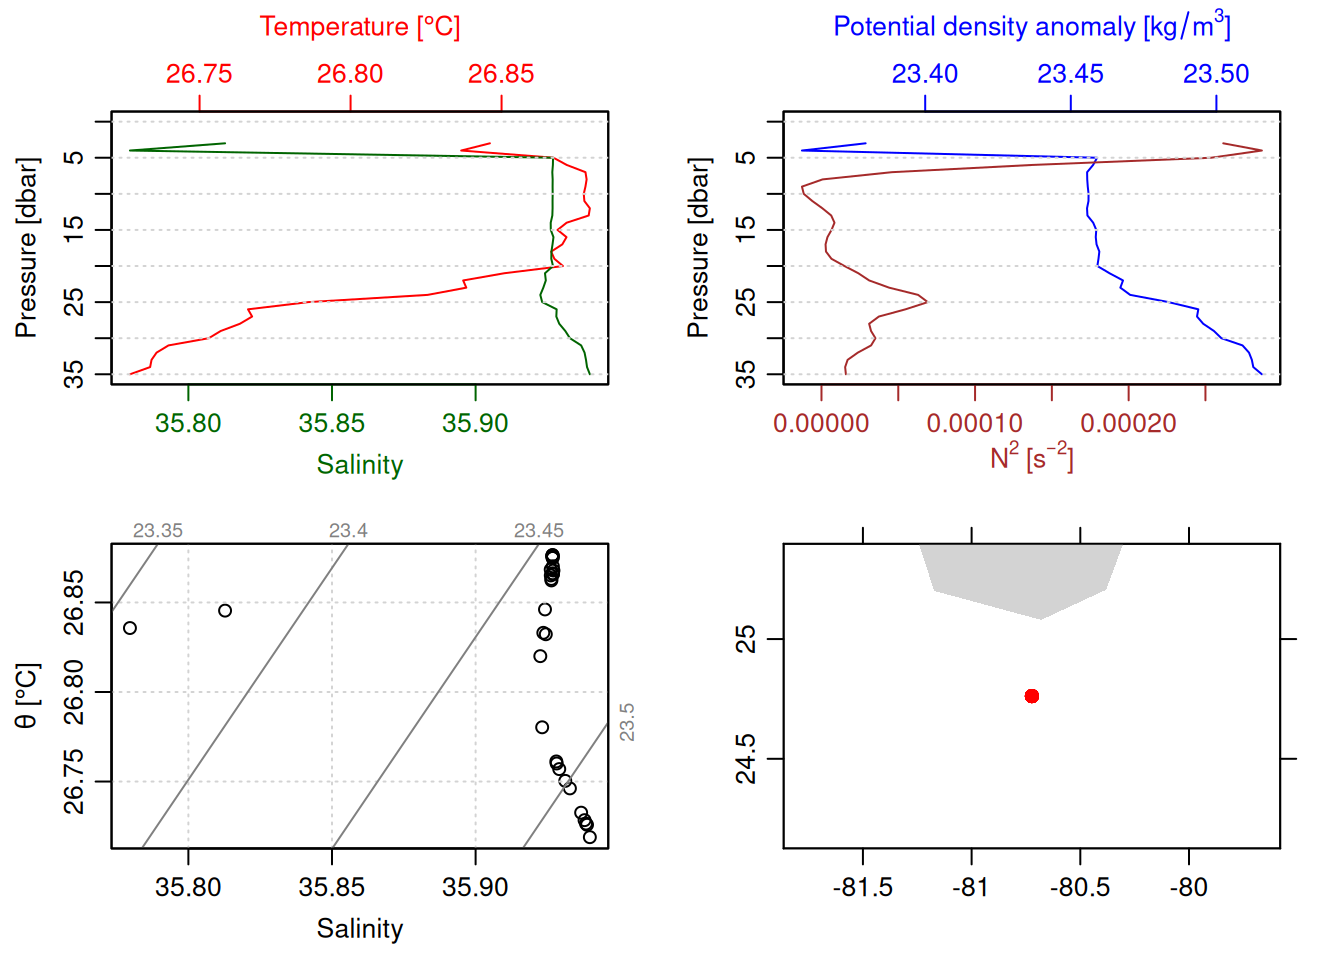
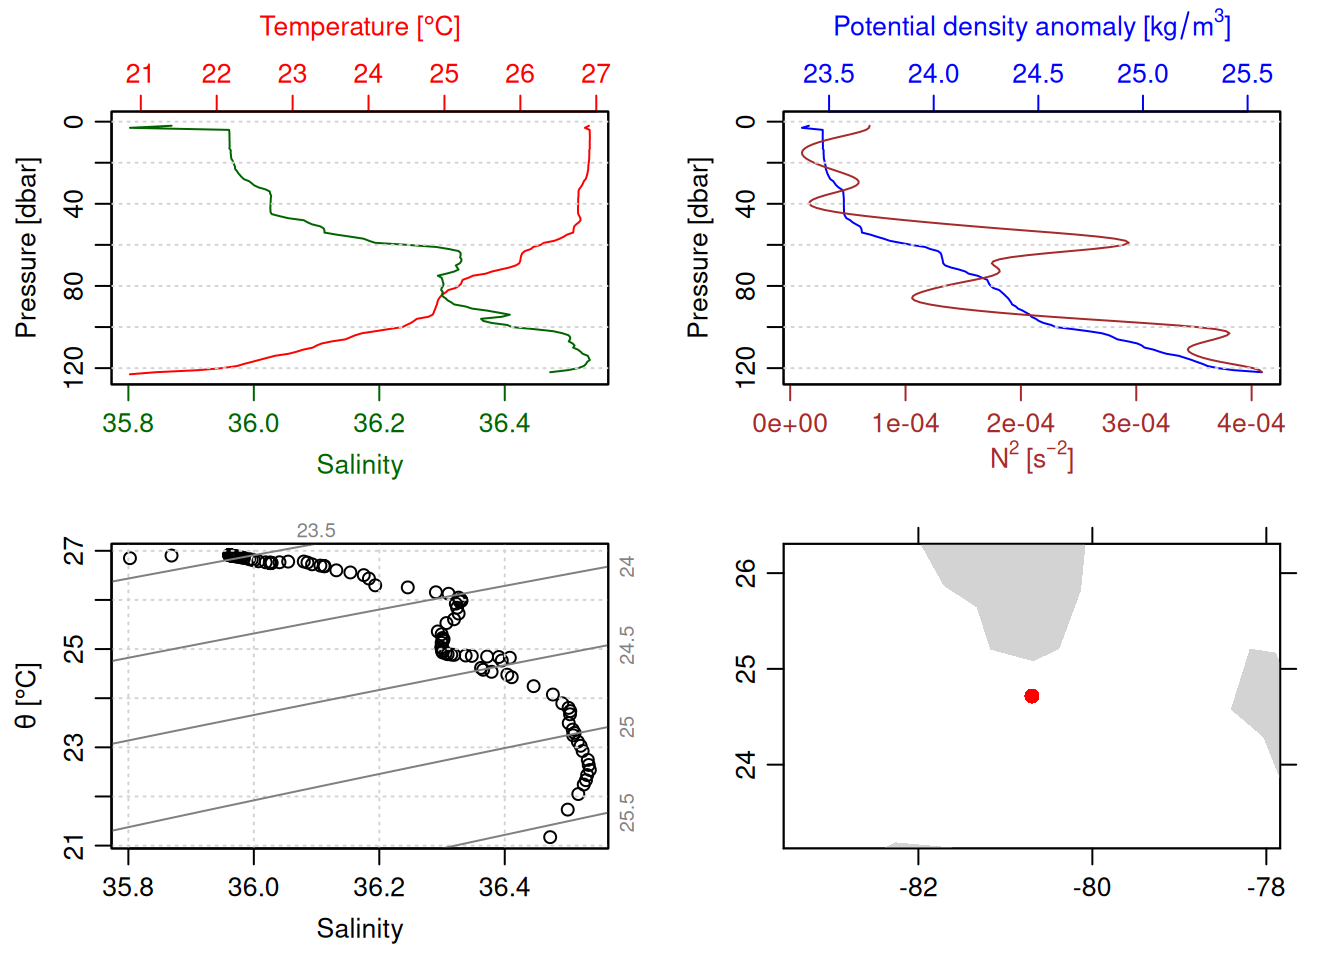
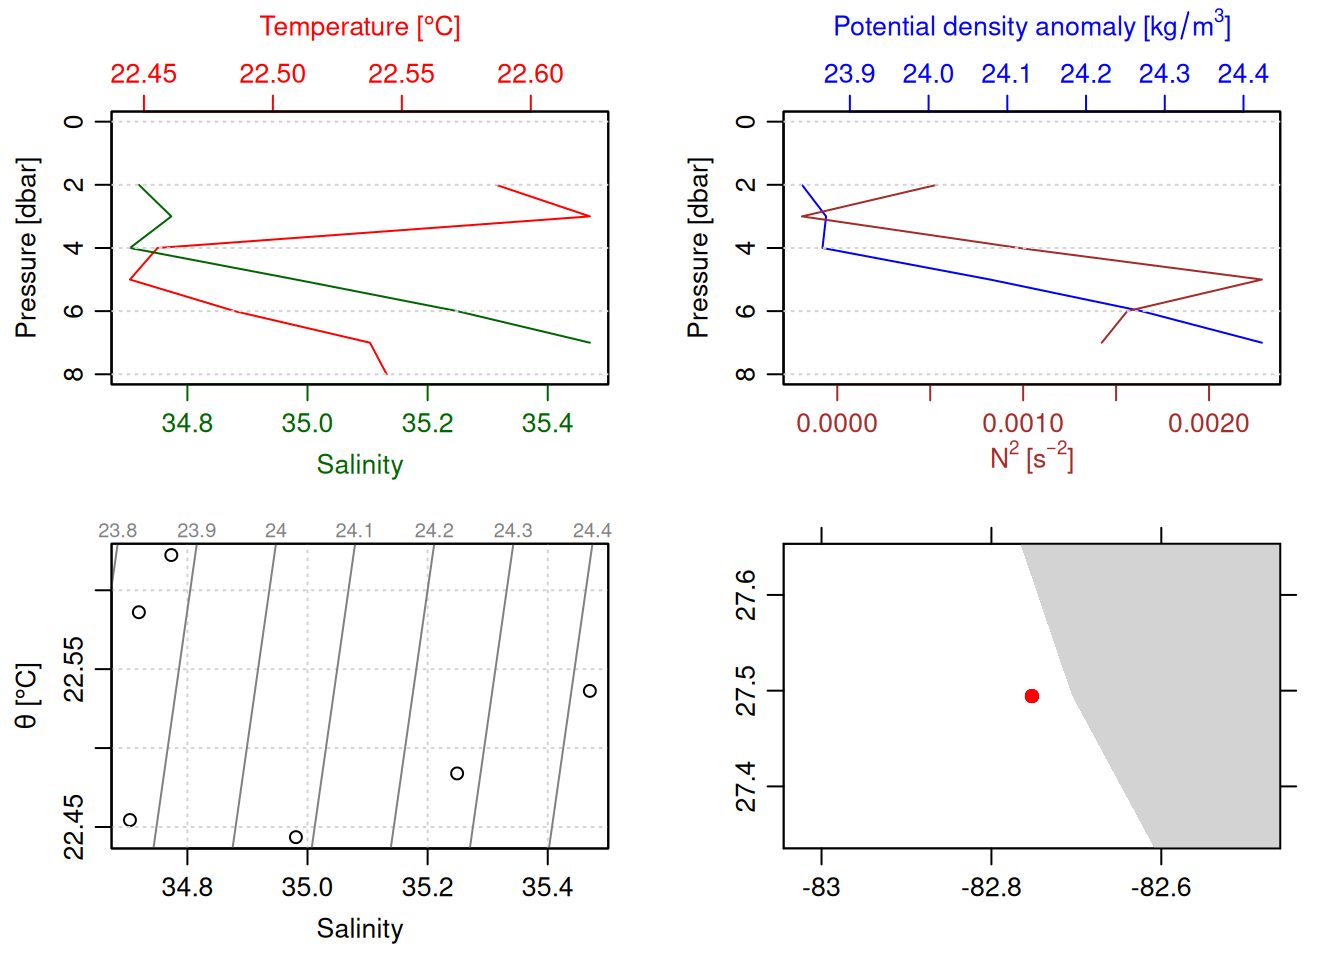
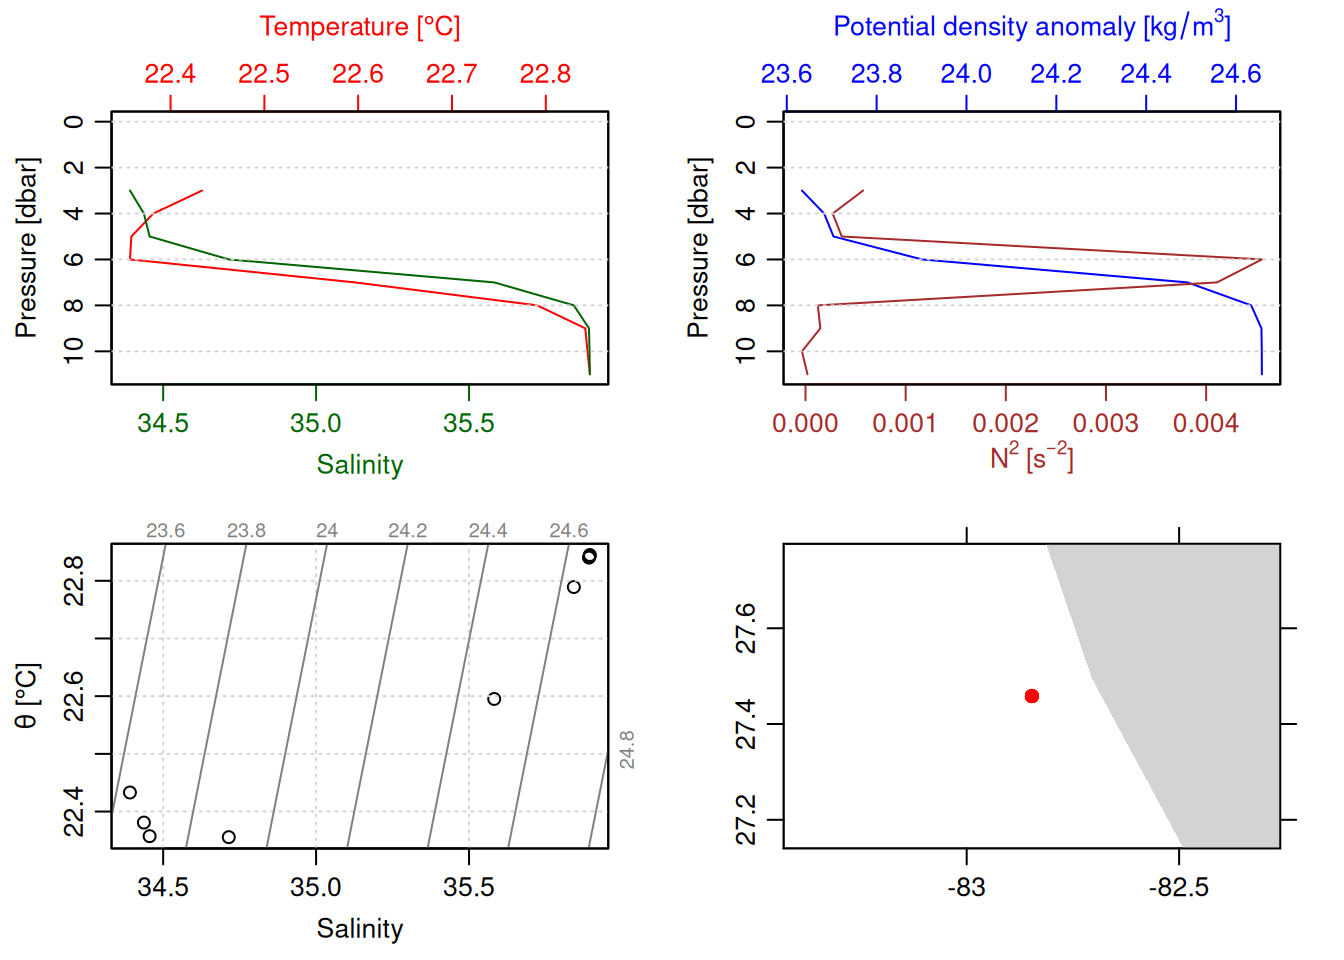
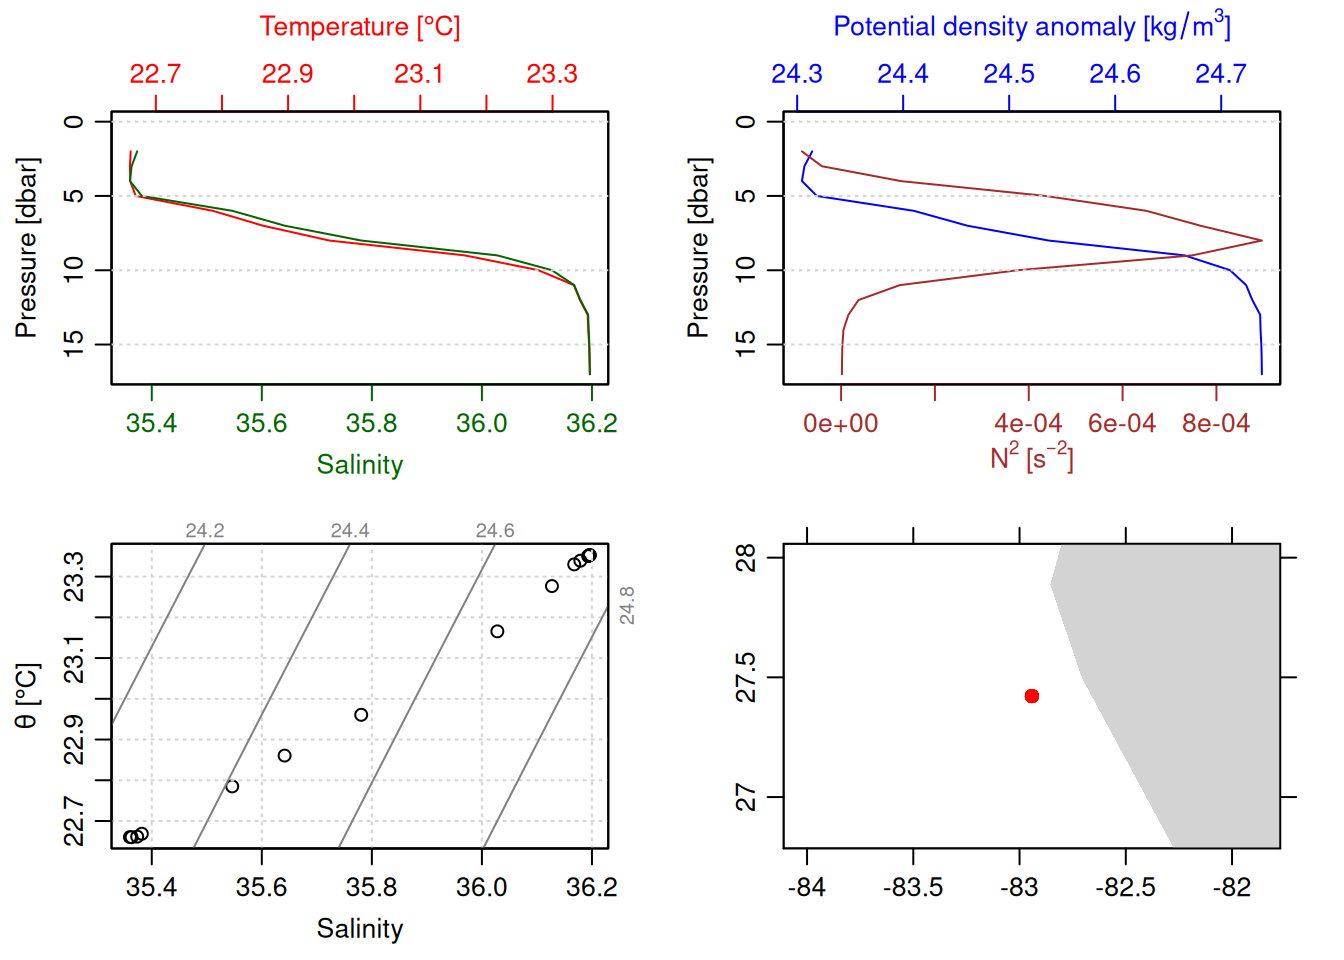
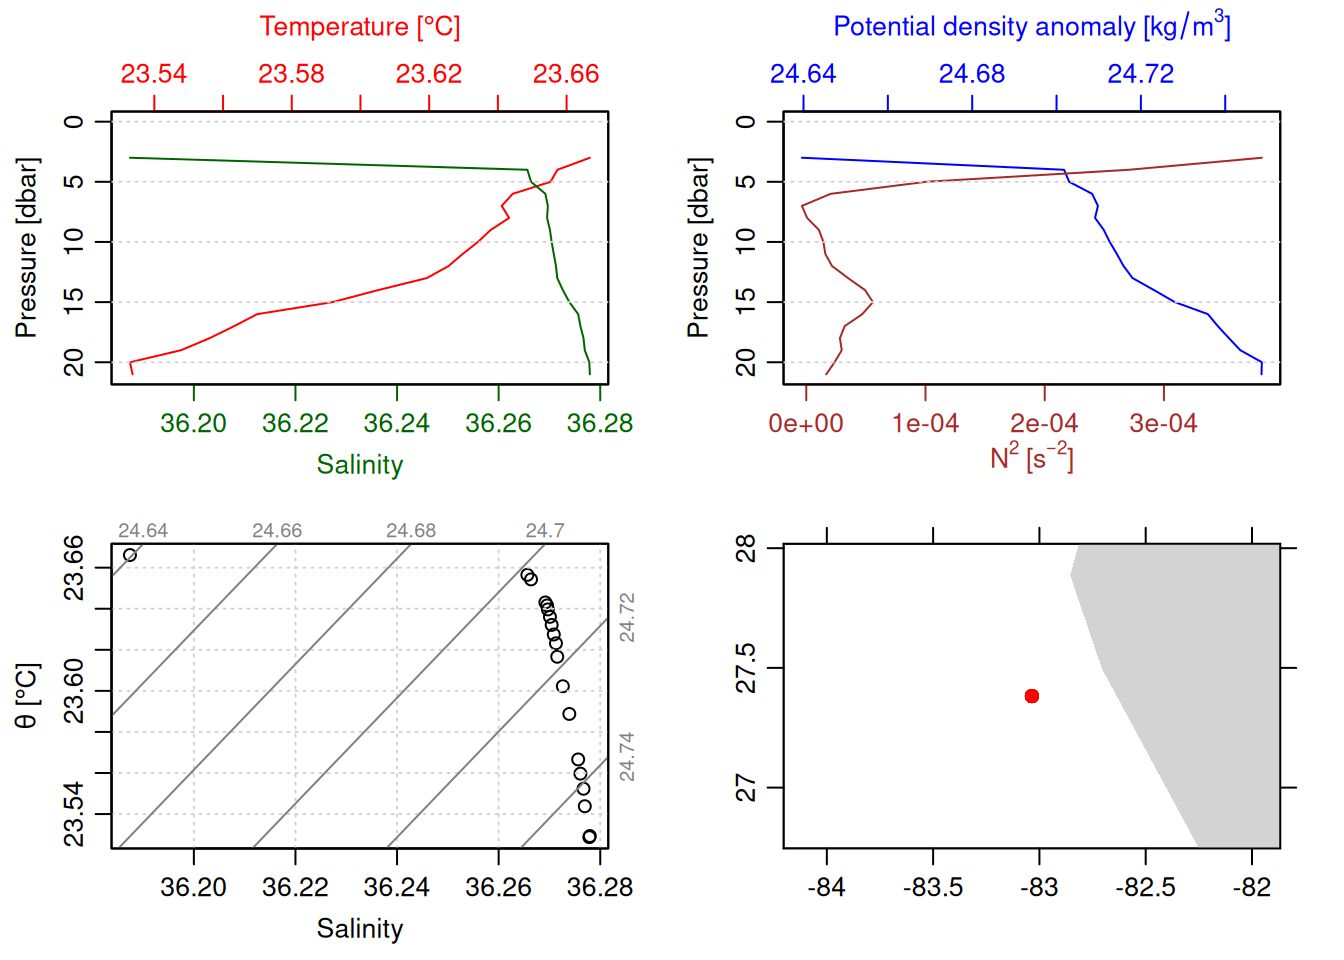
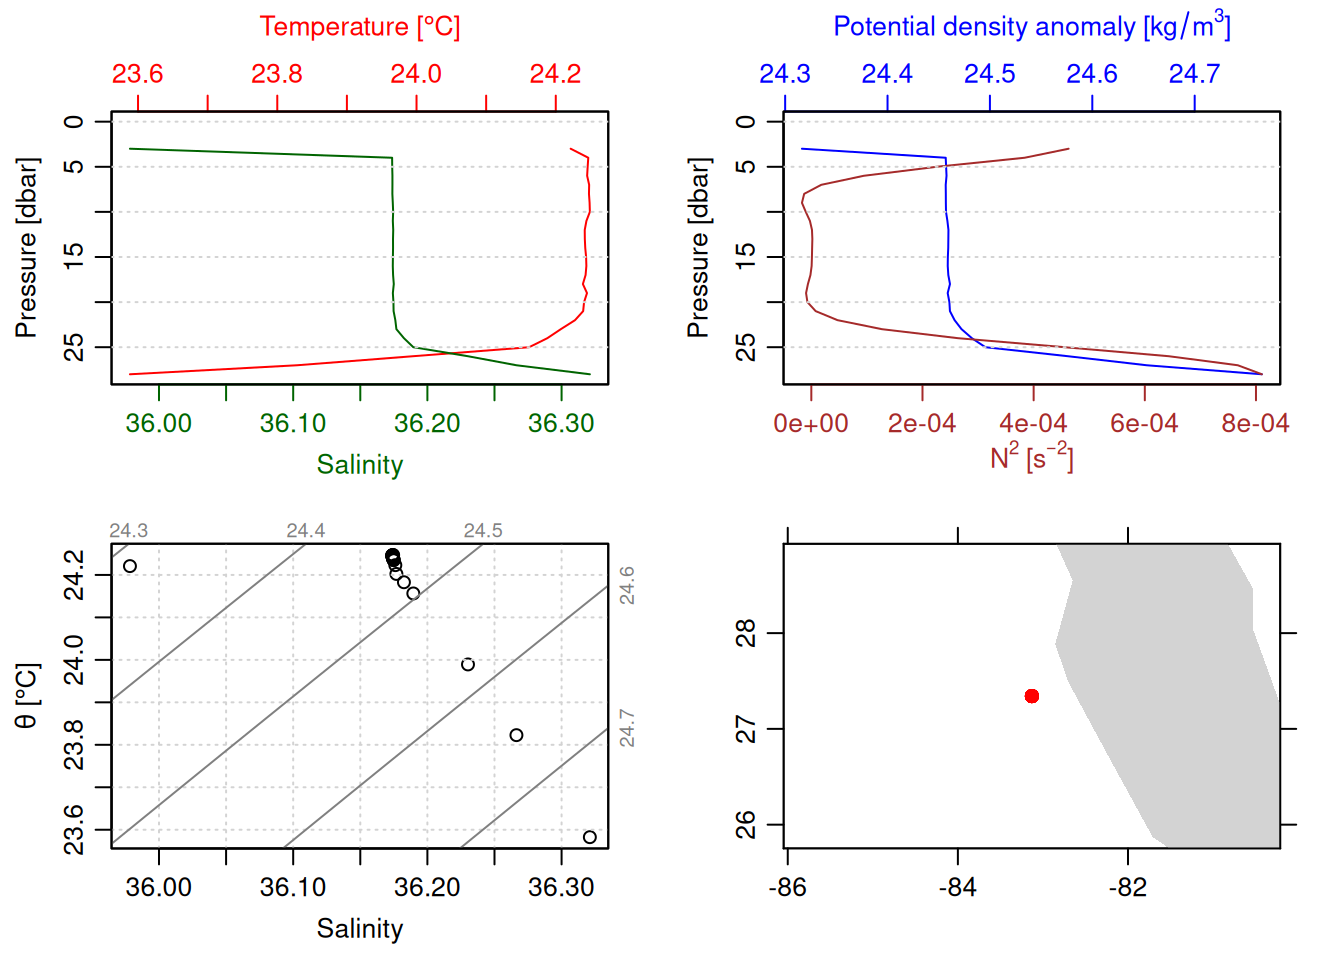
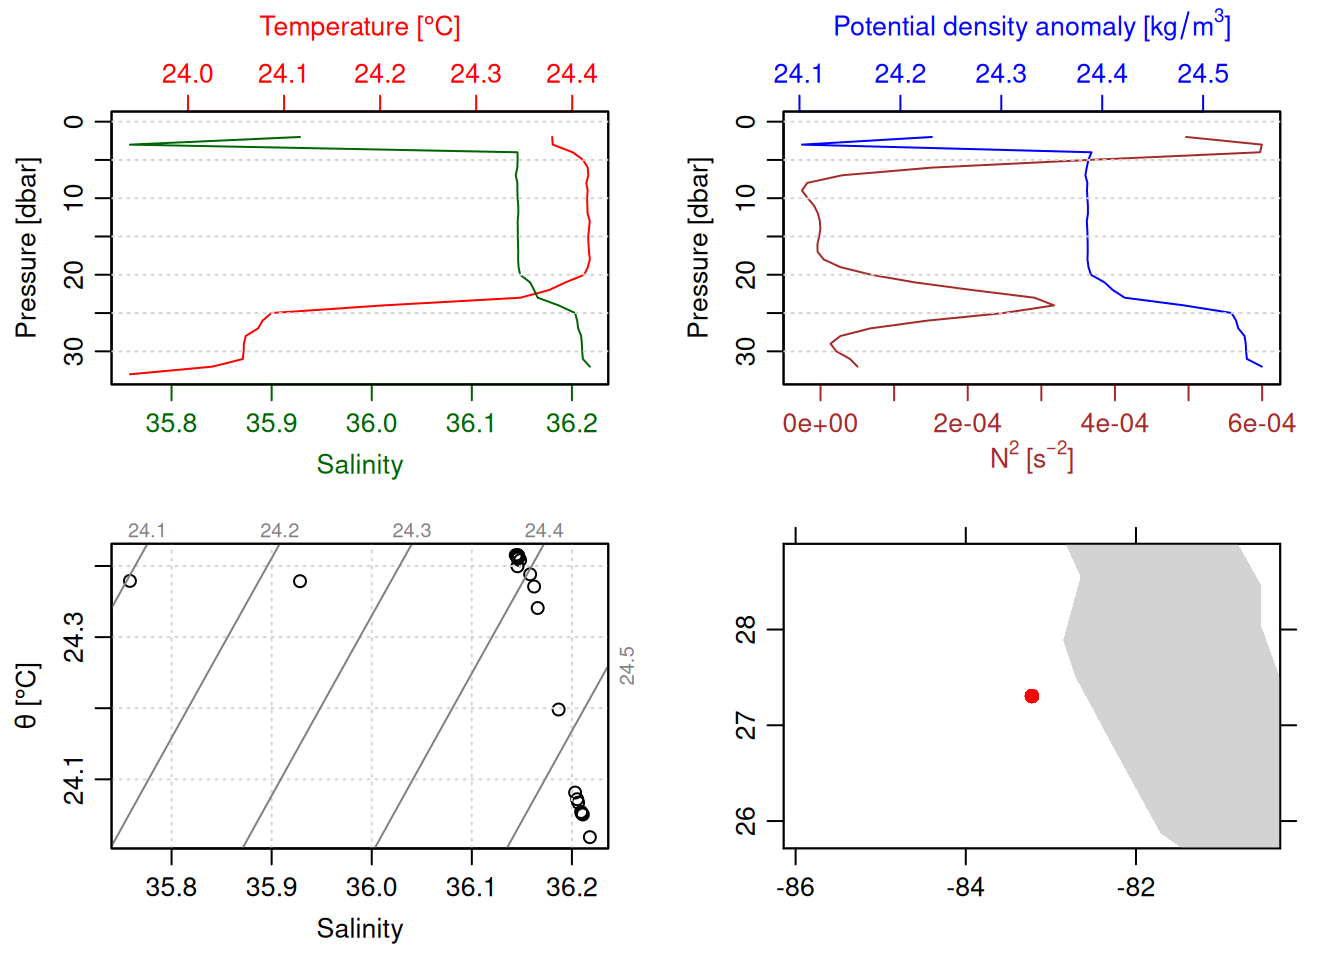
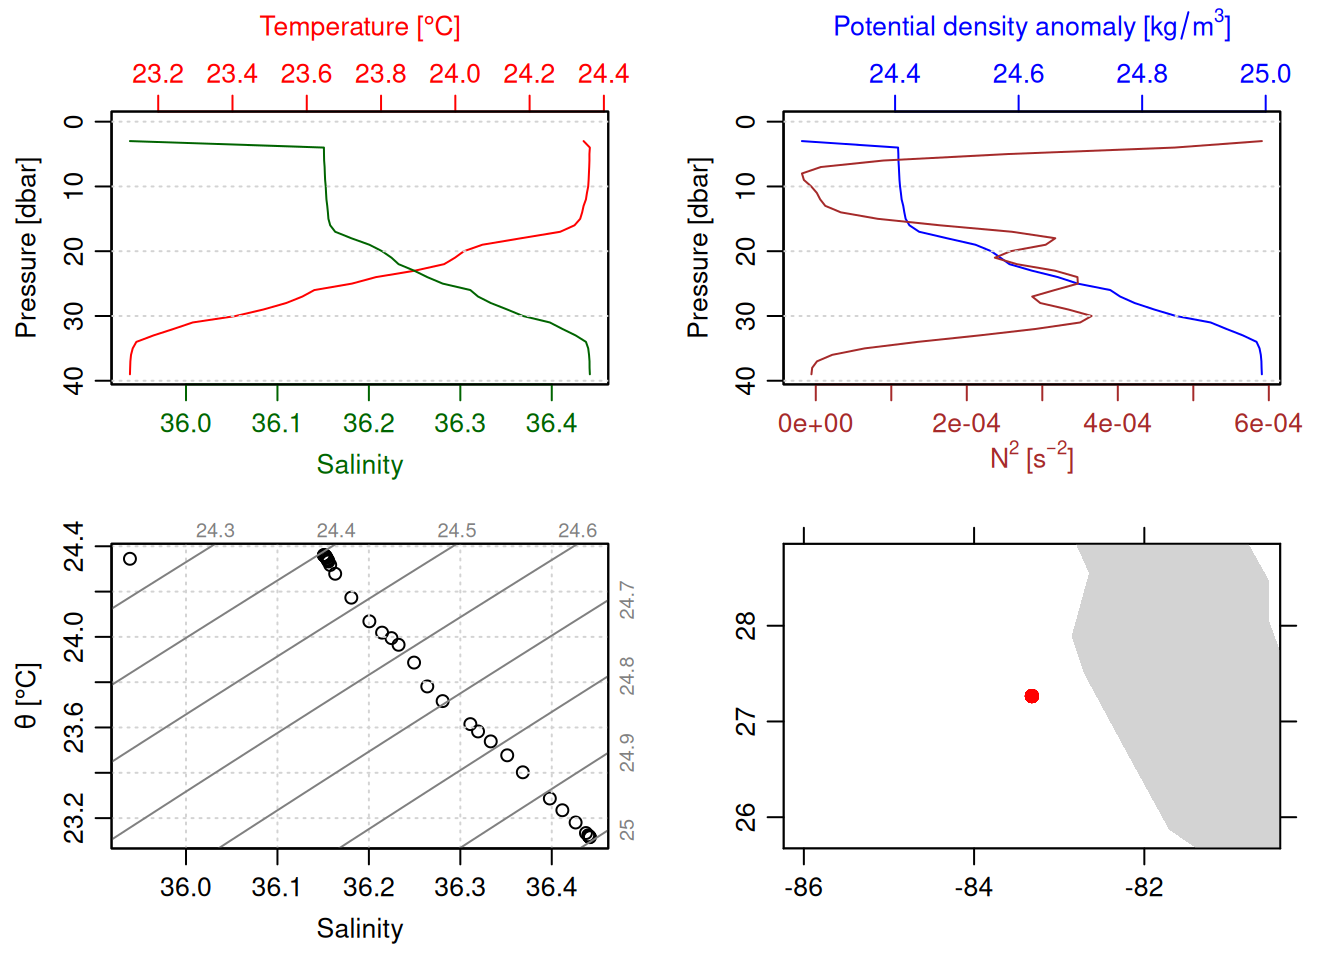
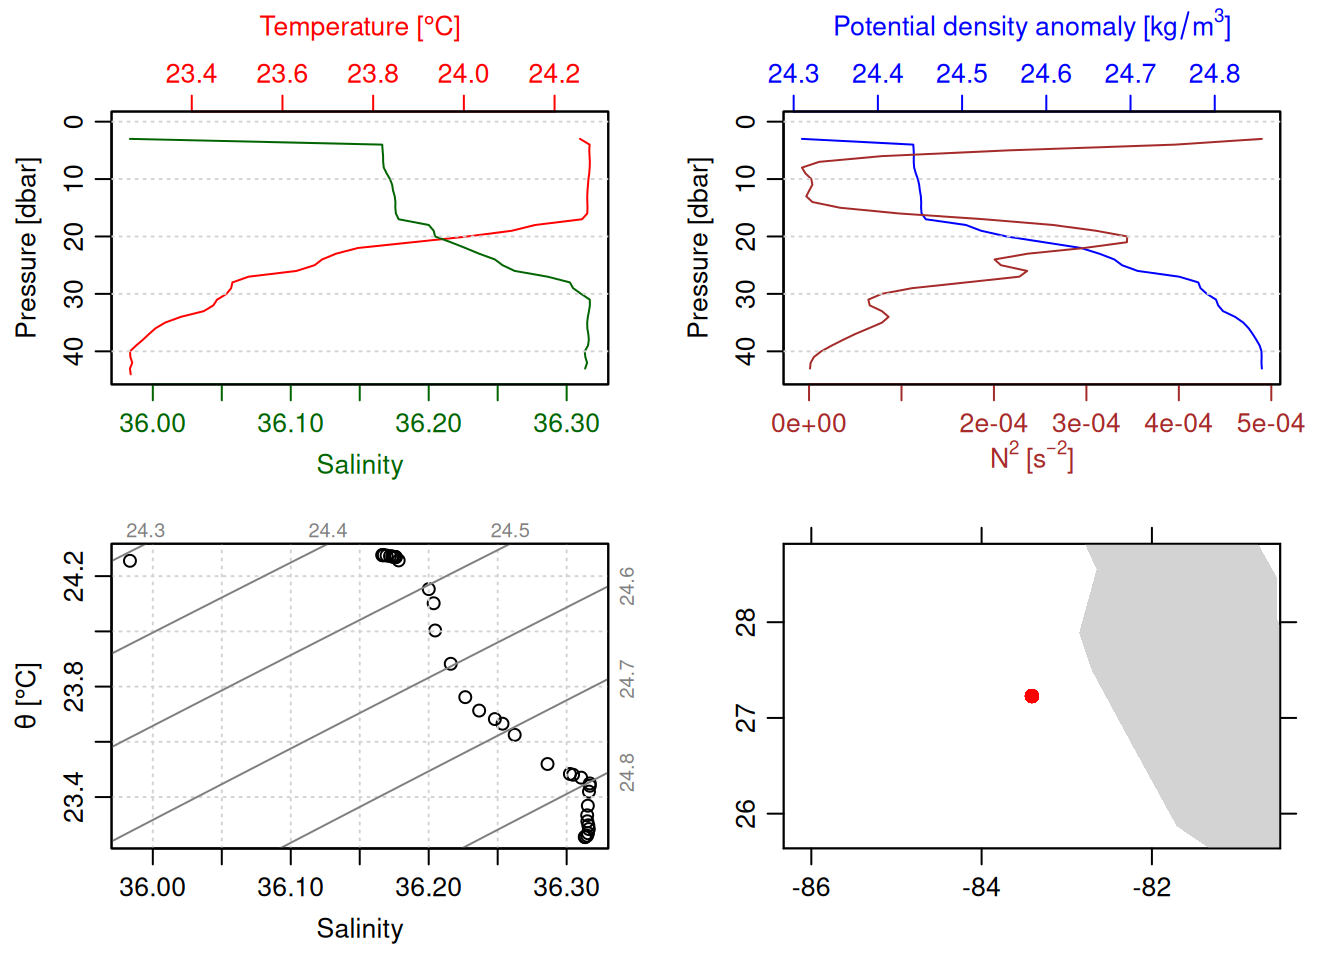
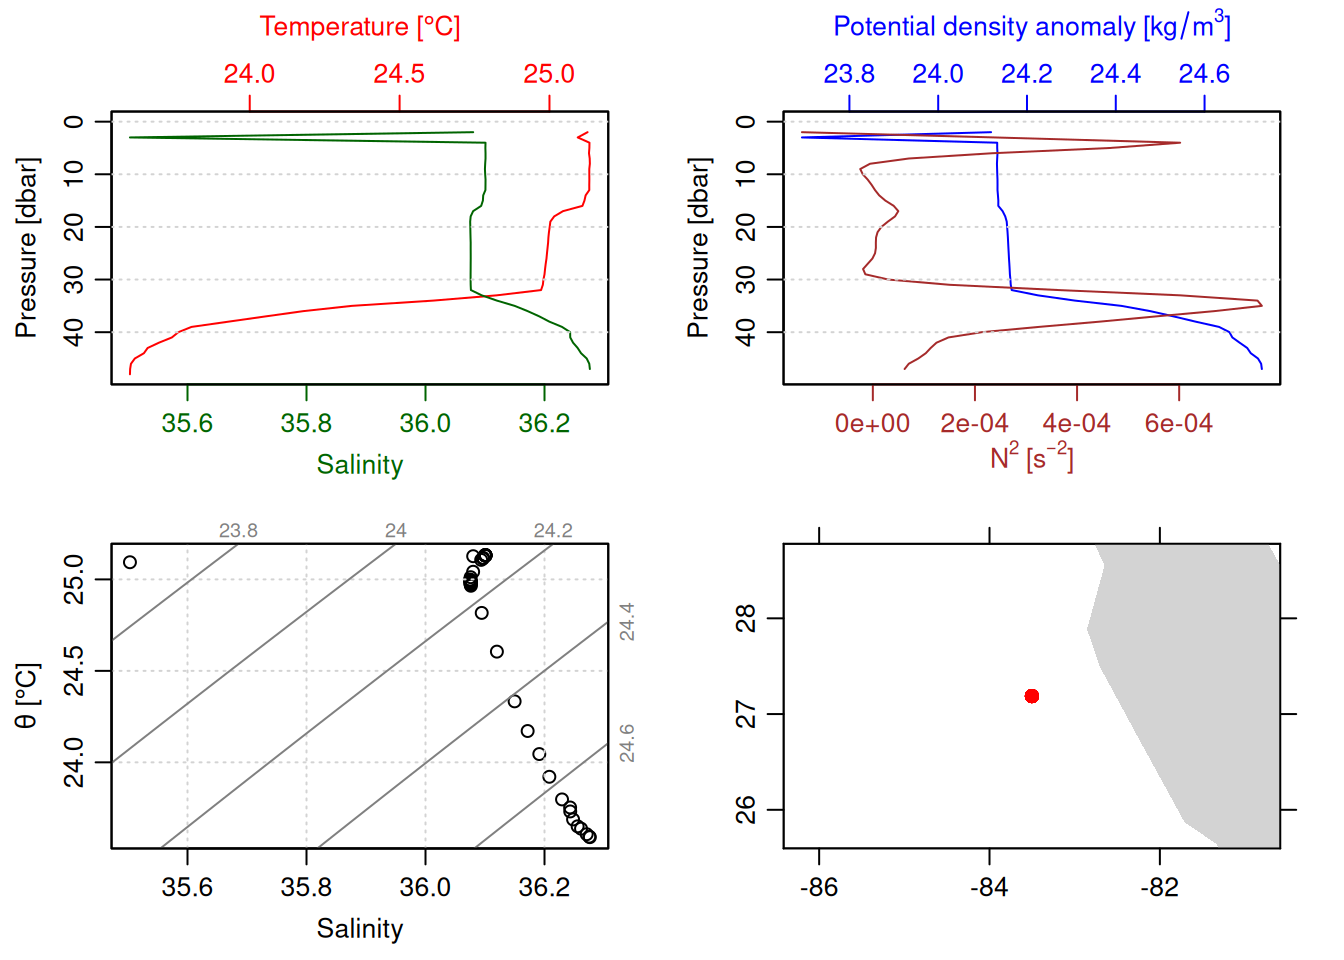
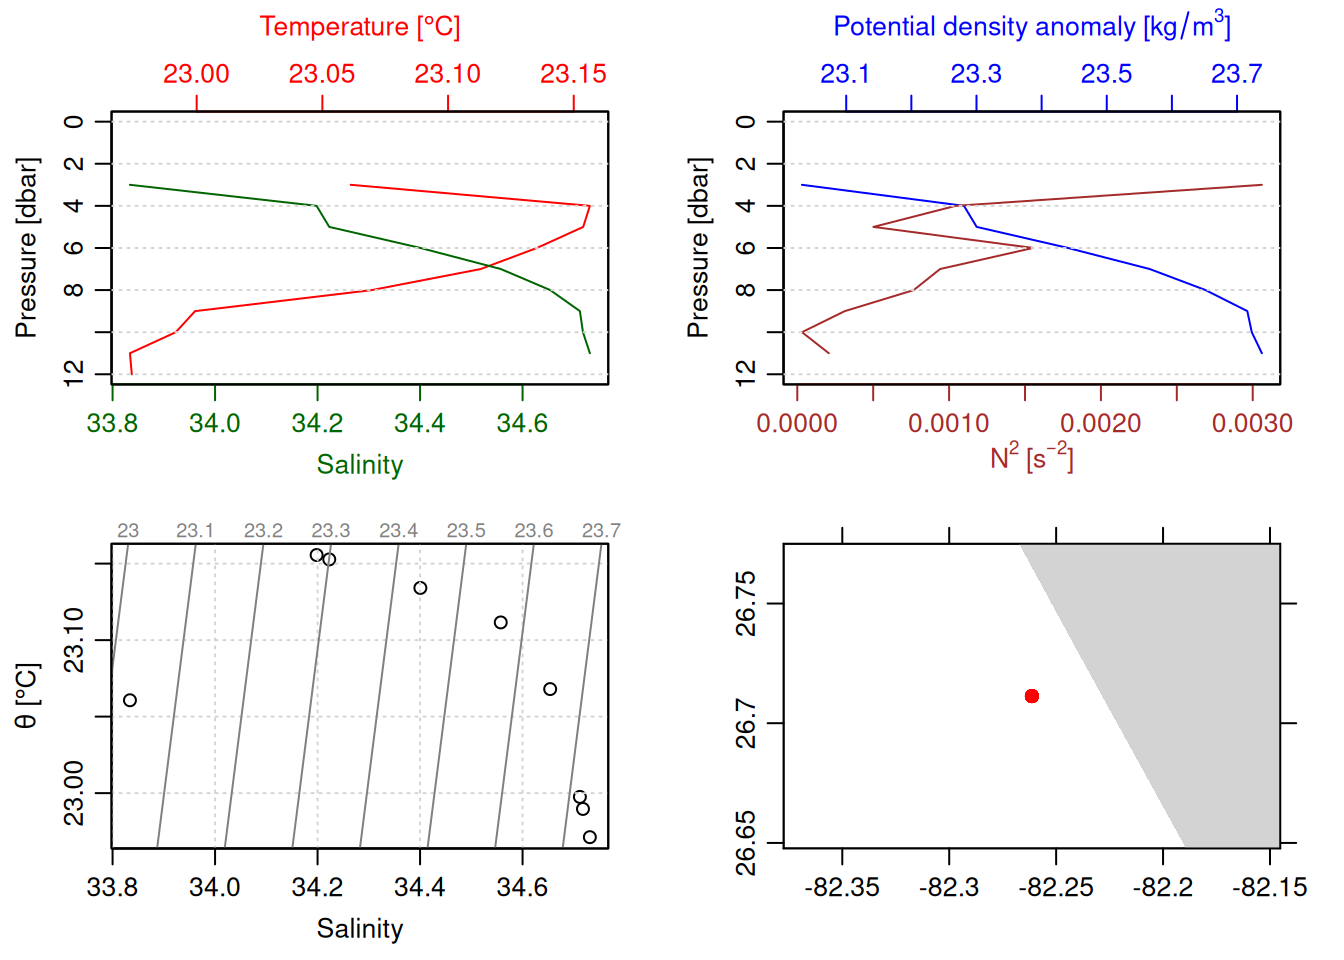
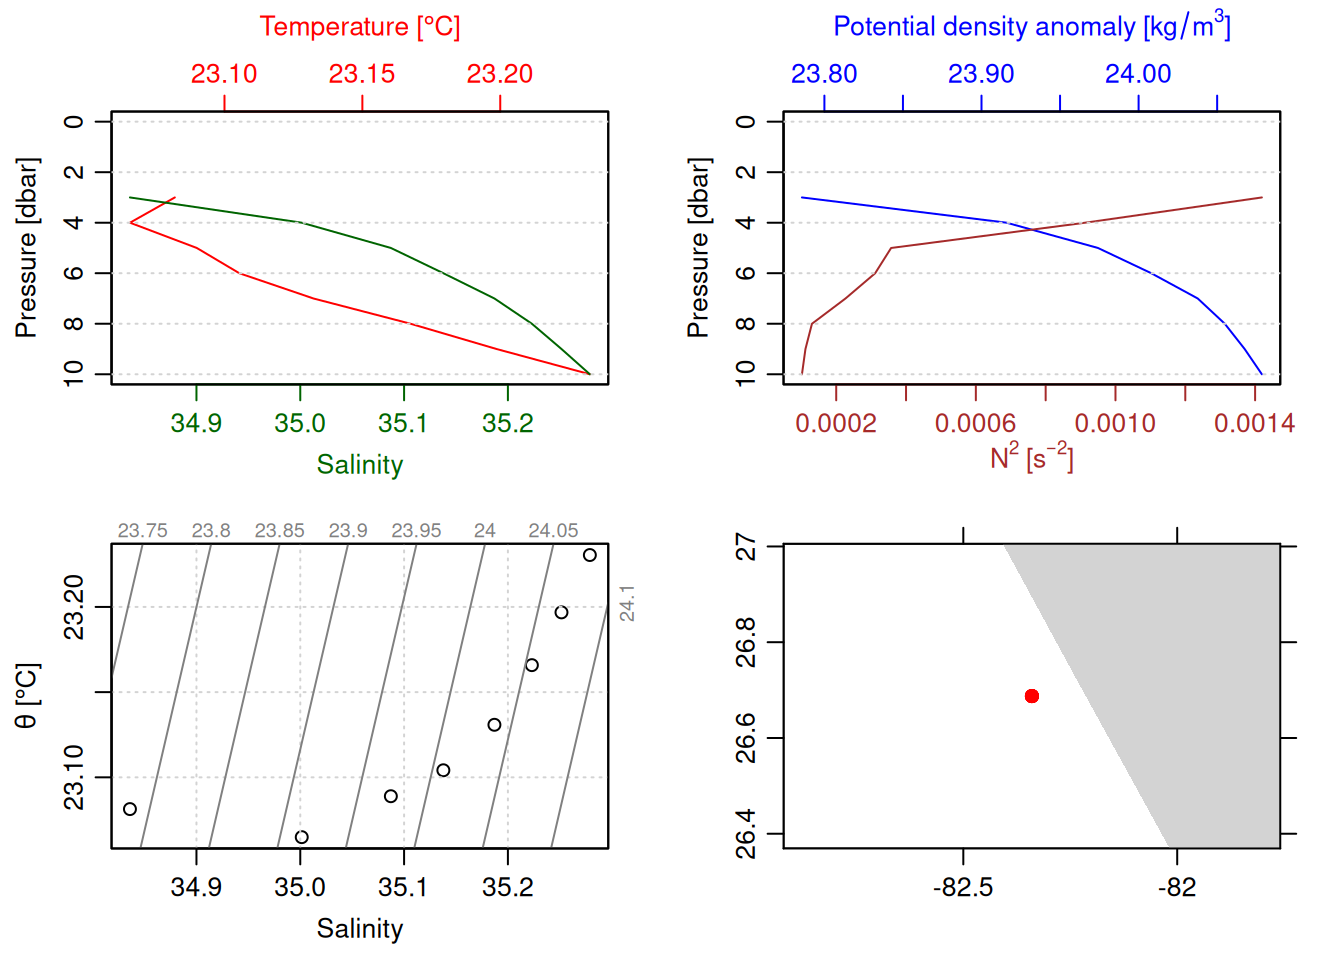
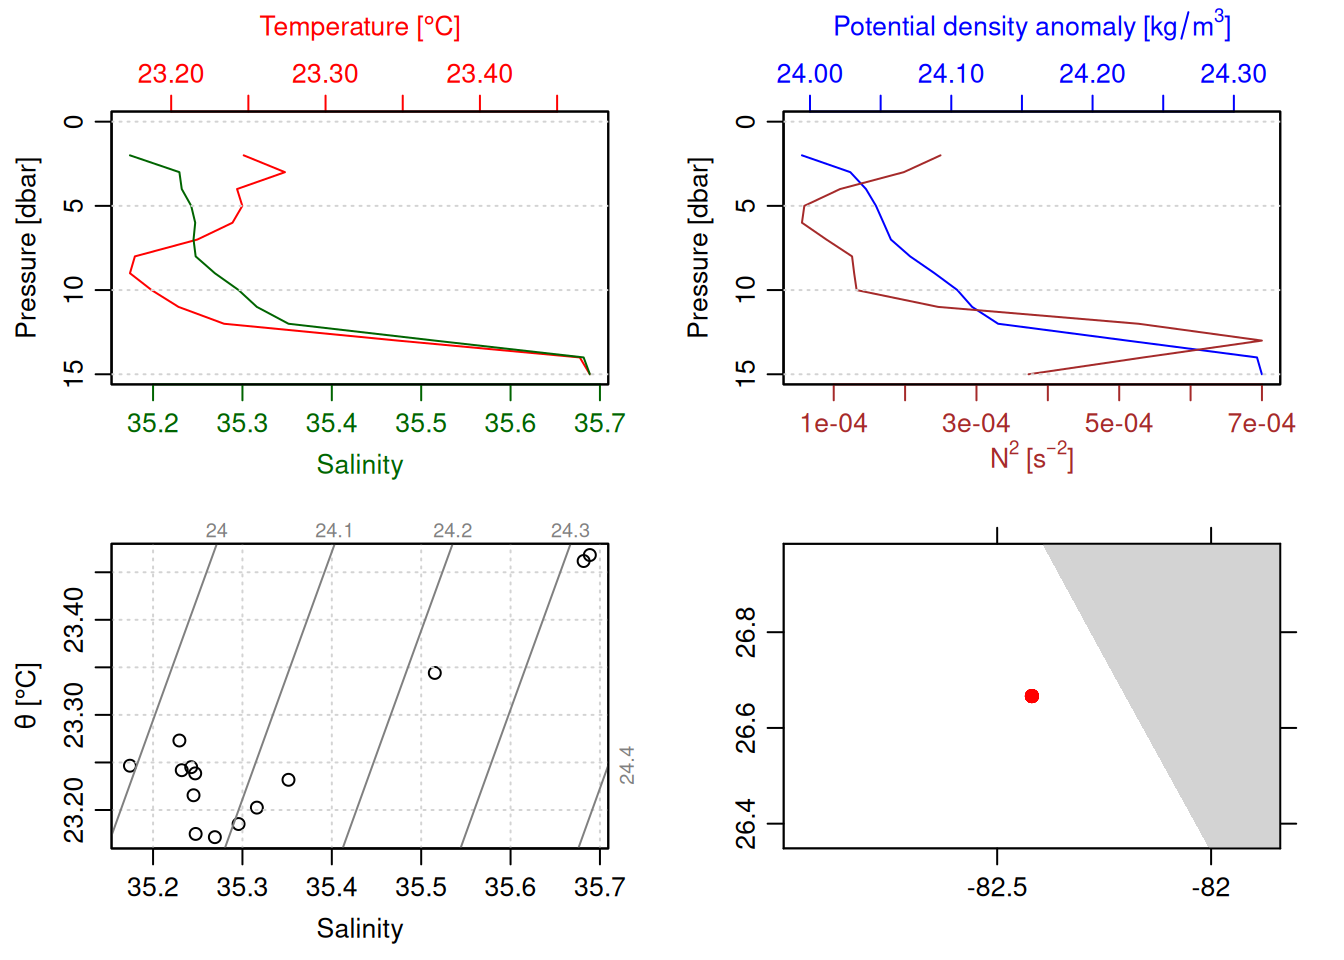
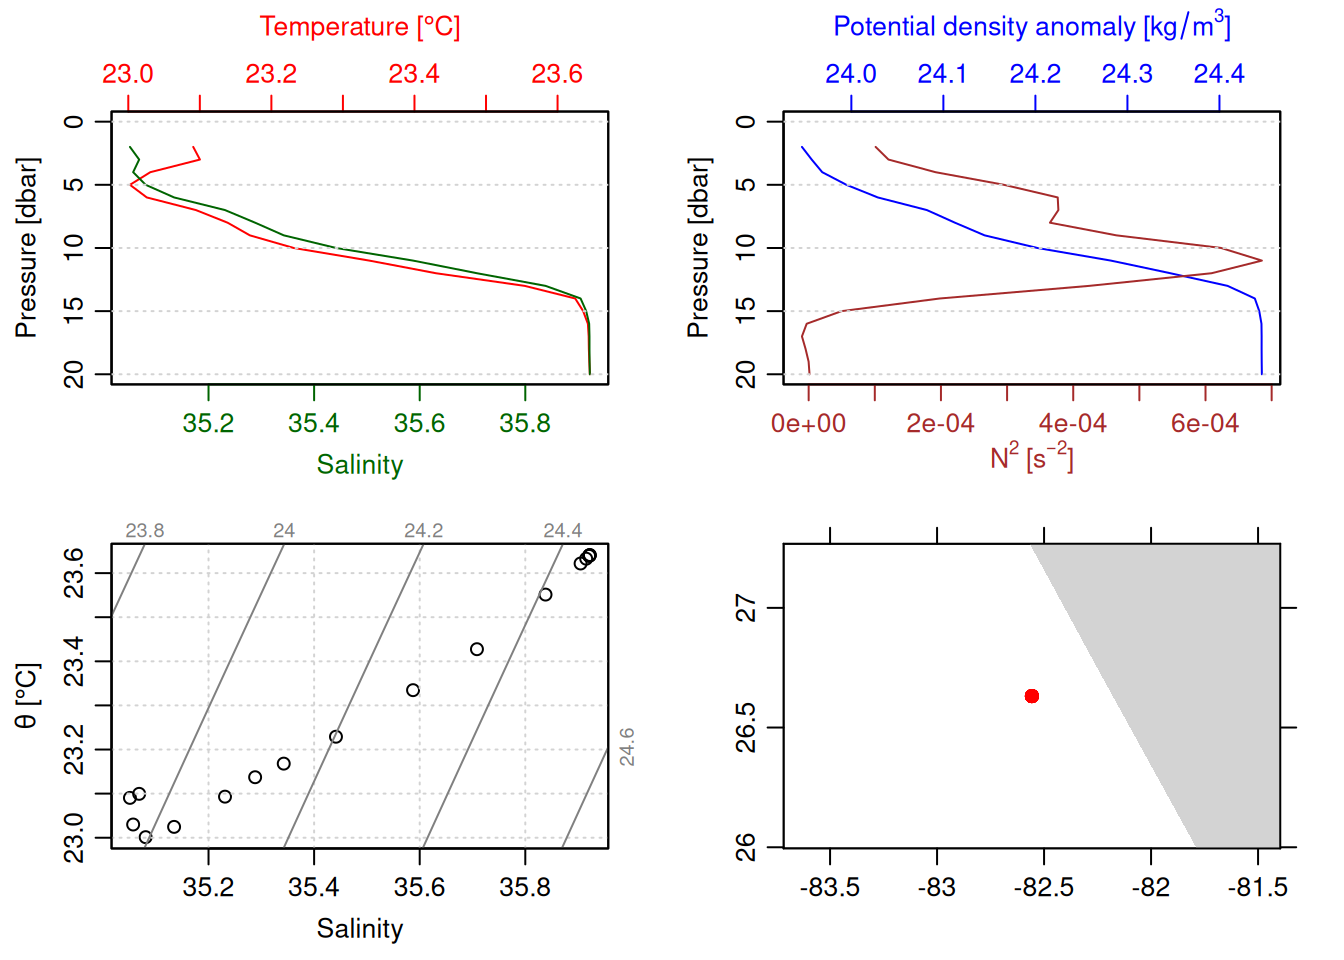
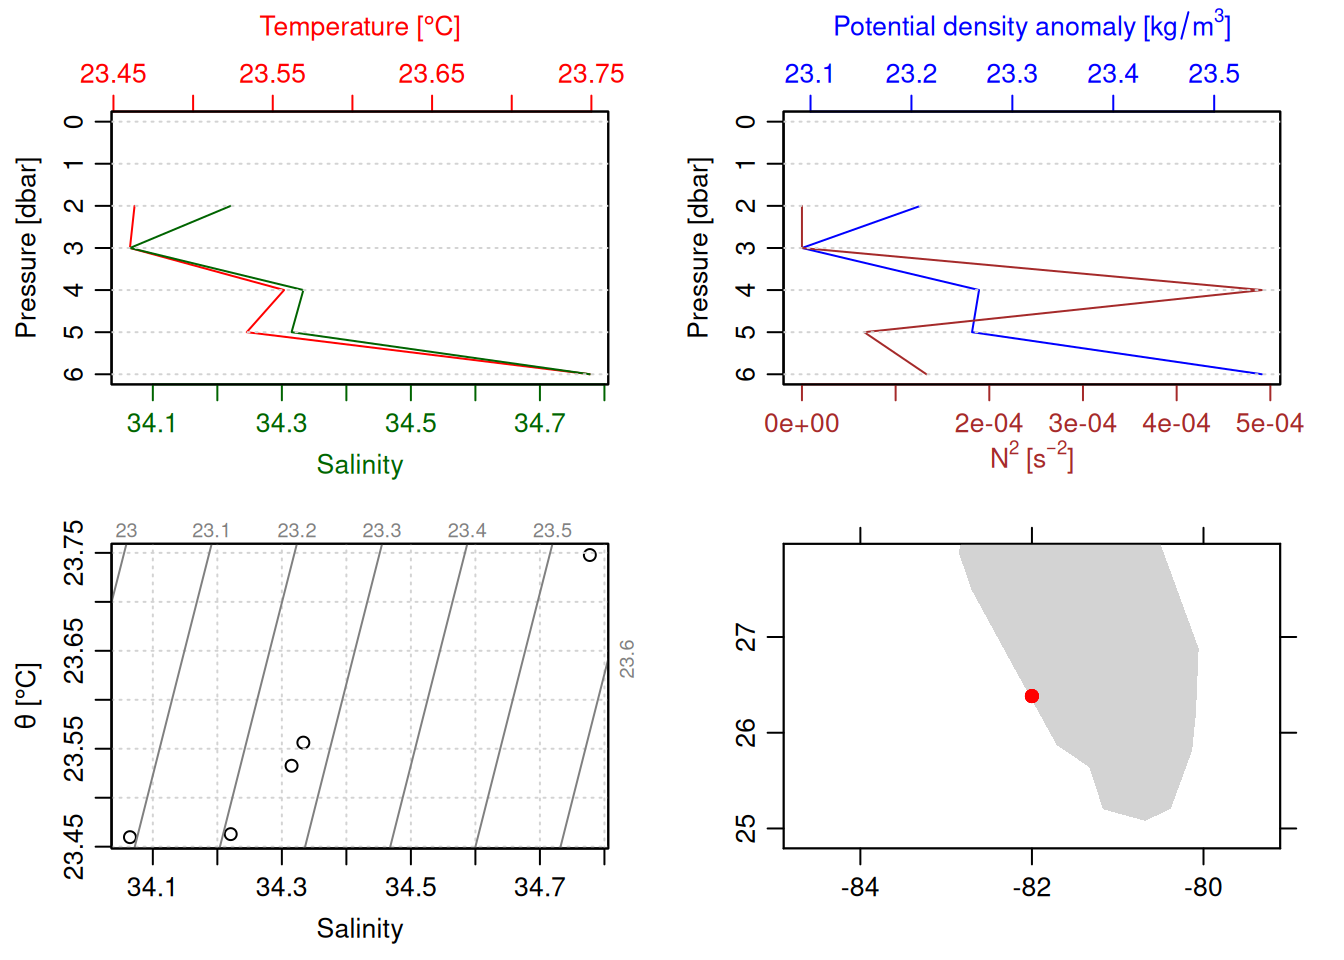
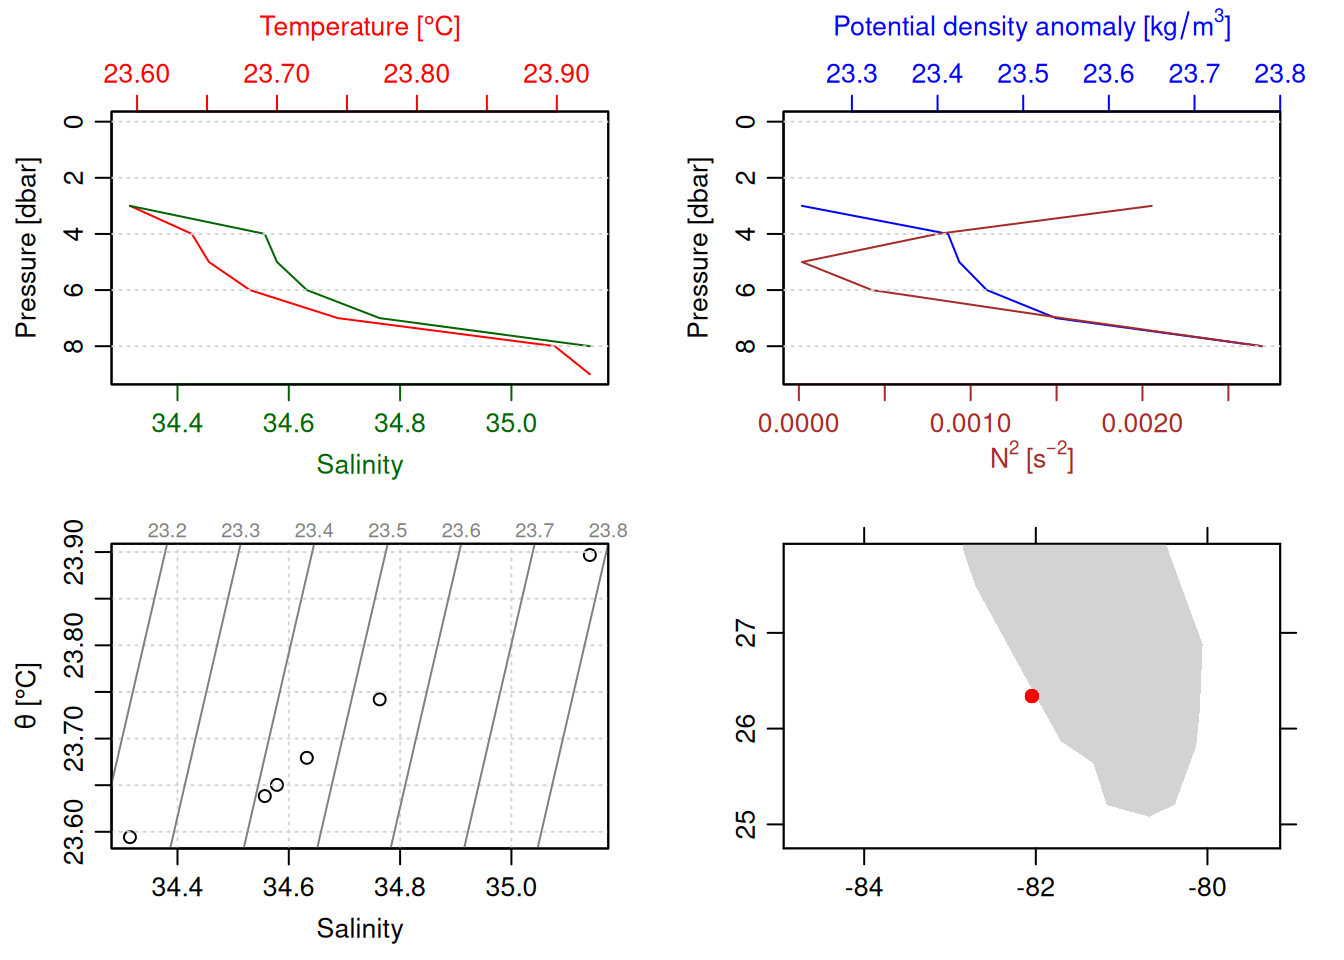
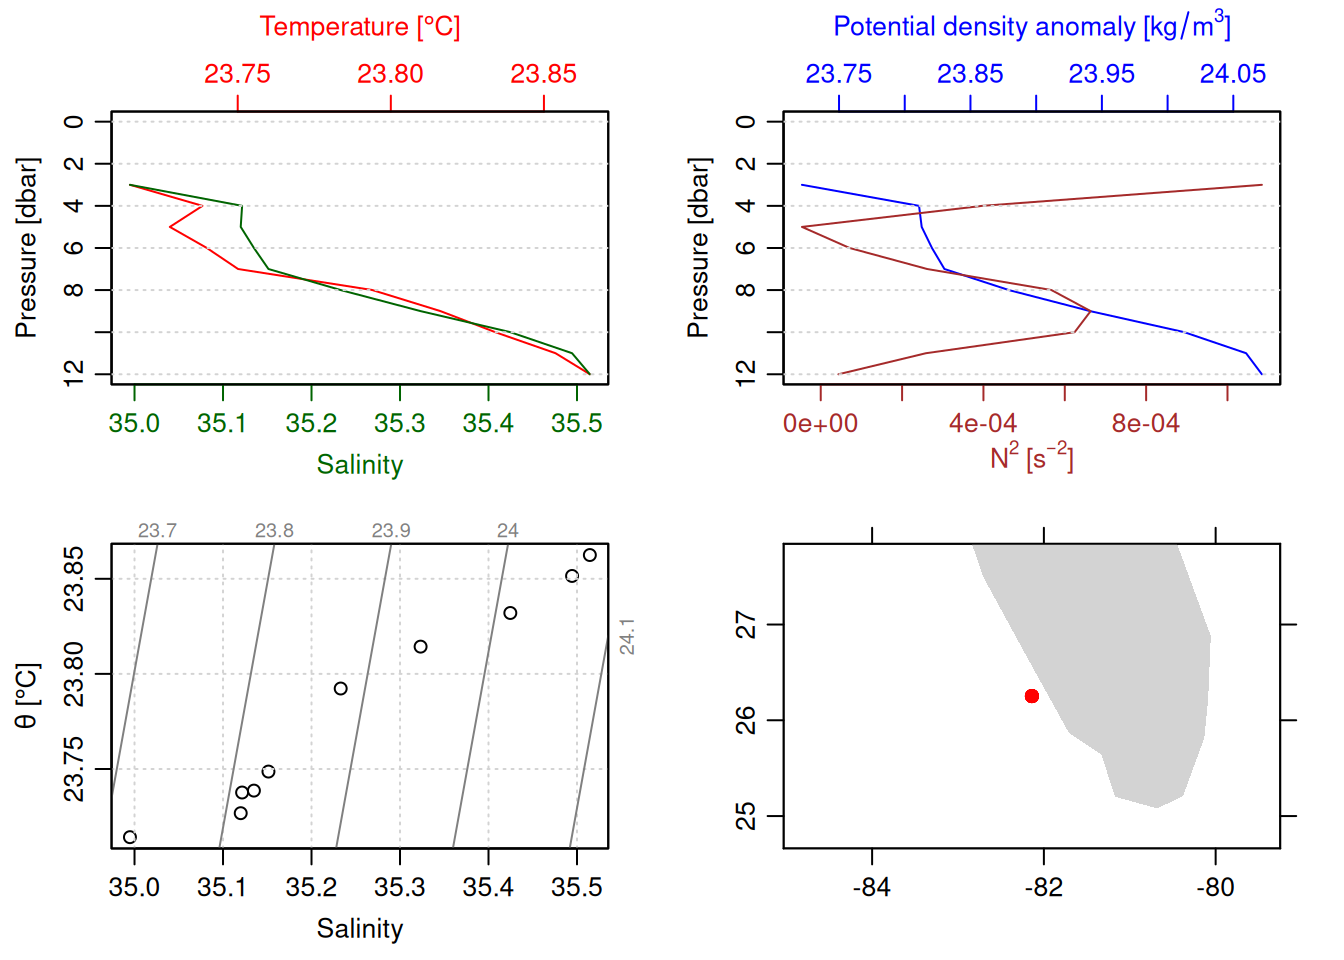
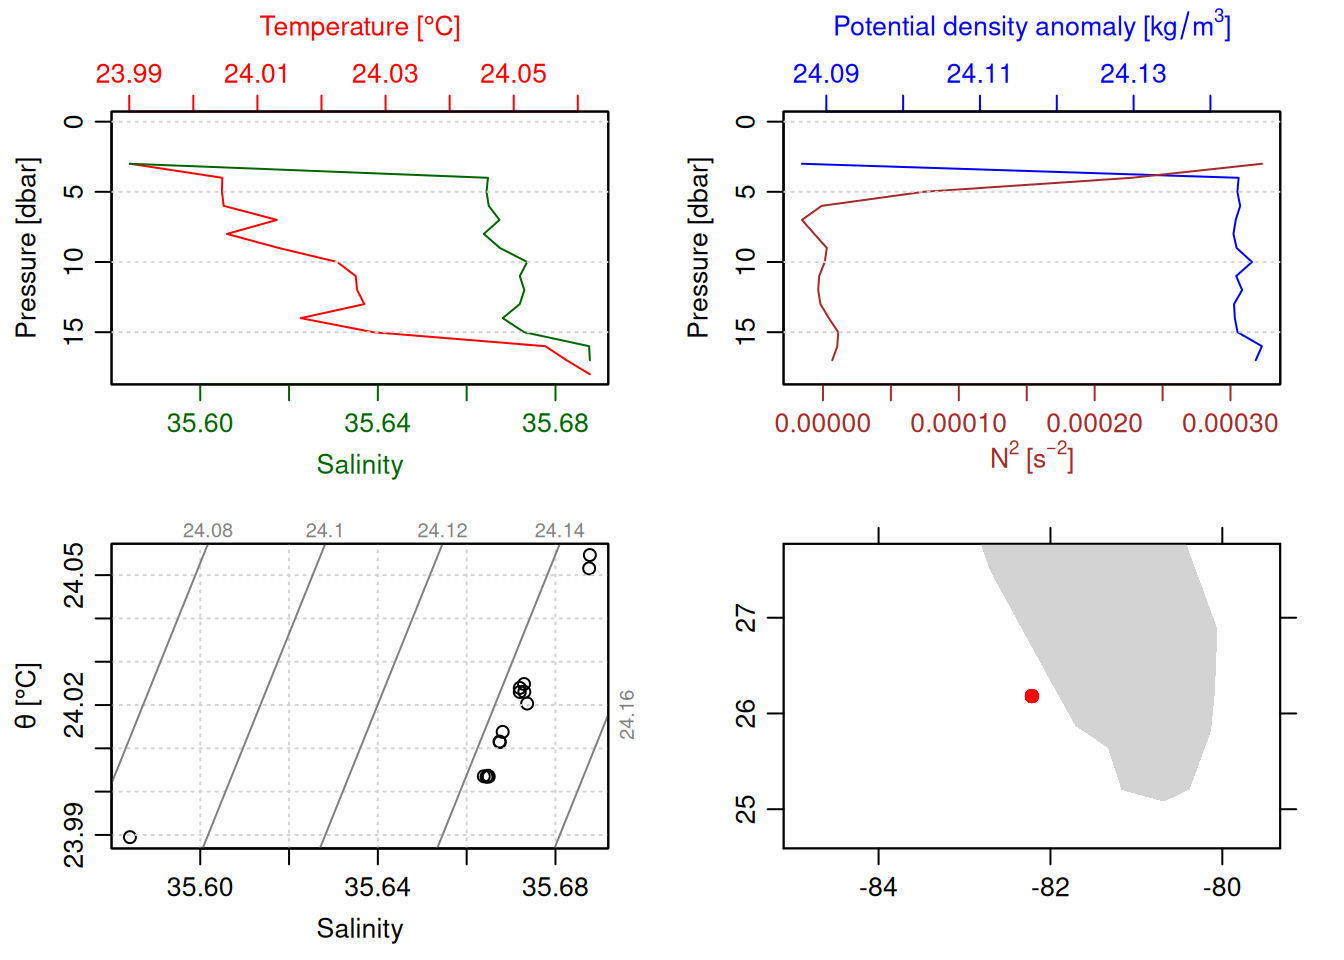
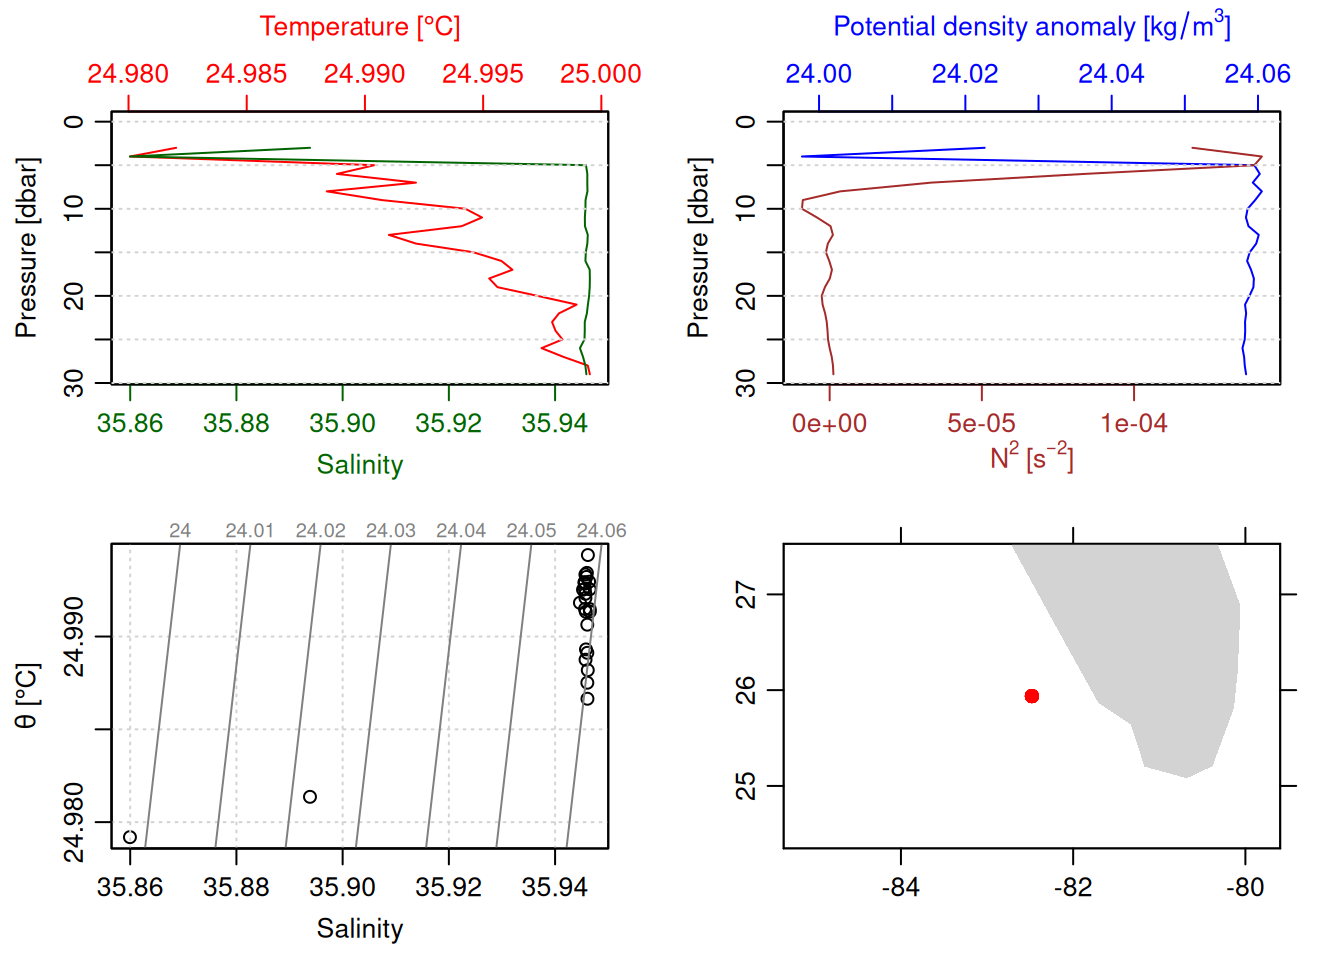
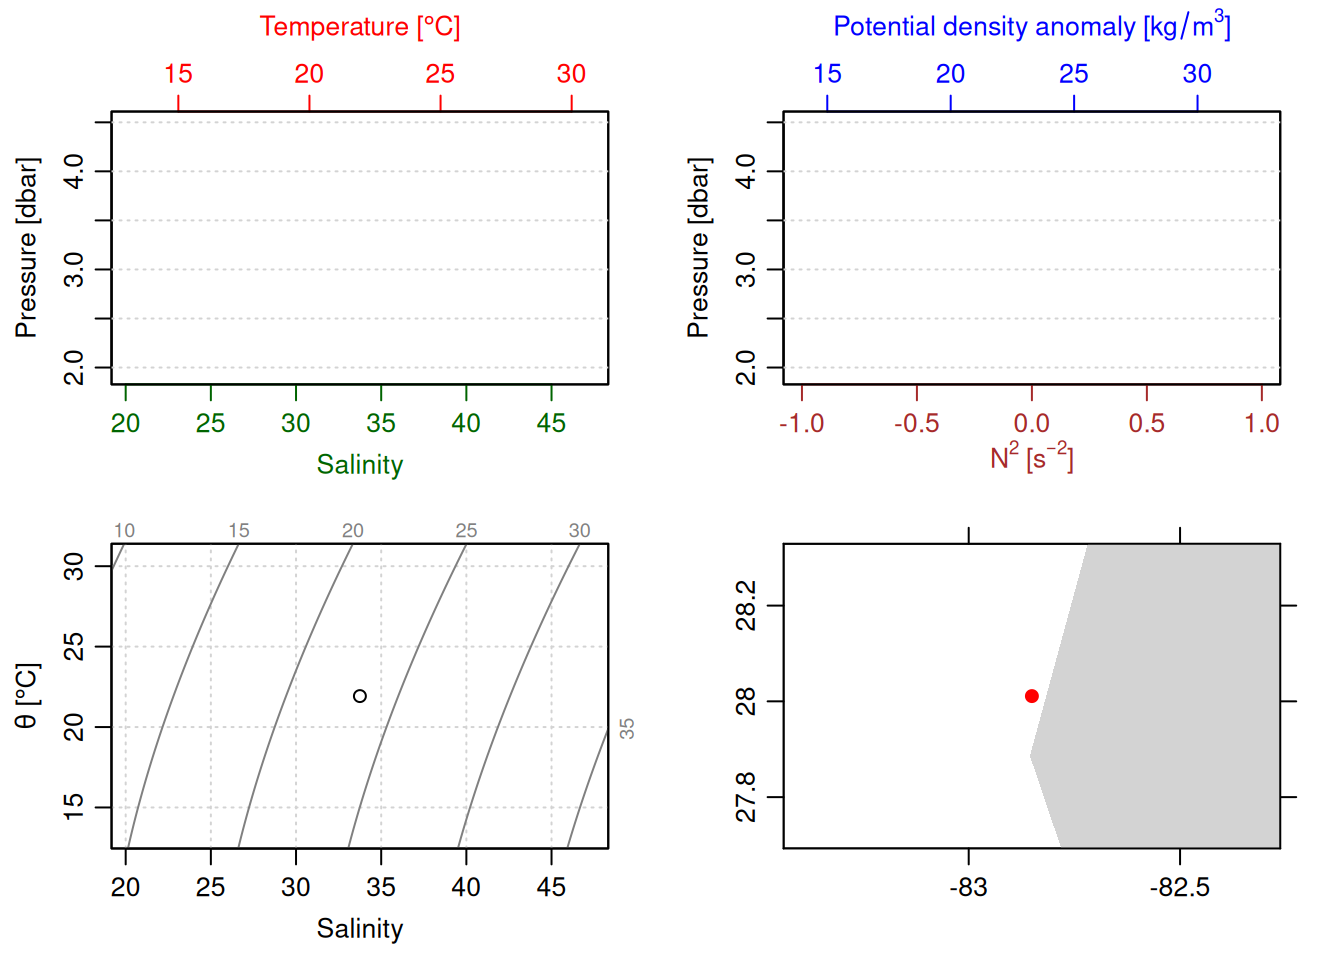
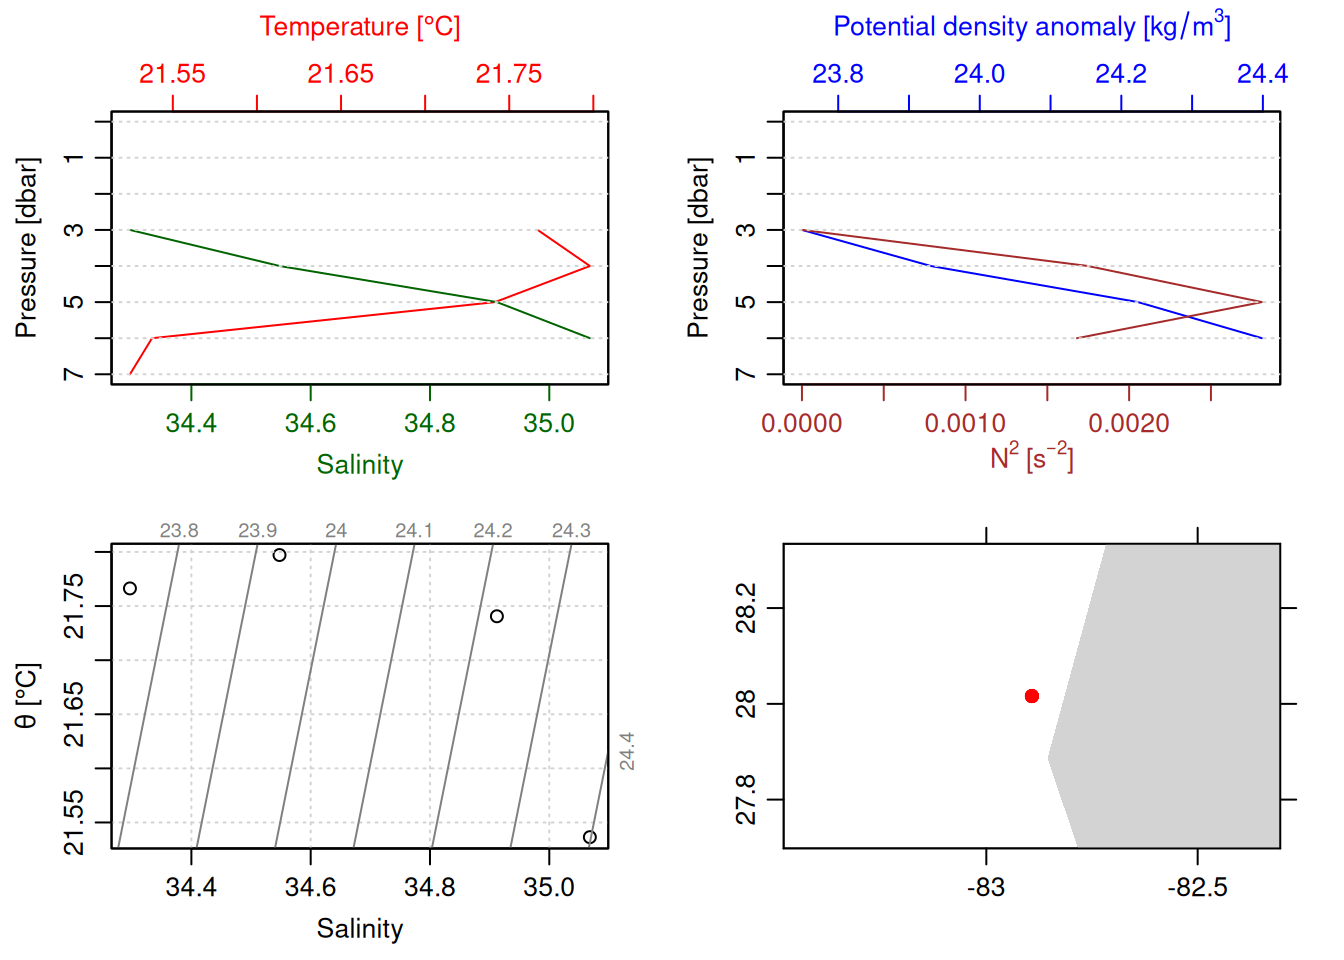
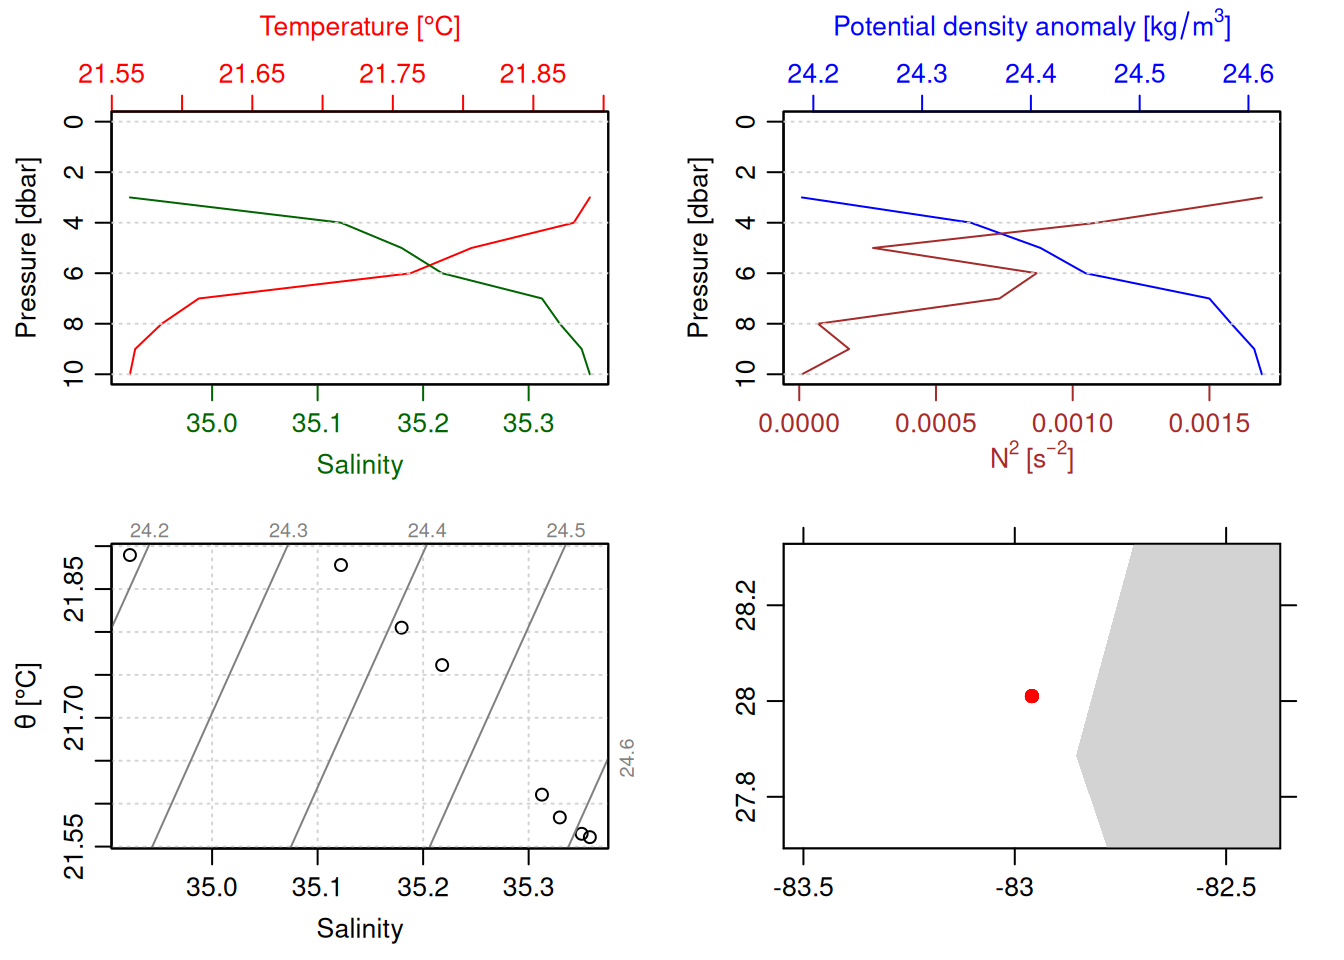
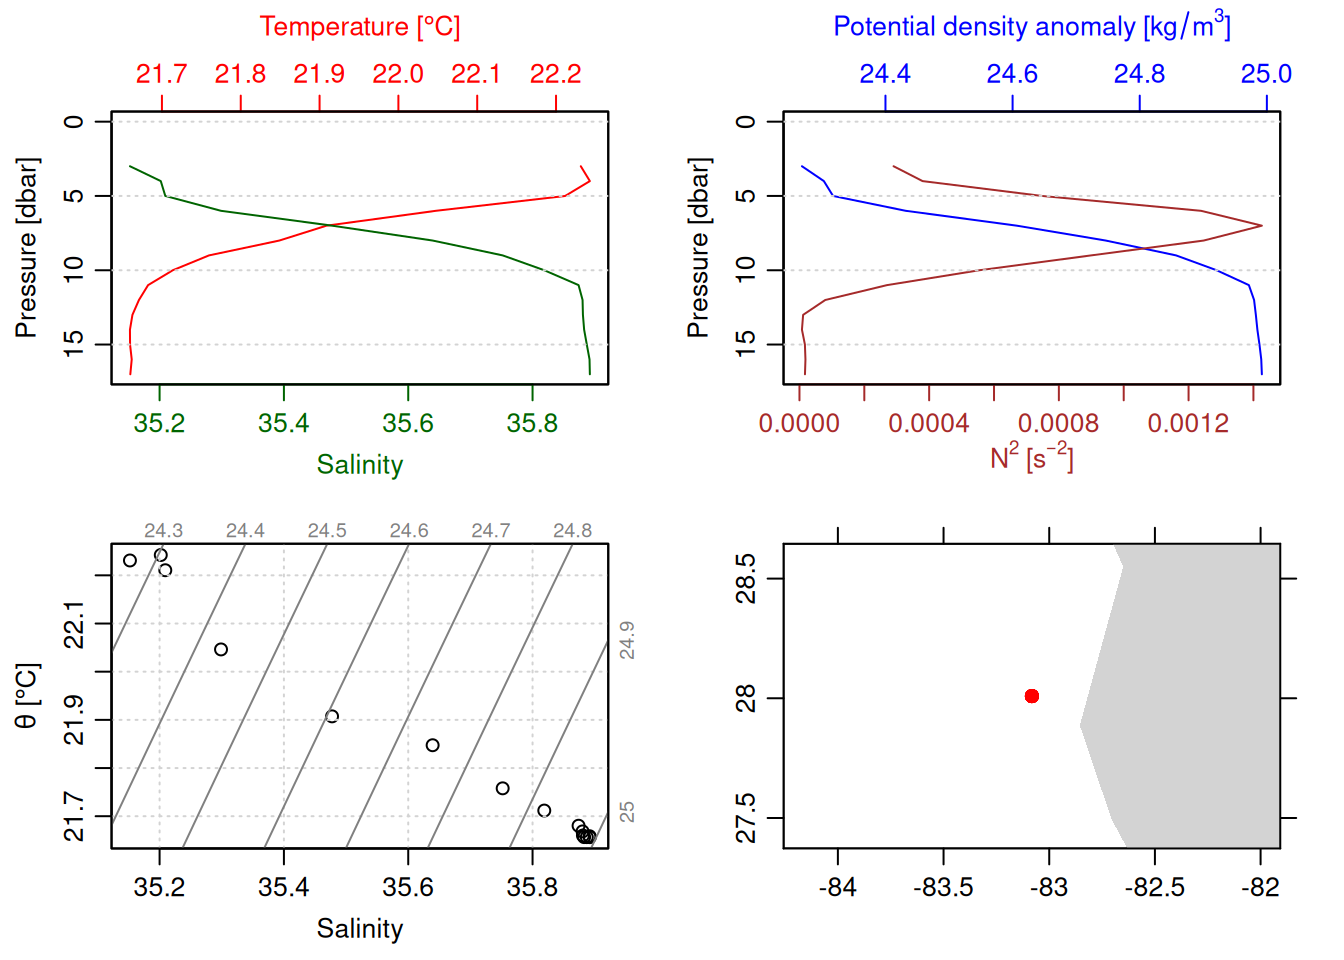
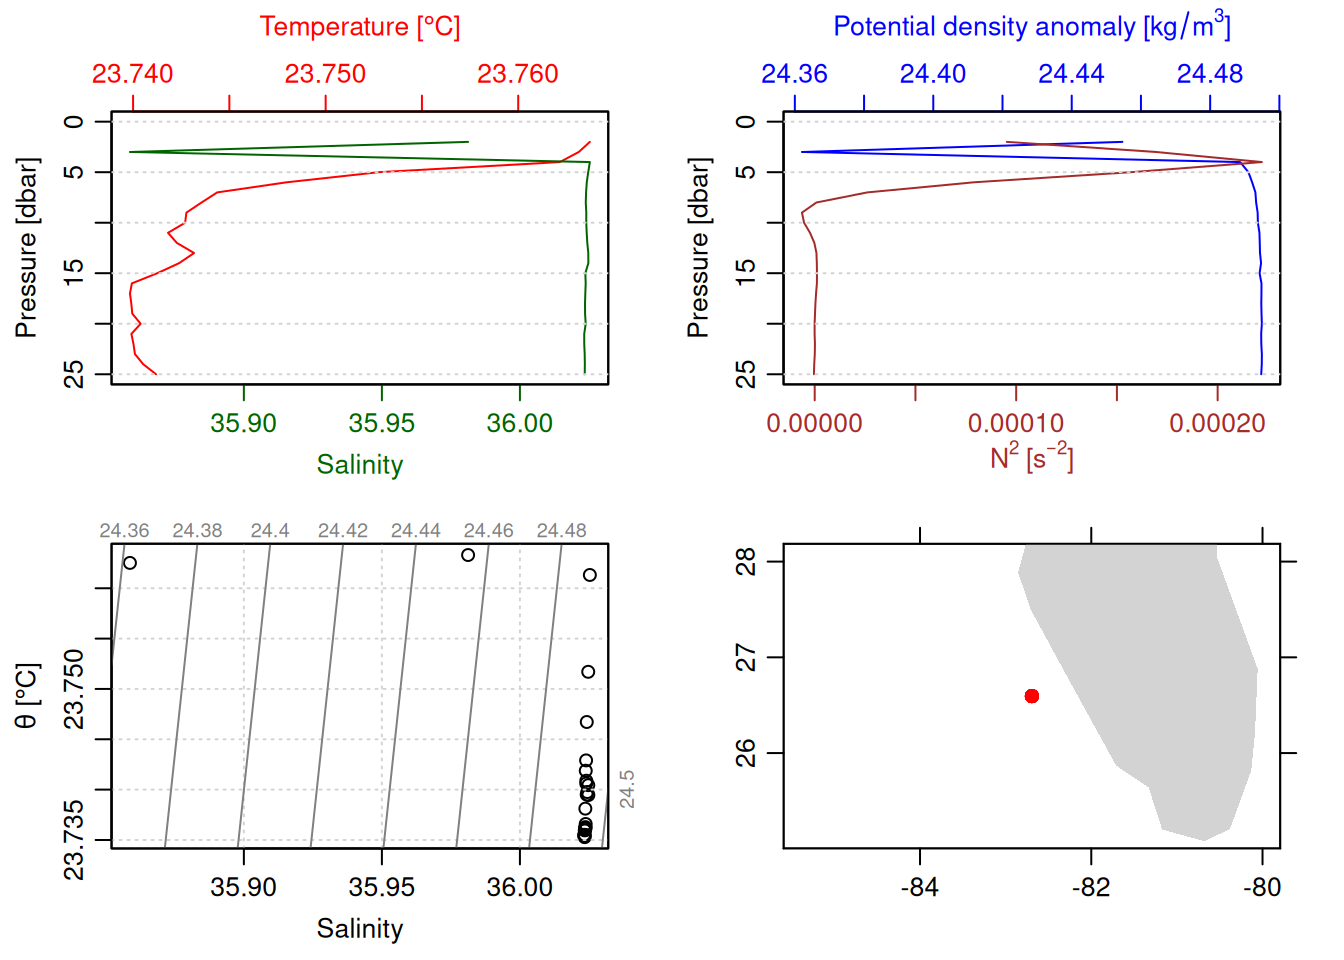
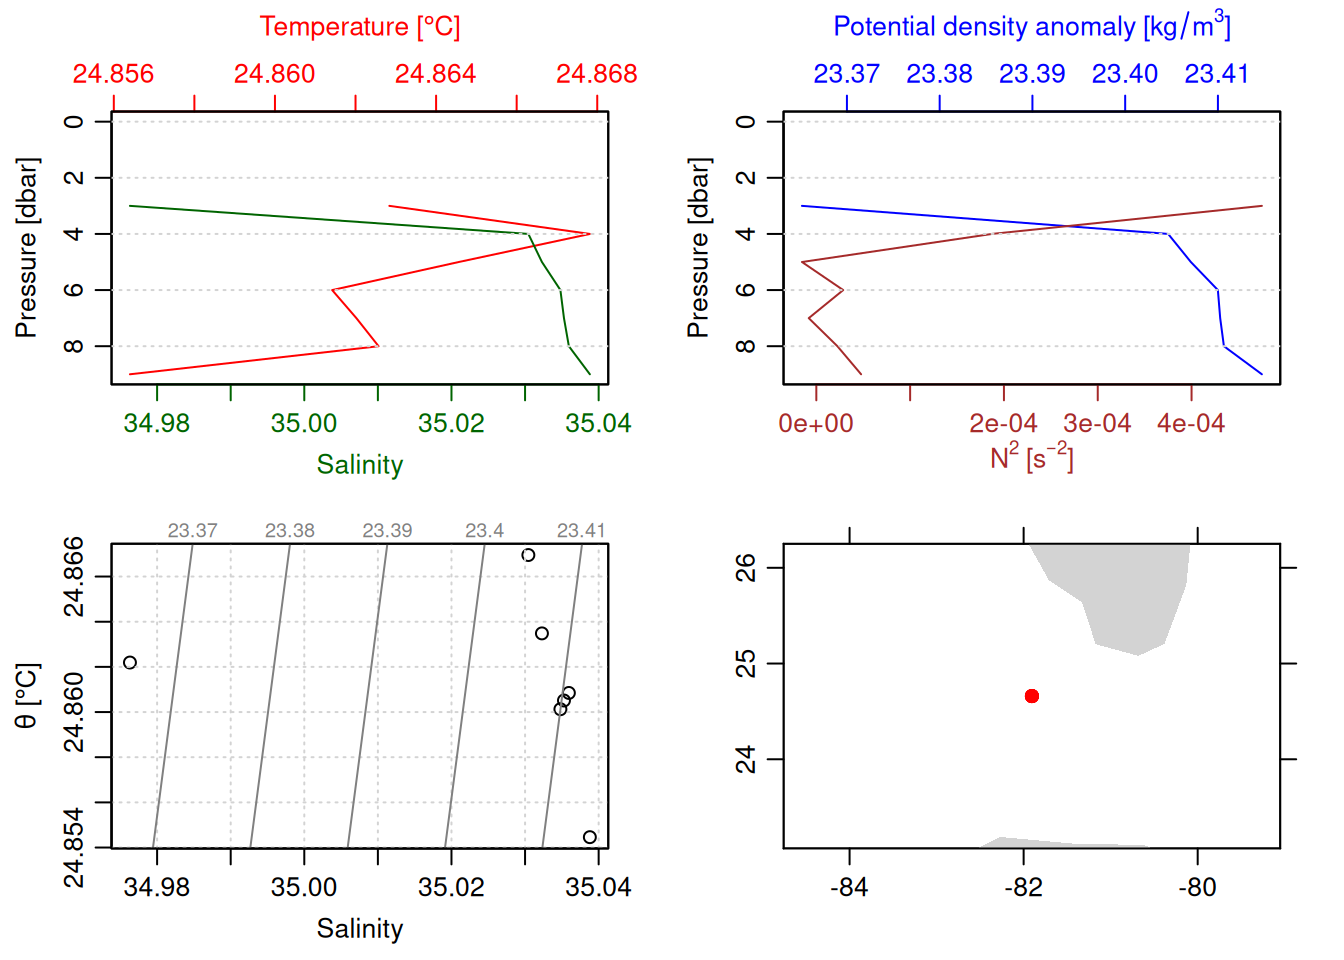
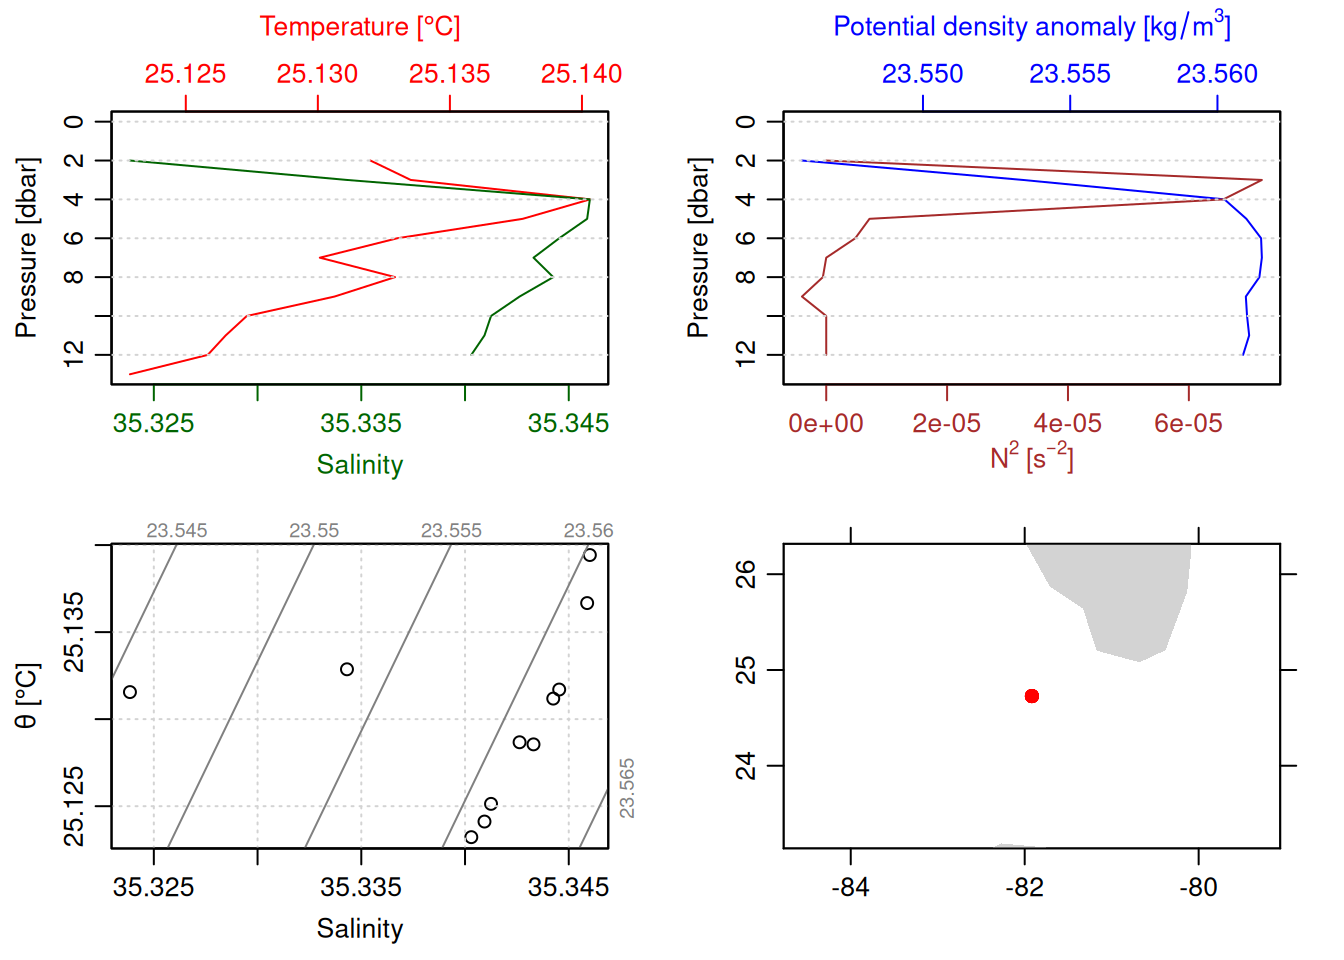
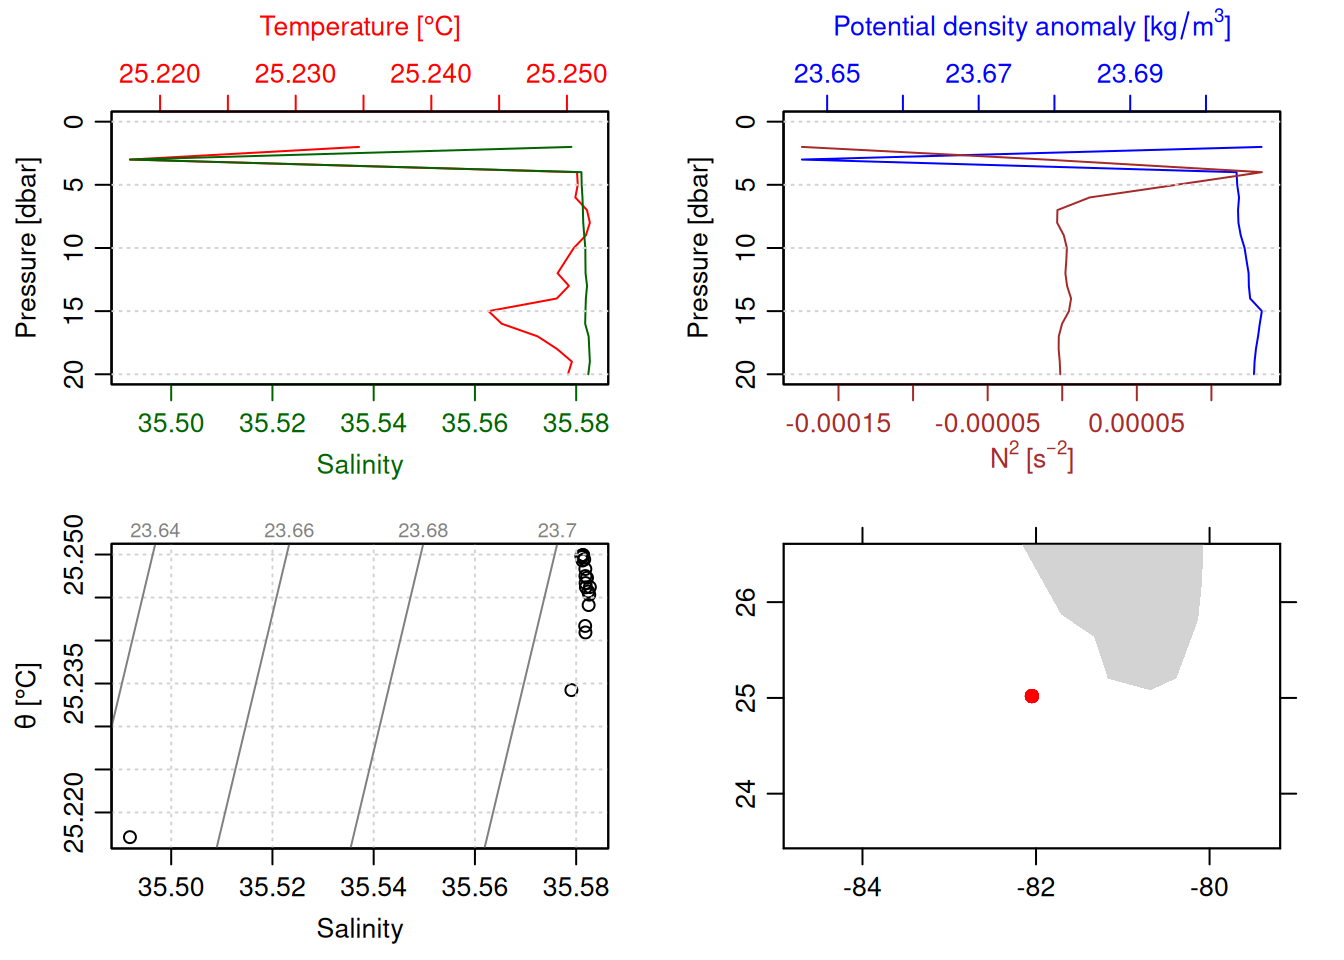
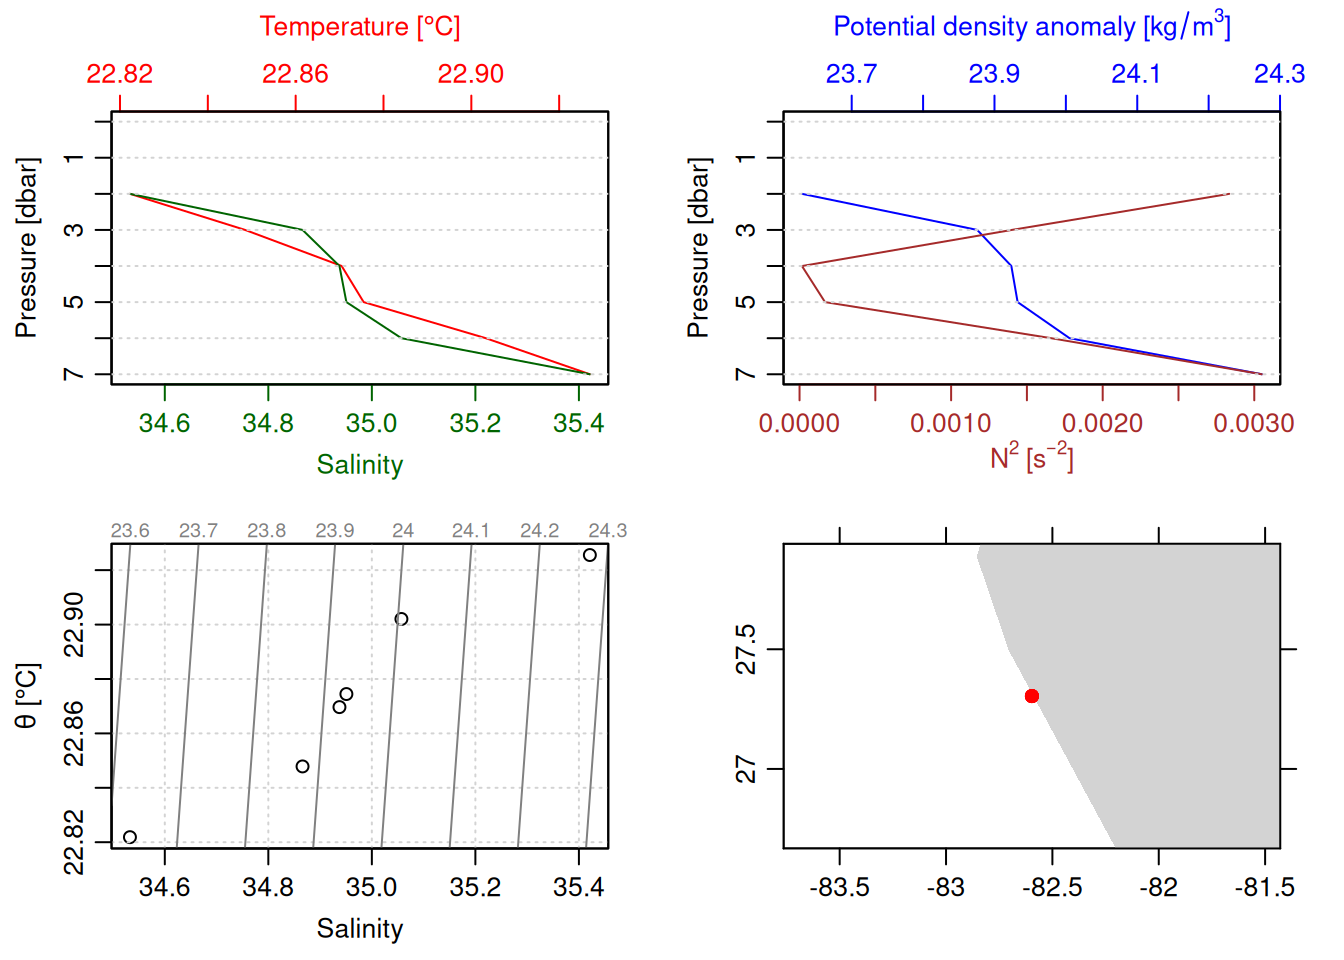
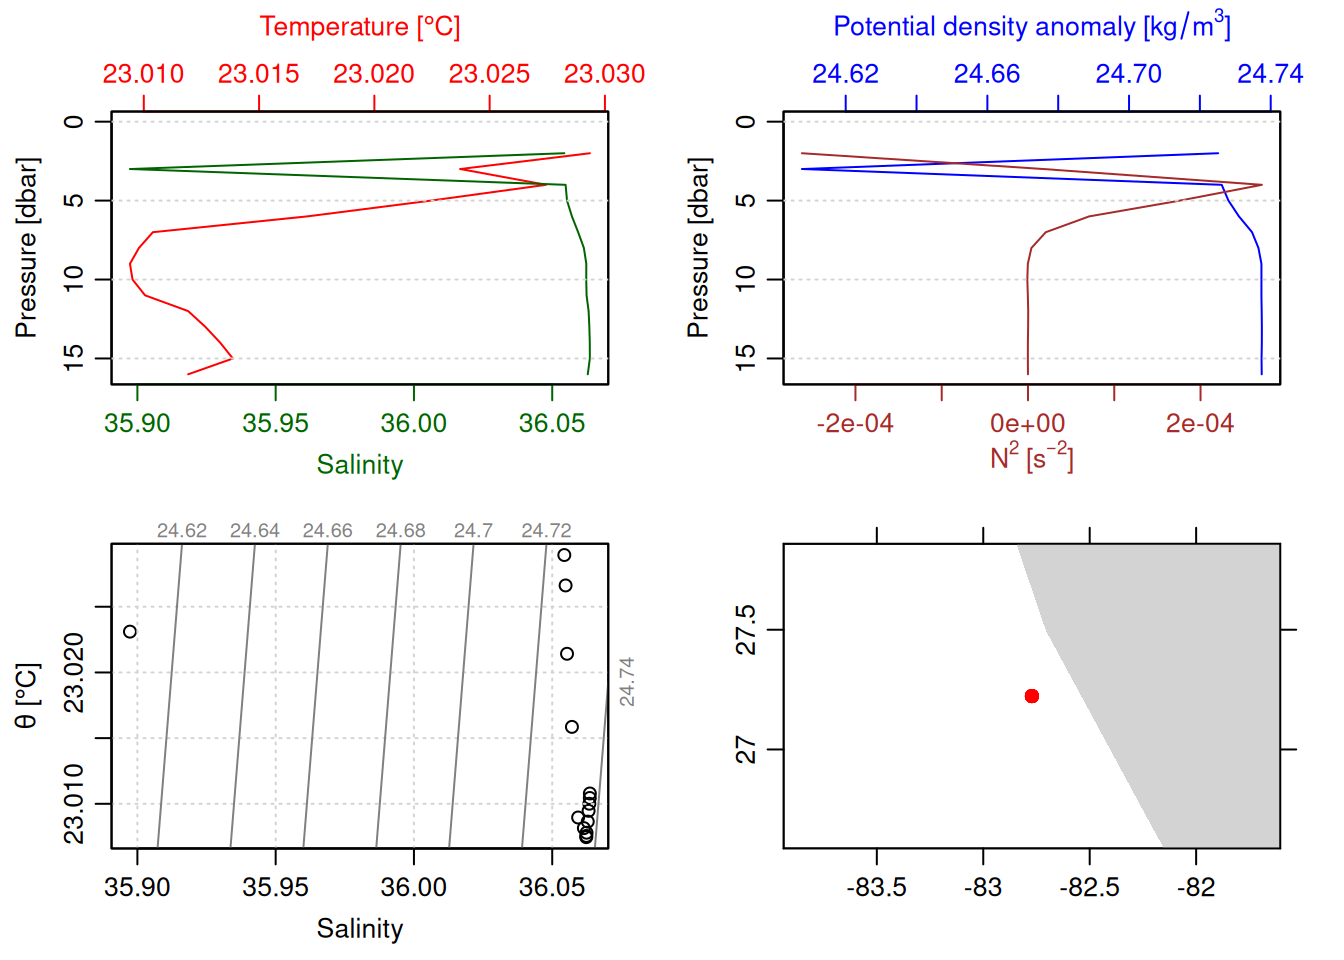
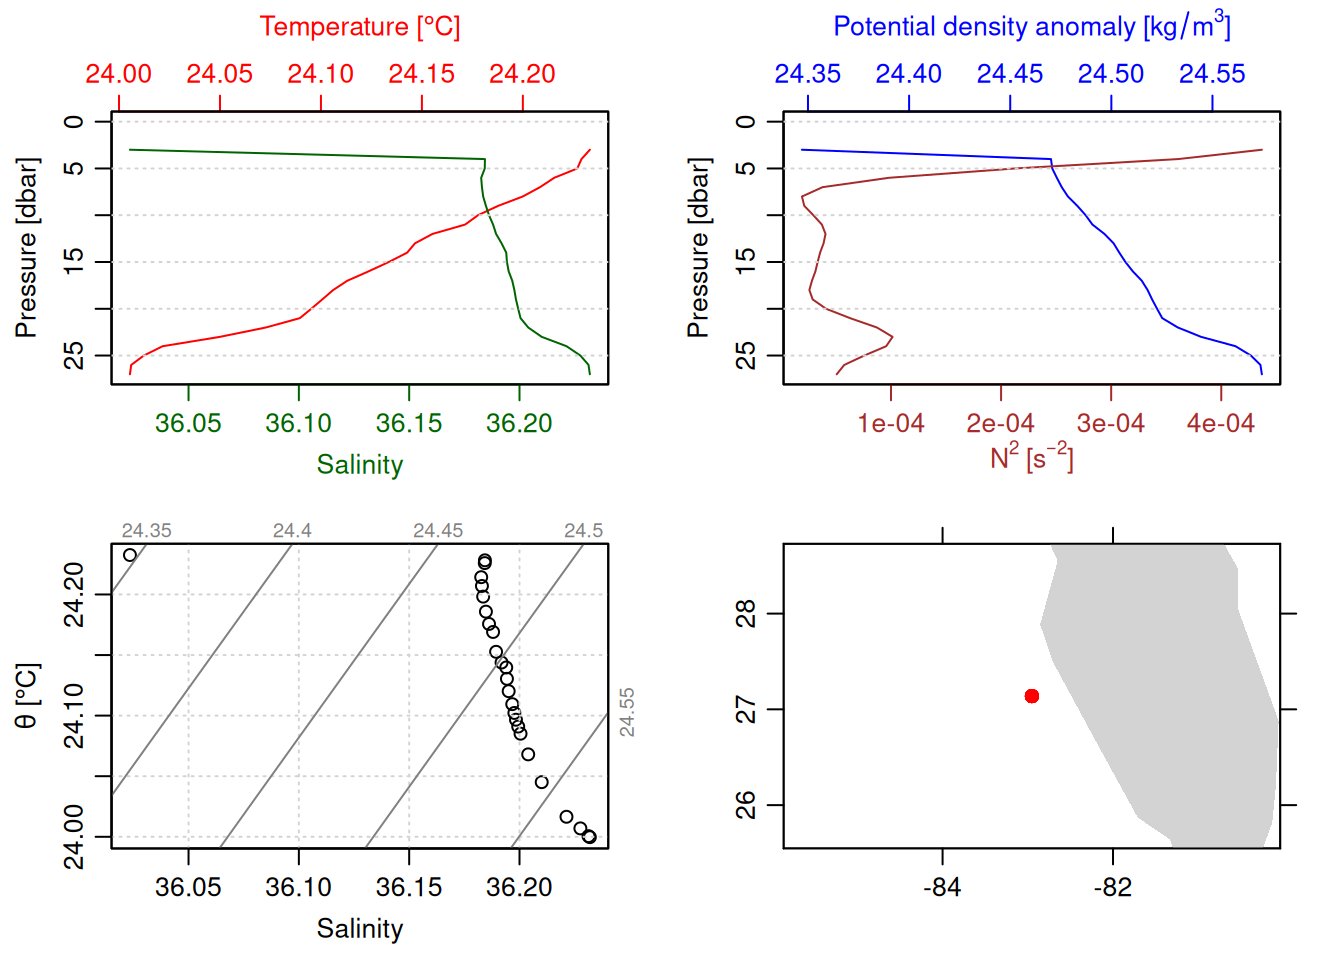
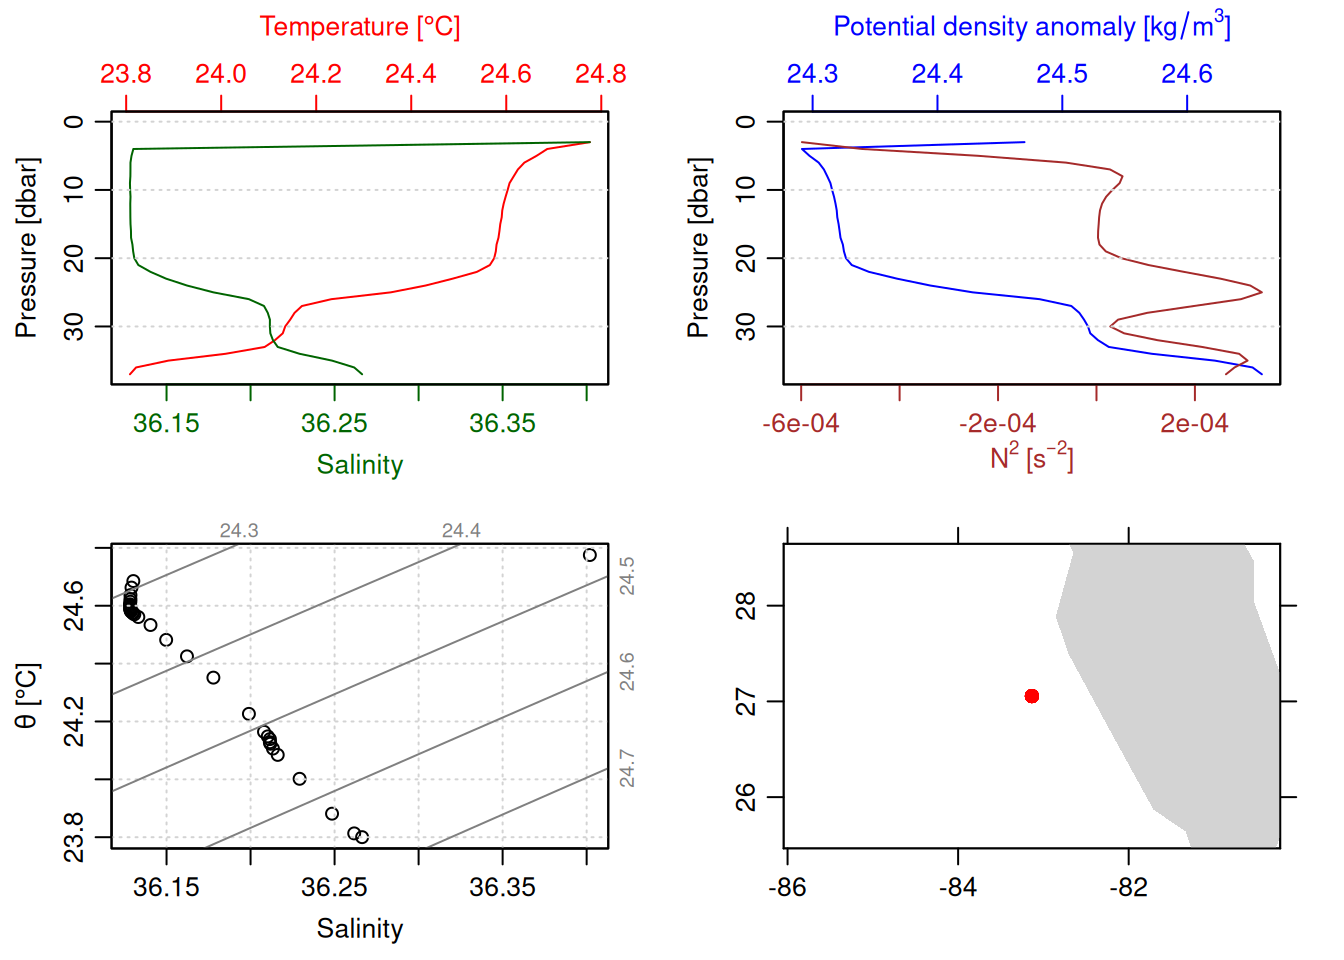
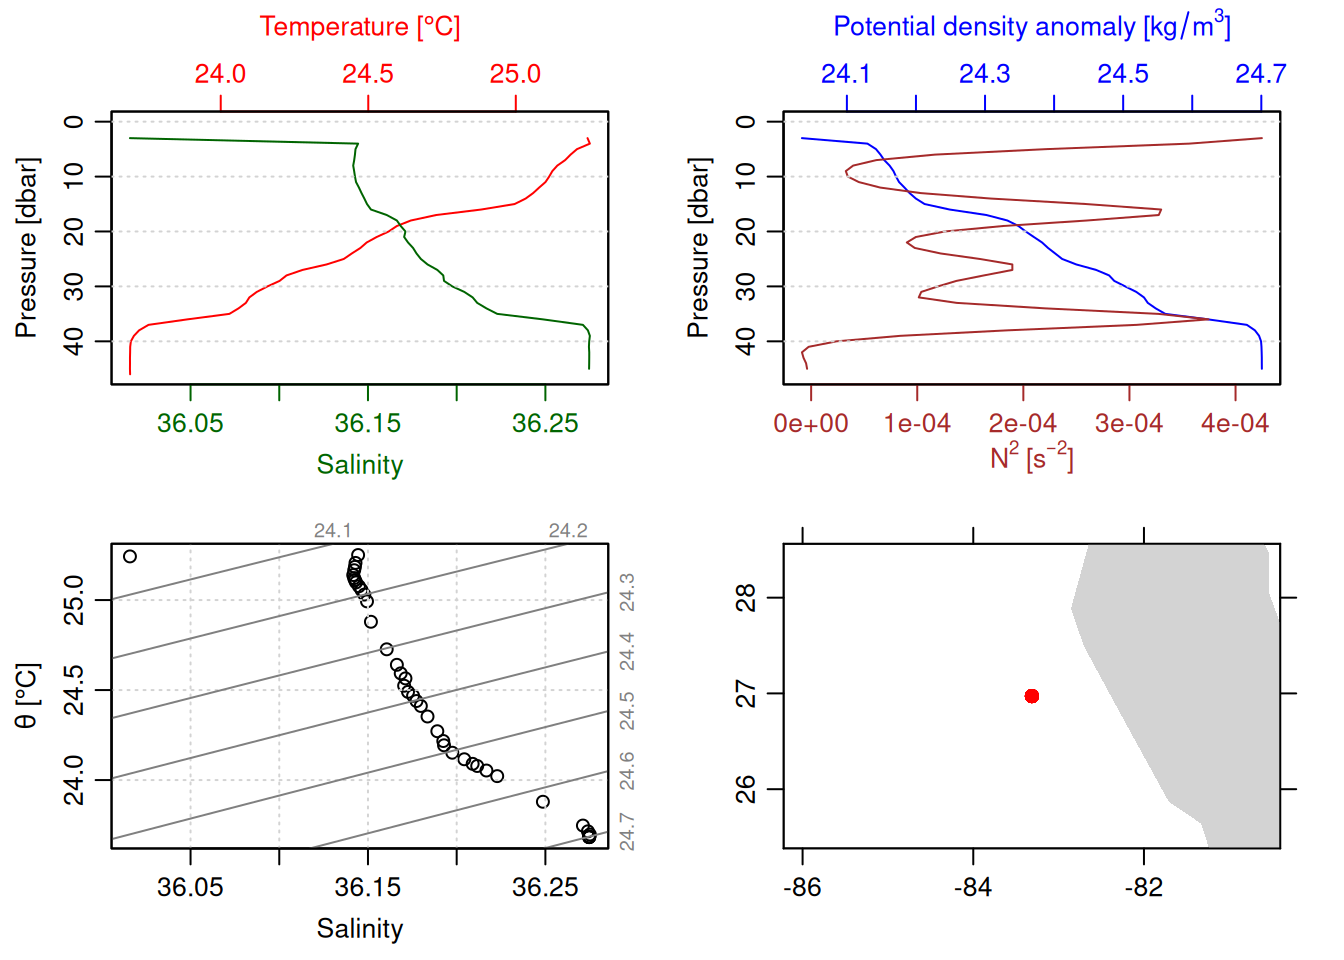
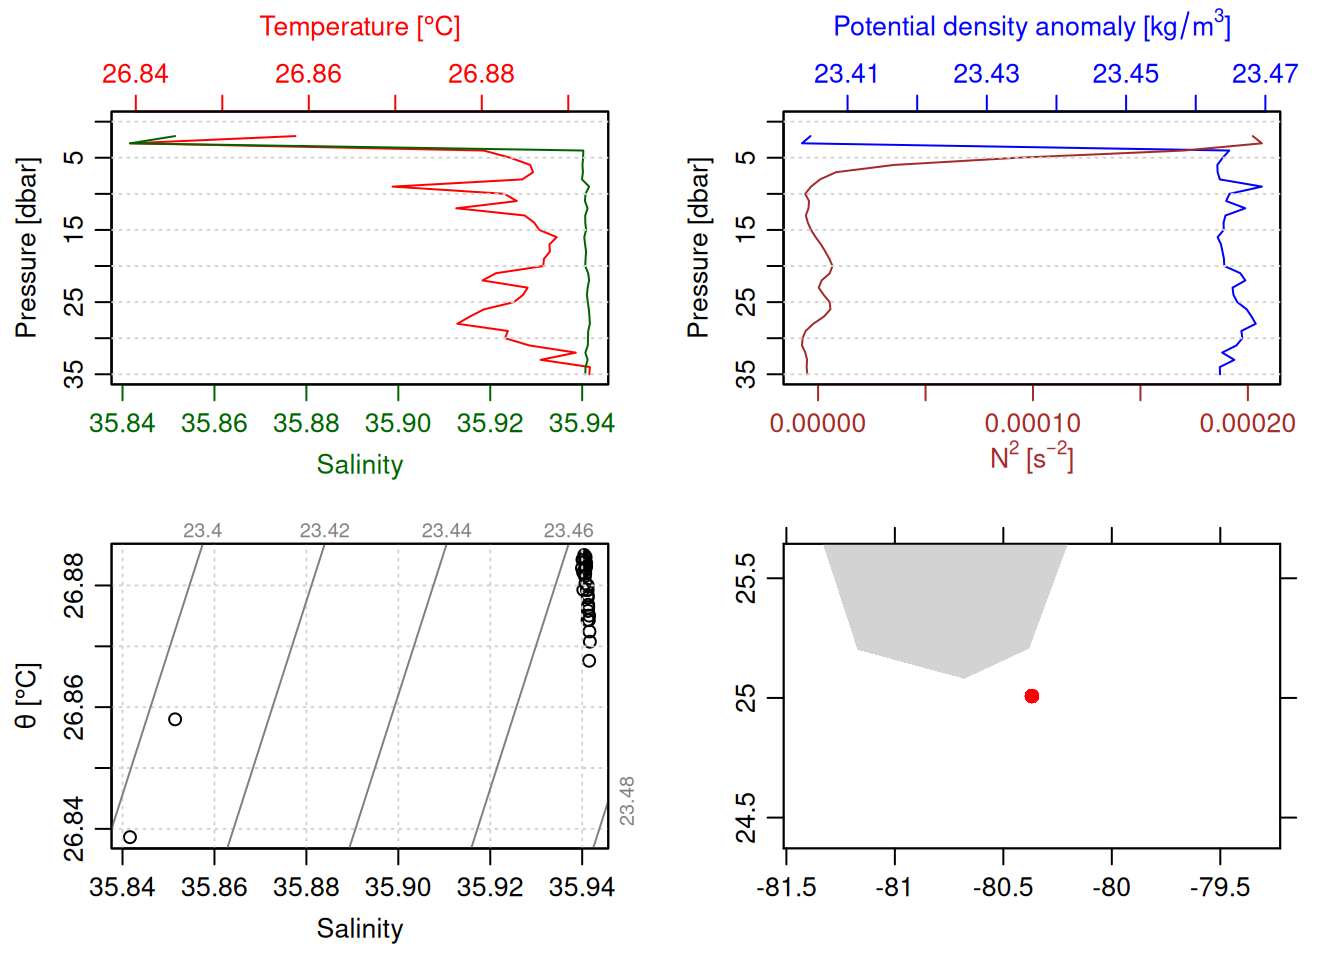
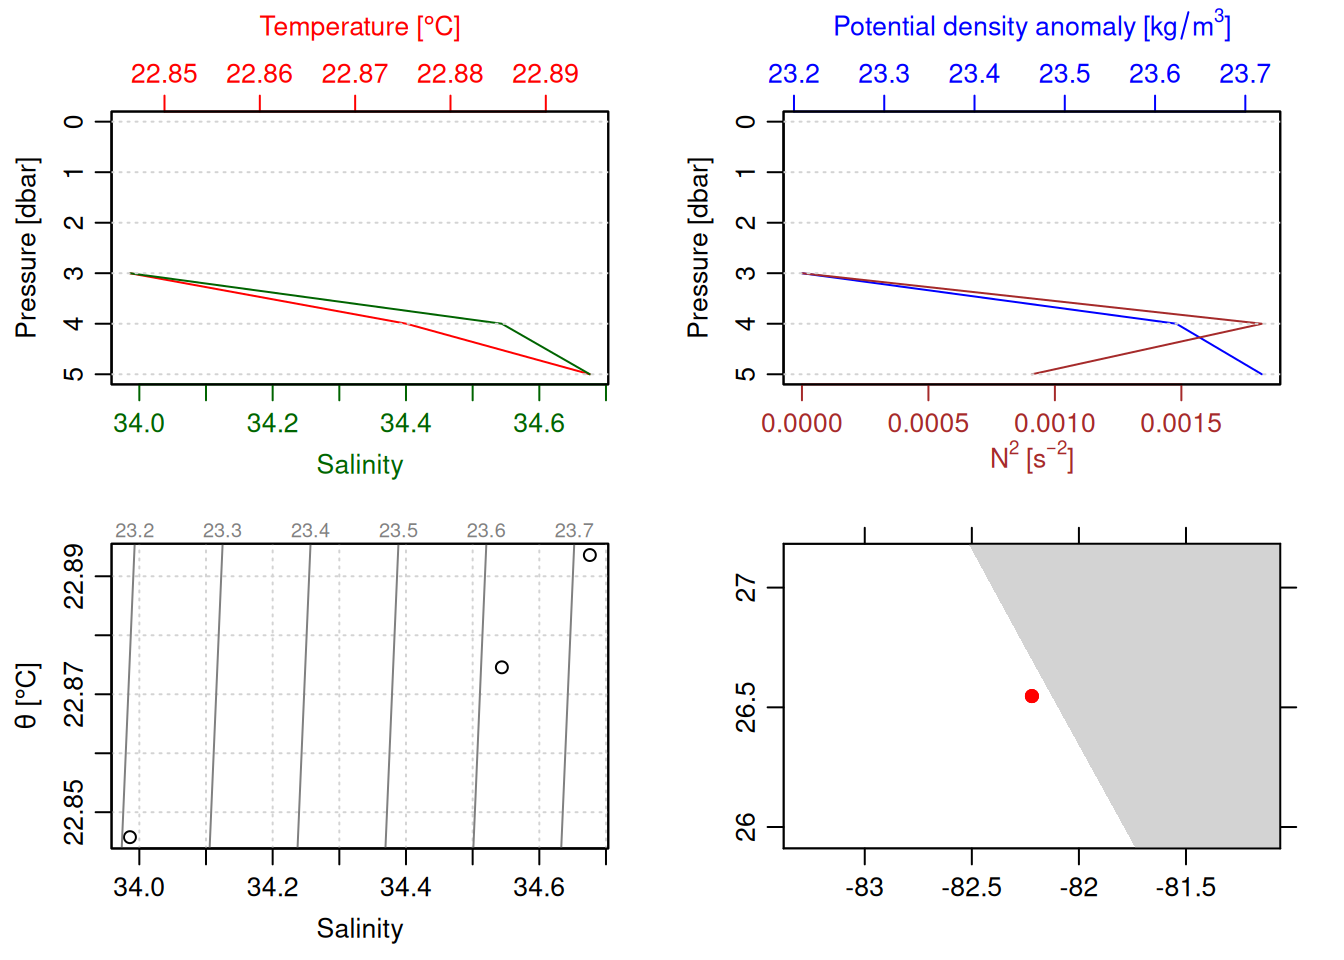
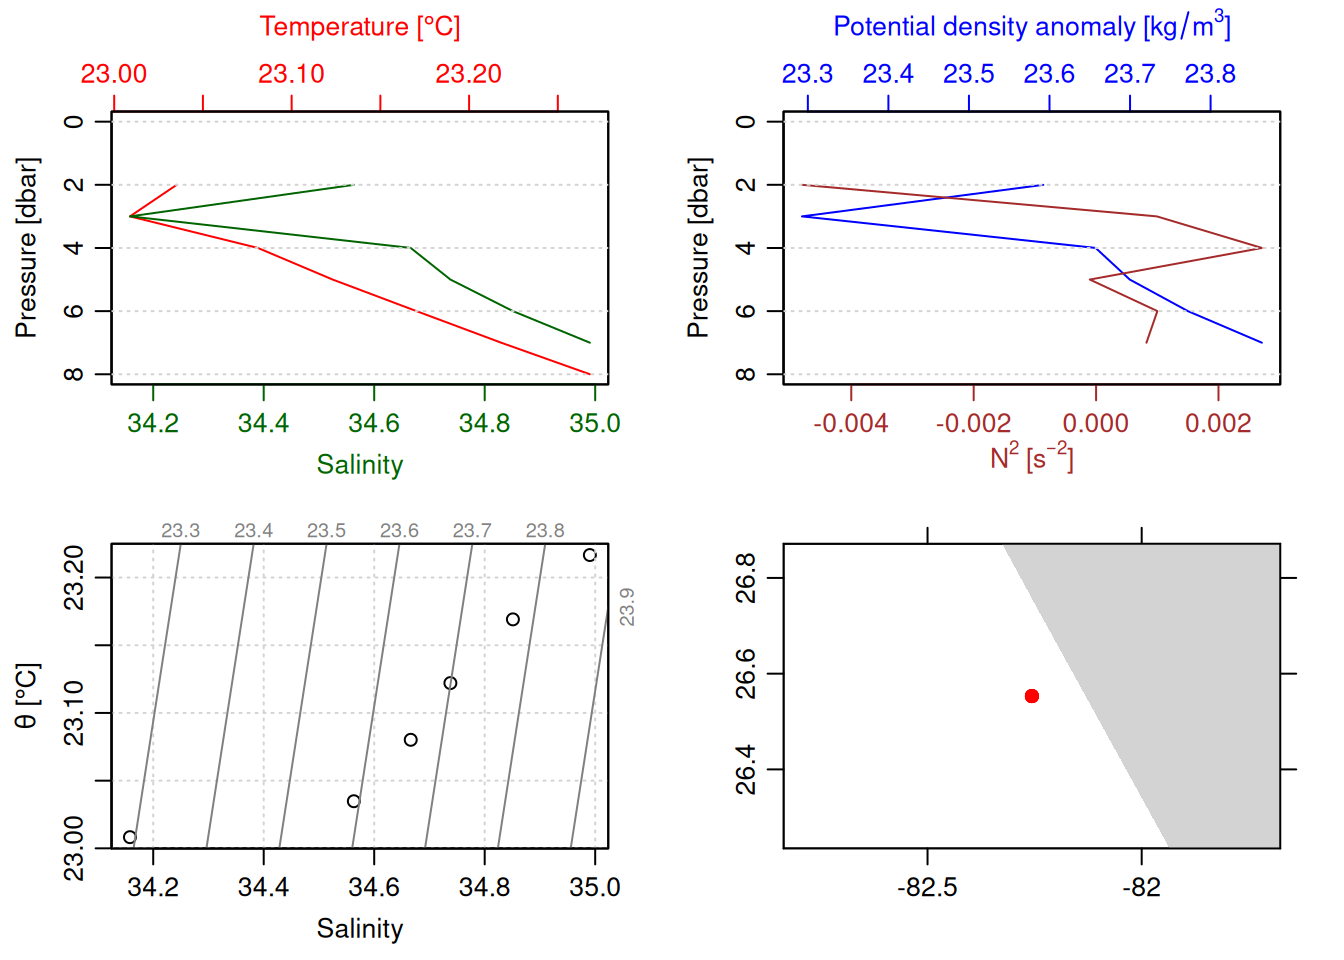
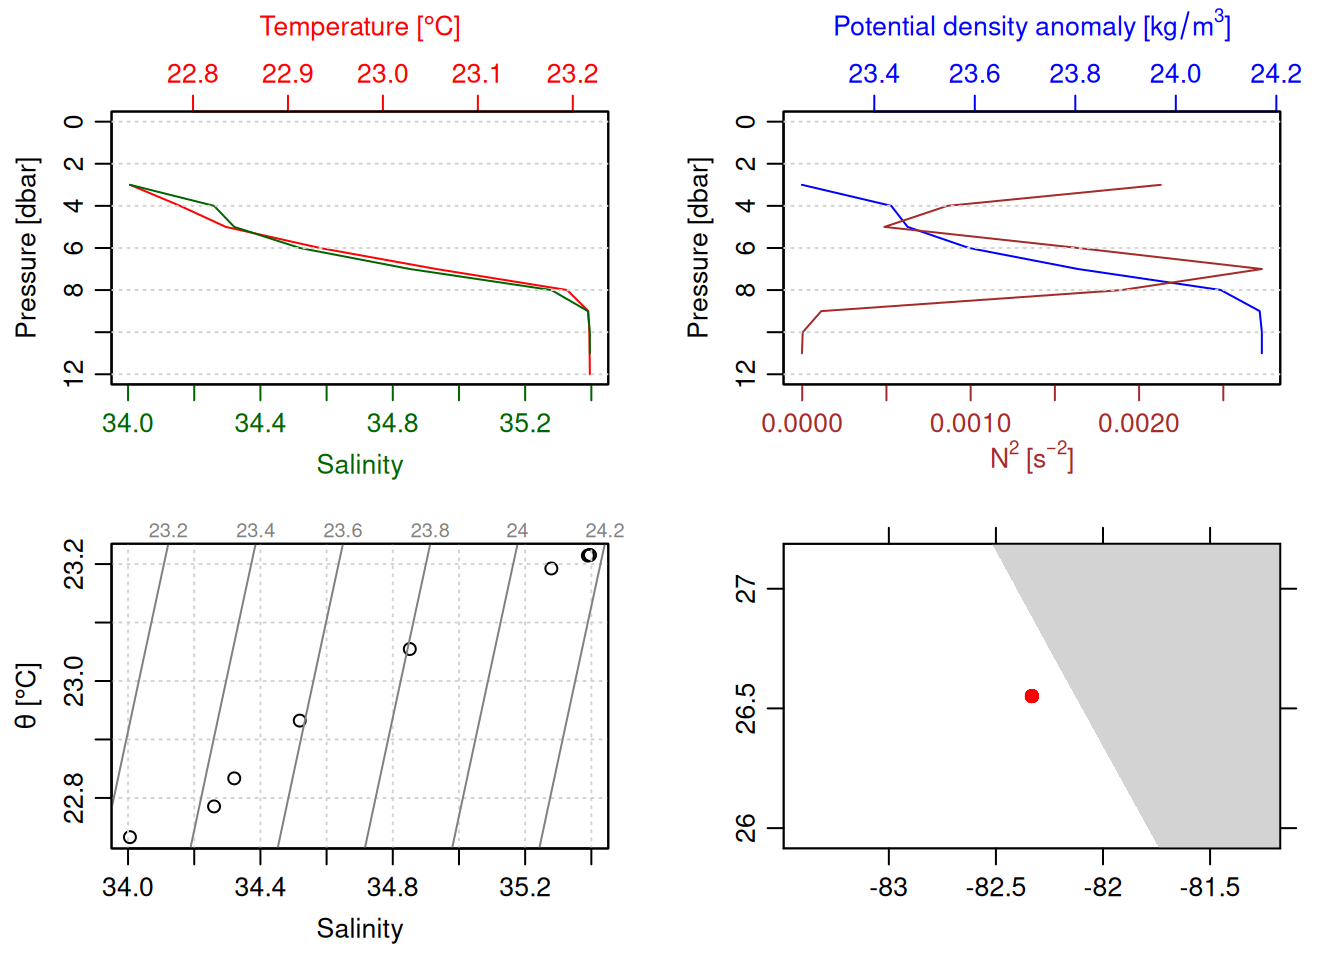
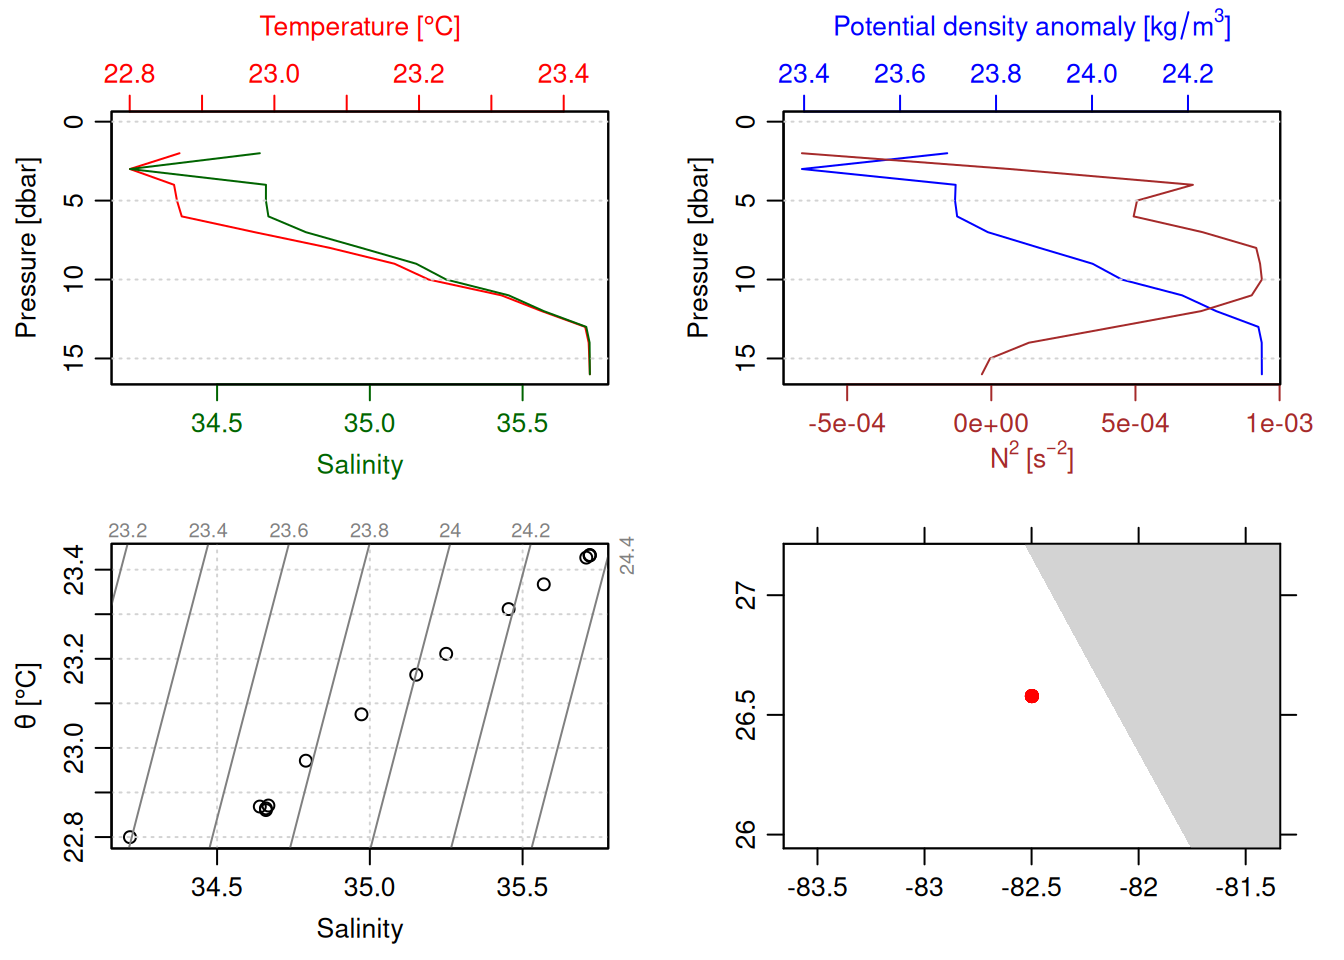
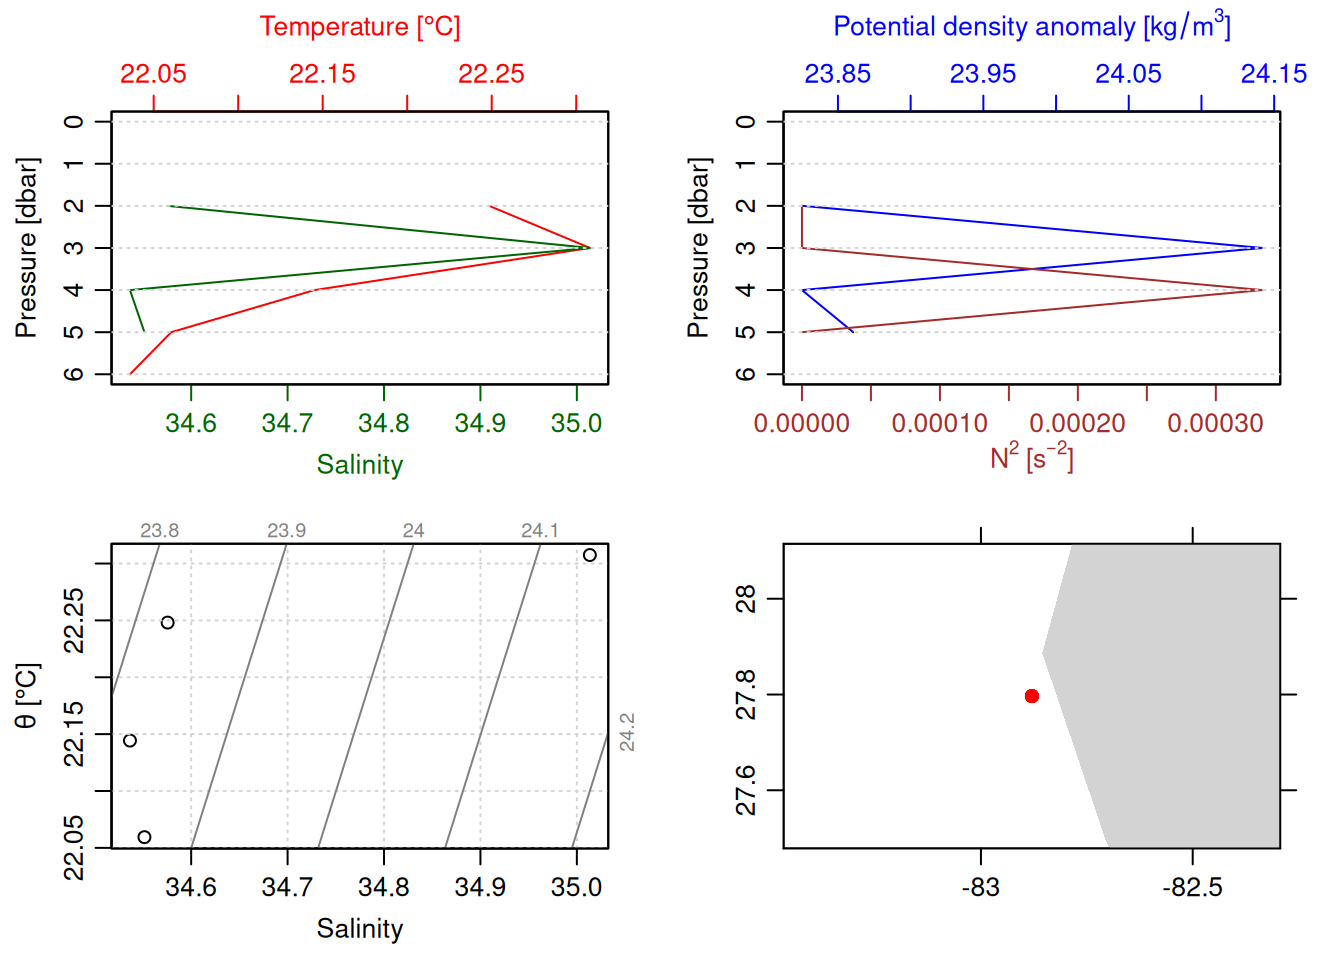
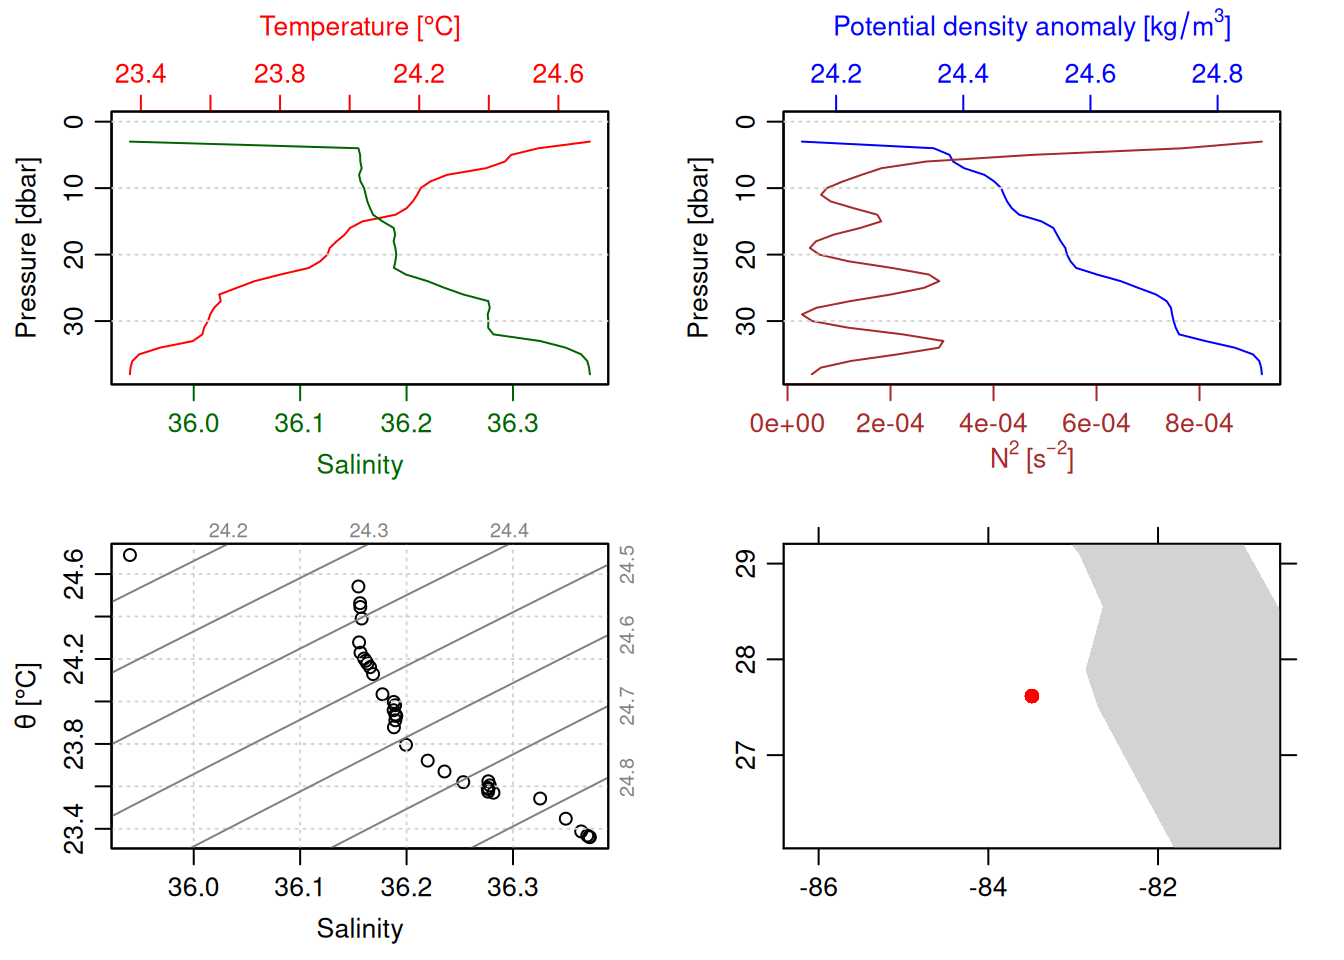
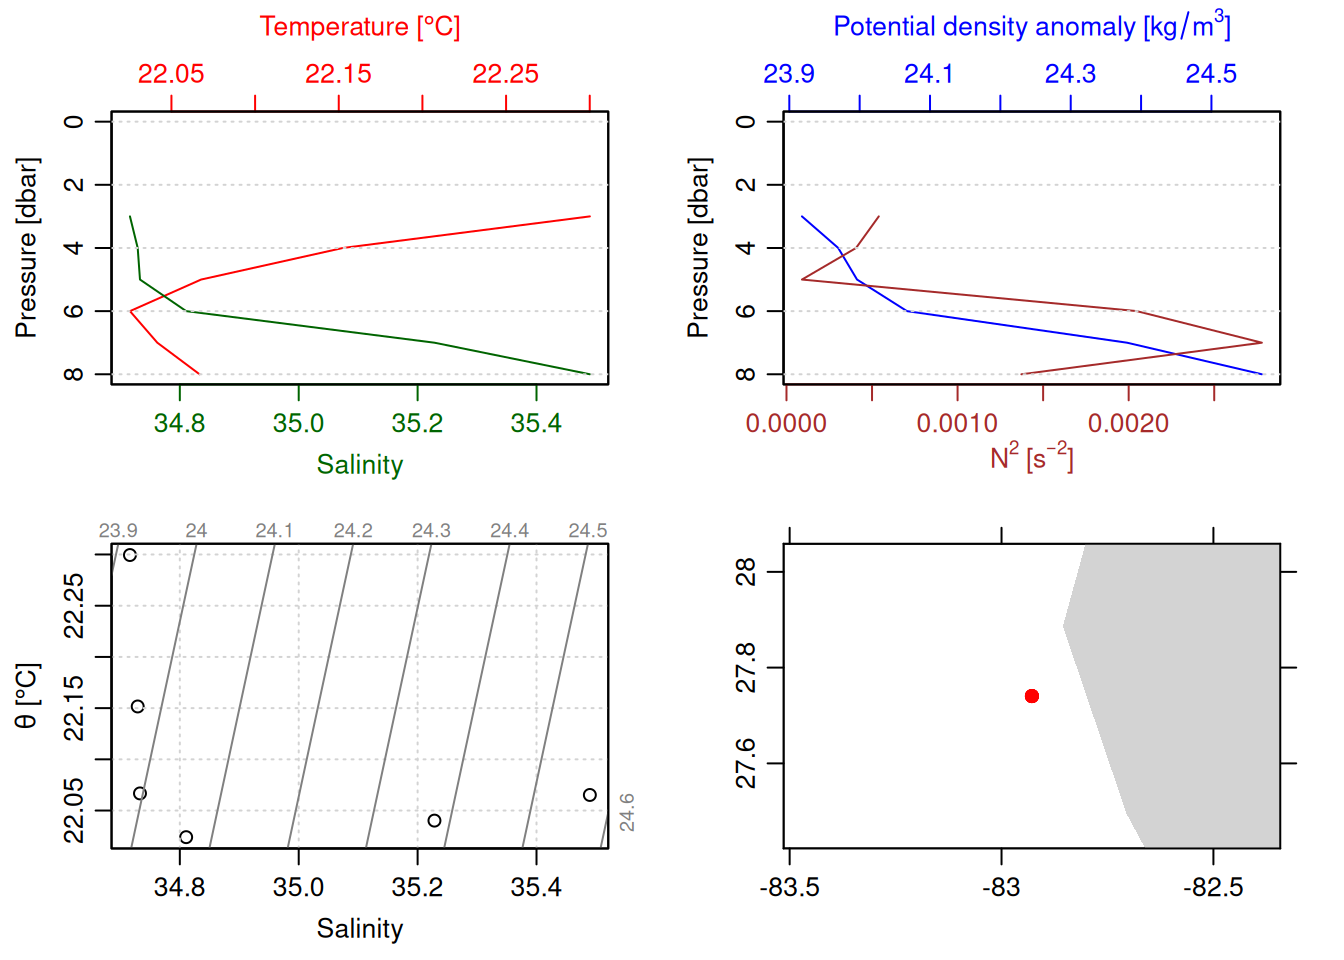
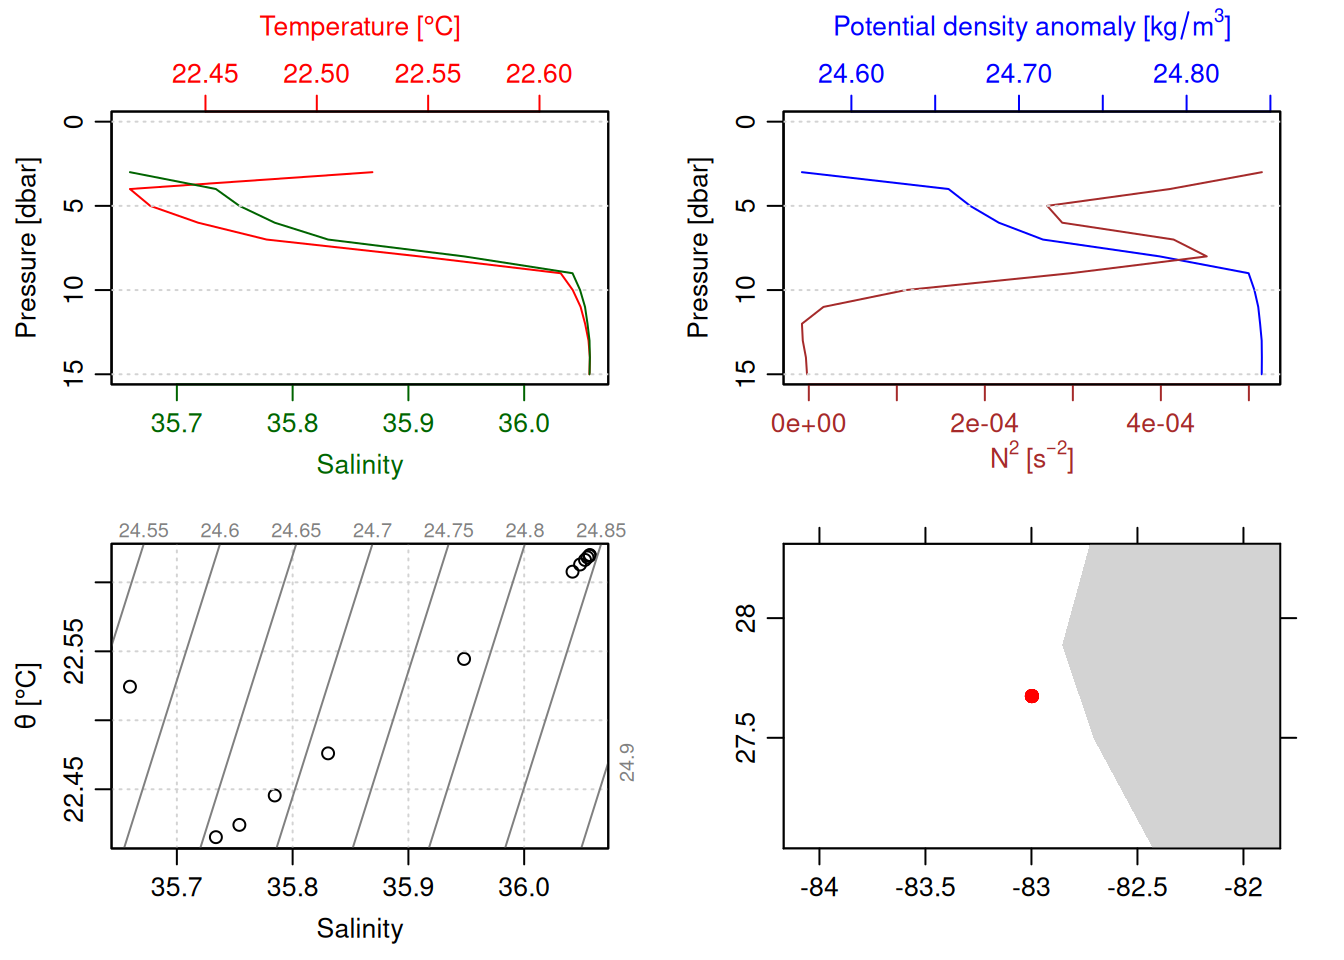
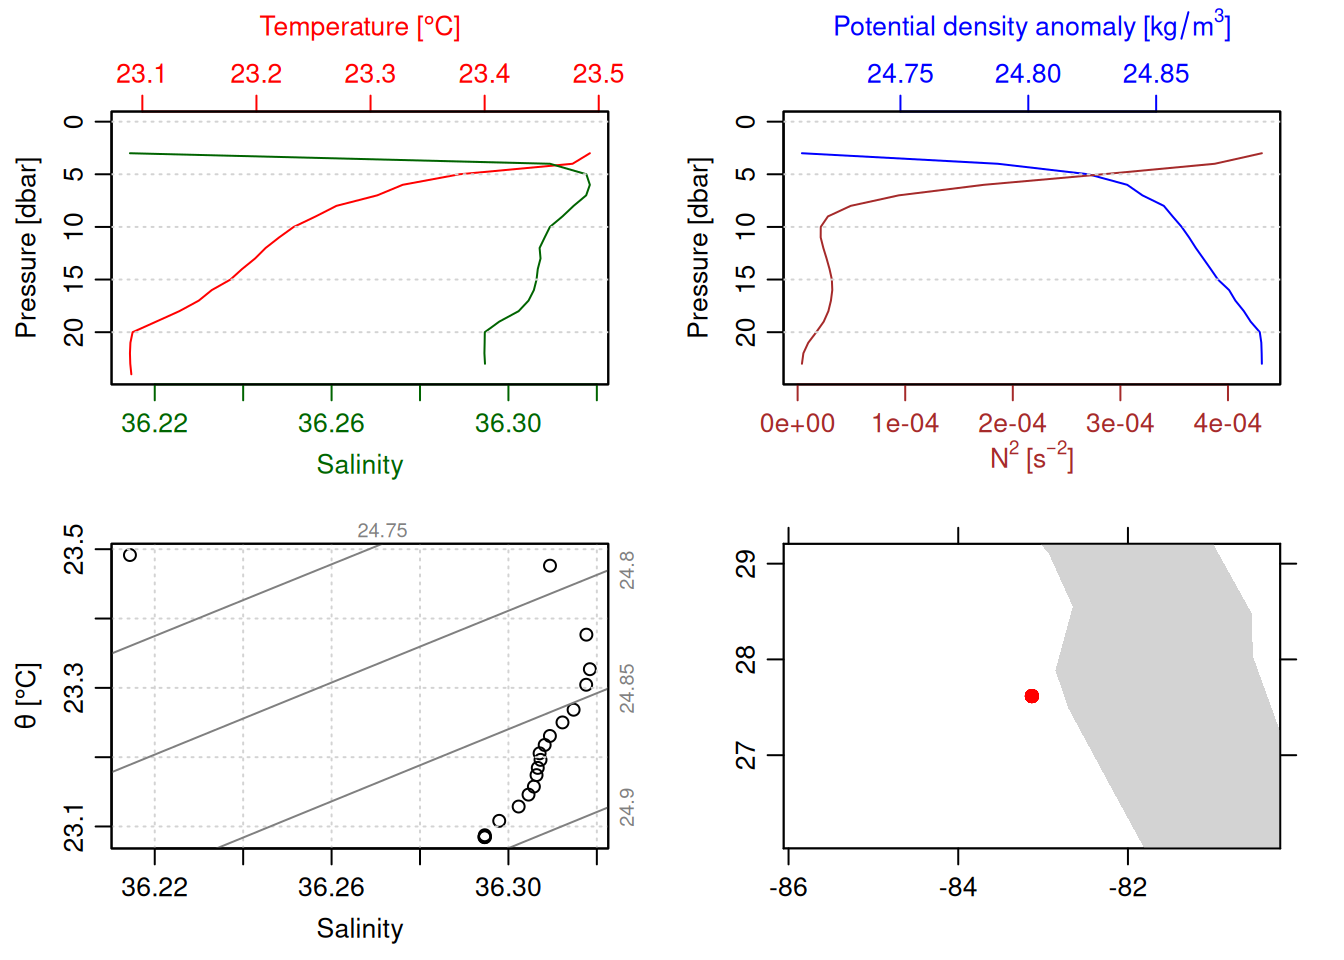
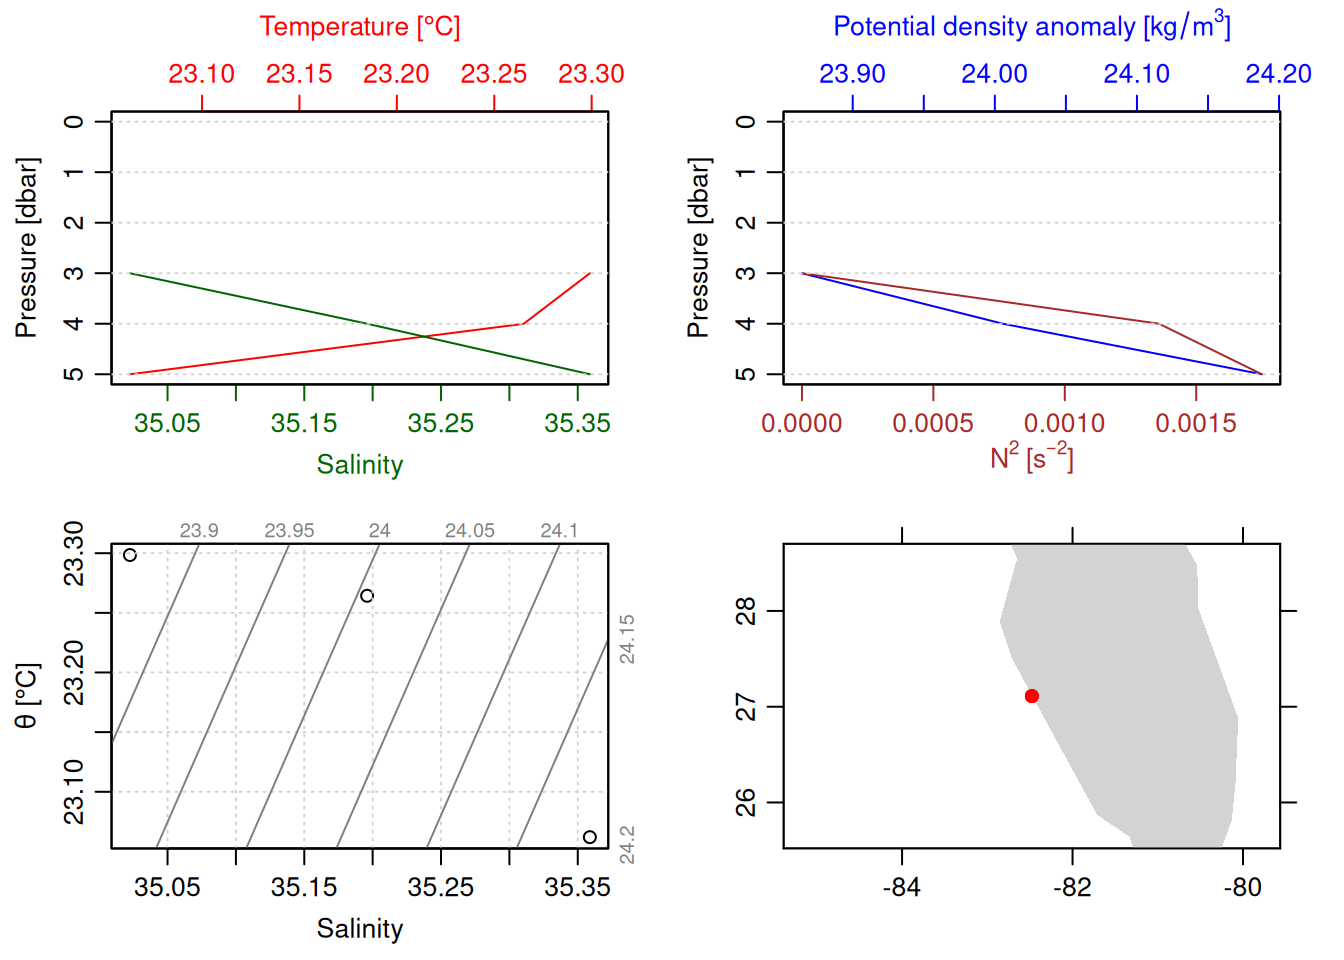
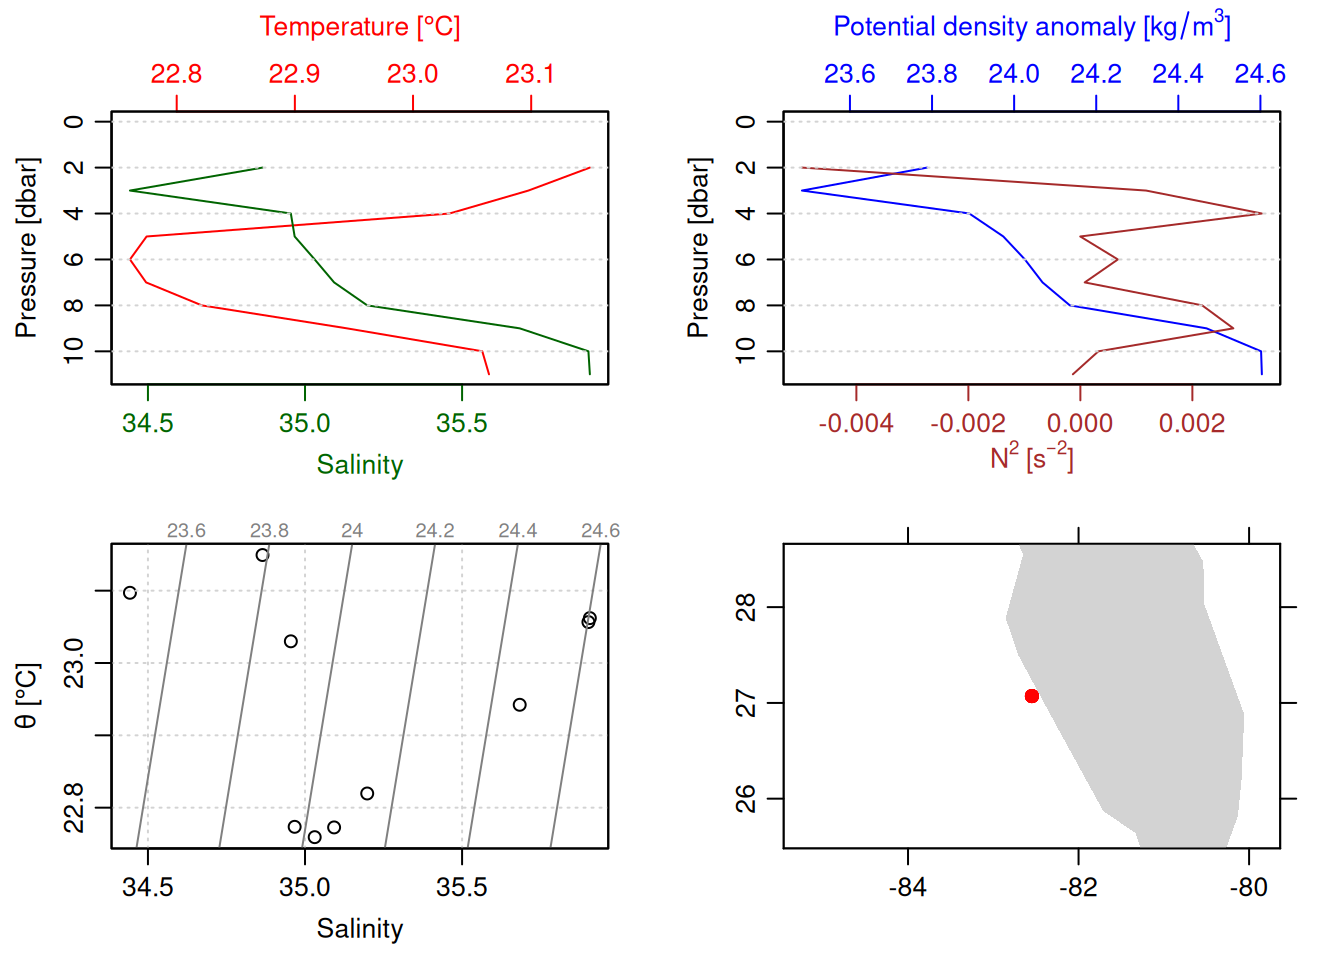
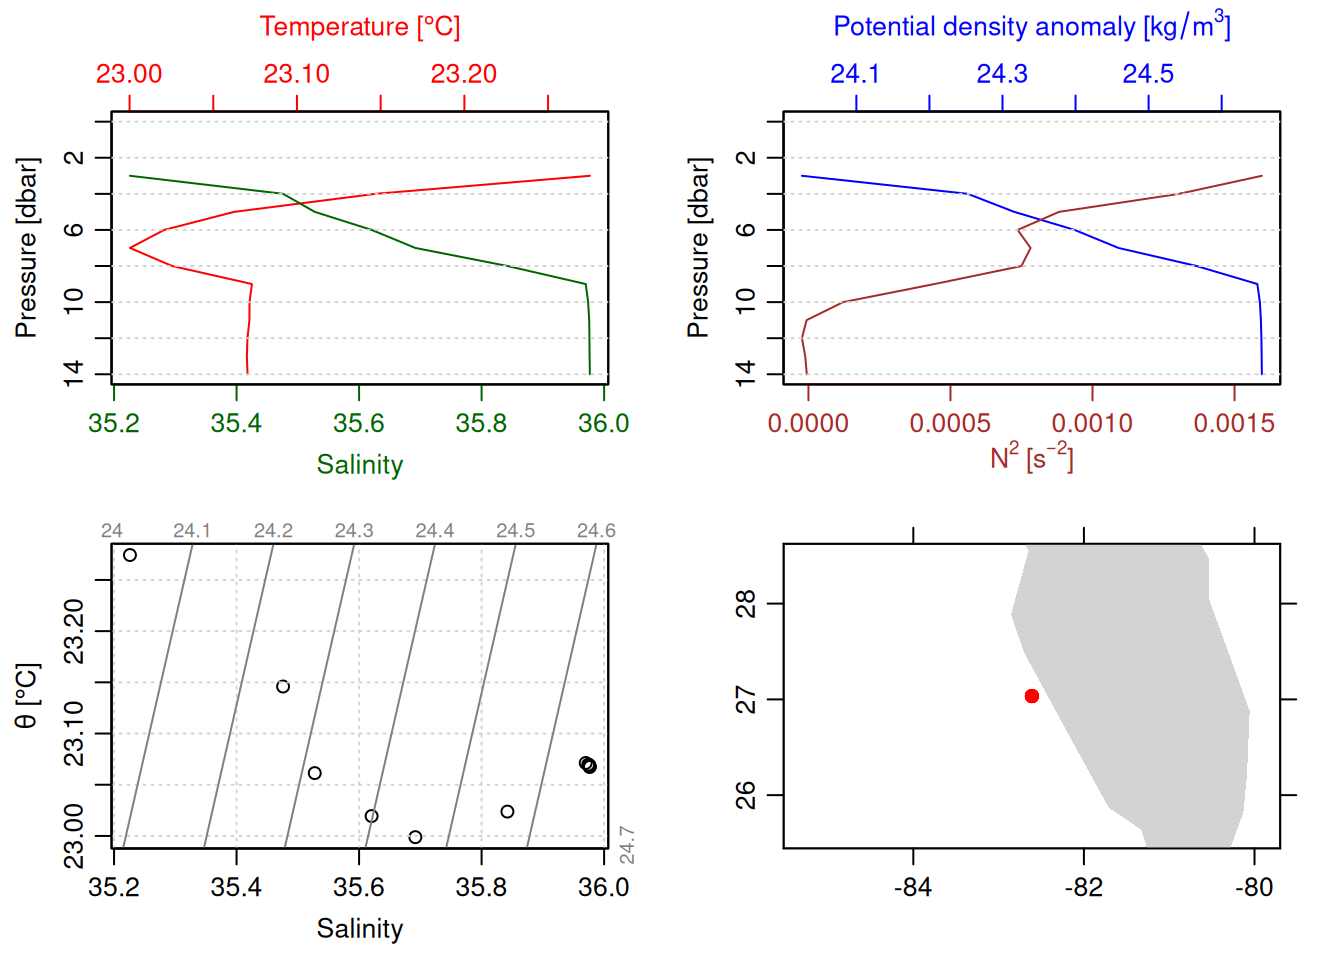
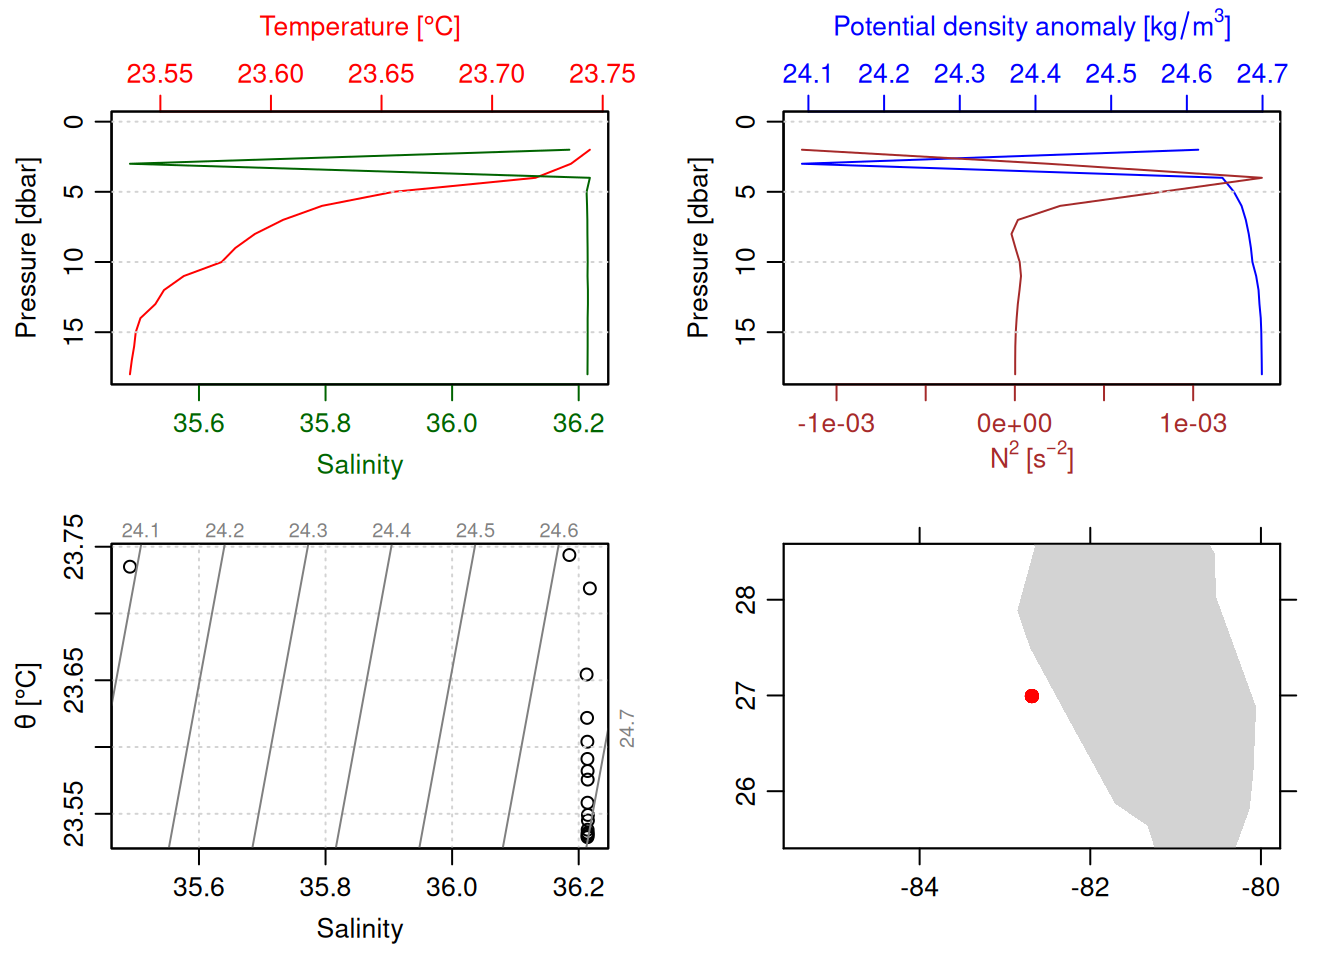
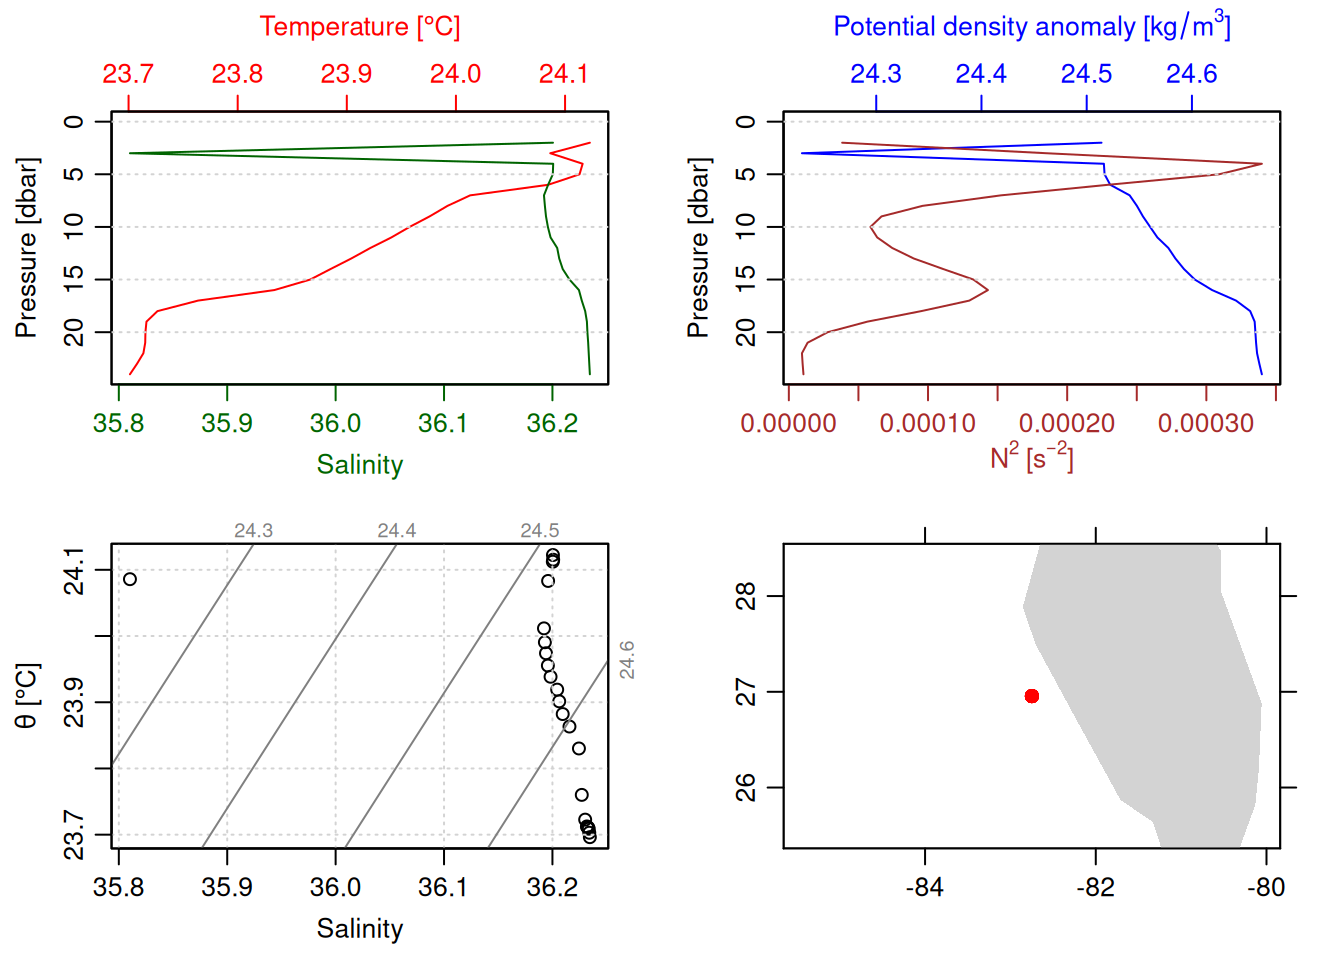
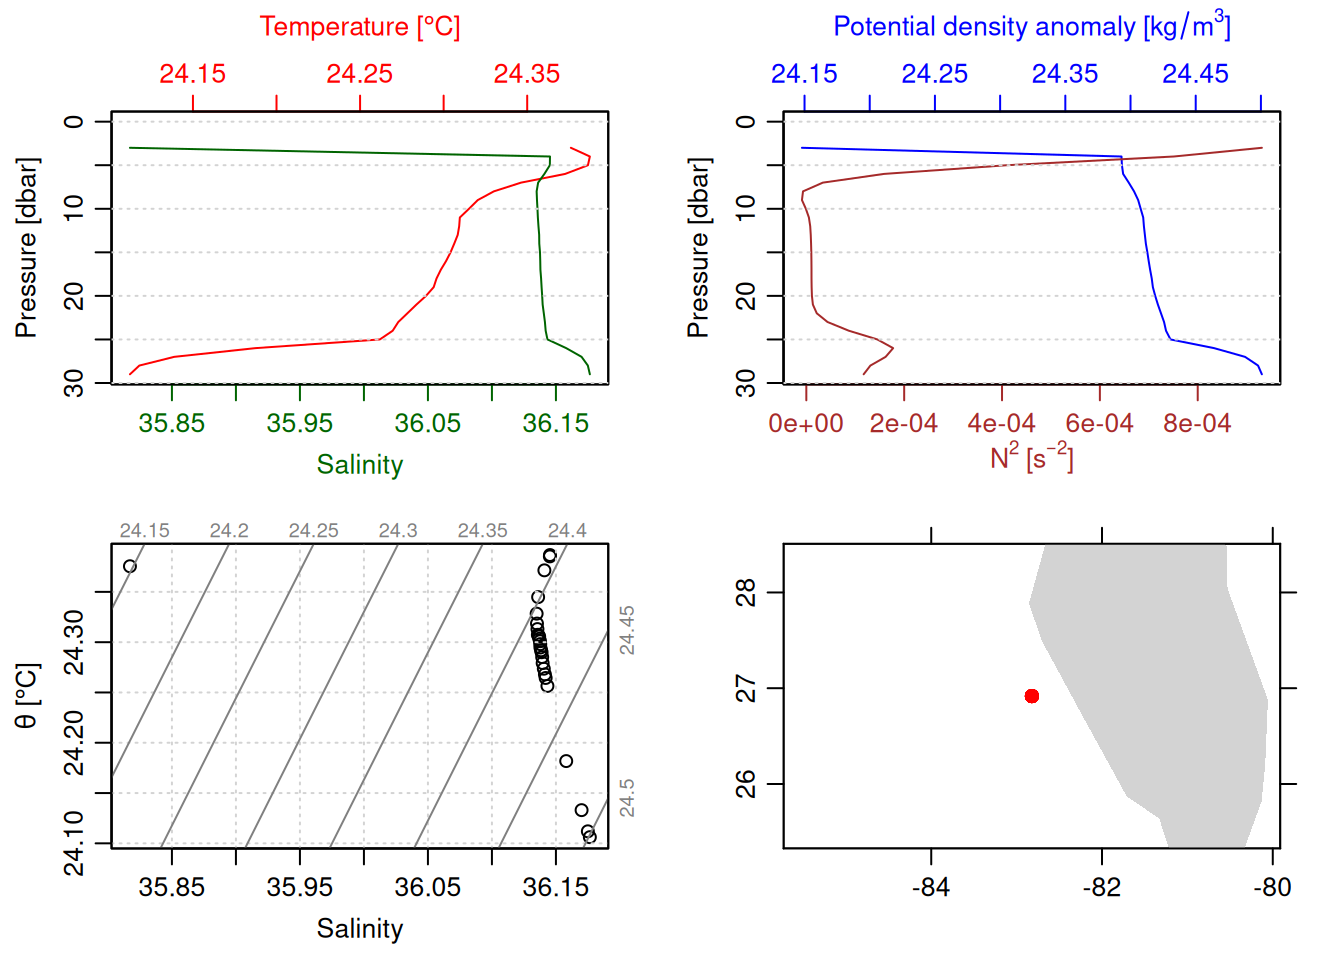
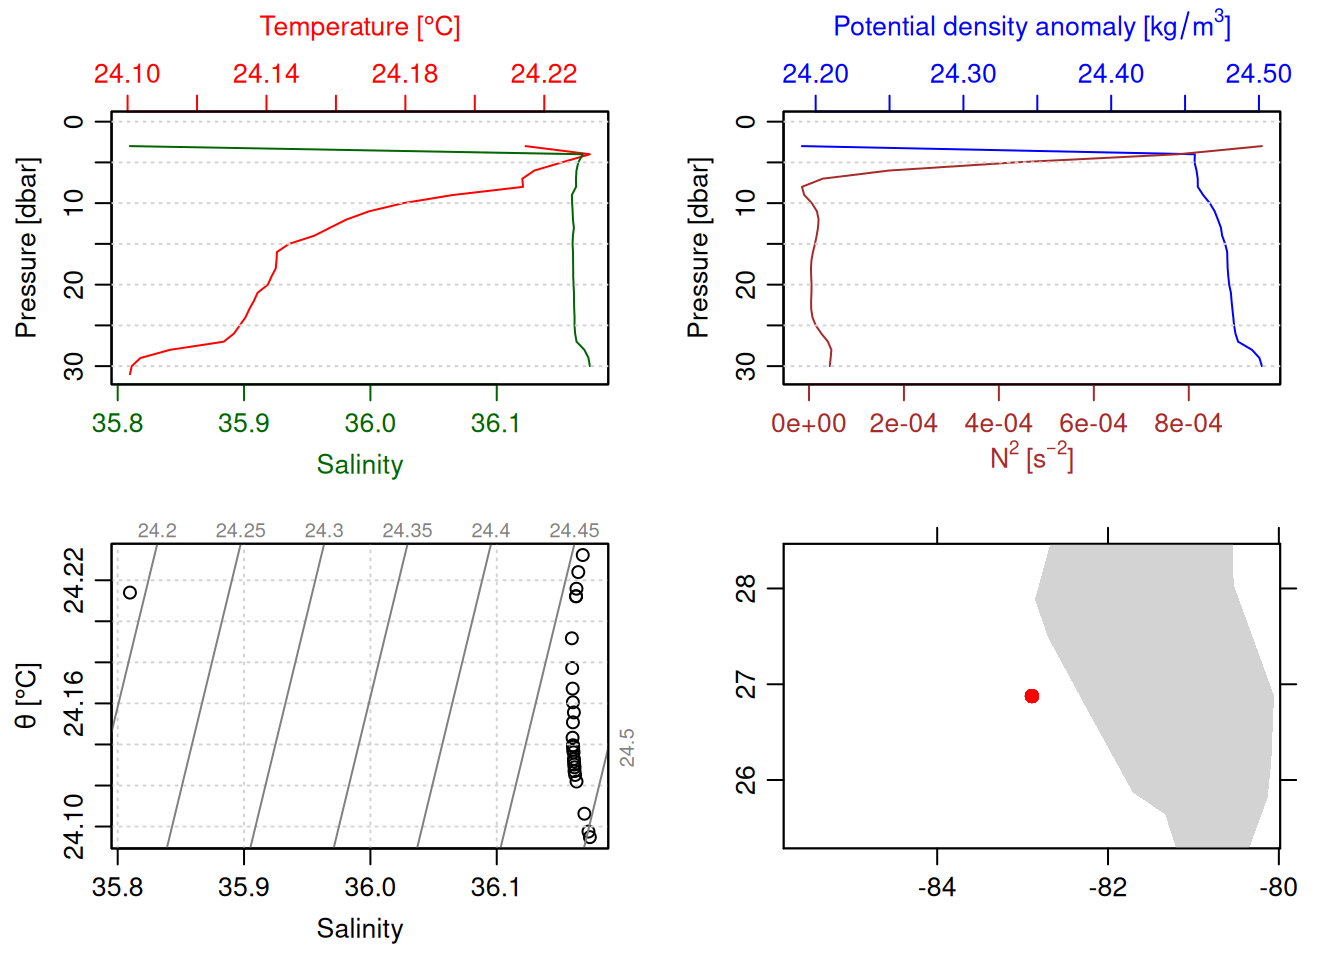
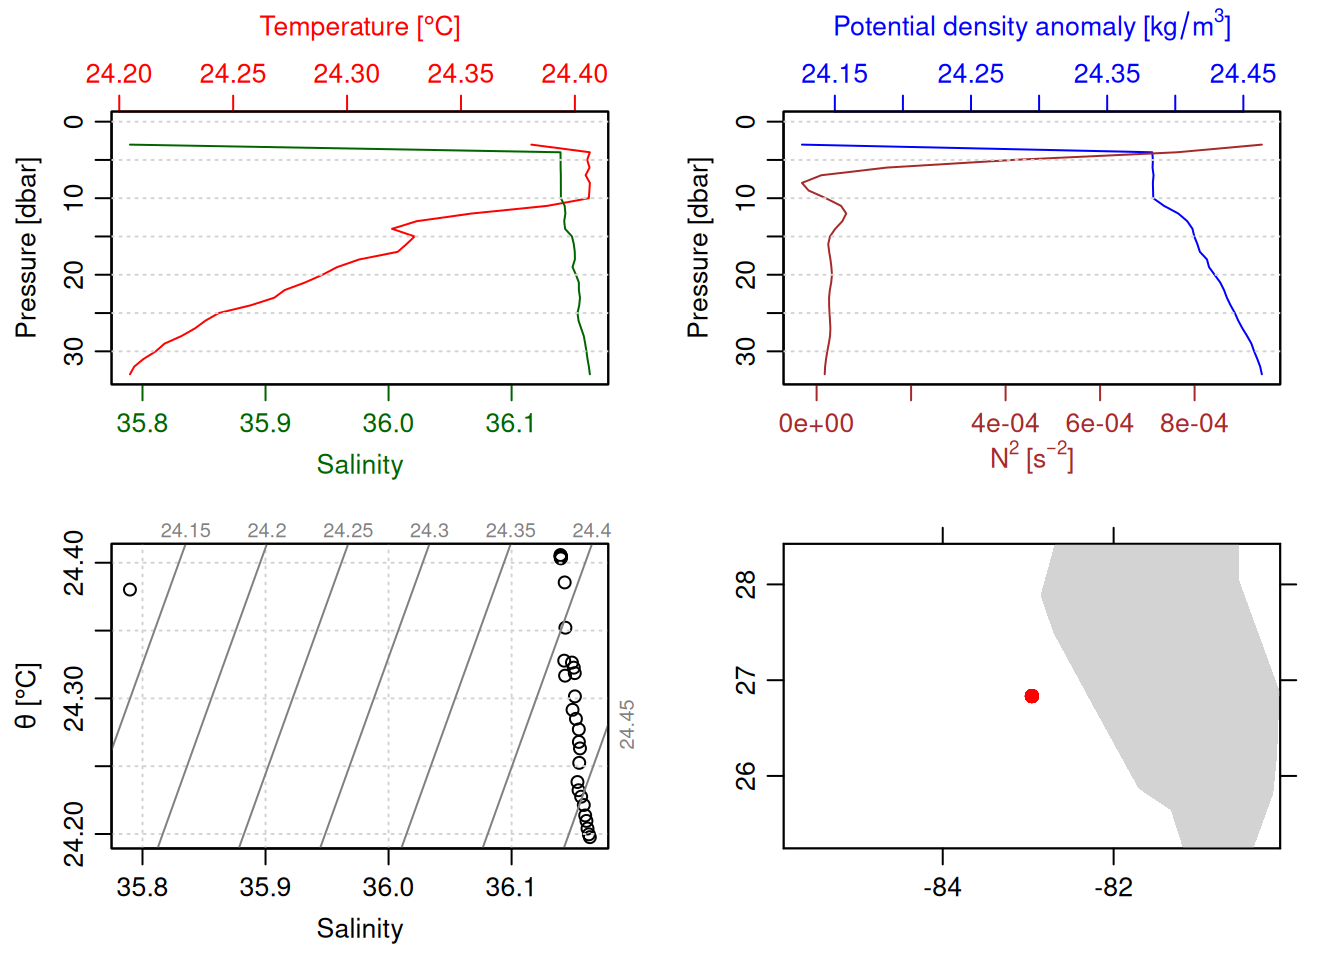
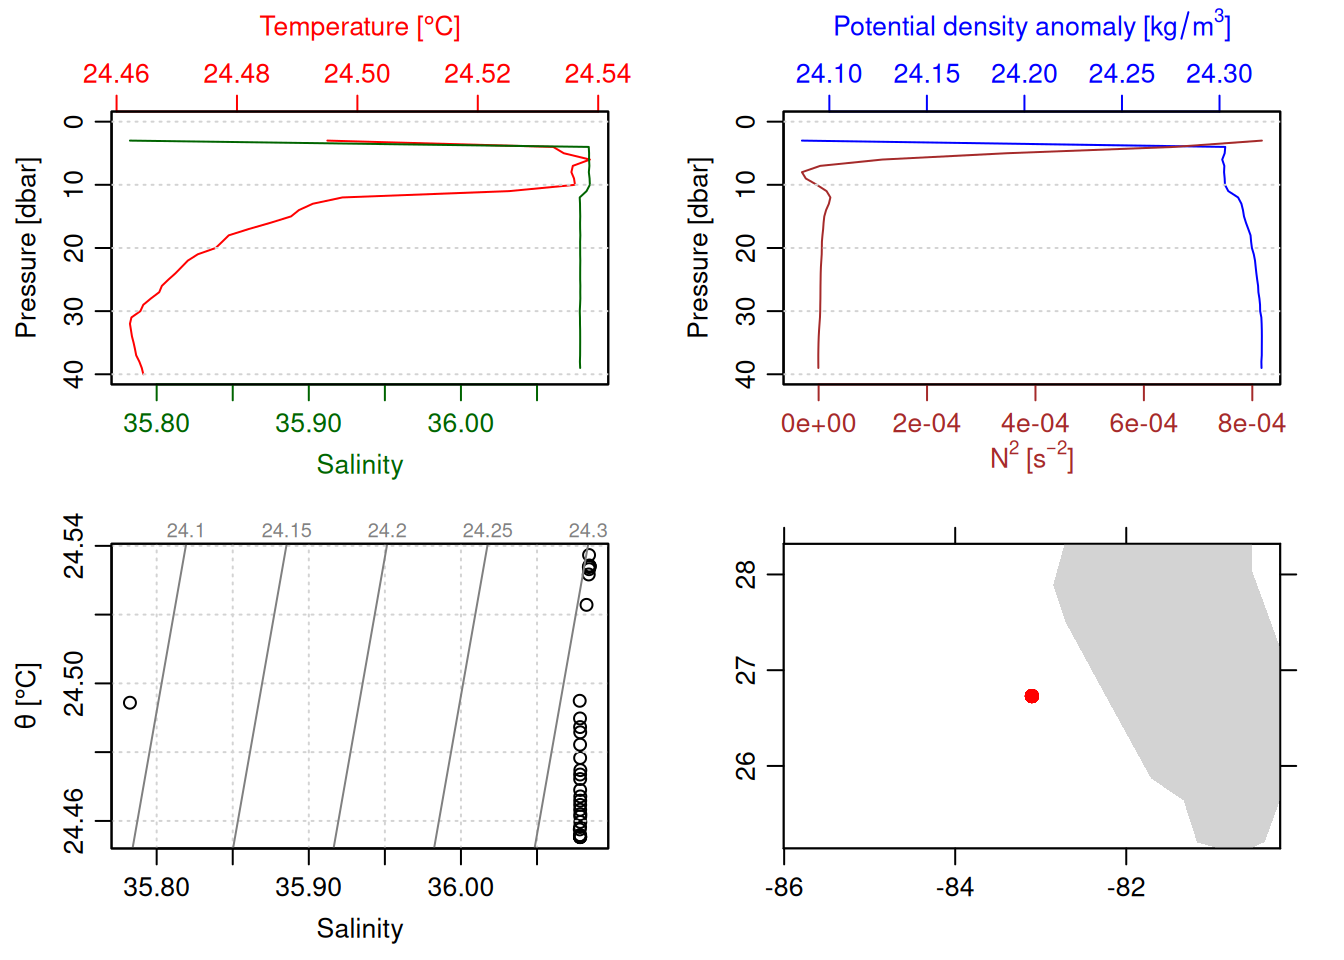
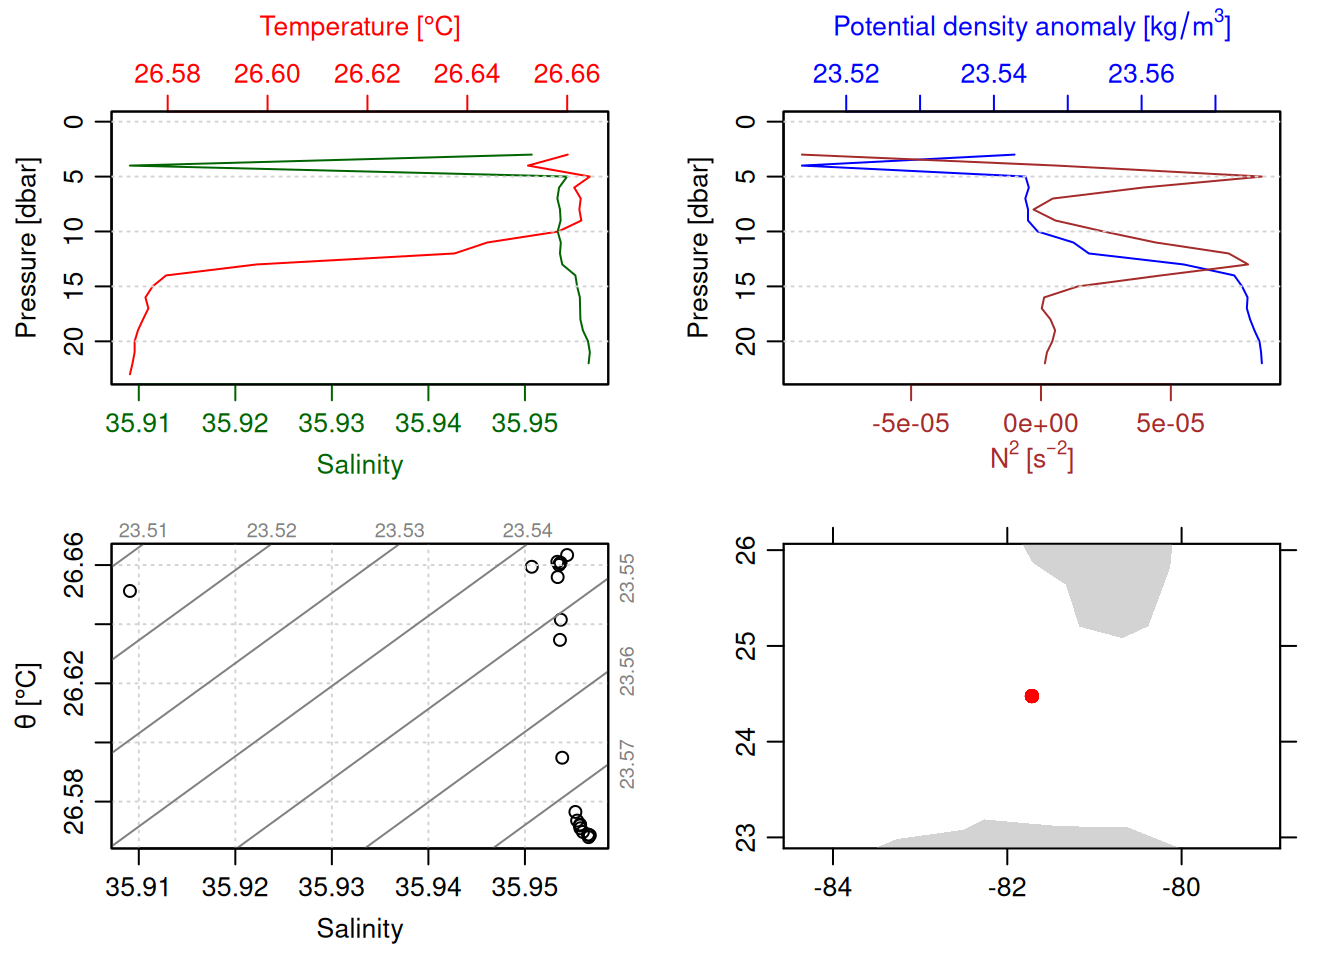
for (i inseq(ctd_FK)){ cast <- ctd_FK[[i]] # 1 is selecting only the first sublisttryCatch({plot(ctdDecimate(ctdTrim(cast))) }, error =function(e){print(e) })}
<simpleError in !is.null(x@metadata$station) && !is.na(x@metadata$station): 'length = 4' in coercion to 'logical(1)'>
<simpleError in !is.null(x@metadata$station) && !is.na(x@metadata$station): 'length = 4962' in coercion to 'logical(1)'>
<simpleError in !is.null(x@metadata$station) && !is.na(x@metadata$station): 'length = 2698' in coercion to 'logical(1)'>
<simpleError in !is.null(x@metadata$station) && !is.na(x@metadata$station): 'length = 4697' in coercion to 'logical(1)'>
<simpleError in !is.null(x@metadata$station) && !is.na(x@metadata$station): 'length = 2713' in coercion to 'logical(1)'>
<simpleError in !is.null(x@metadata$station) && !is.na(x@metadata$station): 'length = 6113' in coercion to 'logical(1)'>
<simpleError in !is.null(x@metadata$station) && !is.na(x@metadata$station): 'length = 4387' in coercion to 'logical(1)'>
<simpleError in !is.null(x@metadata$station) && !is.na(x@metadata$station): 'length = 4676' in coercion to 'logical(1)'>
<simpleError in !is.null(x@metadata$station) && !is.na(x@metadata$station): 'length = 3281' in coercion to 'logical(1)'>
<simpleError in !is.null(x@metadata$station) && !is.na(x@metadata$station): 'length = 2893' in coercion to 'logical(1)'>
<simpleError in !is.null(x@metadata$station) && !is.na(x@metadata$station): 'length = 2880' in coercion to 'logical(1)'>
<simpleError in !is.null(x@metadata$station) && !is.na(x@metadata$station): 'length = 3017' in coercion to 'logical(1)'>
<simpleError in !is.null(x@metadata$station) && !is.na(x@metadata$station): 'length = 2726' in coercion to 'logical(1)'>
<simpleError in !is.null(x@metadata$station) && !is.na(x@metadata$station): 'length = 2659' in coercion to 'logical(1)'>
<simpleError in !is.null(x@metadata$station) && !is.na(x@metadata$station): 'length = 2406' in coercion to 'logical(1)'>
<simpleError in !is.null(x@metadata$station) && !is.na(x@metadata$station): 'length = 3467' in coercion to 'logical(1)'>
<simpleError in !is.null(x@metadata$station) && !is.na(x@metadata$station): 'length = 2588' in coercion to 'logical(1)'>
<simpleError in !is.null(x@metadata$station) && !is.na(x@metadata$station): 'length = 2549' in coercion to 'logical(1)'>
<simpleError in !is.null(x@metadata$station) && !is.na(x@metadata$station): 'length = 3849' in coercion to 'logical(1)'>
<simpleError in !is.null(x@metadata$station) && !is.na(x@metadata$station): 'length = 3622' in coercion to 'logical(1)'>
<simpleError in !is.null(x@metadata$station) && !is.na(x@metadata$station): 'length = 3810' in coercion to 'logical(1)'>
<simpleError in !is.null(x@metadata$station) && !is.na(x@metadata$station): 'length = 3419' in coercion to 'logical(1)'>
<simpleError in !is.null(x@metadata$station) && !is.na(x@metadata$station): 'length = 2' in coercion to 'logical(1)'>
<simpleError in !is.null(x@metadata$station) && !is.na(x@metadata$station): 'length = 4392' in coercion to 'logical(1)'>
<simpleError in !is.null(x@metadata$station) && !is.na(x@metadata$station): 'length = 2492' in coercion to 'logical(1)'>
<simpleError in !is.null(x@metadata$station) && !is.na(x@metadata$station): 'length = 4702' in coercion to 'logical(1)'>
<simpleError in !is.null(x@metadata$station) && !is.na(x@metadata$station): 'length = 9073' in coercion to 'logical(1)'>
<simpleError in !is.null(x@metadata$station) && !is.na(x@metadata$station): 'length = 3392' in coercion to 'logical(1)'>
<simpleError in !is.null(x@metadata$station) && !is.na(x@metadata$station): 'length = 3942' in coercion to 'logical(1)'>
<simpleError in !is.null(x@metadata$station) && !is.na(x@metadata$station): 'length = 4782' in coercion to 'logical(1)'>
<simpleError in !is.null(x@metadata$station) && !is.na(x@metadata$station): 'length = 5058' in coercion to 'logical(1)'>
<simpleError in !is.null(x@metadata$station) && !is.na(x@metadata$station): 'length = 4625' in coercion to 'logical(1)'>
<simpleError in !is.null(x@metadata$station) && !is.na(x@metadata$station): 'length = 5327' in coercion to 'logical(1)'>
<simpleError in !is.null(x@metadata$station) && !is.na(x@metadata$station): 'length = 5106' in coercion to 'logical(1)'>
<simpleError in !is.null(x@metadata$station) && !is.na(x@metadata$station): 'length = 6270' in coercion to 'logical(1)'>
<simpleError in !is.null(x@metadata$station) && !is.na(x@metadata$station): 'length = 6002' in coercion to 'logical(1)'>
<simpleError in !is.null(x@metadata$station) && !is.na(x@metadata$station): 'length = 3746' in coercion to 'logical(1)'>
<simpleError in !is.null(x@metadata$station) && !is.na(x@metadata$station): 'length = 3374' in coercion to 'logical(1)'>
<simpleError in !is.null(x@metadata$station) && !is.na(x@metadata$station): 'length = 4823' in coercion to 'logical(1)'>
<simpleError in !is.null(x@metadata$station) && !is.na(x@metadata$station): 'length = 4014' in coercion to 'logical(1)'>
<simpleError in !is.null(x@metadata$station) && !is.na(x@metadata$station): 'length = 3132' in coercion to 'logical(1)'>
<simpleError in !is.null(x@metadata$station) && !is.na(x@metadata$station): 'length = 3192' in coercion to 'logical(1)'>
<simpleError in !is.null(x@metadata$station) && !is.na(x@metadata$station): 'length = 3959' in coercion to 'logical(1)'>
<simpleError in !is.null(x@metadata$station) && !is.na(x@metadata$station): 'length = 4531' in coercion to 'logical(1)'>
<simpleError in !is.null(x@metadata$station) && !is.na(x@metadata$station): 'length = 4384' in coercion to 'logical(1)'>
<simpleError in !is.null(x@metadata$station) && !is.na(x@metadata$station): 'length = 3' in coercion to 'logical(1)'>
<simpleError in !is.null(x@metadata$station) && !is.na(x@metadata$station): 'length = 2768' in coercion to 'logical(1)'>
<simpleError in !is.null(x@metadata$station) && !is.na(x@metadata$station): 'length = 3104' in coercion to 'logical(1)'>
<simpleError in !is.null(x@metadata$station) && !is.na(x@metadata$station): 'length = 3878' in coercion to 'logical(1)'>
<simpleError in !is.null(x@metadata$station) && !is.na(x@metadata$station): 'length = 4680' in coercion to 'logical(1)'>
<simpleError in !is.null(x@metadata$station) && !is.na(x@metadata$station): 'length = 3458' in coercion to 'logical(1)'>
<simpleError in !is.null(x@metadata$station) && !is.na(x@metadata$station): 'length = 3771' in coercion to 'logical(1)'>
<simpleError in !is.null(x@metadata$station) && !is.na(x@metadata$station): 'length = 4397' in coercion to 'logical(1)'>
<simpleError in !is.null(x@metadata$station) && !is.na(x@metadata$station): 'length = 2946' in coercion to 'logical(1)'>
<simpleError in !is.null(x@metadata$station) && !is.na(x@metadata$station): 'length = 4914' in coercion to 'logical(1)'>
<simpleError in !is.null(x@metadata$station) && !is.na(x@metadata$station): 'length = 6961' in coercion to 'logical(1)'>
<simpleError in !is.null(x@metadata$station) && !is.na(x@metadata$station): 'length = 5775' in coercion to 'logical(1)'>
<simpleError in !is.null(x@metadata$station) && !is.na(x@metadata$station): 'length = 5180' in coercion to 'logical(1)'>
<simpleError in !is.null(x@metadata$station) && !is.na(x@metadata$station): 'length = 5551' in coercion to 'logical(1)'>
<simpleError in !is.null(x@metadata$station) && !is.na(x@metadata$station): 'length = 2990' in coercion to 'logical(1)'>
<simpleError in !is.null(x@metadata$station) && !is.na(x@metadata$station): 'length = 3154' in coercion to 'logical(1)'>
<simpleError in !is.null(x@metadata$station) && !is.na(x@metadata$station): 'length = 3810' in coercion to 'logical(1)'>
<simpleError in !is.null(x@metadata$station) && !is.na(x@metadata$station): 'length = 4376' in coercion to 'logical(1)'>
<simpleError in !is.null(x@metadata$station) && !is.na(x@metadata$station): 'length = 2848' in coercion to 'logical(1)'>
<simpleError in !is.null(x@metadata$station) && !is.na(x@metadata$station): 'length = 5350' in coercion to 'logical(1)'>
<simpleError in !is.null(x@metadata$station) && !is.na(x@metadata$station): 'length = 3141' in coercion to 'logical(1)'>
<simpleError in !is.null(x@metadata$station) && !is.na(x@metadata$station): 'length = 4004' in coercion to 'logical(1)'>
<simpleError in !is.null(x@metadata$station) && !is.na(x@metadata$station): 'length = 4058' in coercion to 'logical(1)'>
<simpleError in !is.null(x@metadata$station) && !is.na(x@metadata$station): 'length = 5301' in coercion to 'logical(1)'>
<simpleError in !is.null(x@metadata$station) && !is.na(x@metadata$station): 'length = 3901' in coercion to 'logical(1)'>
<simpleError in !is.null(x@metadata$station) && !is.na(x@metadata$station): 'length = 3752' in coercion to 'logical(1)'>
<simpleError in !is.null(x@metadata$station) && !is.na(x@metadata$station): 'length = 3774' in coercion to 'logical(1)'>
<simpleError in !is.null(x@metadata$station) && !is.na(x@metadata$station): 'length = 3651' in coercion to 'logical(1)'>
<simpleError in !is.null(x@metadata$station) && !is.na(x@metadata$station): 'length = 5442' in coercion to 'logical(1)'>
<simpleError in !is.null(x@metadata$station) && !is.na(x@metadata$station): 'length = 4826' in coercion to 'logical(1)'>
<simpleError in !is.null(x@metadata$station) && !is.na(x@metadata$station): 'length = 4717' in coercion to 'logical(1)'>
<simpleError in !is.null(x@metadata$station) && !is.na(x@metadata$station): 'length = 5135' in coercion to 'logical(1)'>
<simpleError in !is.null(x@metadata$station) && !is.na(x@metadata$station): 'length = 5212' in coercion to 'logical(1)'>
<simpleError in !is.null(x@metadata$station) && !is.na(x@metadata$station): 'length = 5575' in coercion to 'logical(1)'>
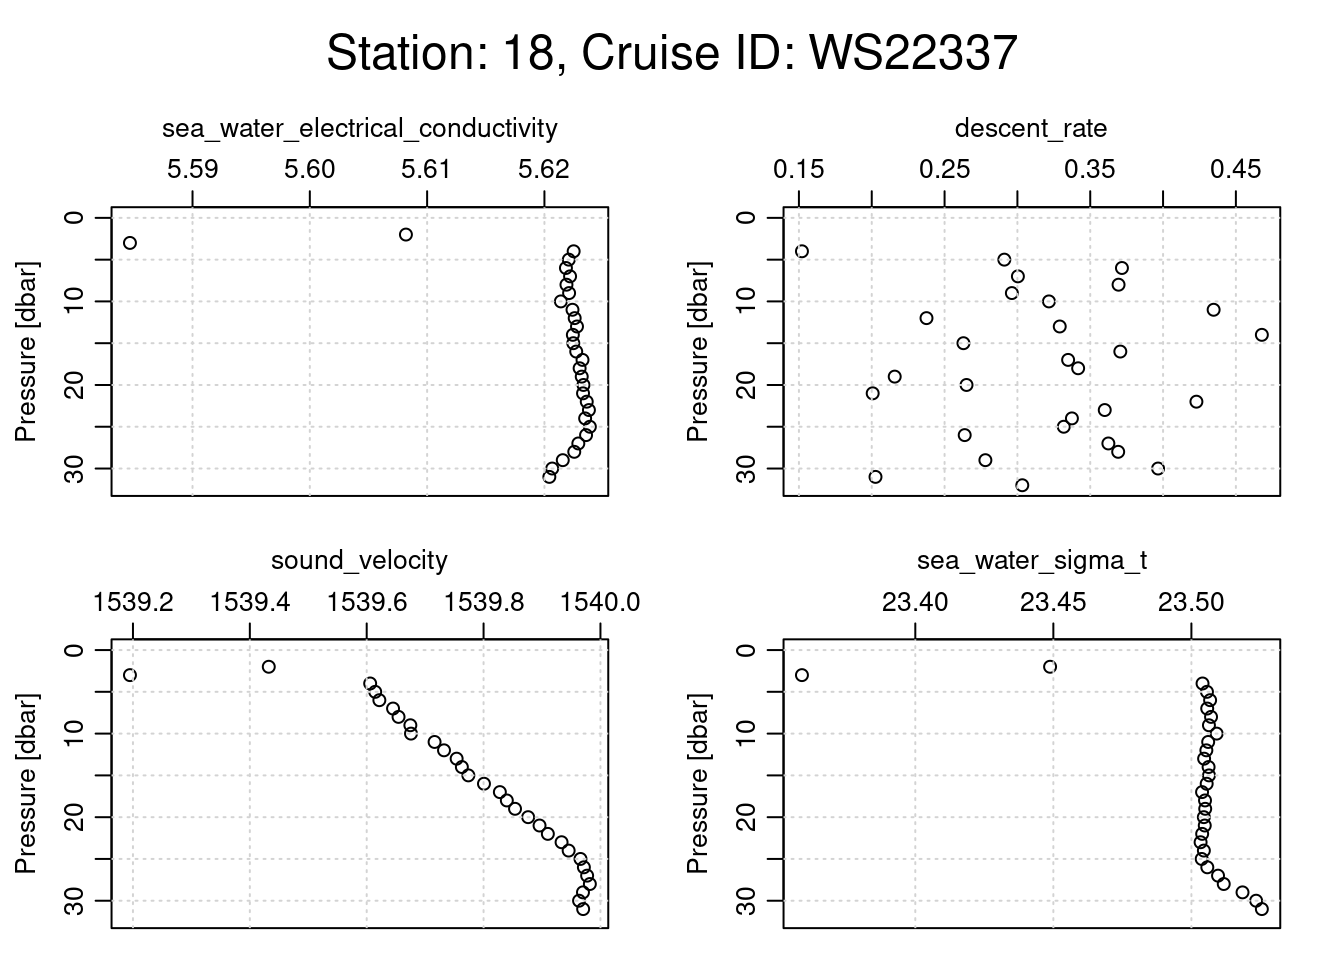
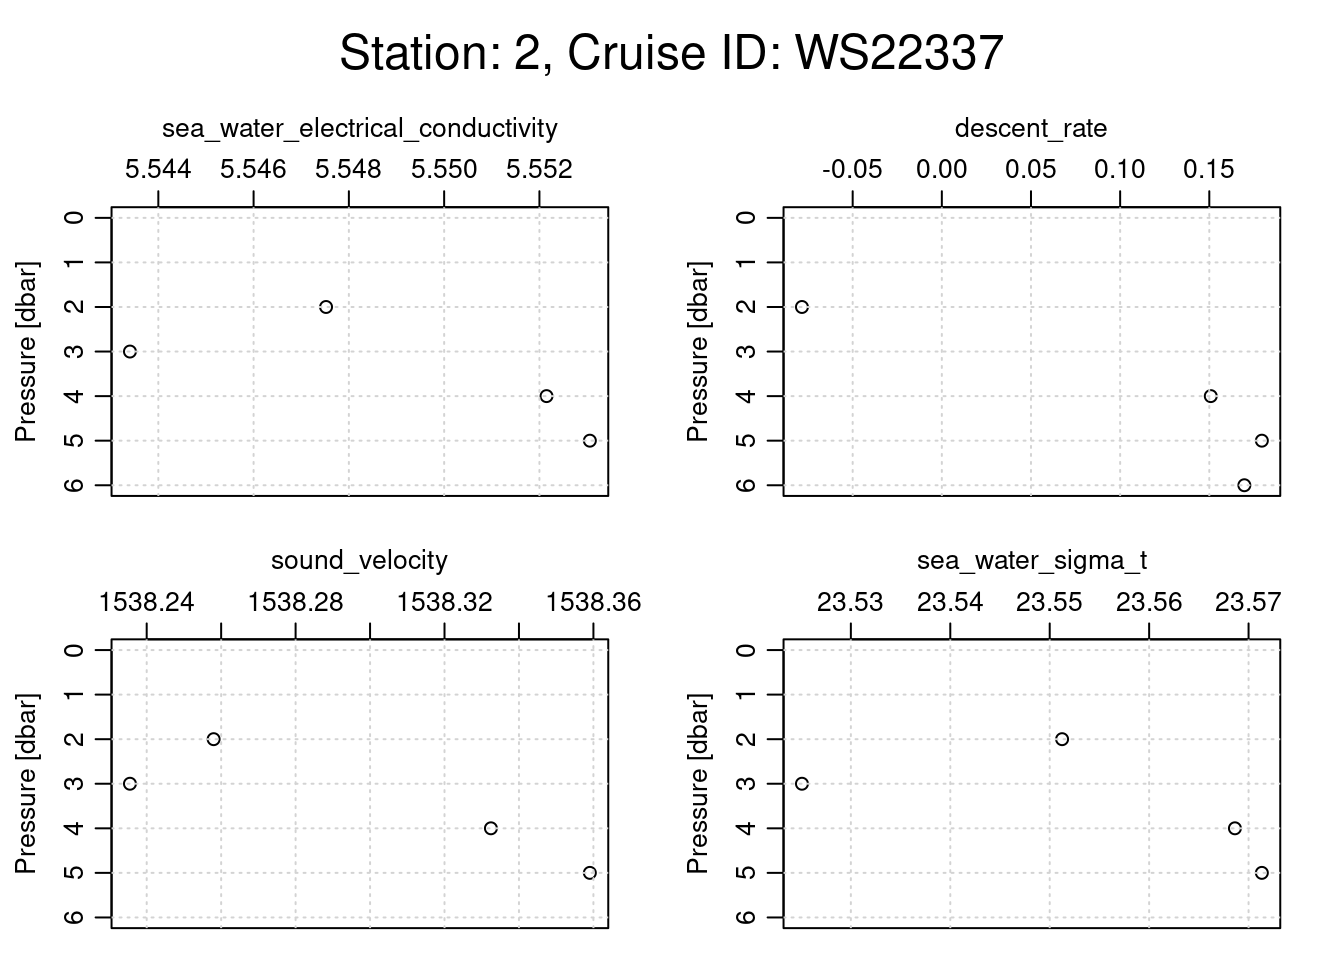
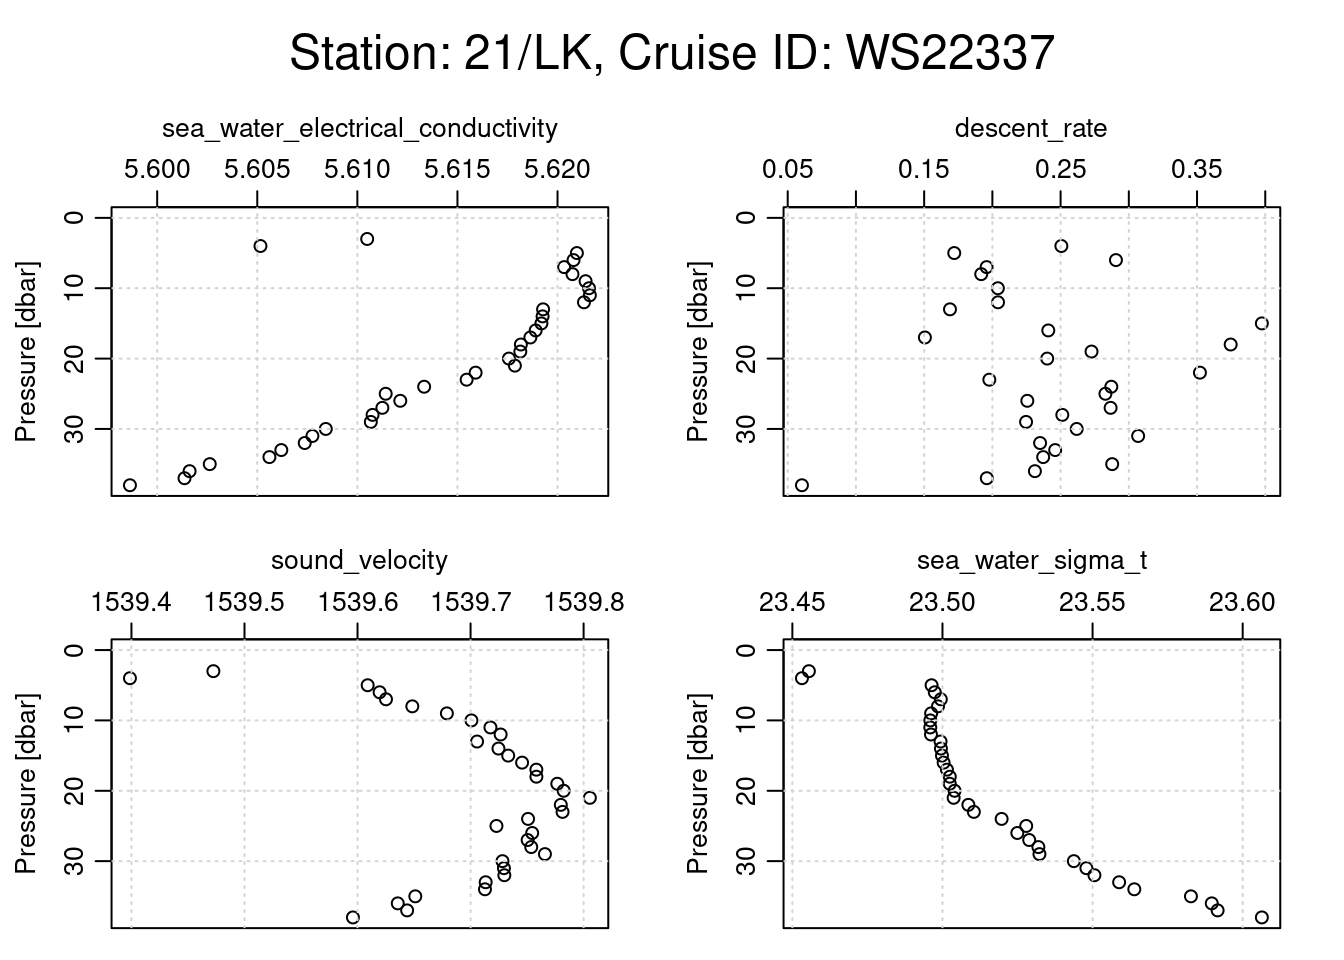
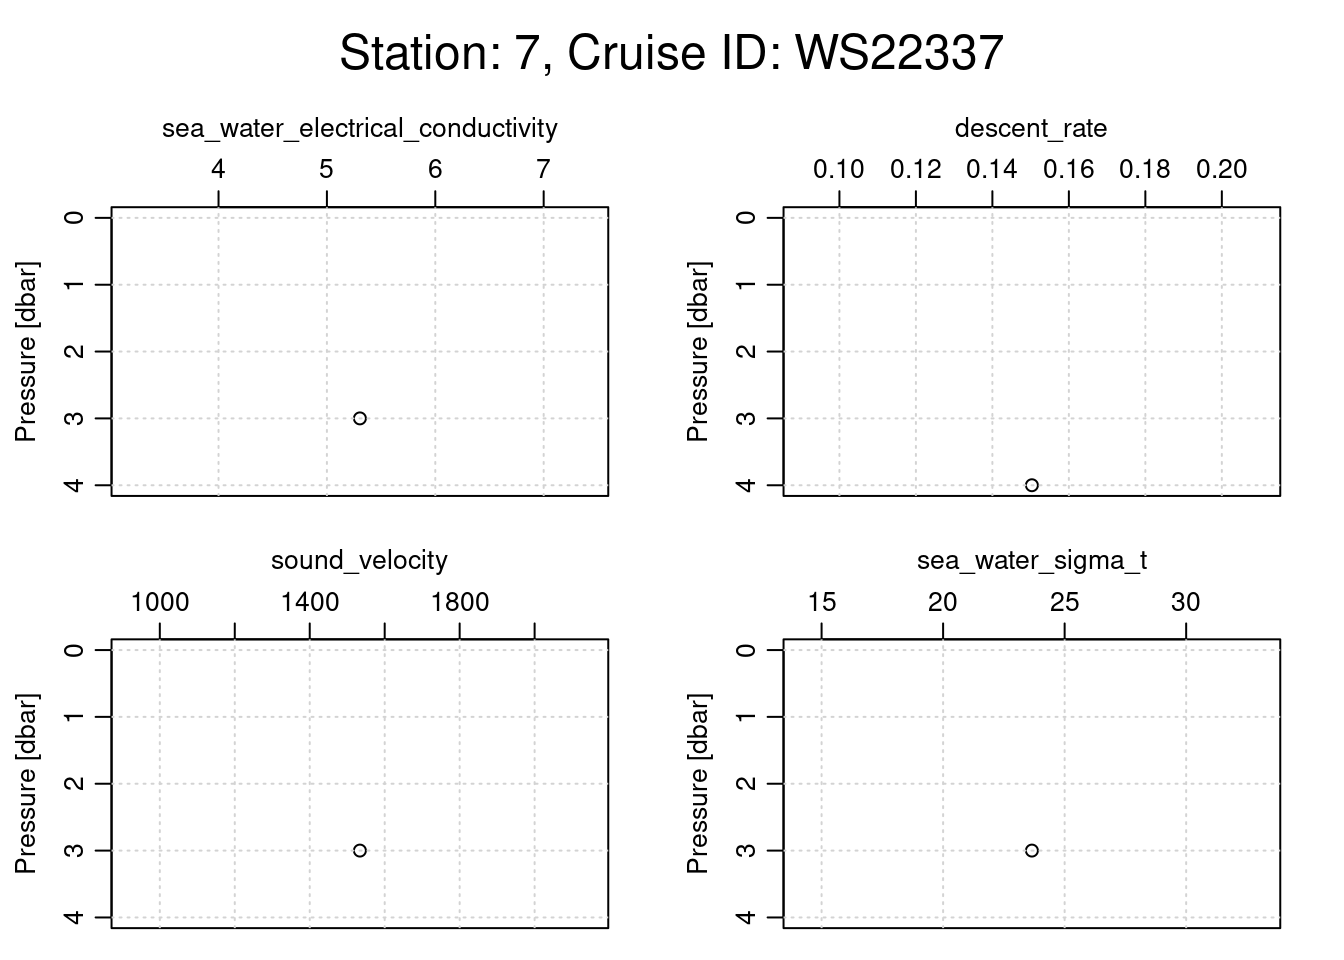
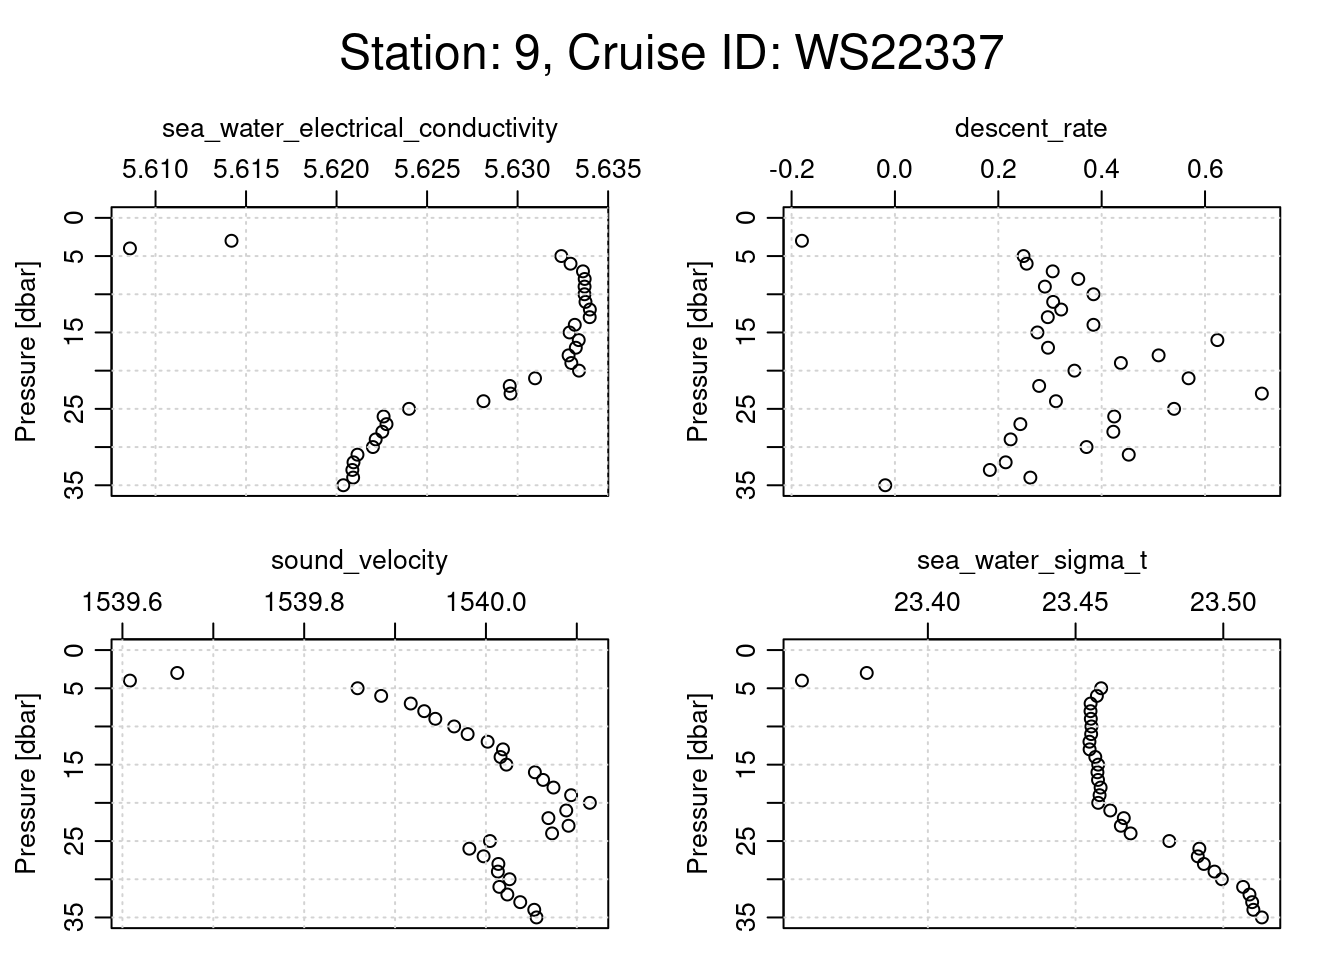
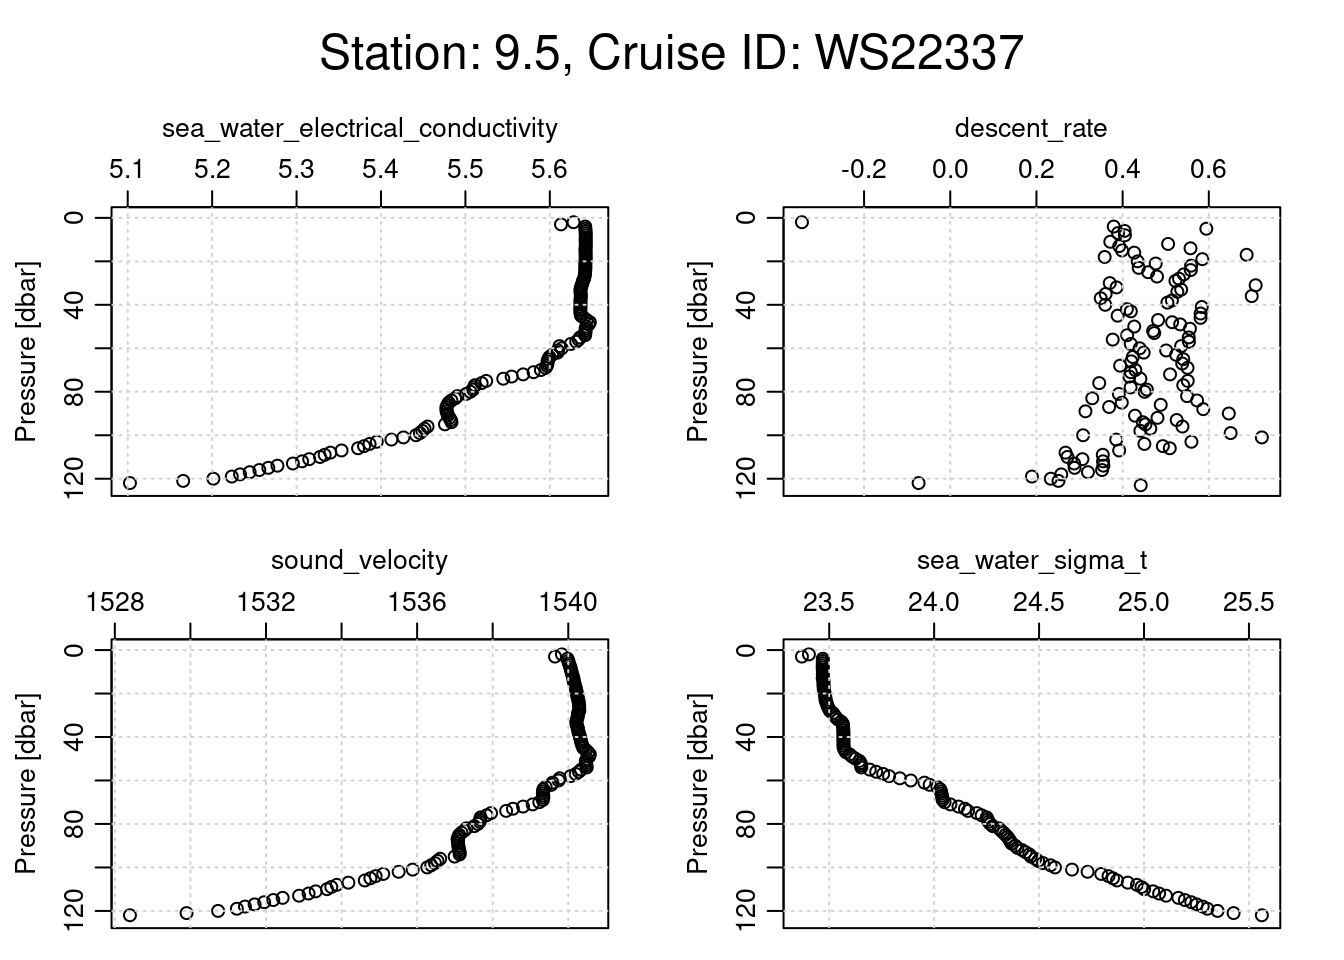
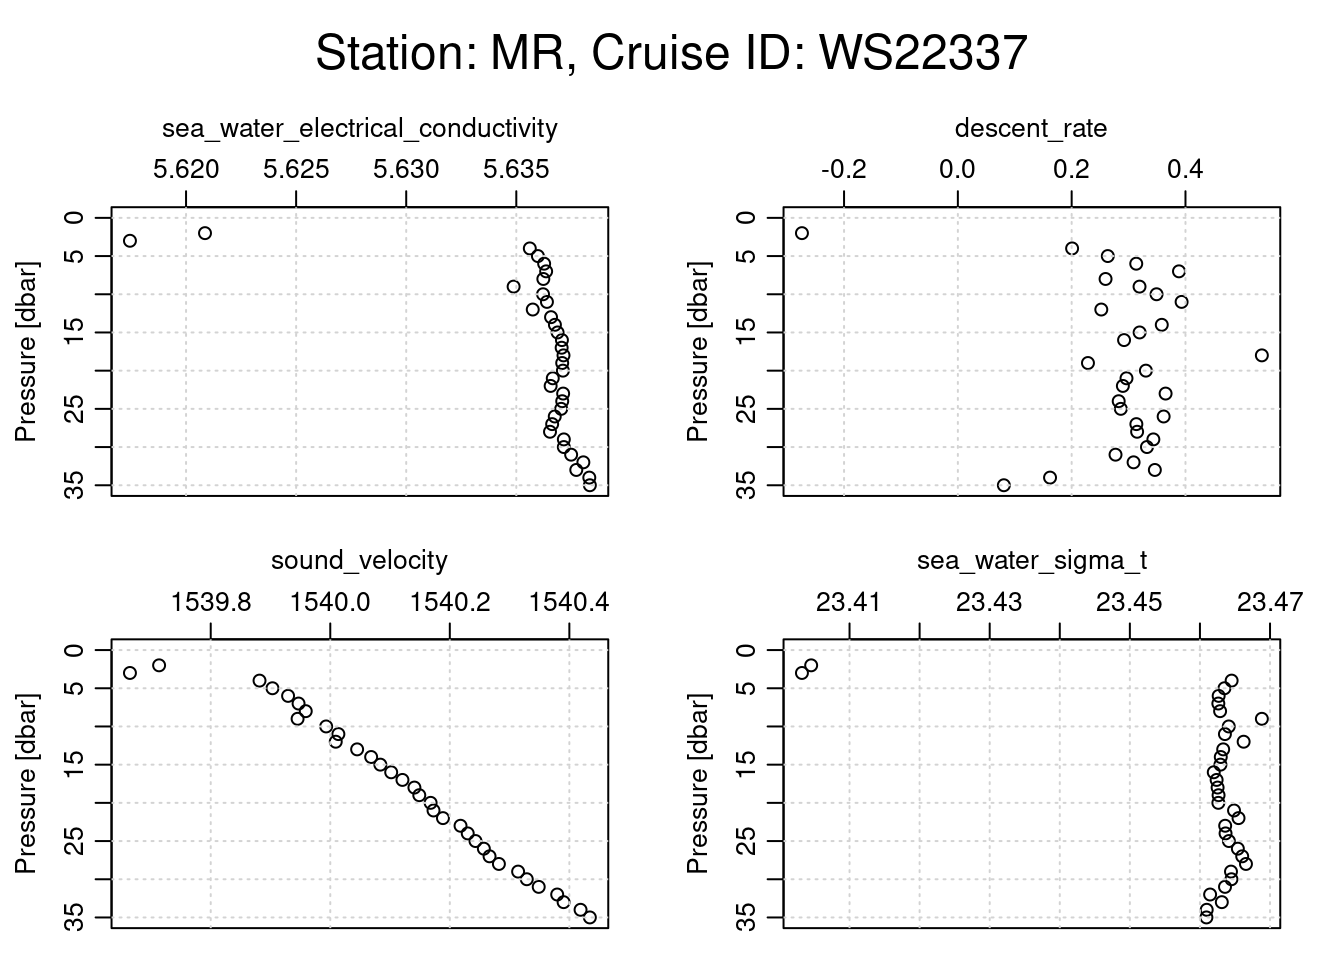
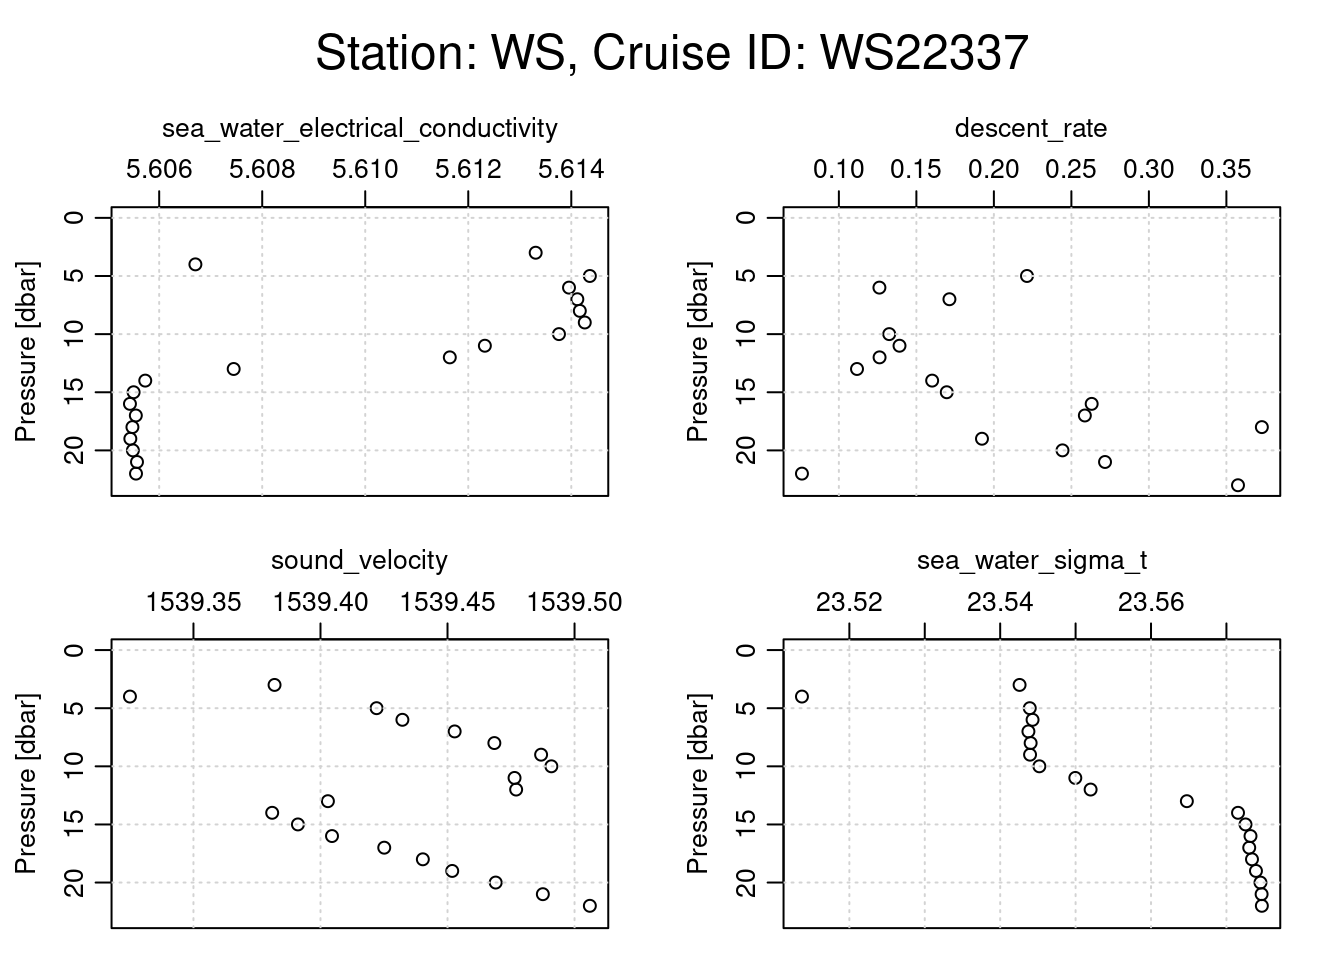
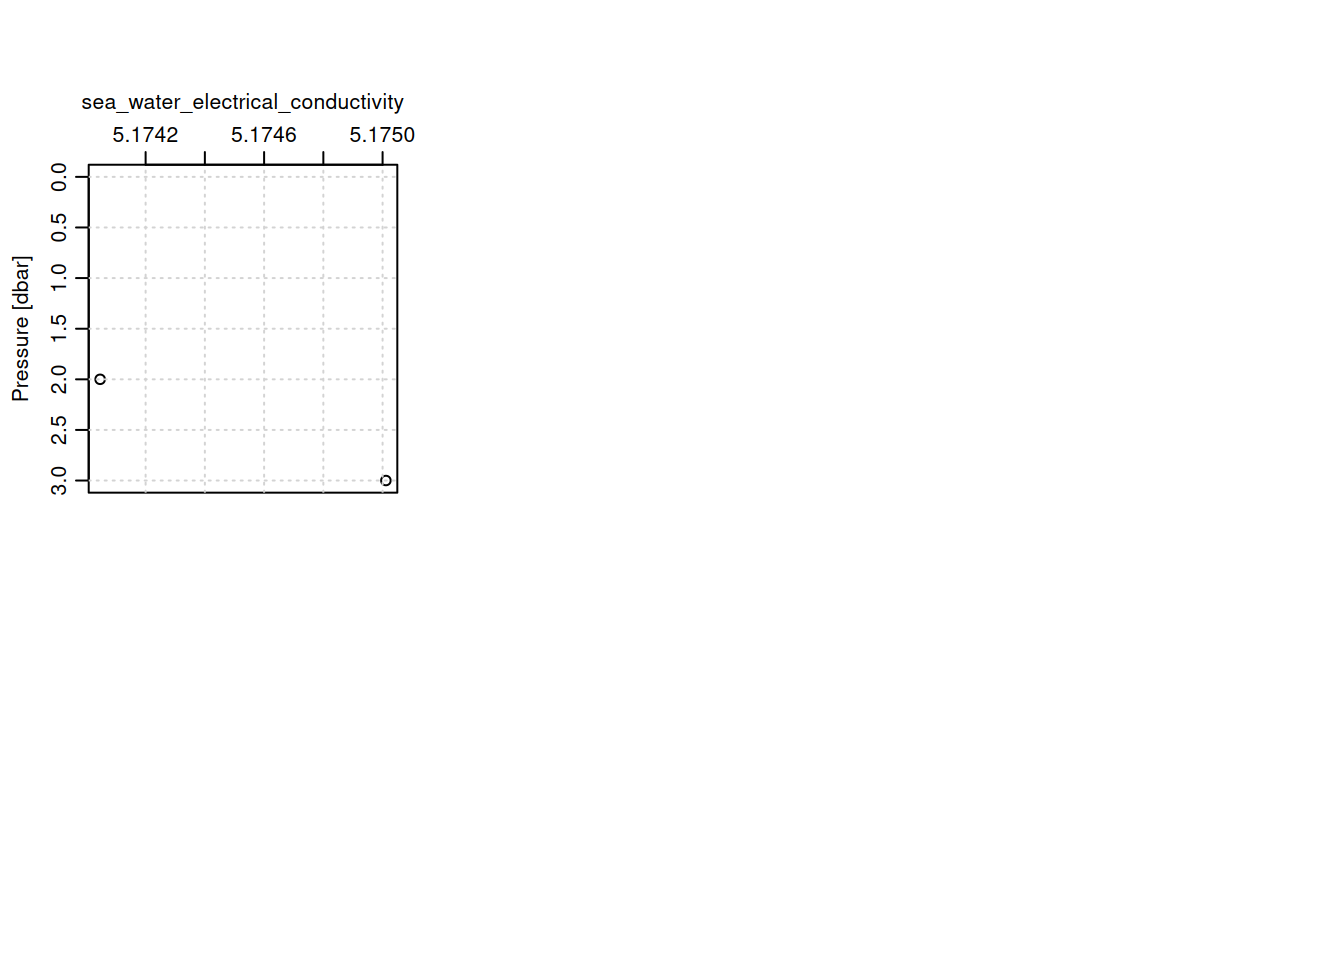
plotting other physical parameters for each cast
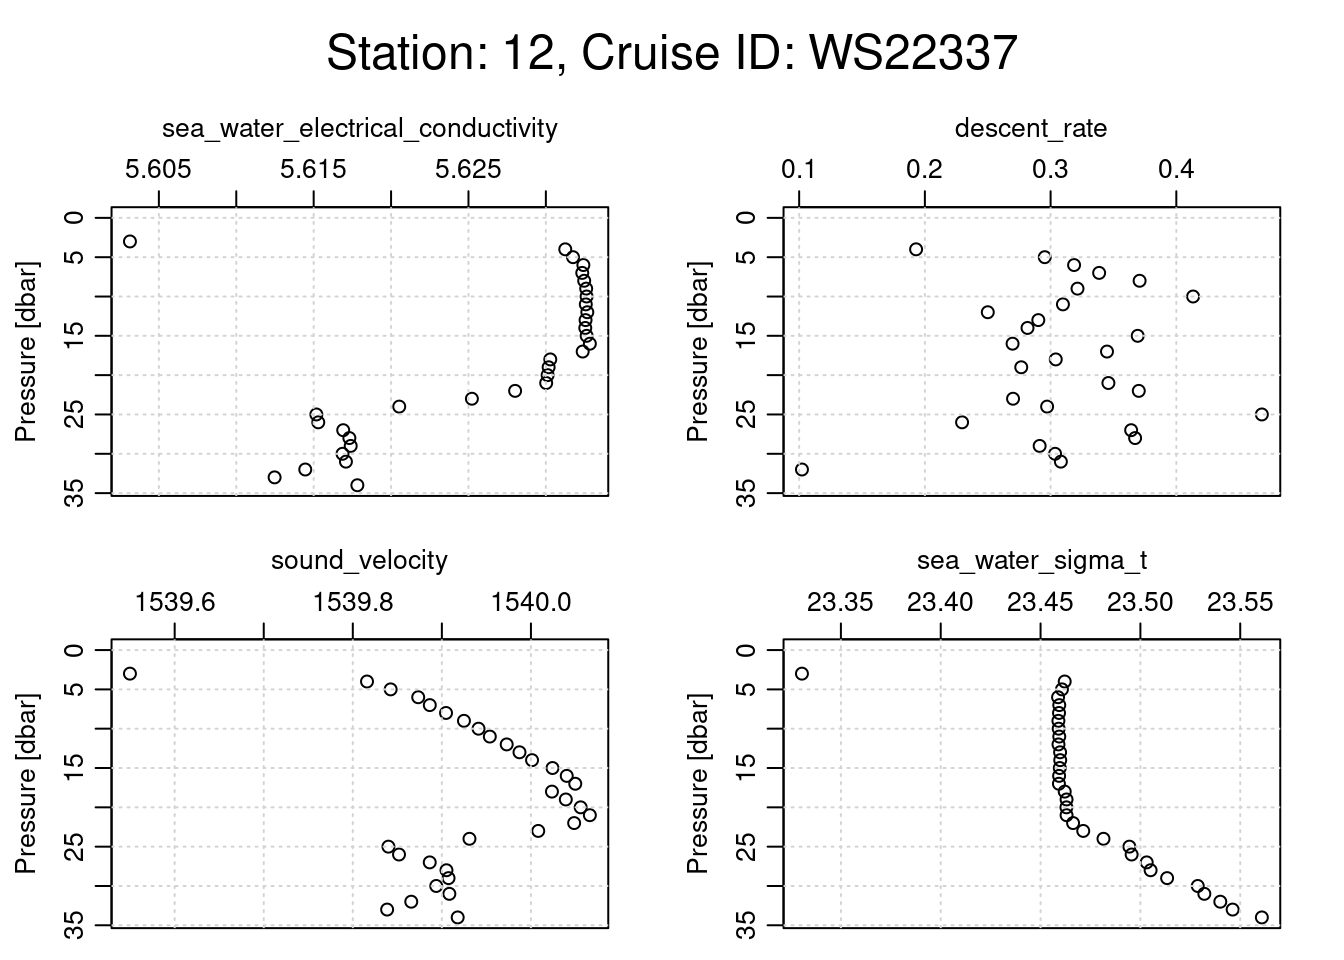
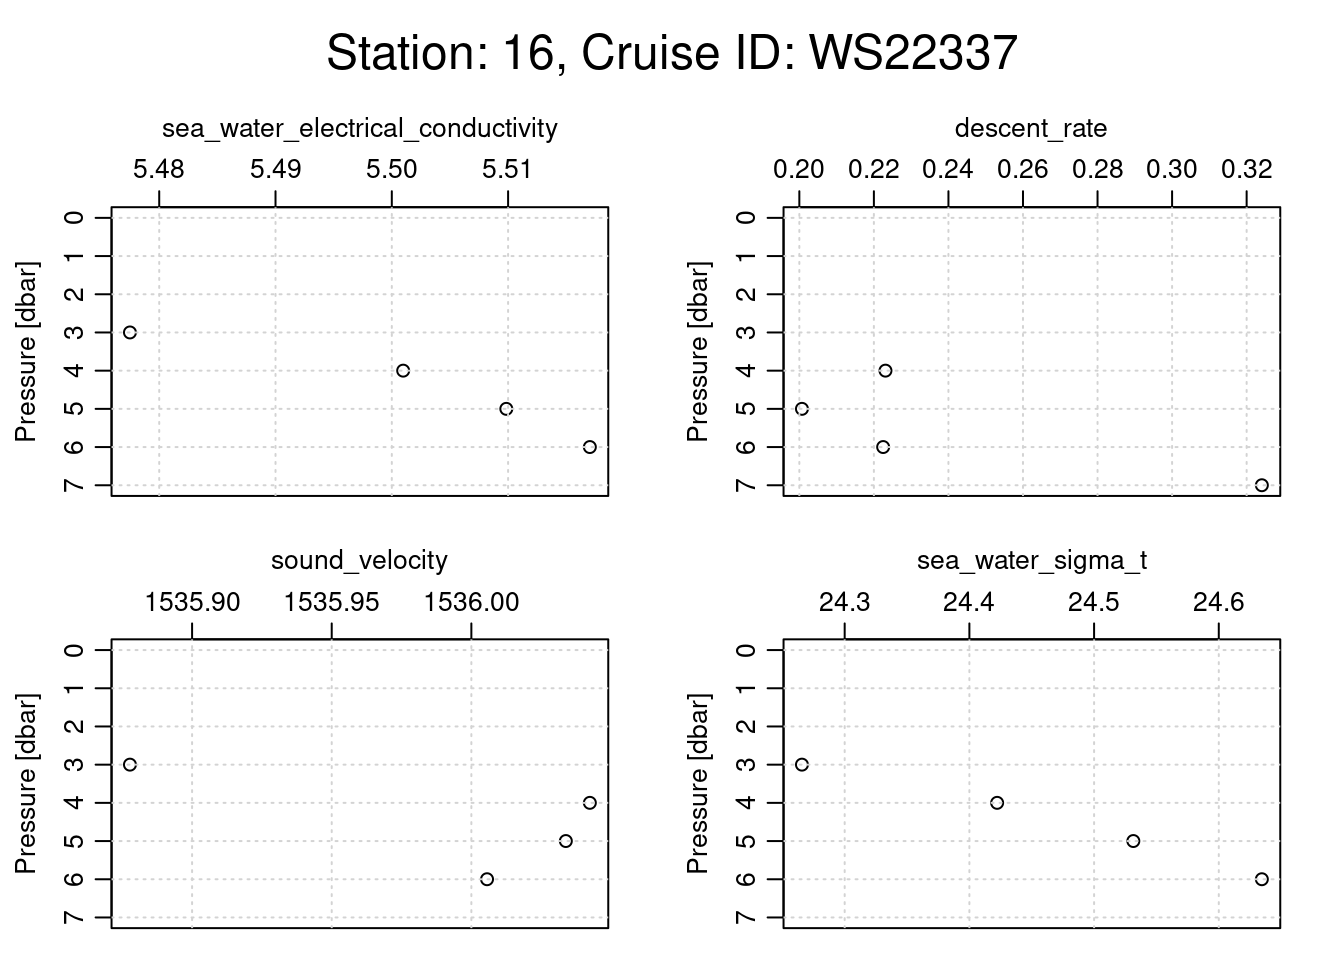
# Loop through each CTD castfor (i inseq(ctd_FK)){ cast <- ctd_FK[[i]] # Assuming each sublist contains only one relevant CTD objecttryCatch({# Extract metadata for station name and cruise ID station_name <- cast@metadata$station[1] cruise_id <- cast@data$cruise_id[1]# Generate a title with station name and cruise ID overall_title <- glue::glue("Station: {station_name}, Cruise ID: {cruise_id}")# Set margins: increase the outer margin for the titlepar(oma =c(0, 0, 3, 0)) # Top outer margin increased for title# Plotting function with specific parameters oce::plot(x =ctdDecimate(ctdTrim(cast)),which =c("sea_water_electrical_conductivity","descent_rate", "sound_velocity","sea_water_sigma_t","altimeter" ),main =""# No main title for individual subplots )# Place a single overall title at the top of the plot framemtext(overall_title, side =3, line =1, outer =TRUE, cex =1.5)# Reset outer margins to defaultpar(oma =c(0, 0, 0, 0)) }, error =function(e) {print(e$message) # Print any errors that occur during plotting })}
[1] "need finite 'xlim' values"
[1] "need finite 'xlim' values"
[1] "need finite 'xlim' values"
[1] "need finite 'xlim' values"
[1] "need finite 'xlim' values"
[1] "need finite 'xlim' values"
[1] "unknown xtype value (\"4.829499\")"
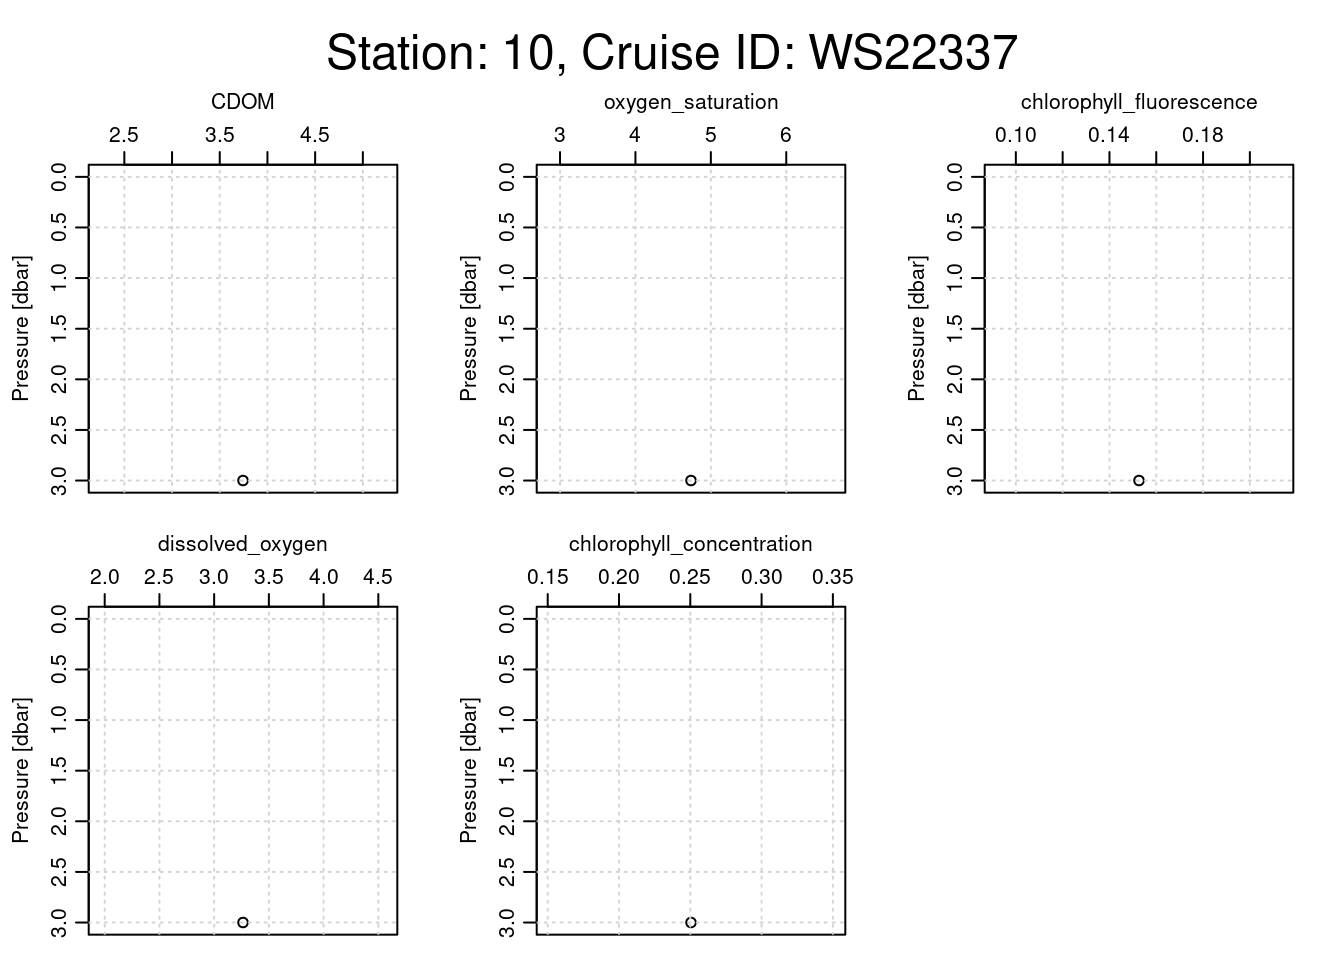
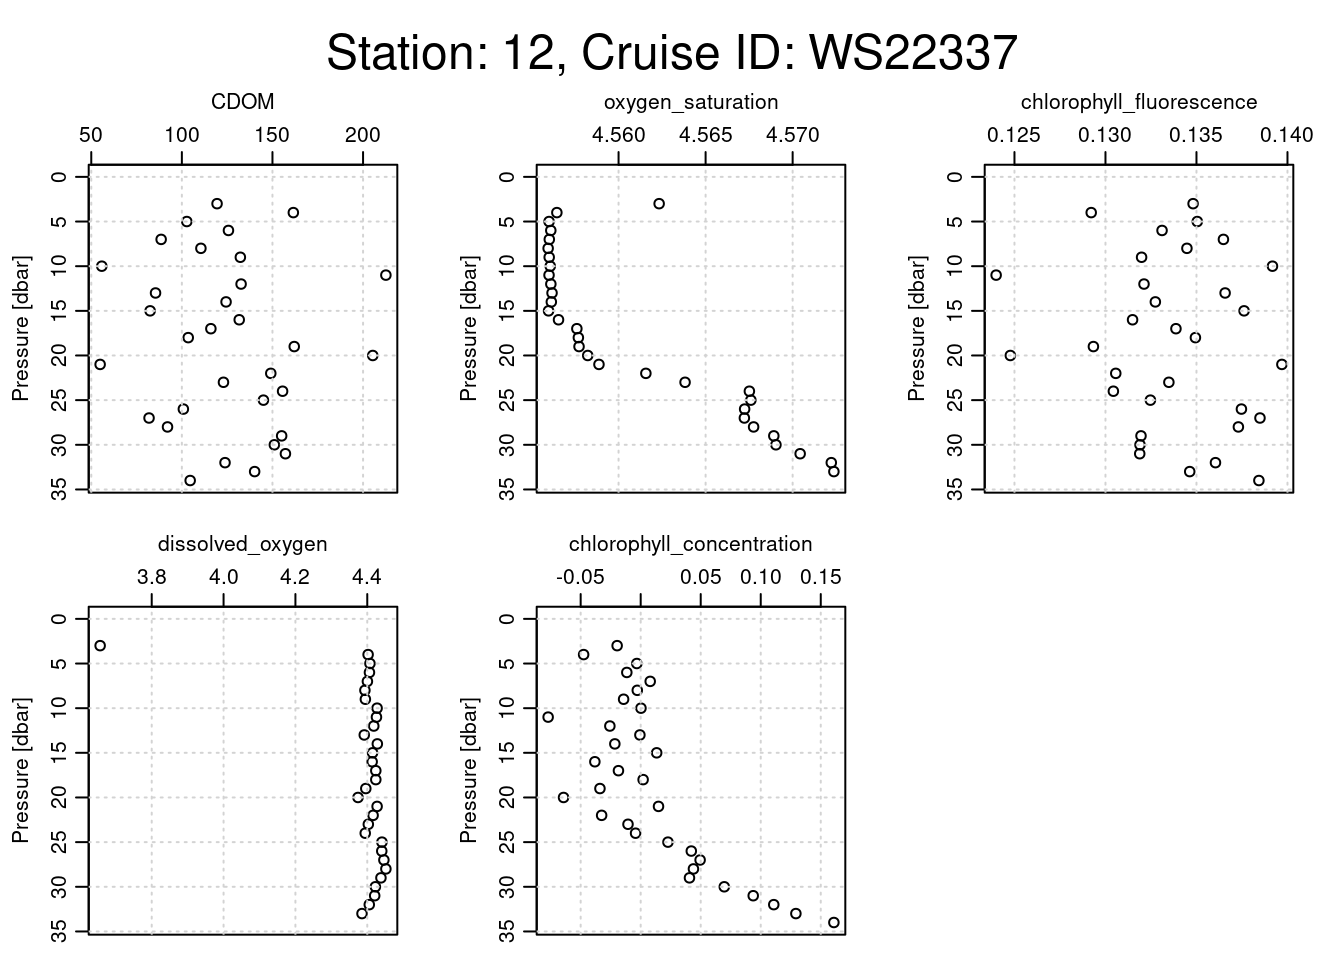
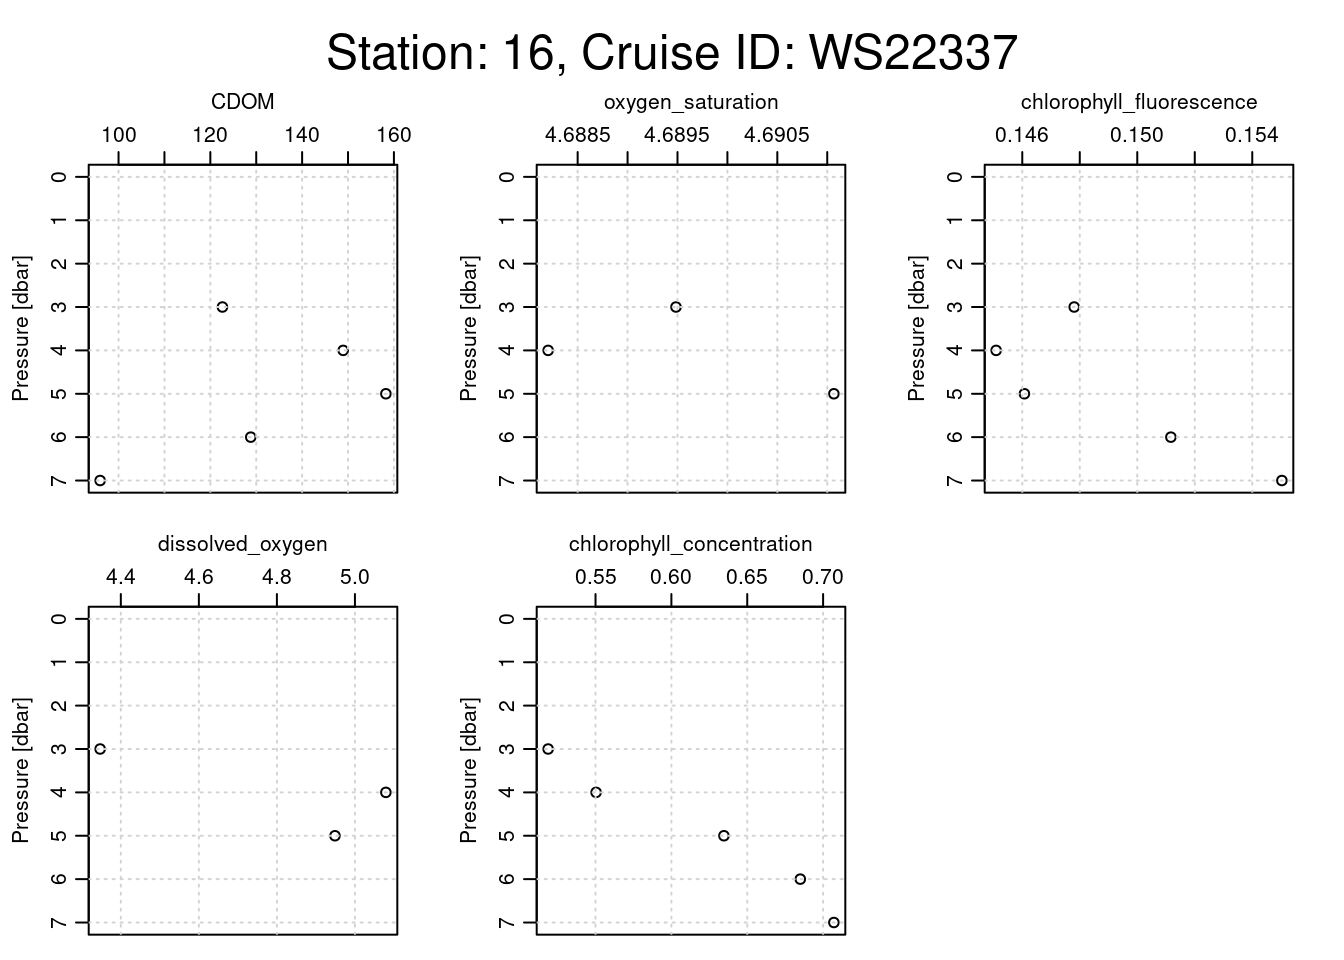
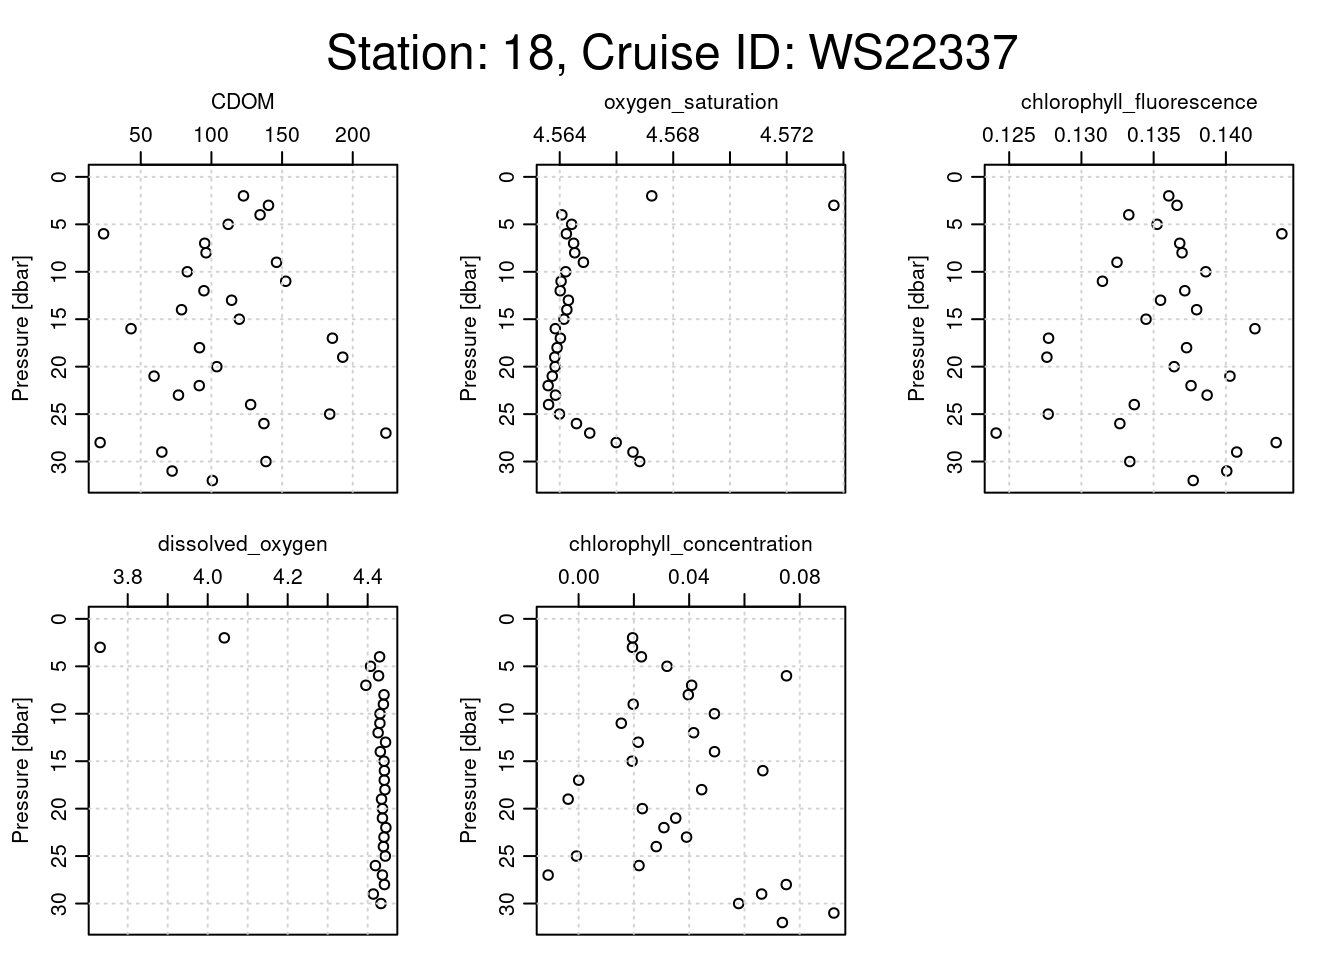
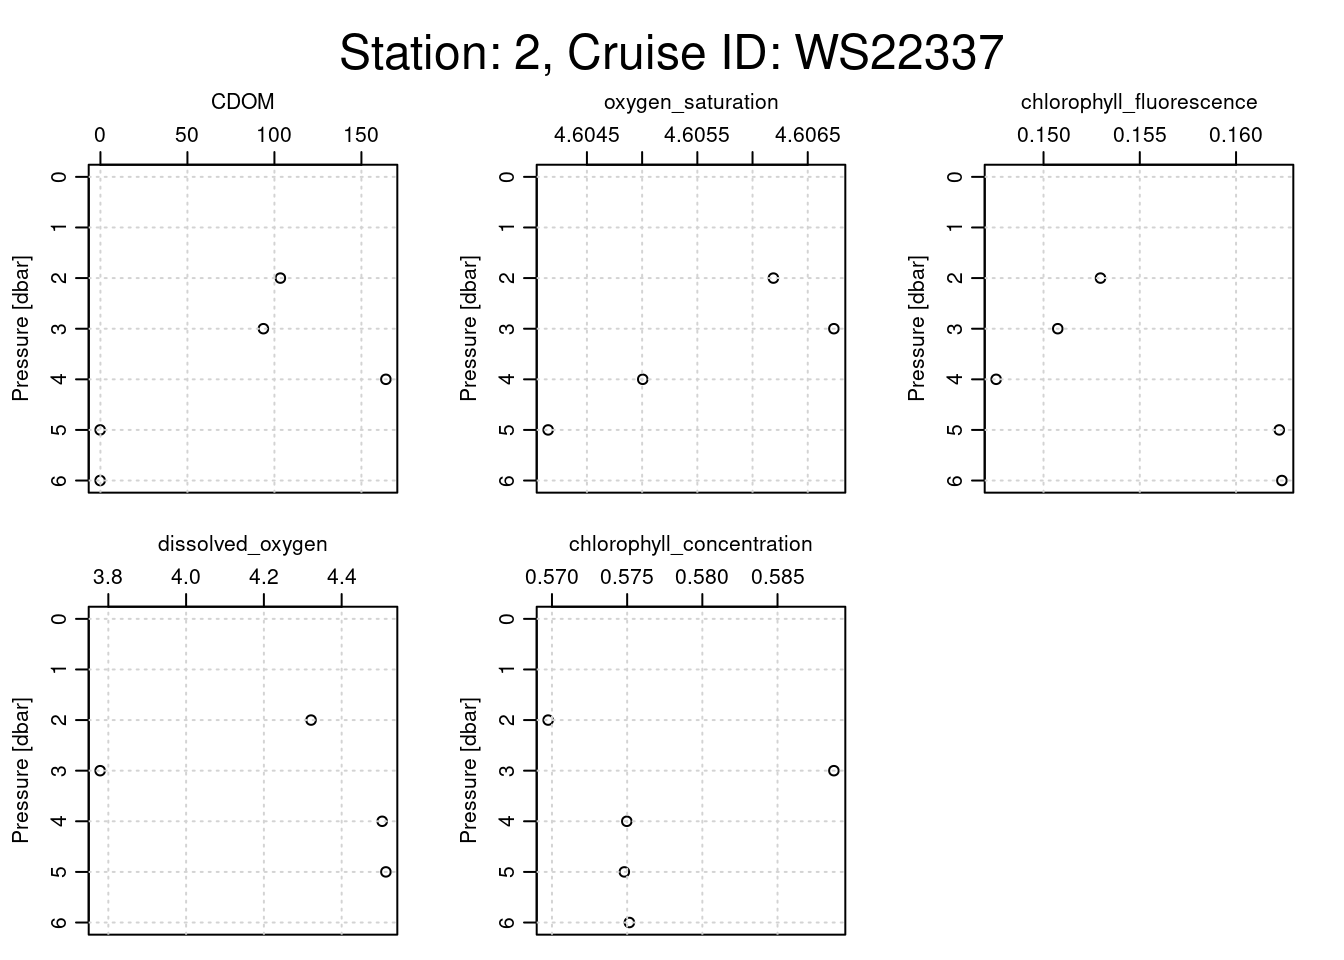
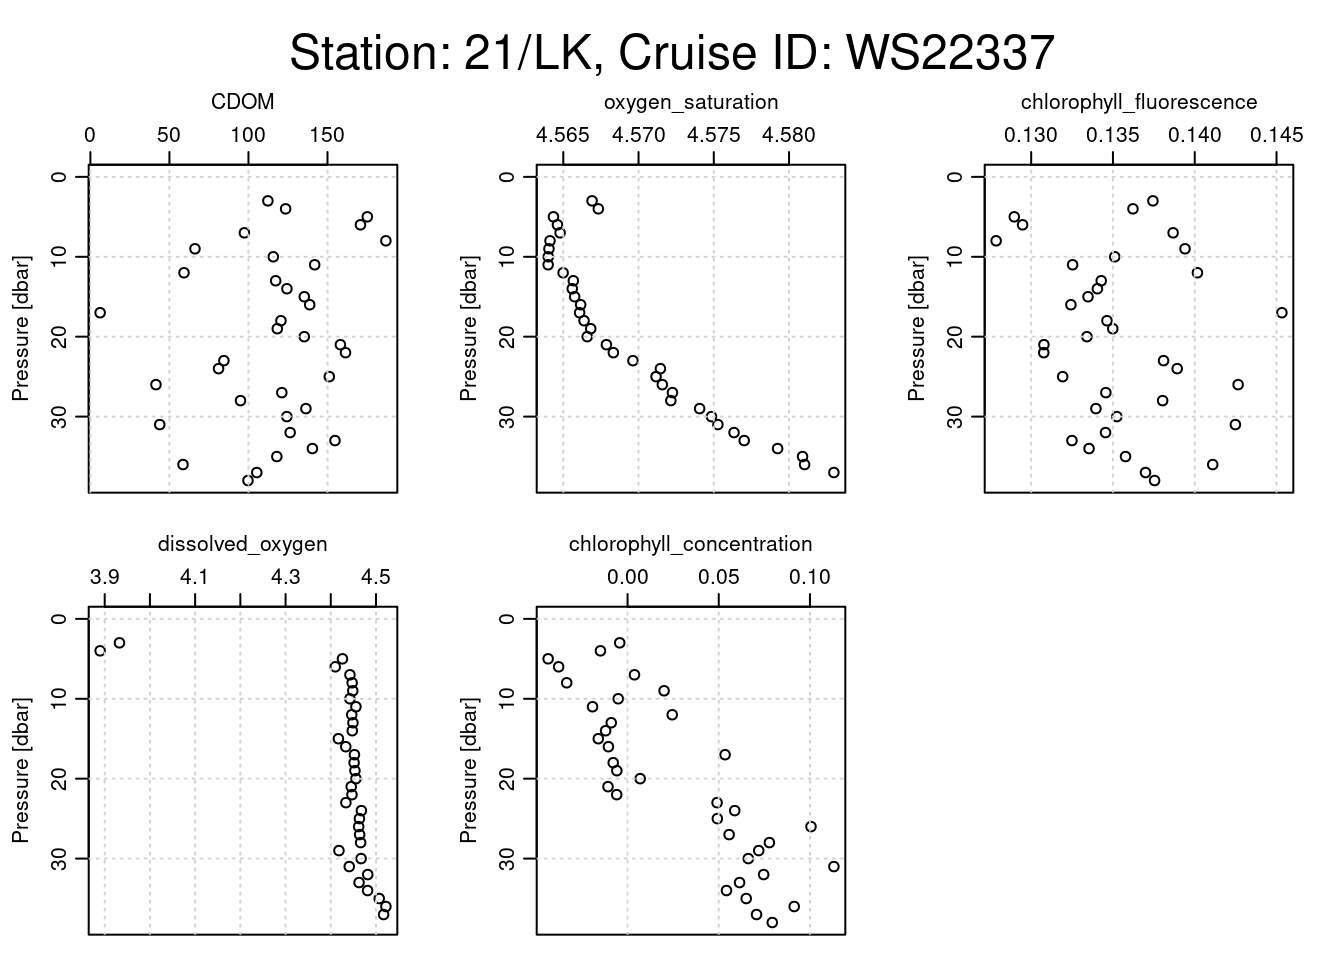
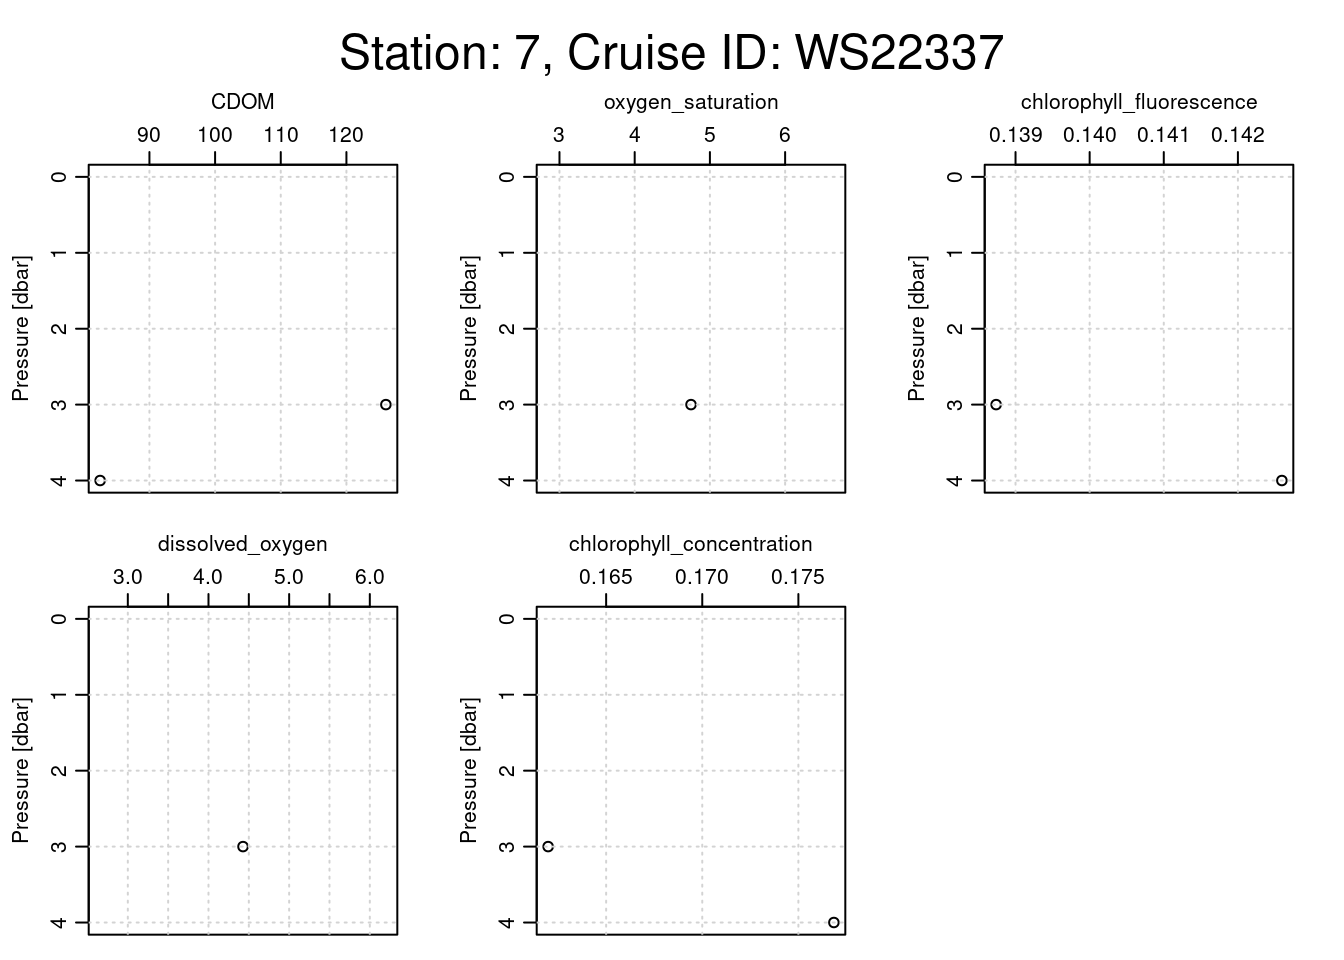
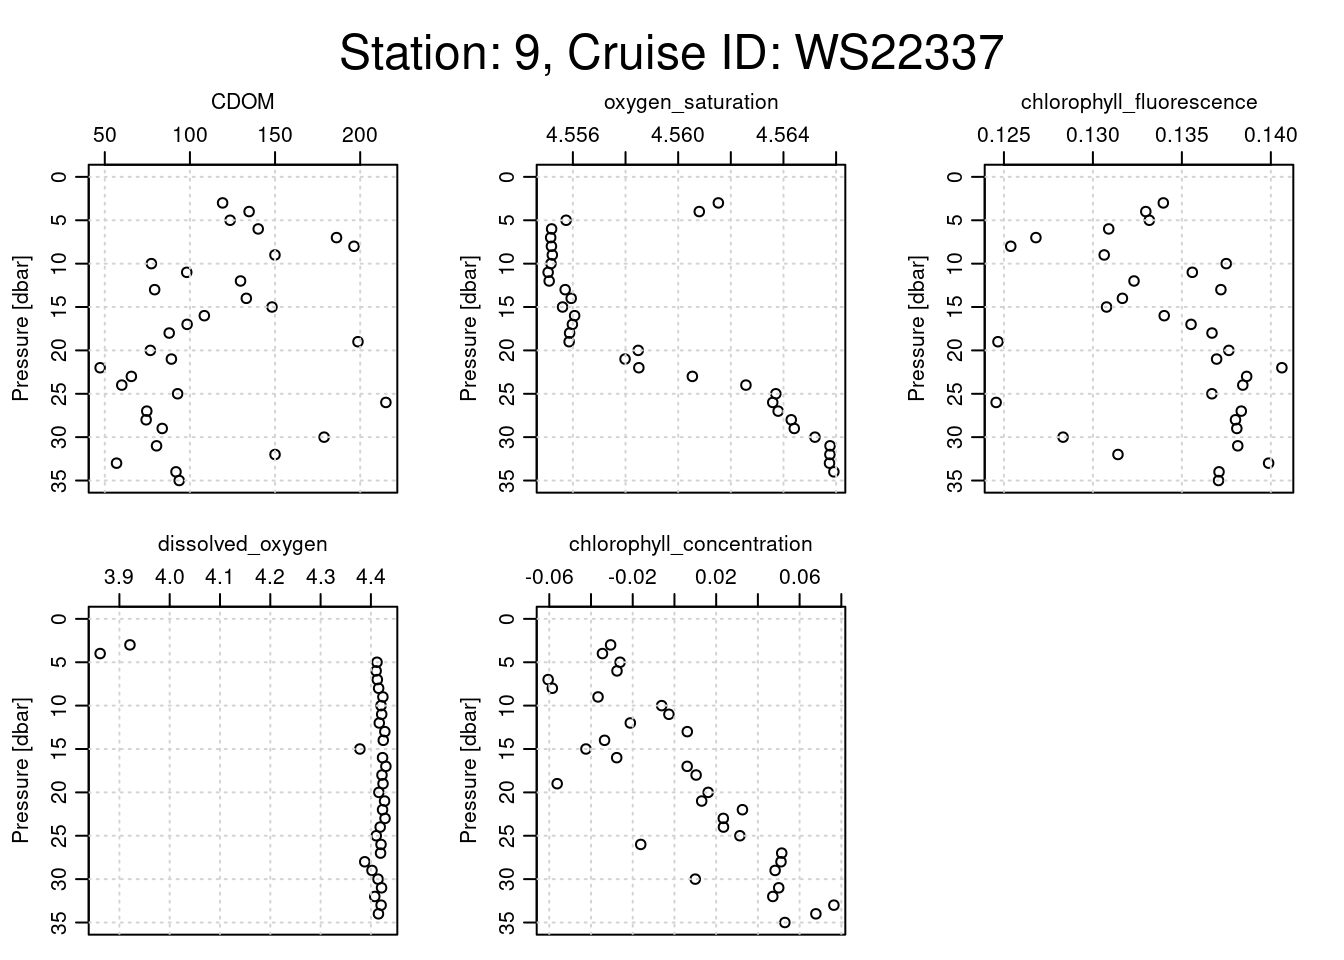
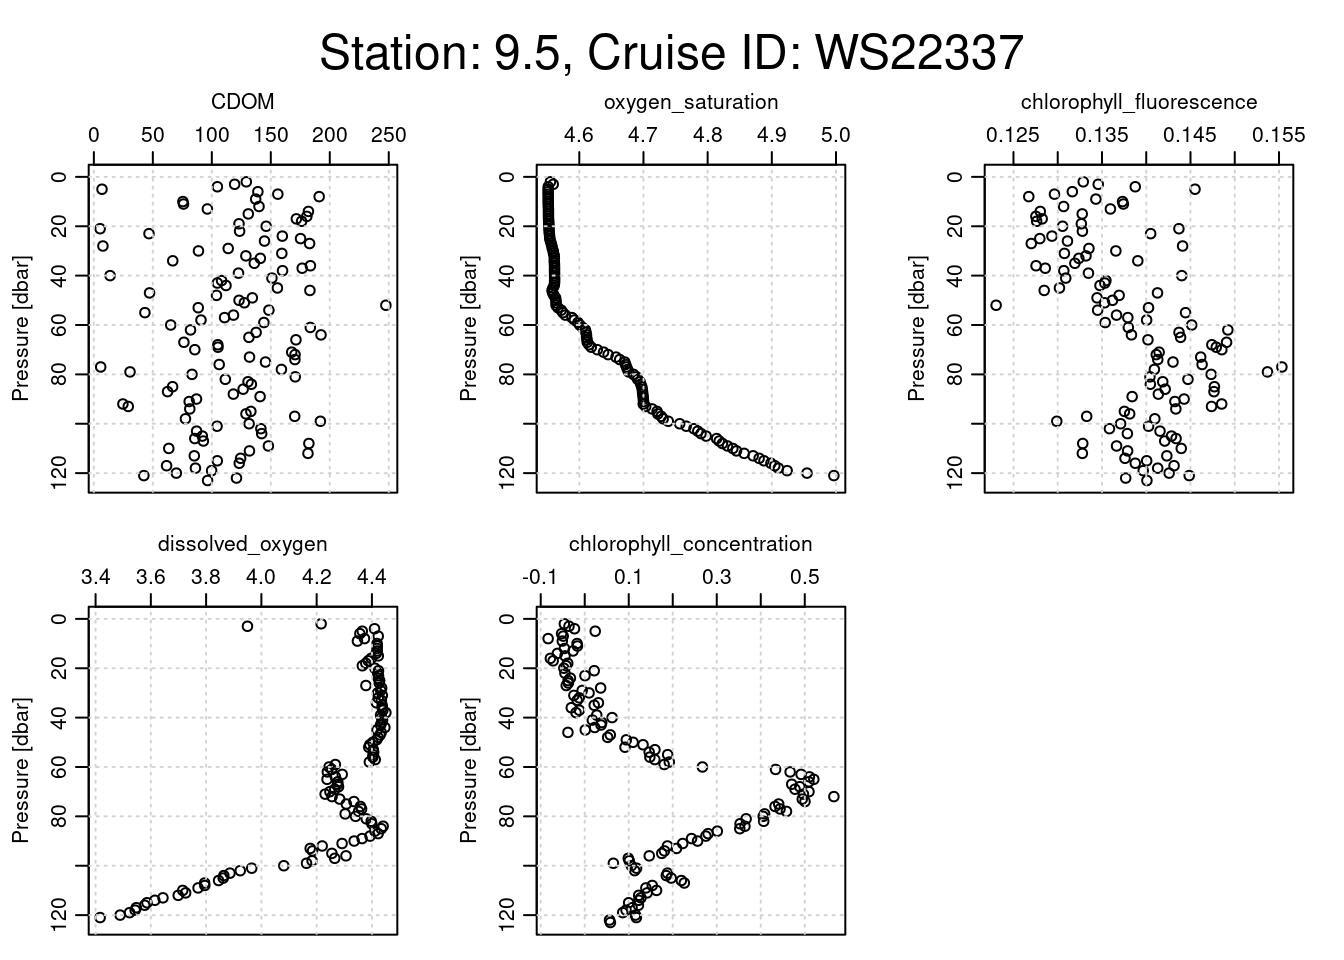
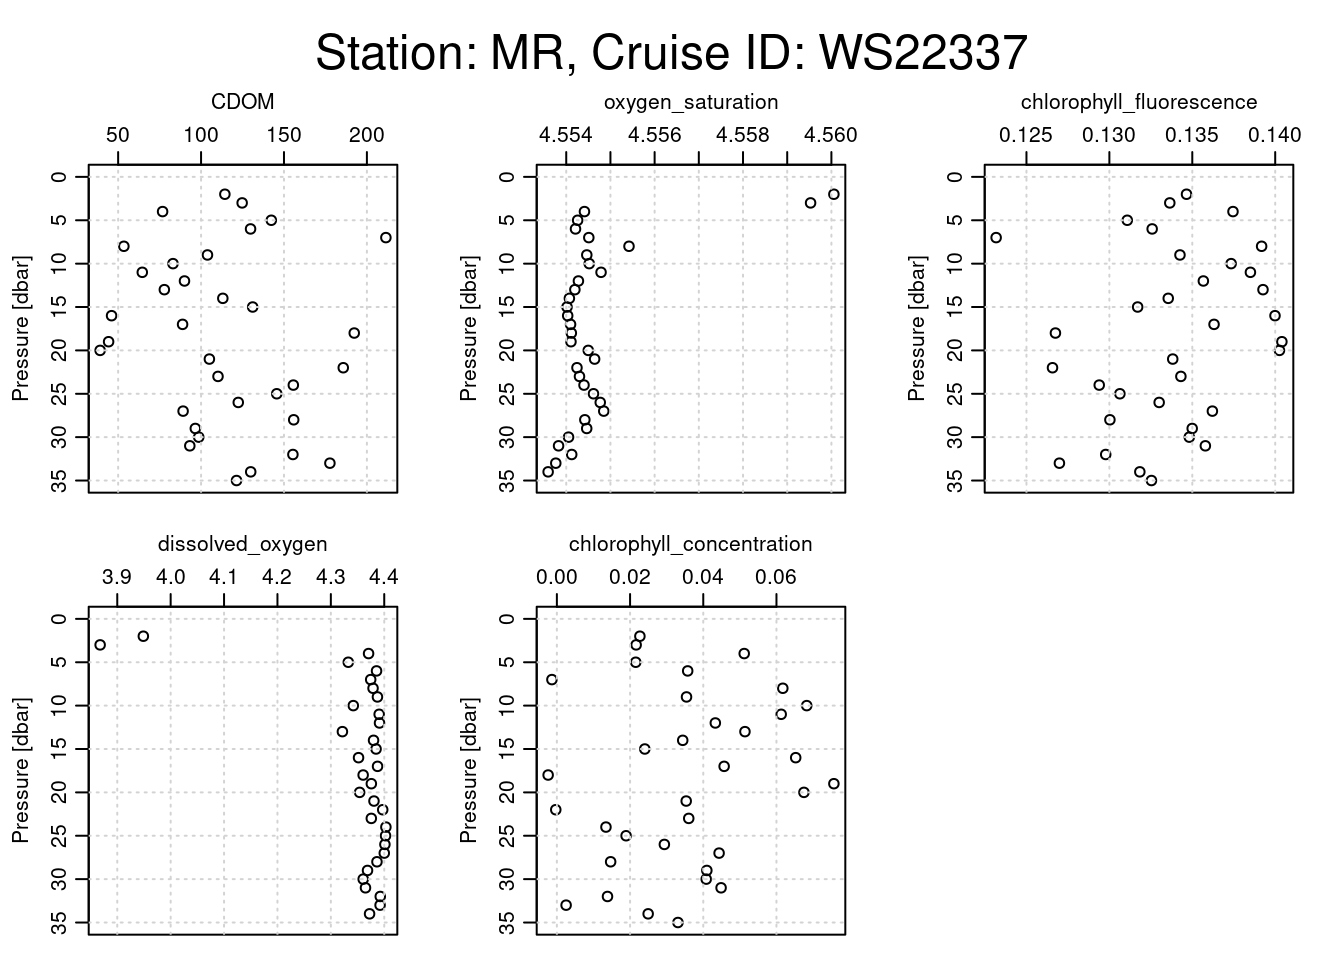
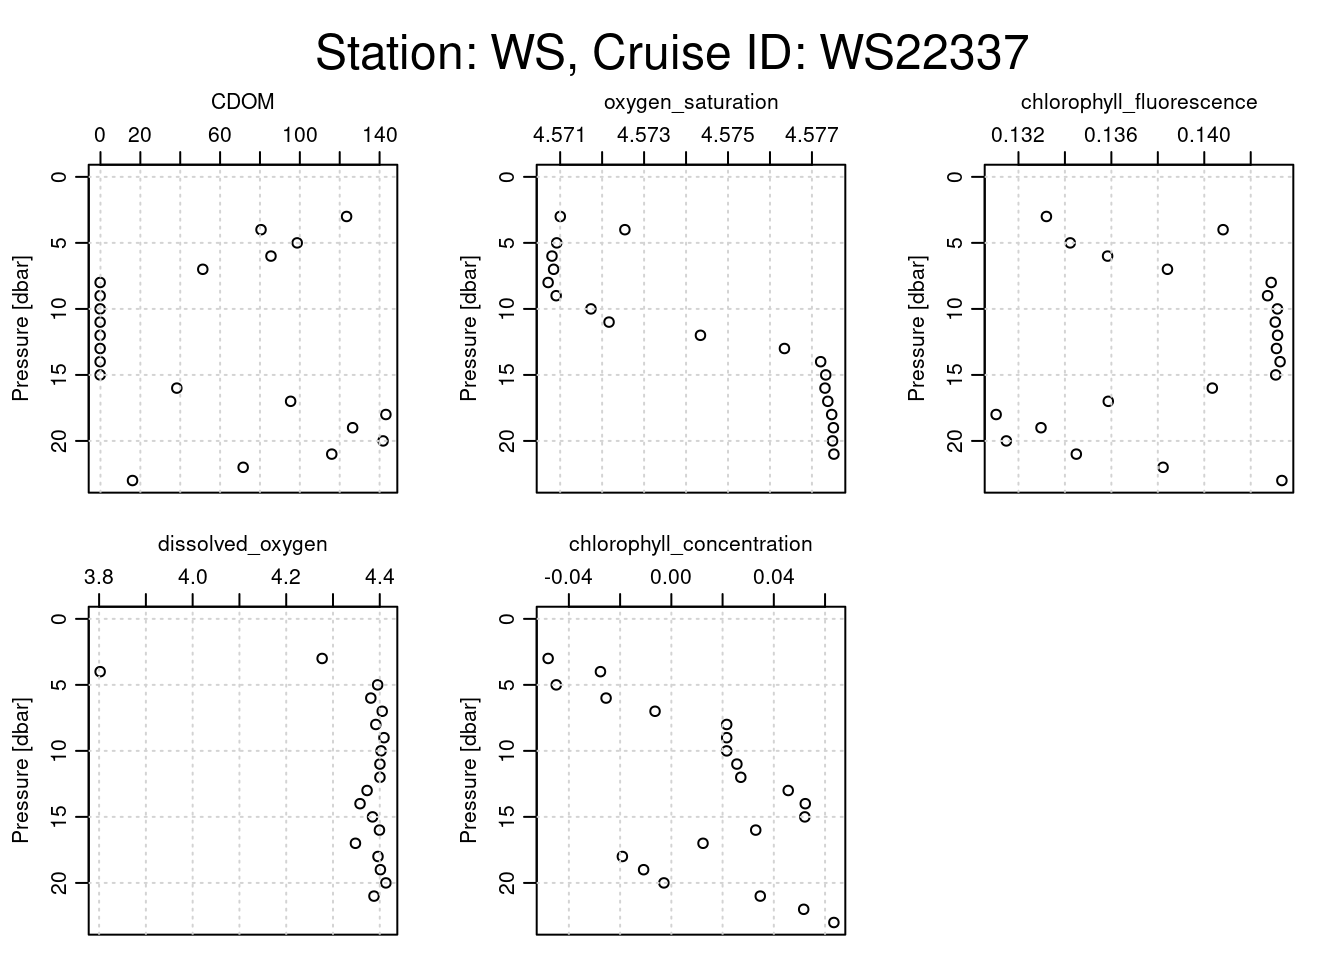
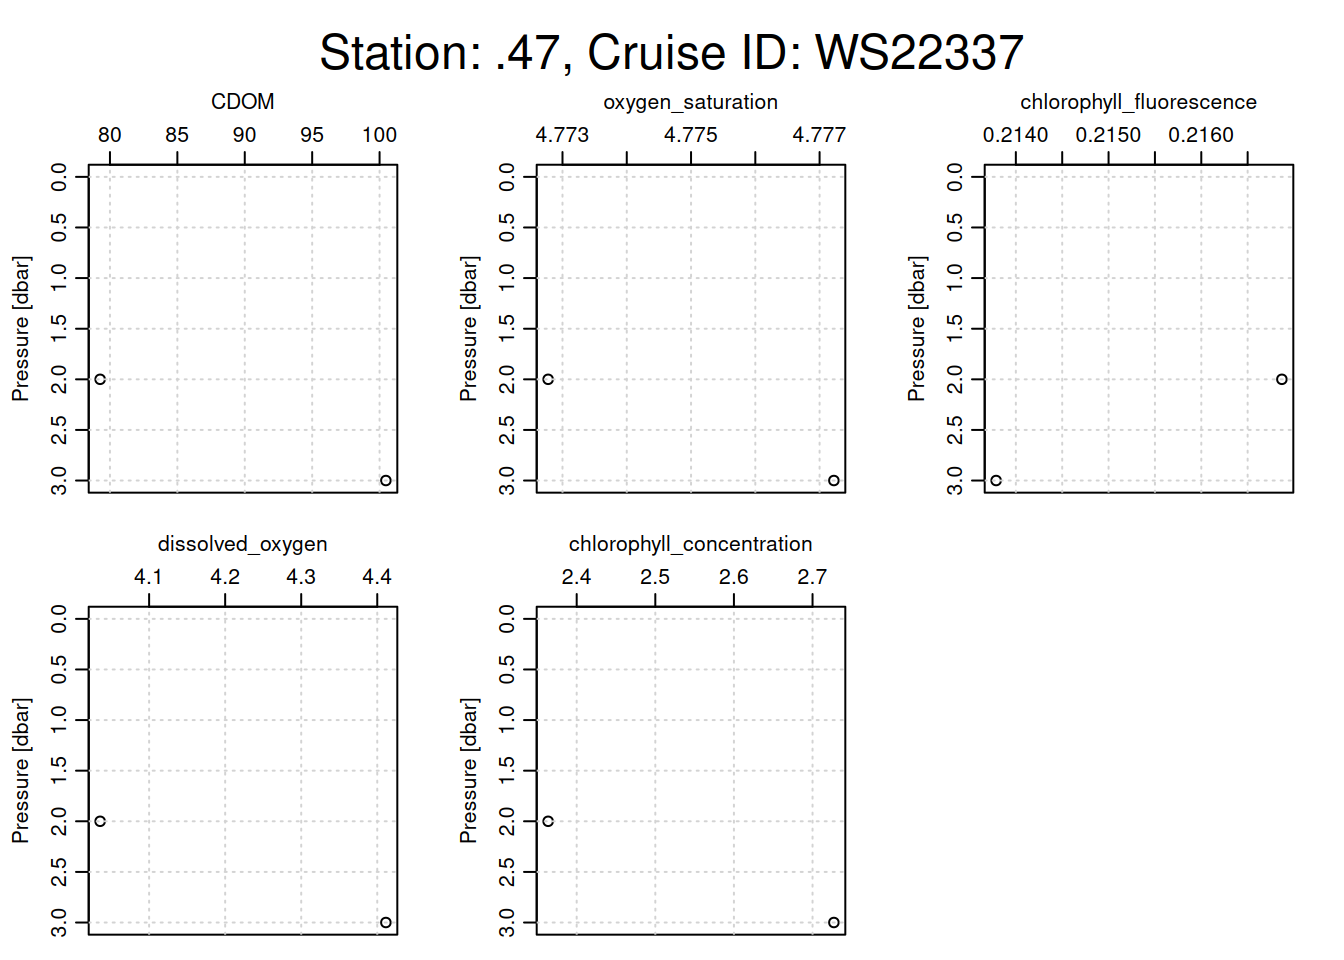
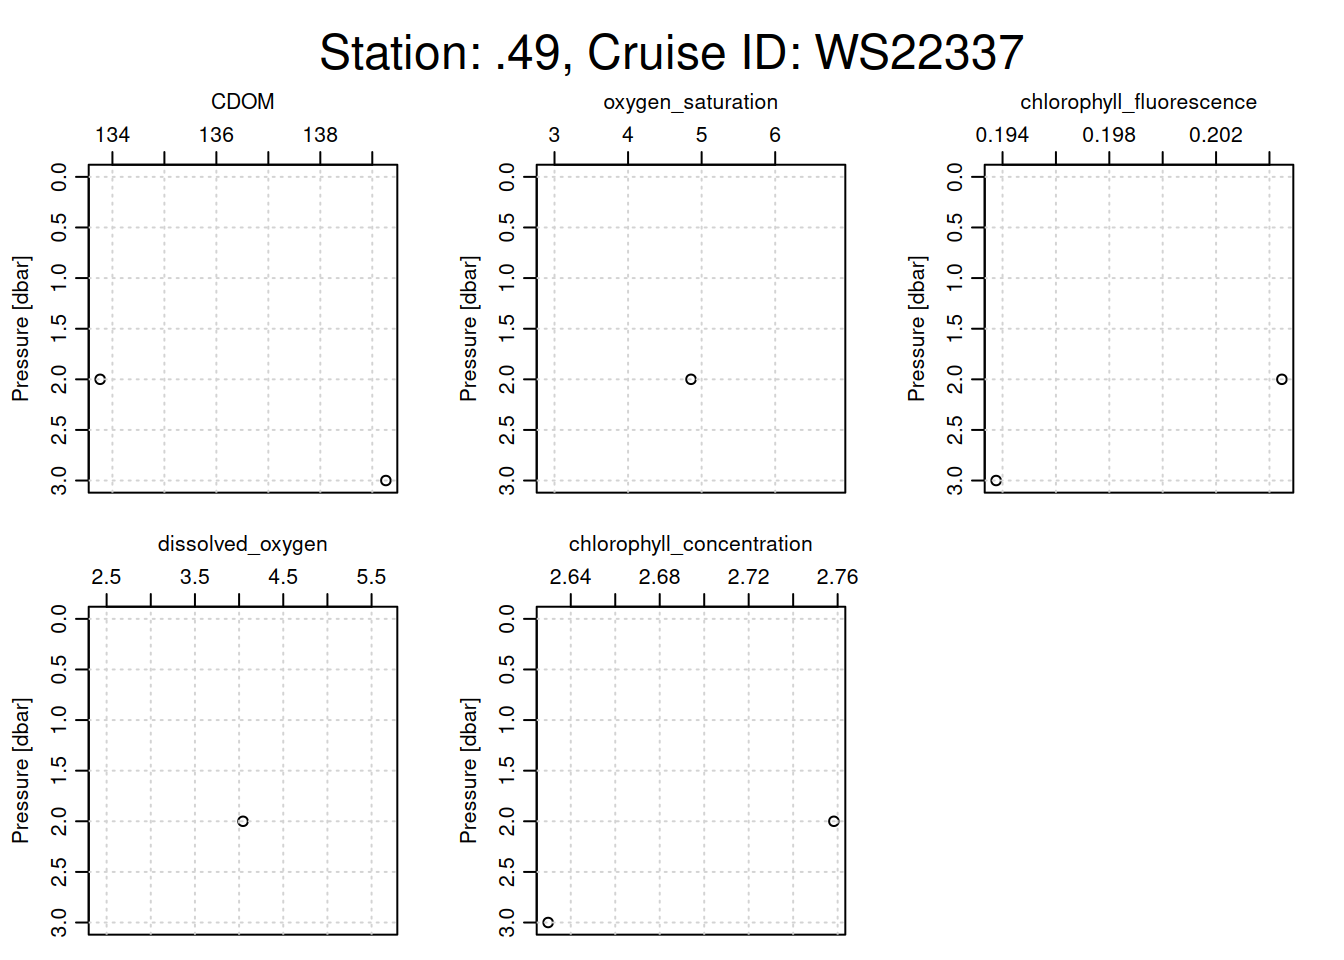
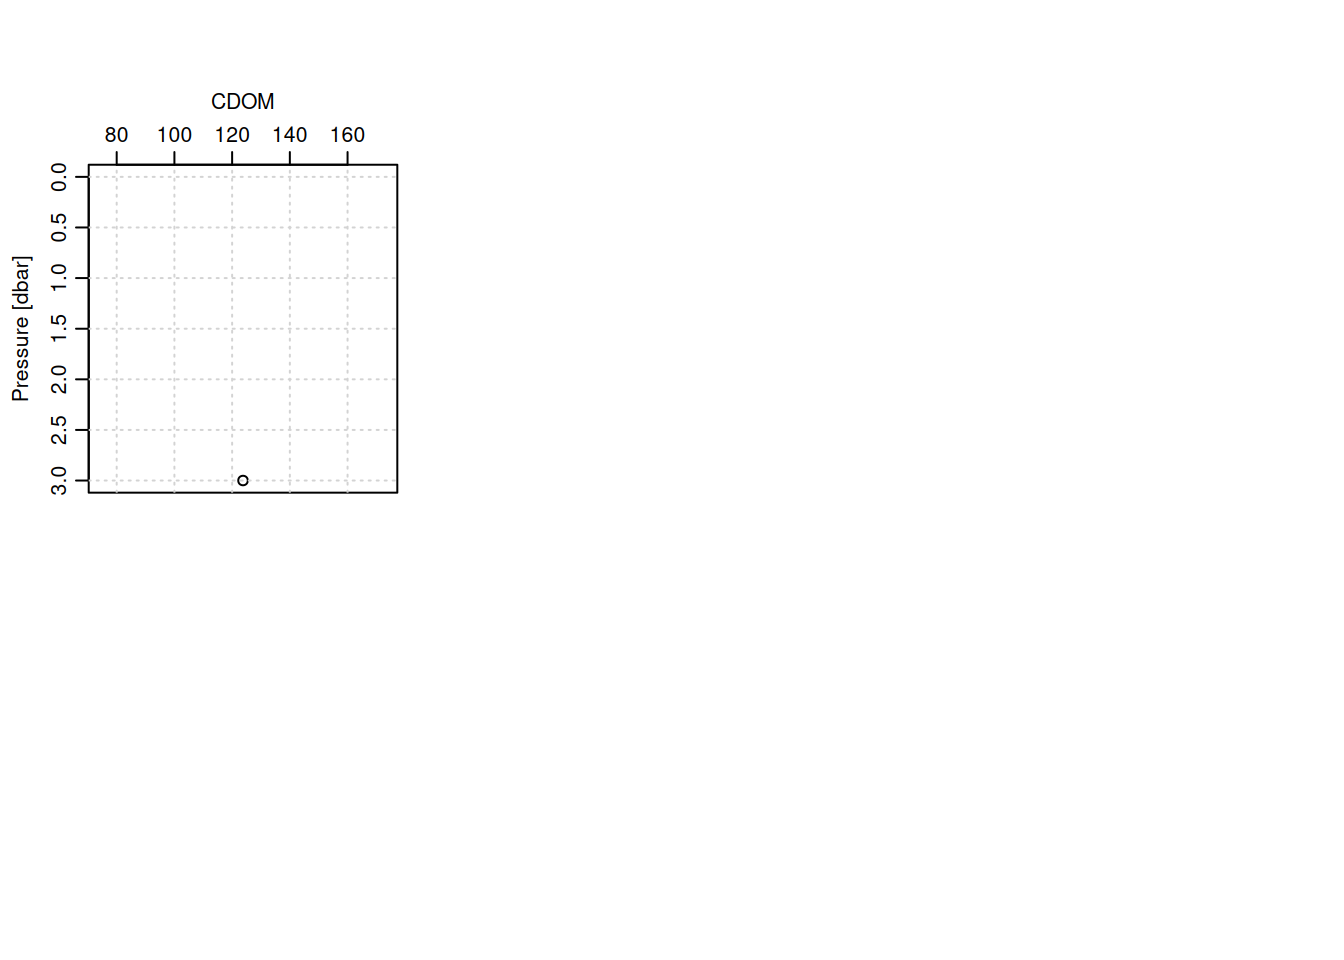
plotting other nutrient parameters for each cast
# Loop through each CTD castfor (i inseq(ctd_FK)){ cast <- ctd_FK[[i]] # Assuming each sublist contains only one relevant CTD objecttryCatch({# Extract metadata for station name and cruise ID station_name <- cast@metadata$station[1] cruise_id <- cast@data$cruise_id[1]# Generate a title with station name and cruise ID overall_title <- glue::glue("Station: {station_name}, Cruise ID: {cruise_id}")# Set margins: increase the outer margin for the titlepar(oma =c(0, 0, 3, 0)) # Top outer margin increased for title# Plotting function with specific parameters oce::plot(x =ctdDecimate(ctdTrim(cast)),which =c("CDOM", "dissolved_oxygen","oxygen_saturation","chlorophyll_concentration", "chlorophyll_fluorescence" ),main =""# No main title for individual subplots )# Place a single overall title at the top of the plot framemtext(overall_title, side =3, line =1, outer =TRUE, cex =1.5)# Reset outer margins to defaultpar(oma =c(0, 0, 0, 0)) }, error =function(e) {print(e$message) # Print any errors that occur during plotting })}
[1] "need finite 'xlim' values"
[1] "need finite 'xlim' values"
[1] "unknown xtype value (\"1.6407\")"
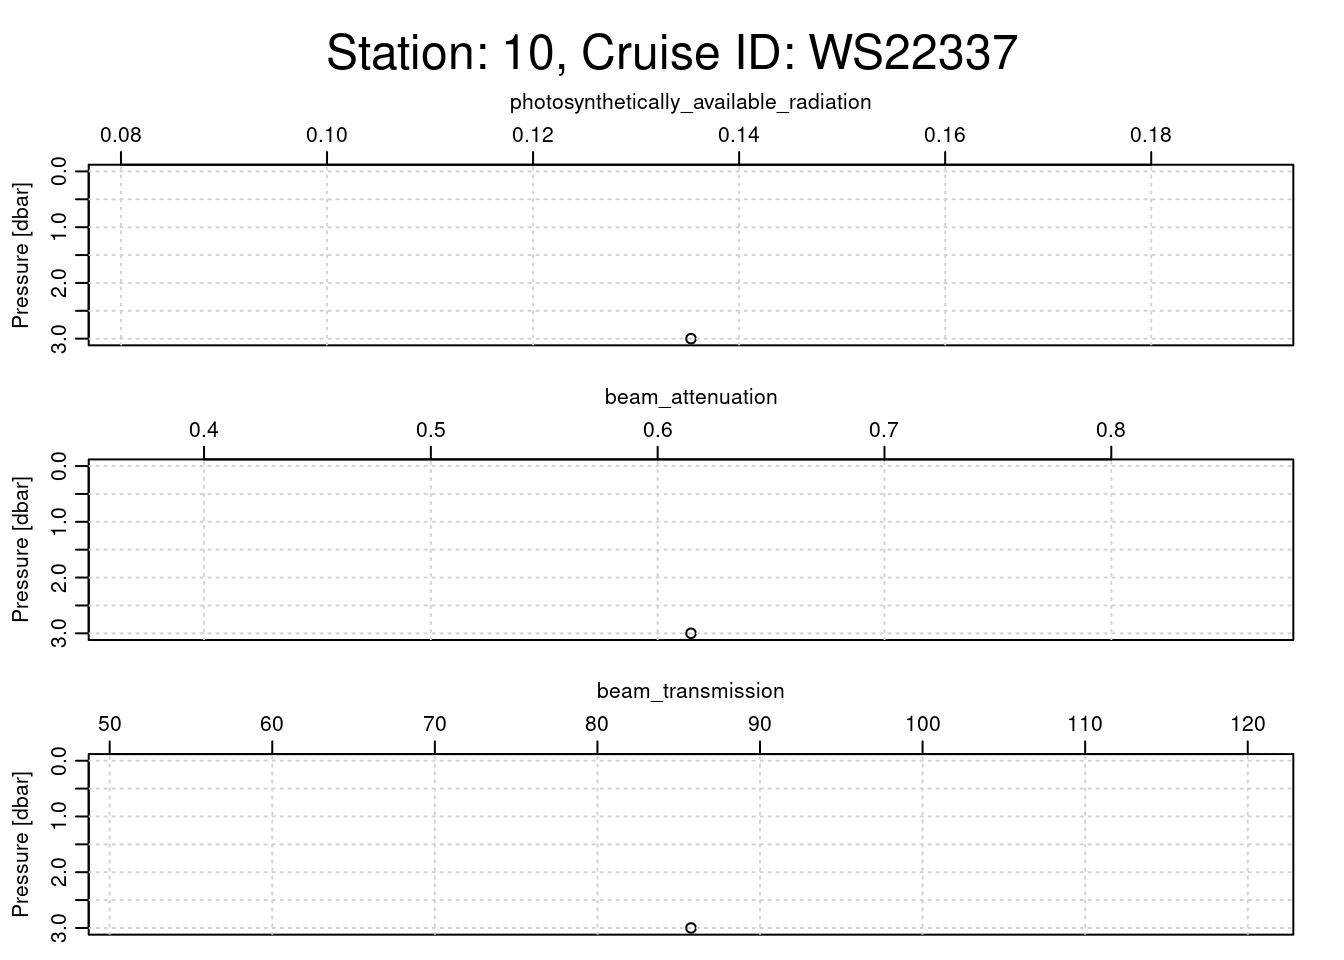
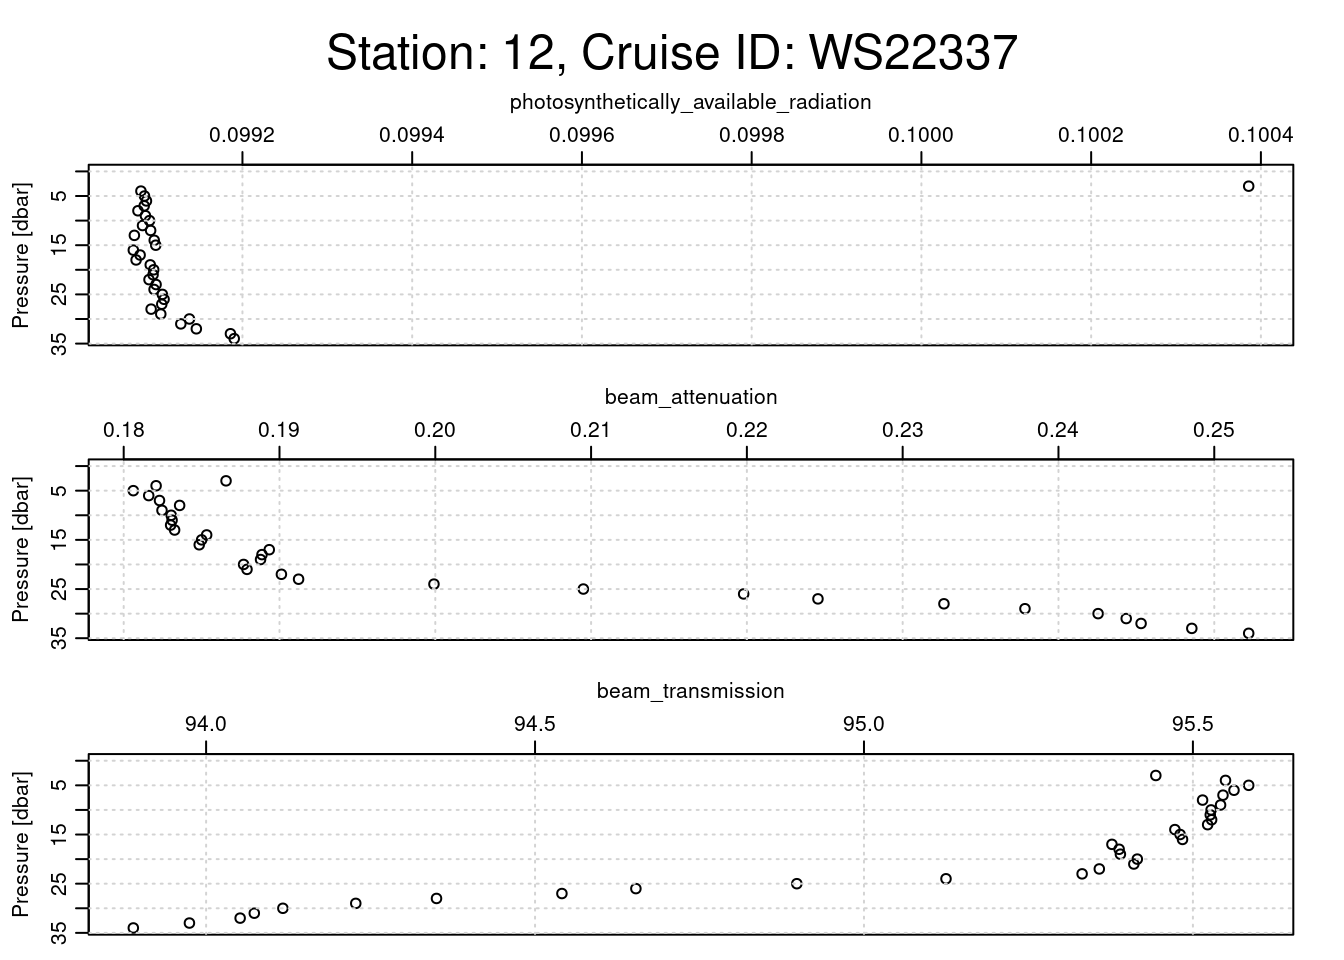
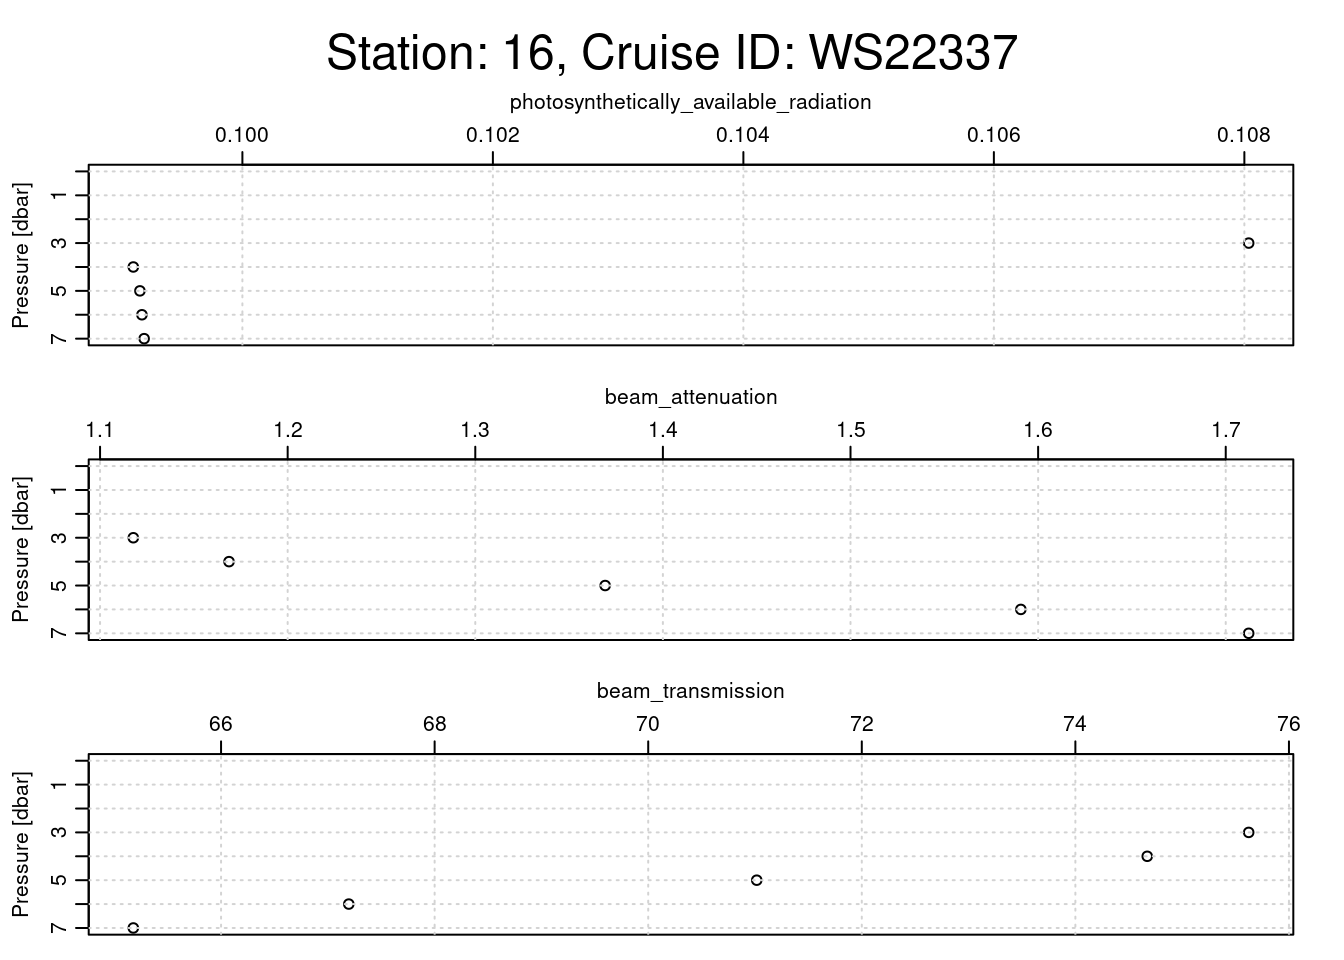
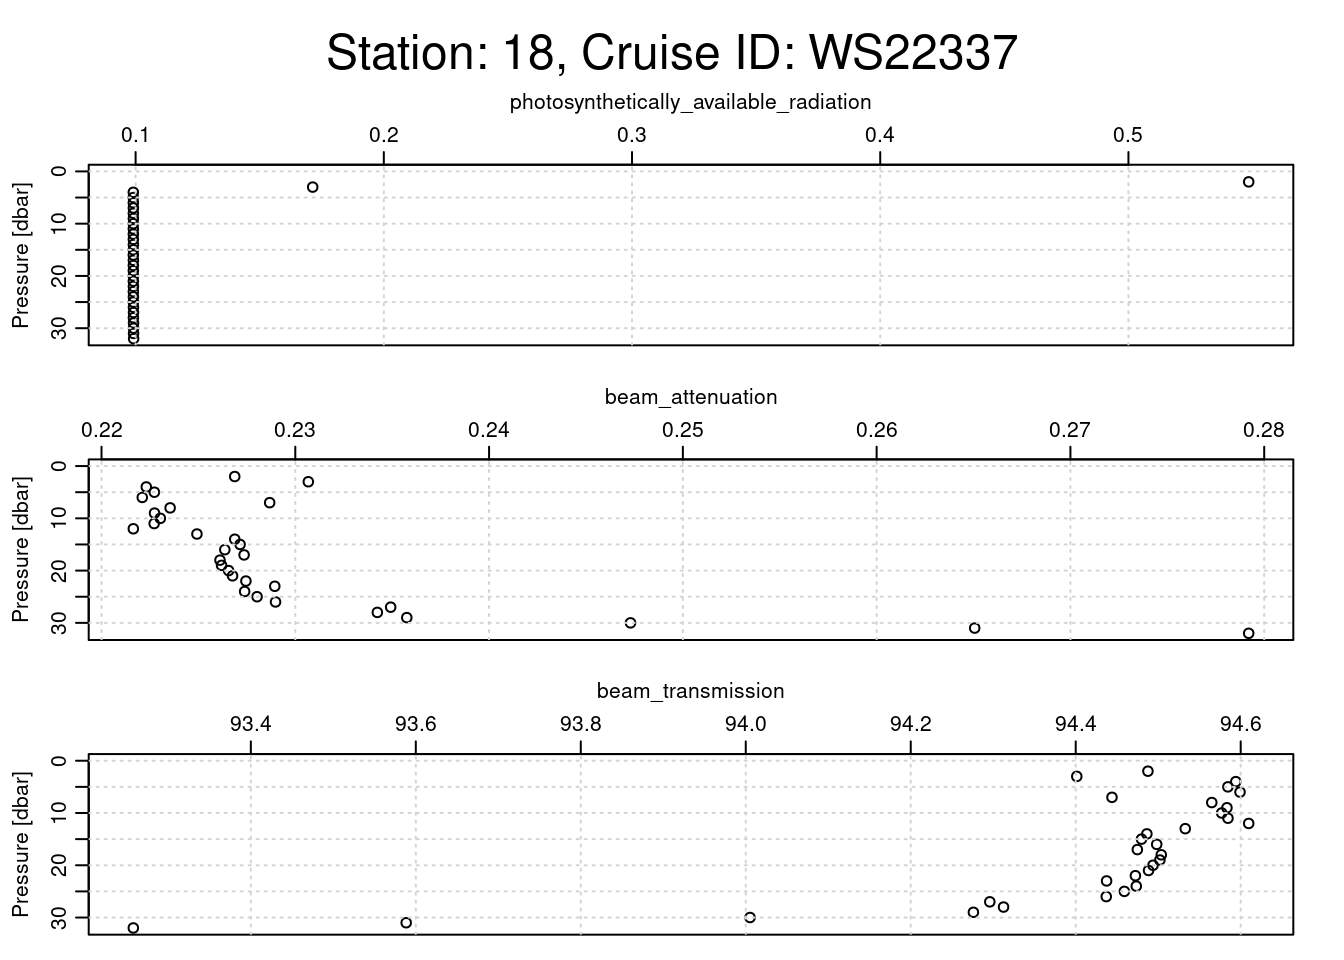
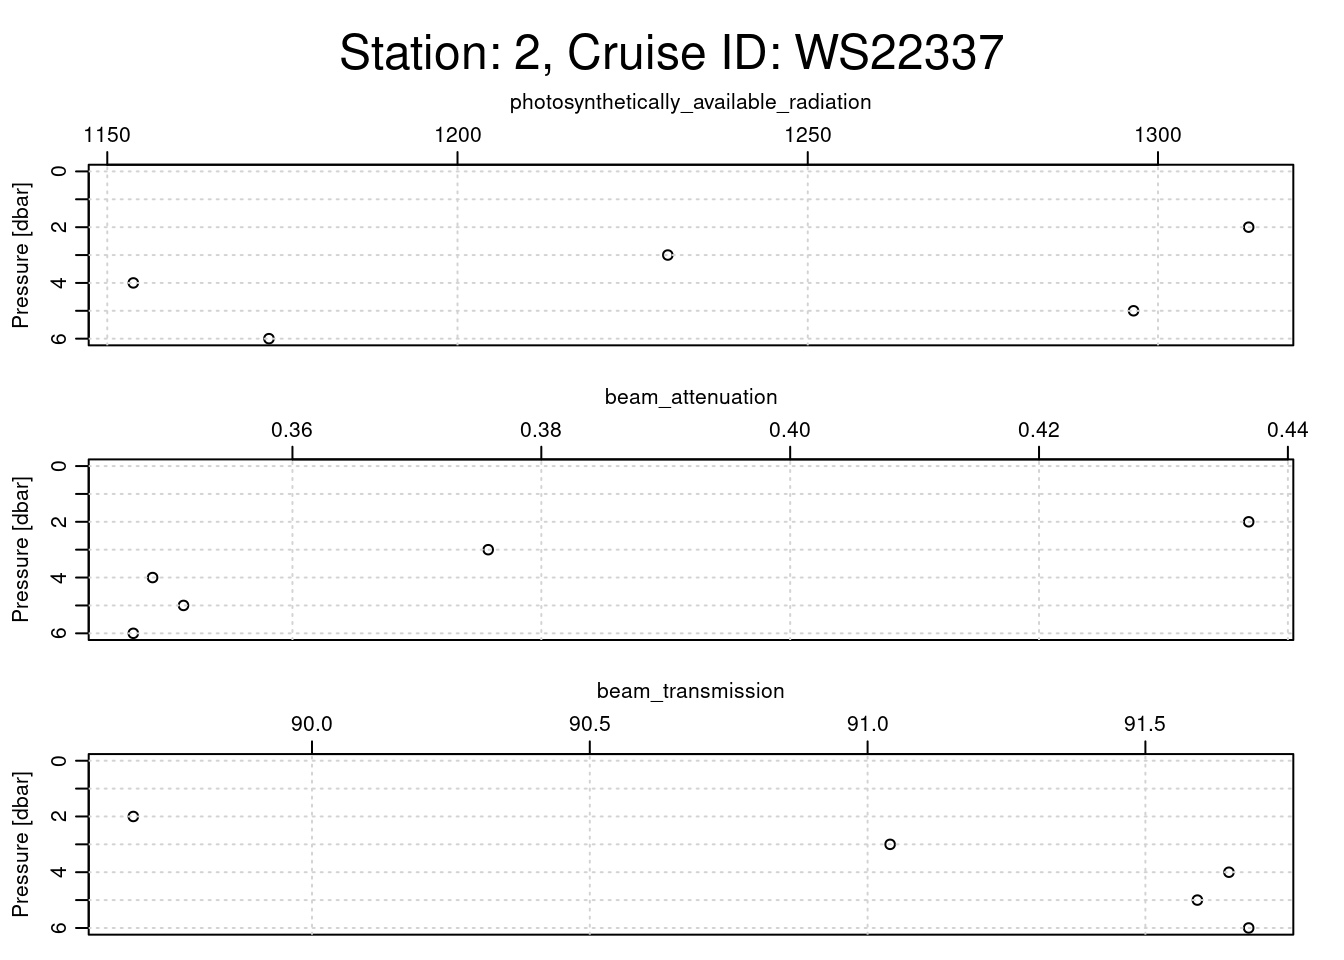
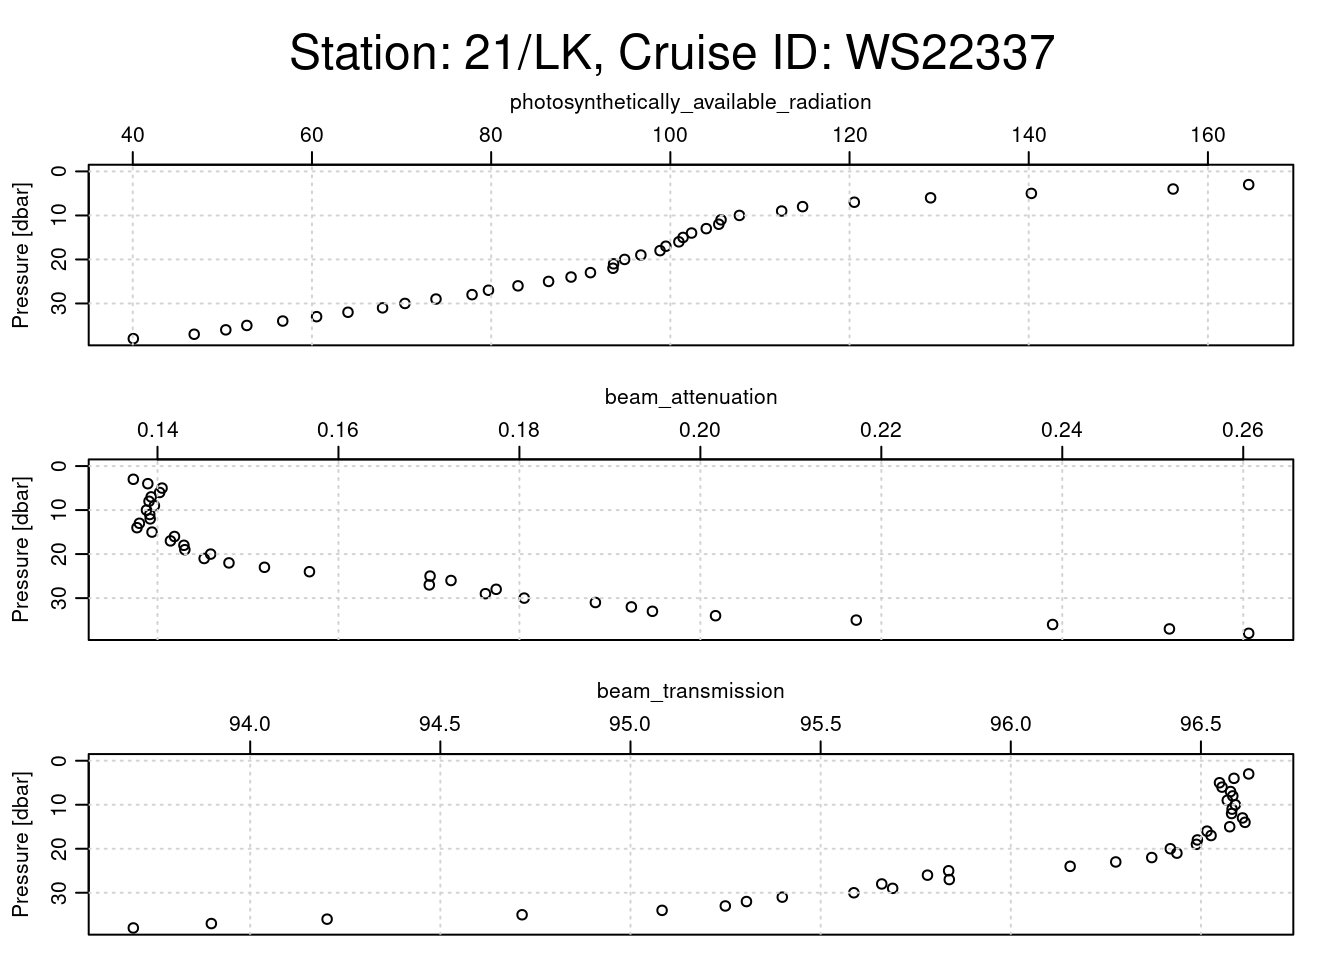
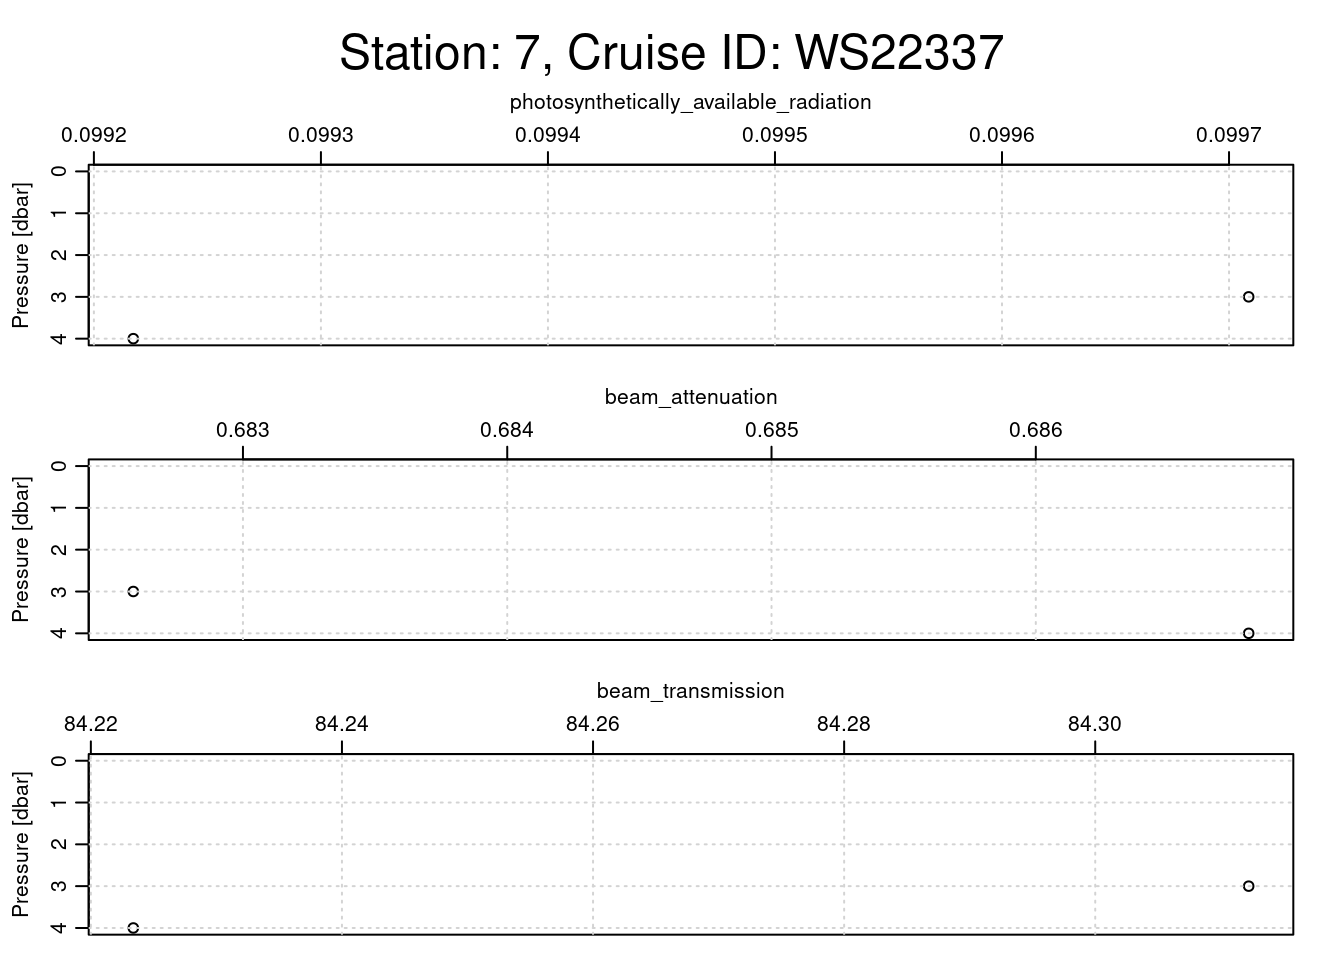
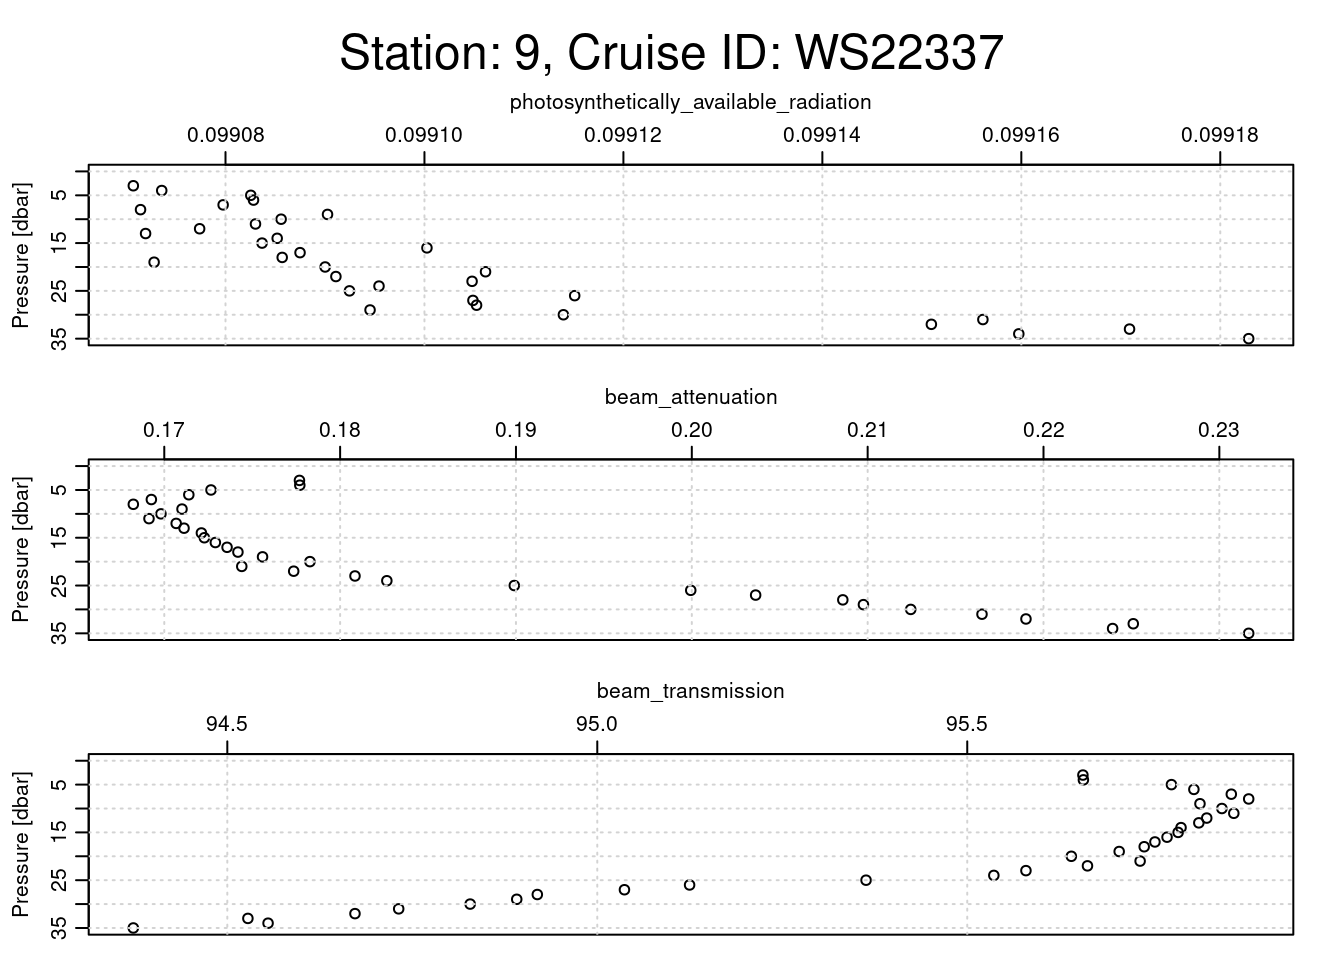
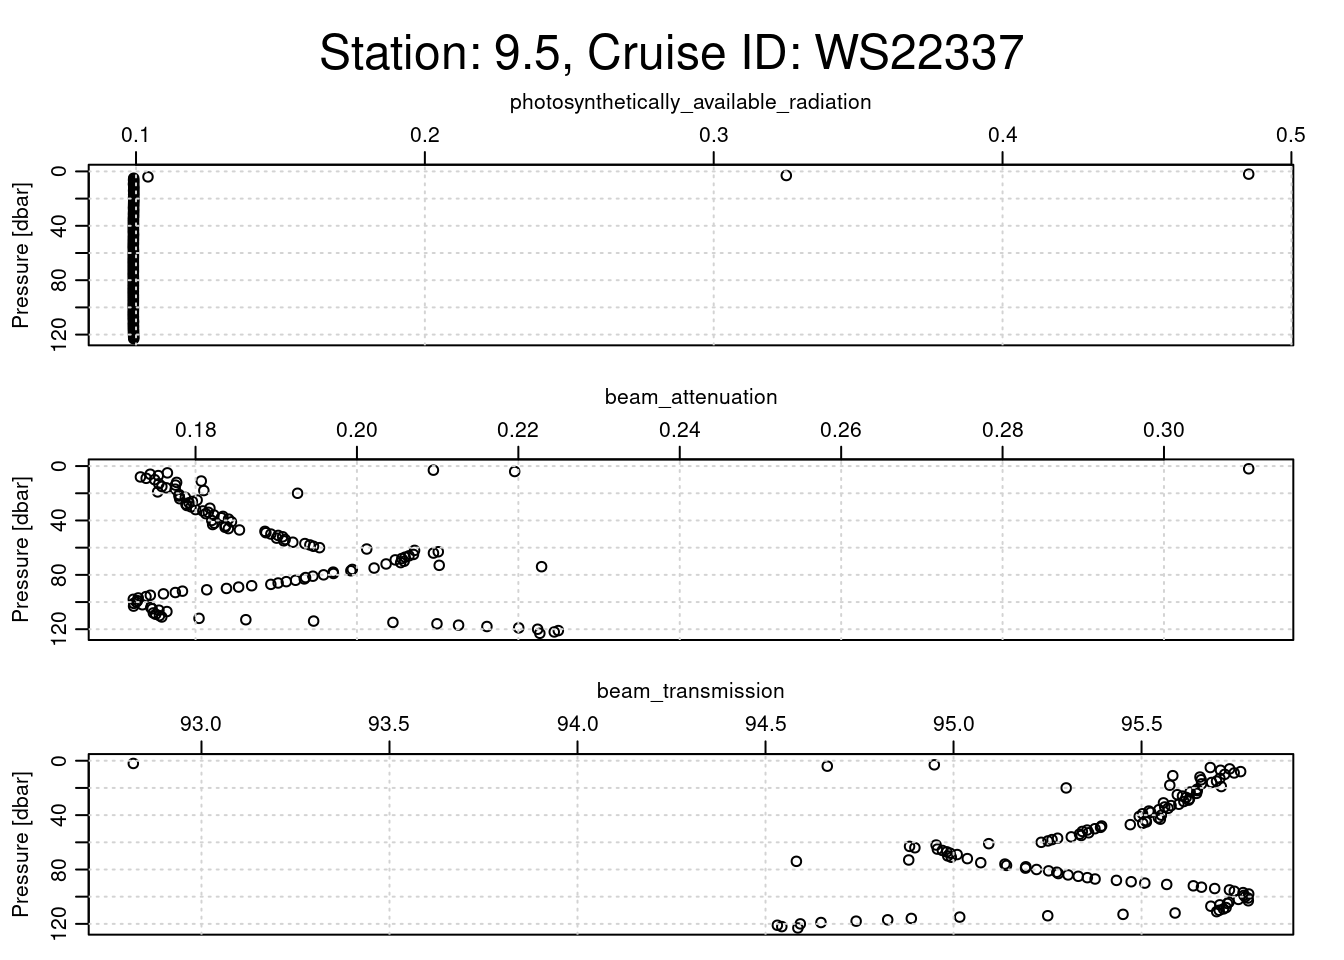
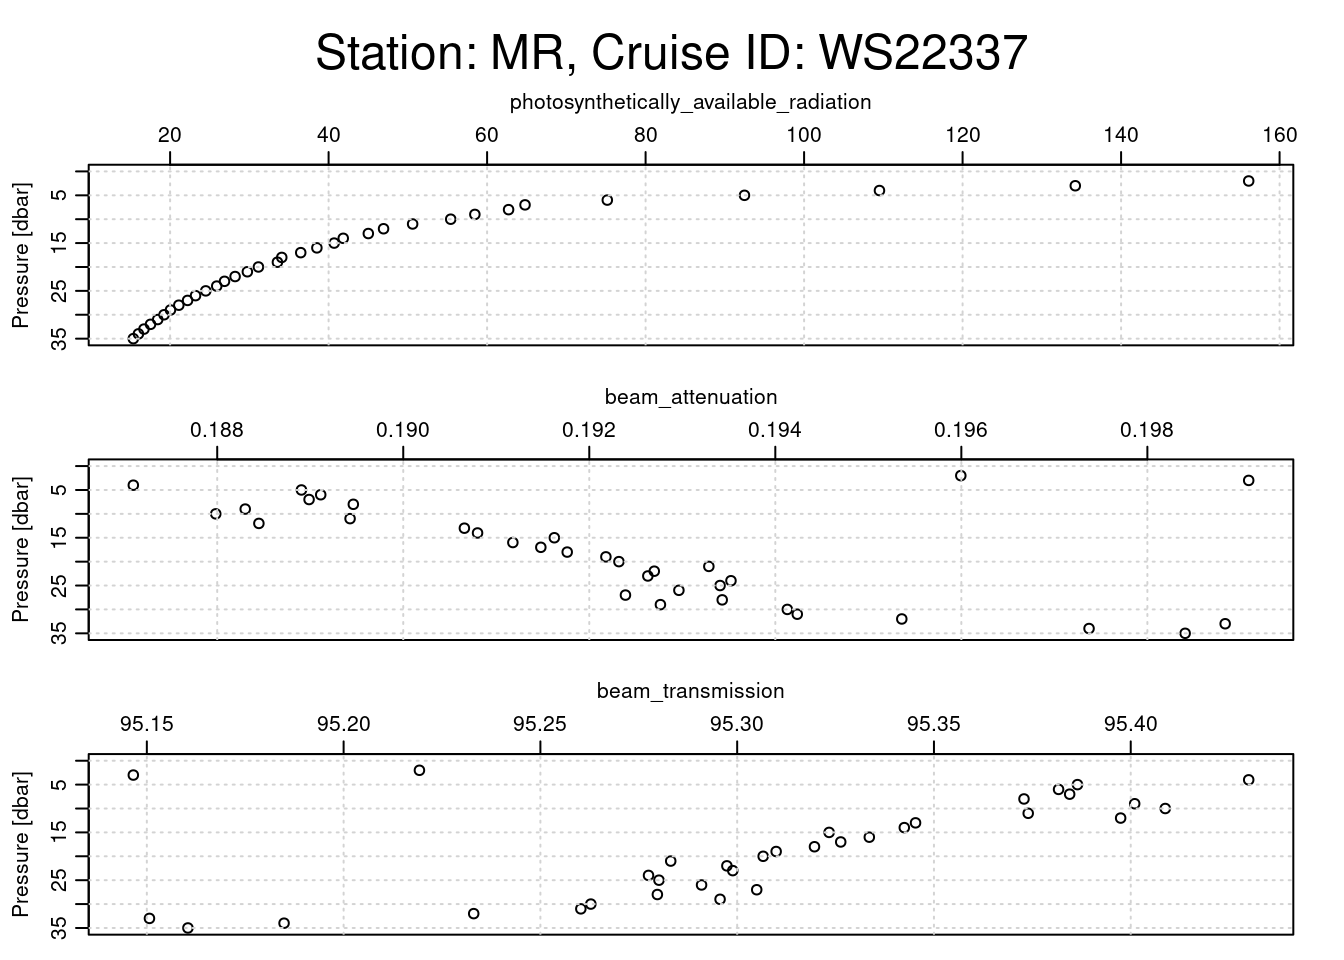
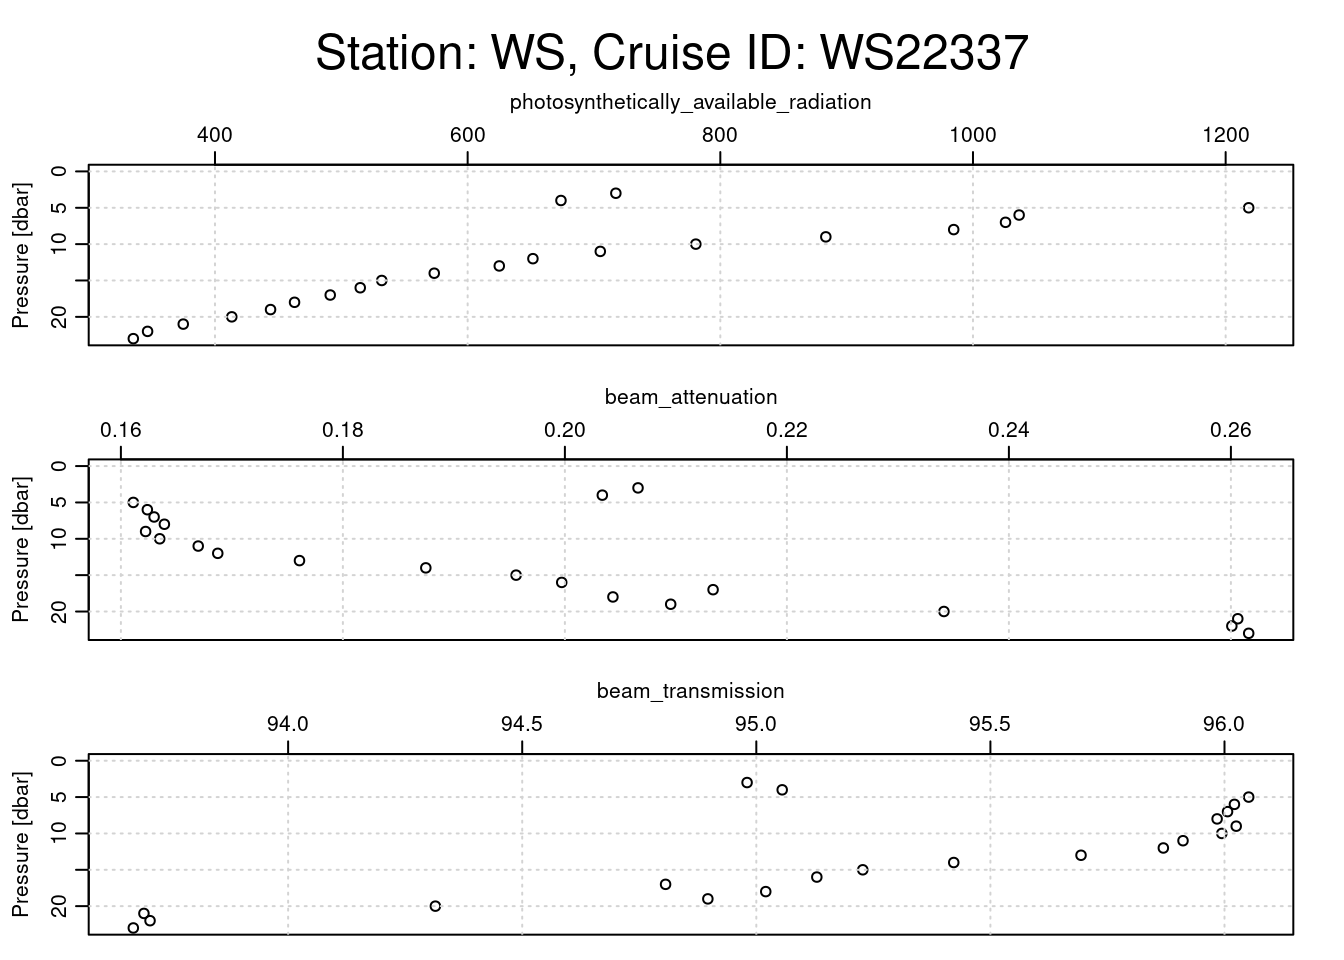
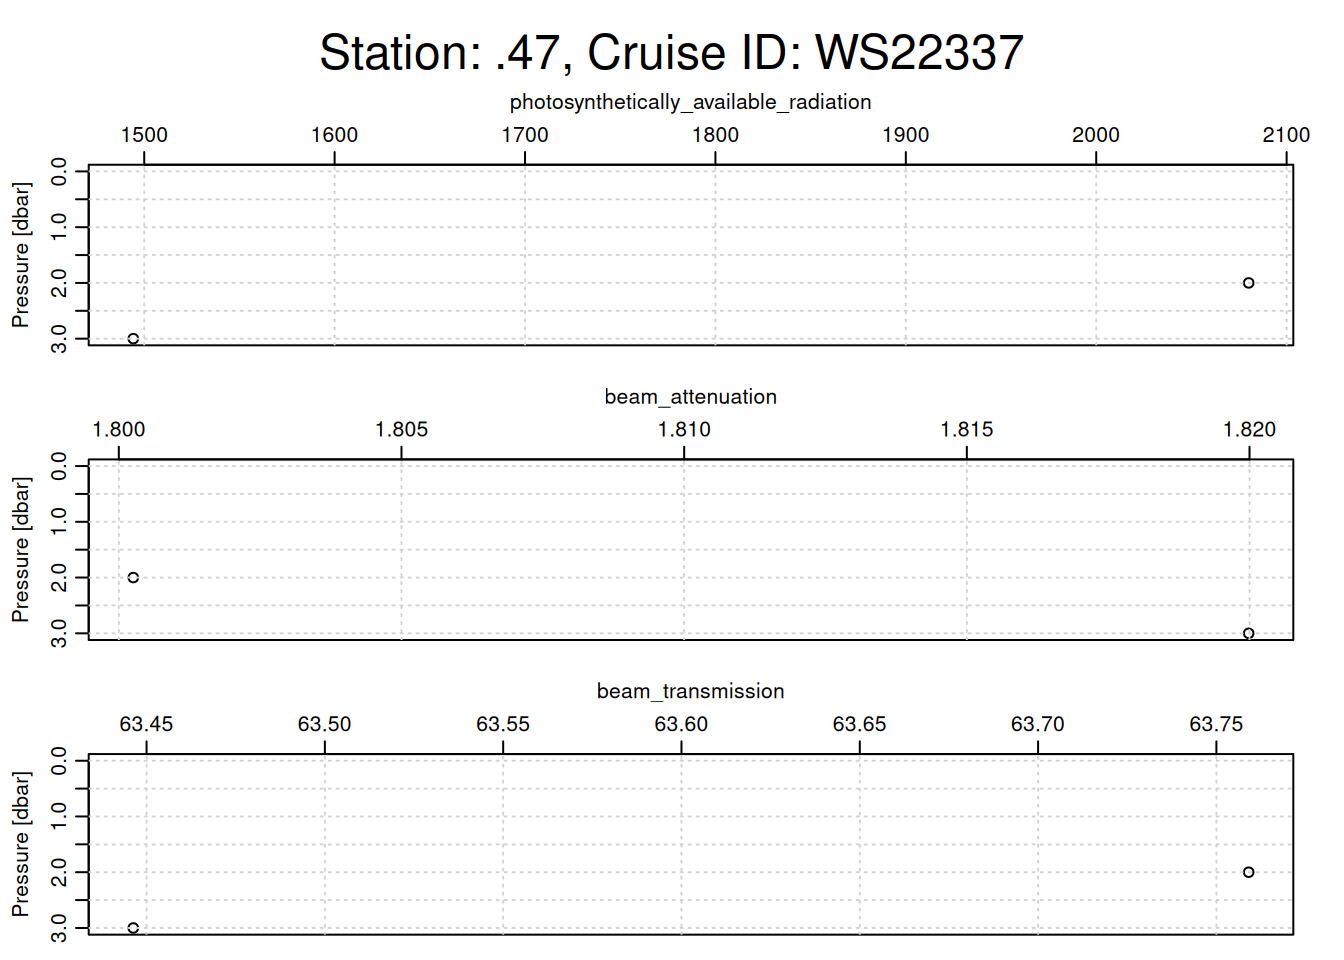
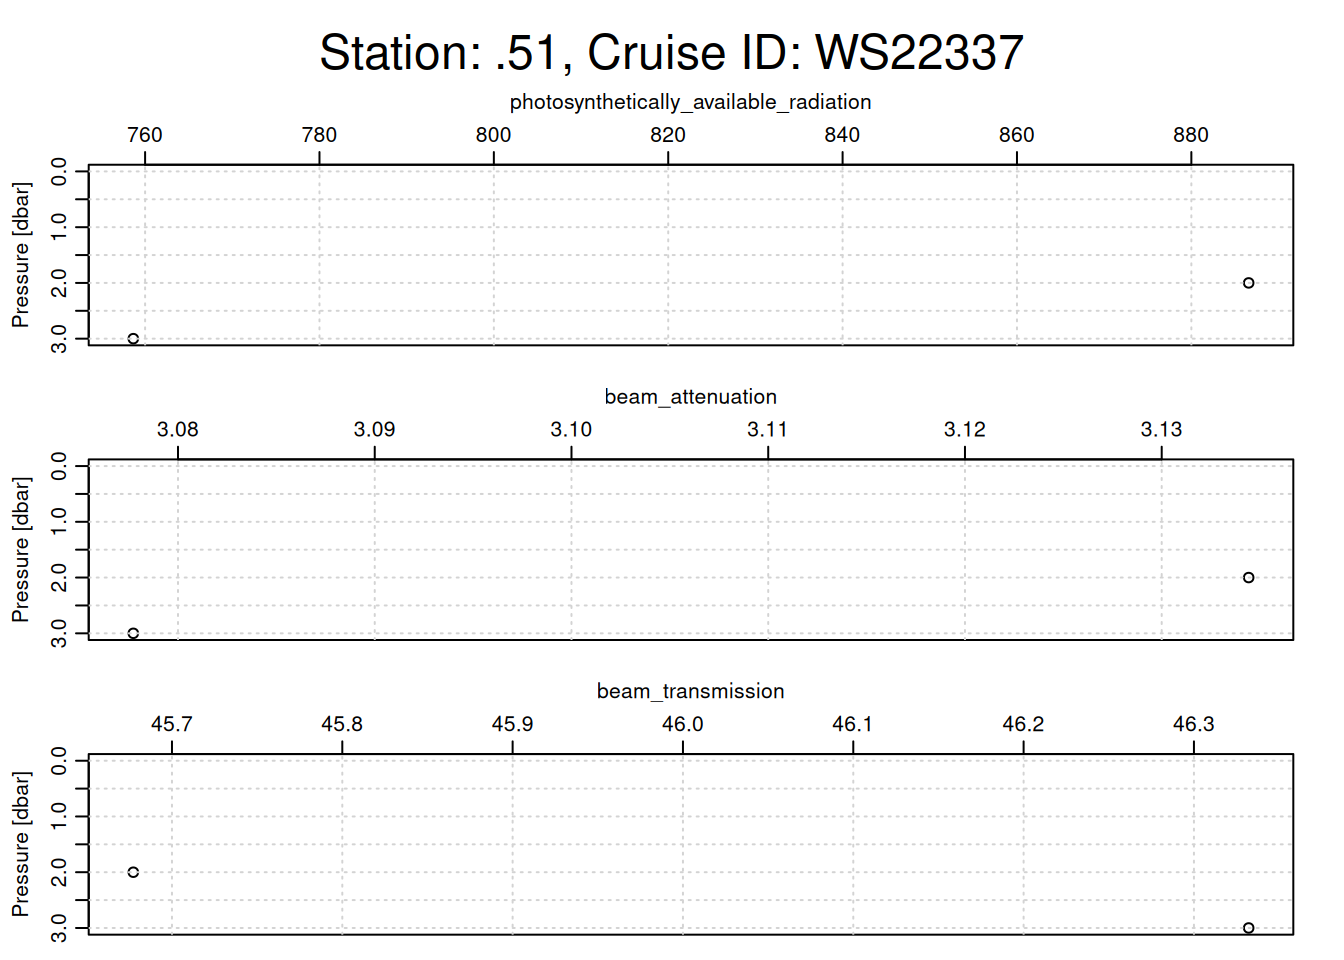
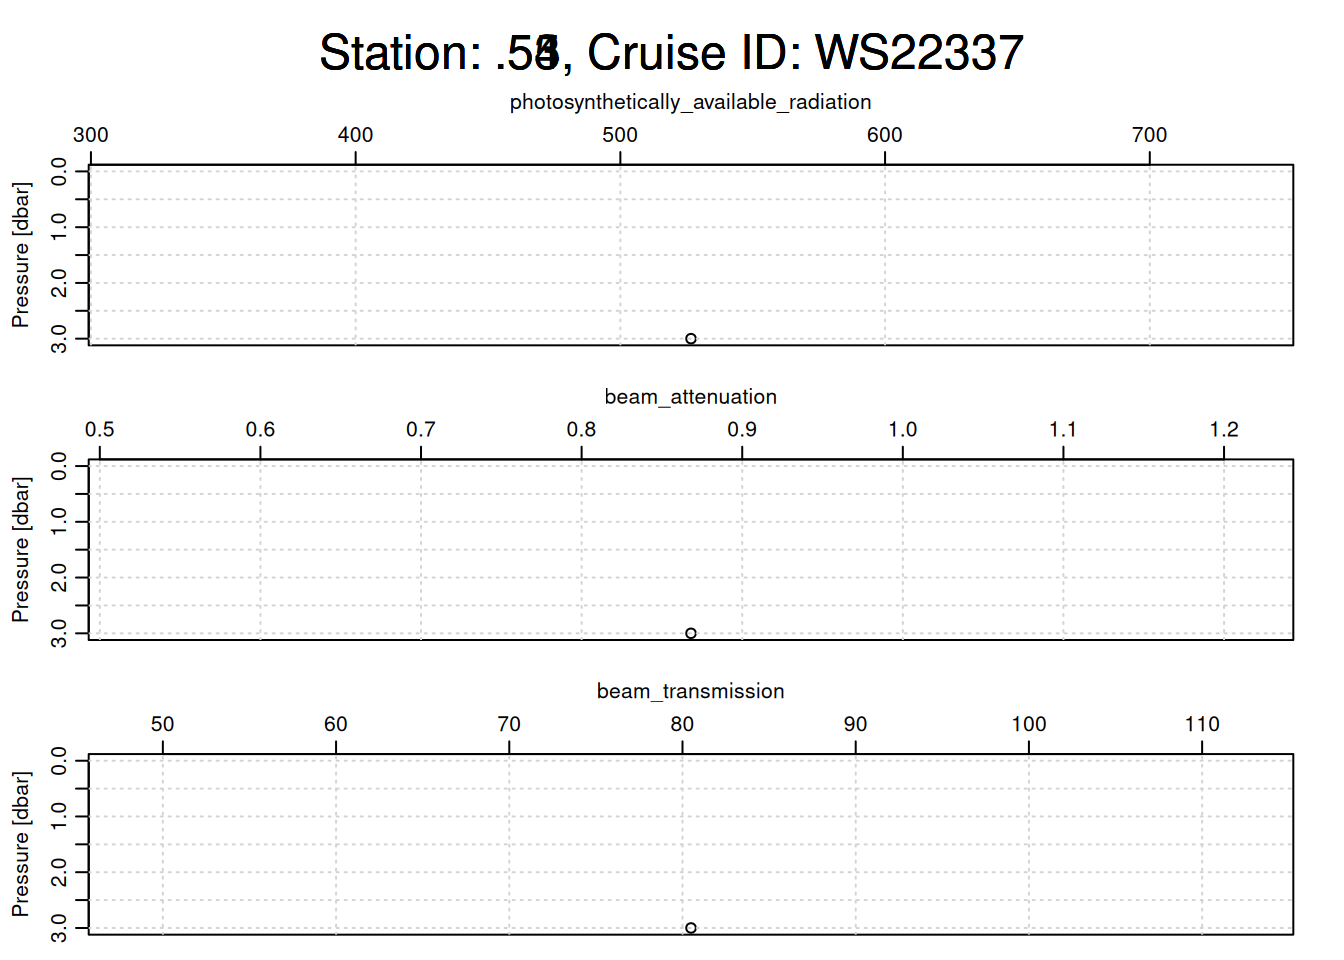
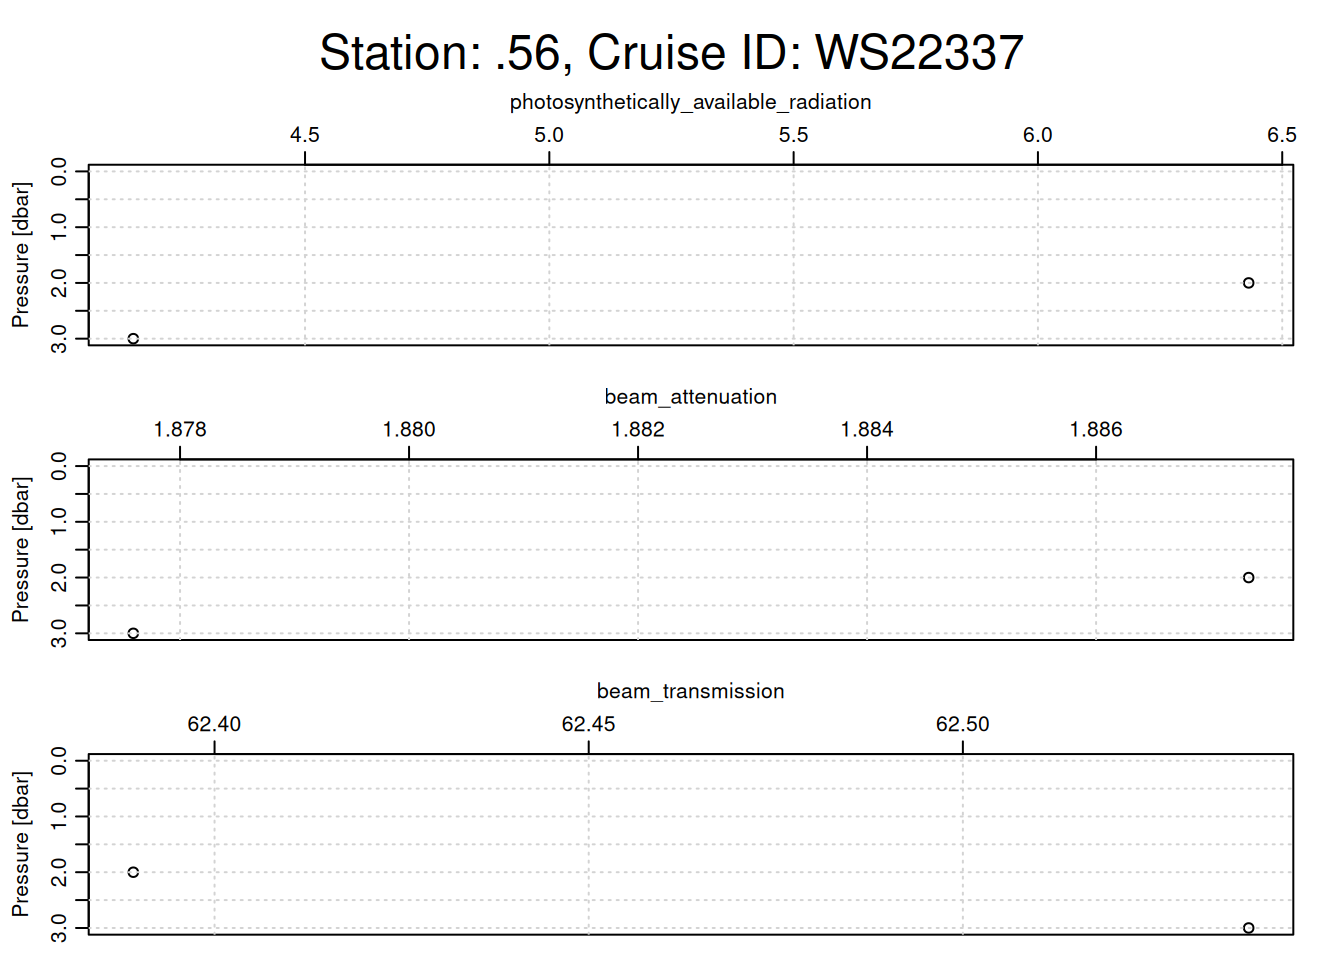
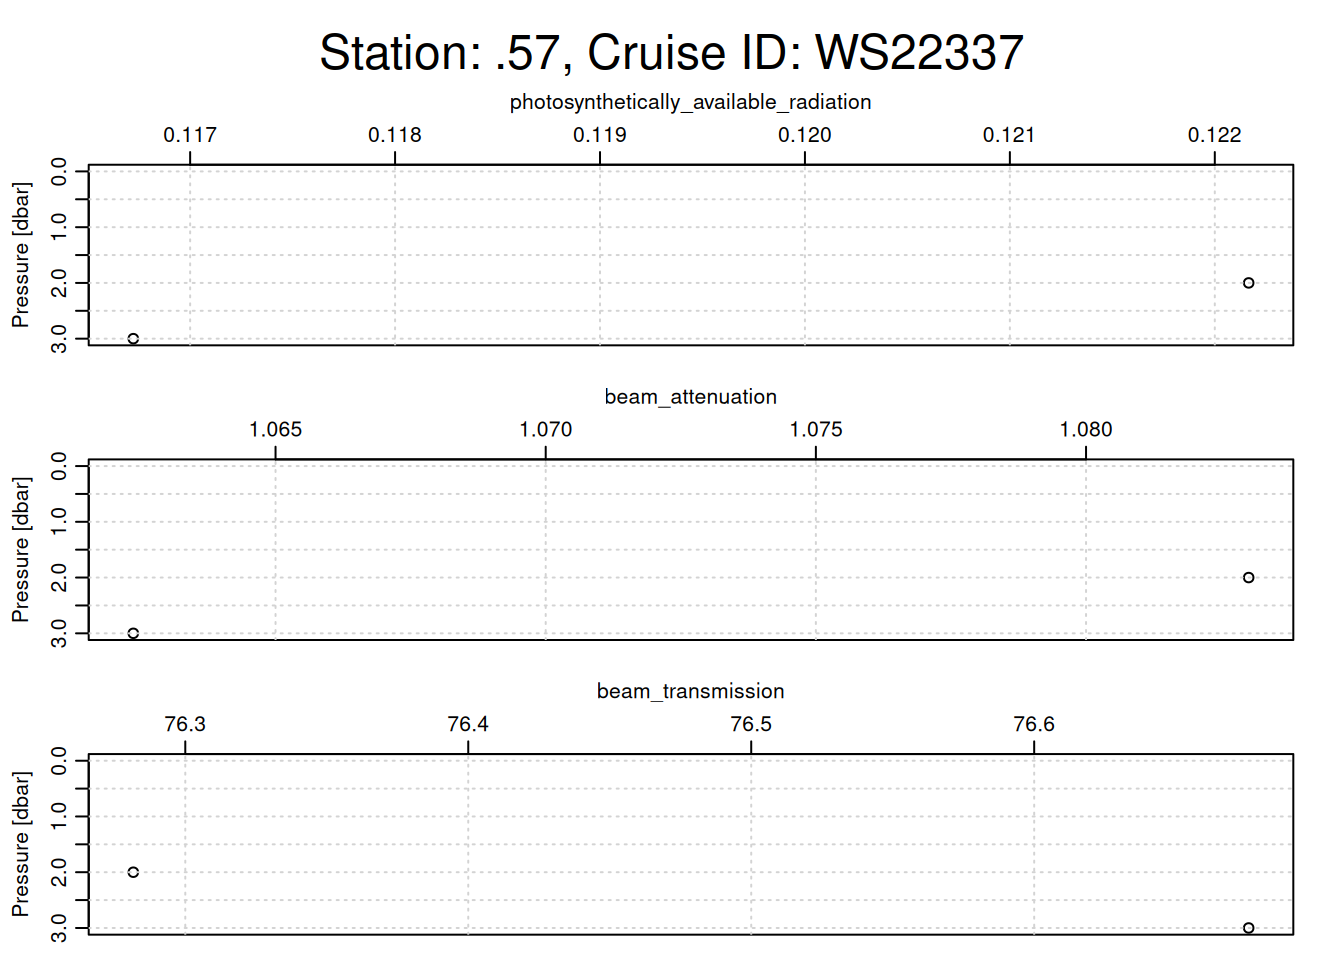
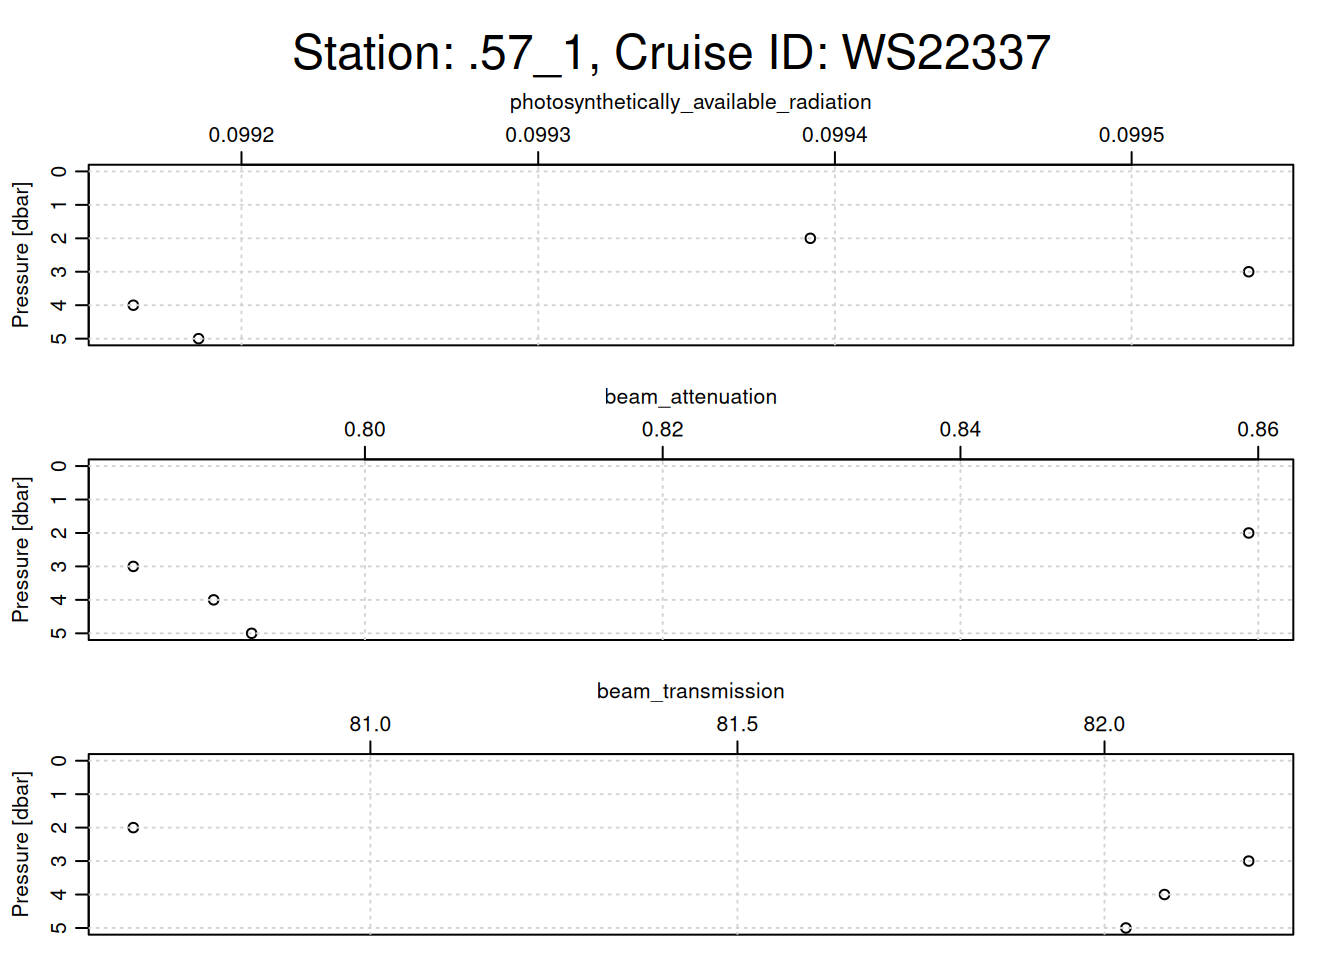
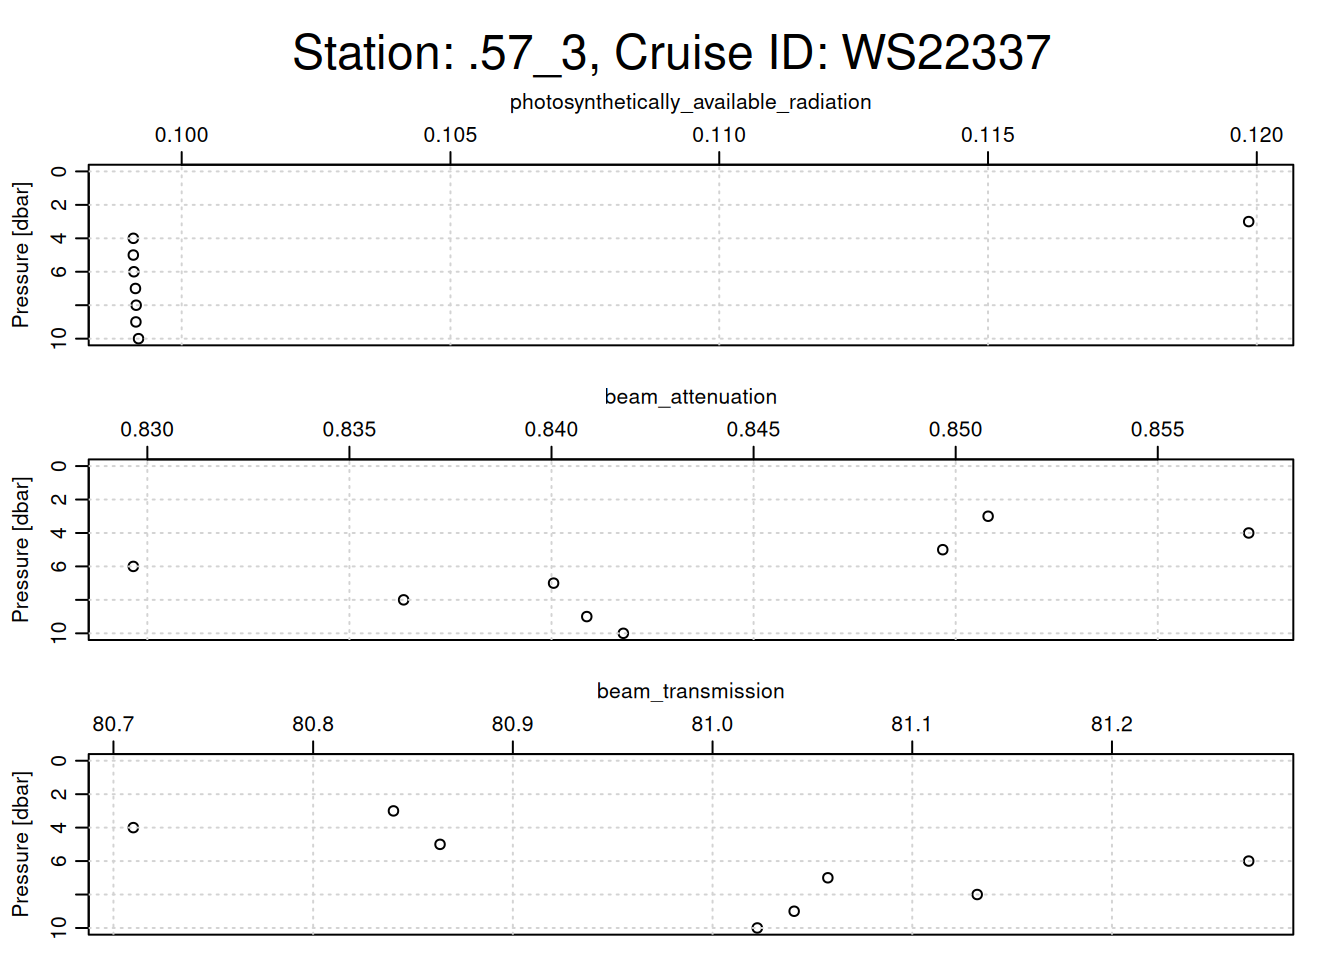
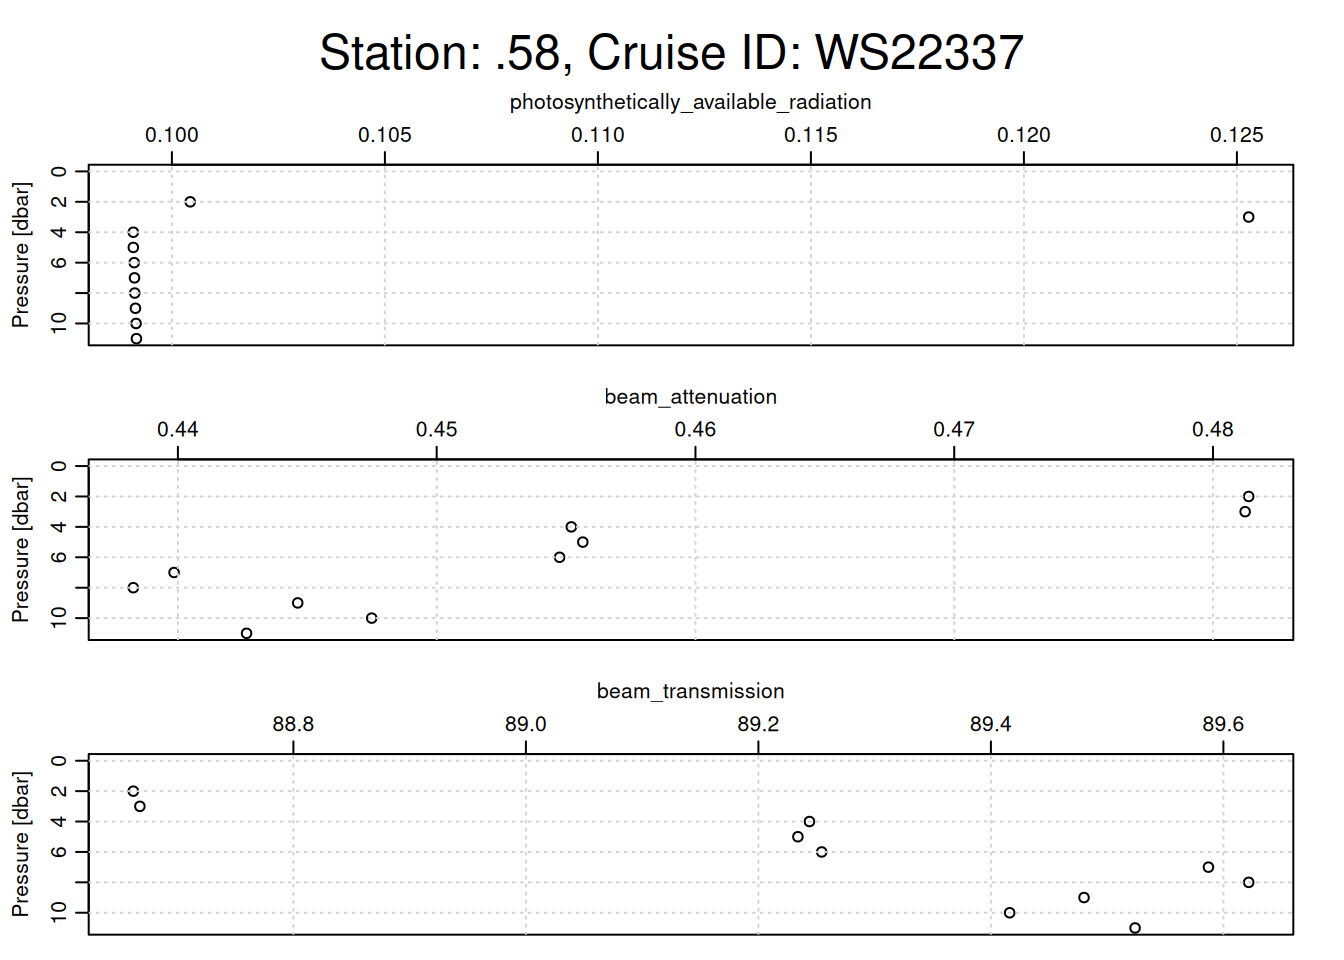
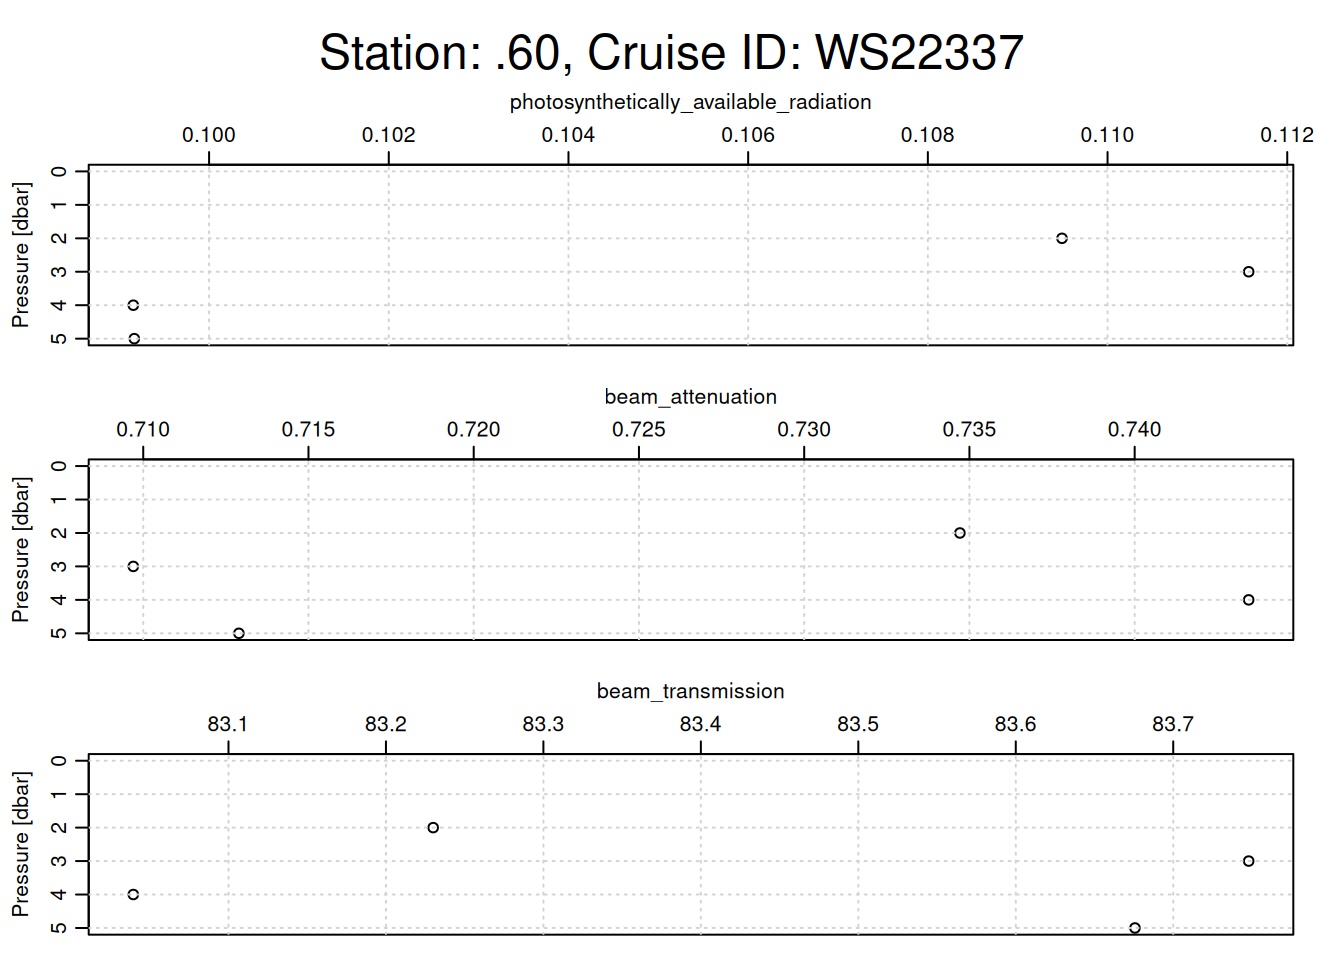
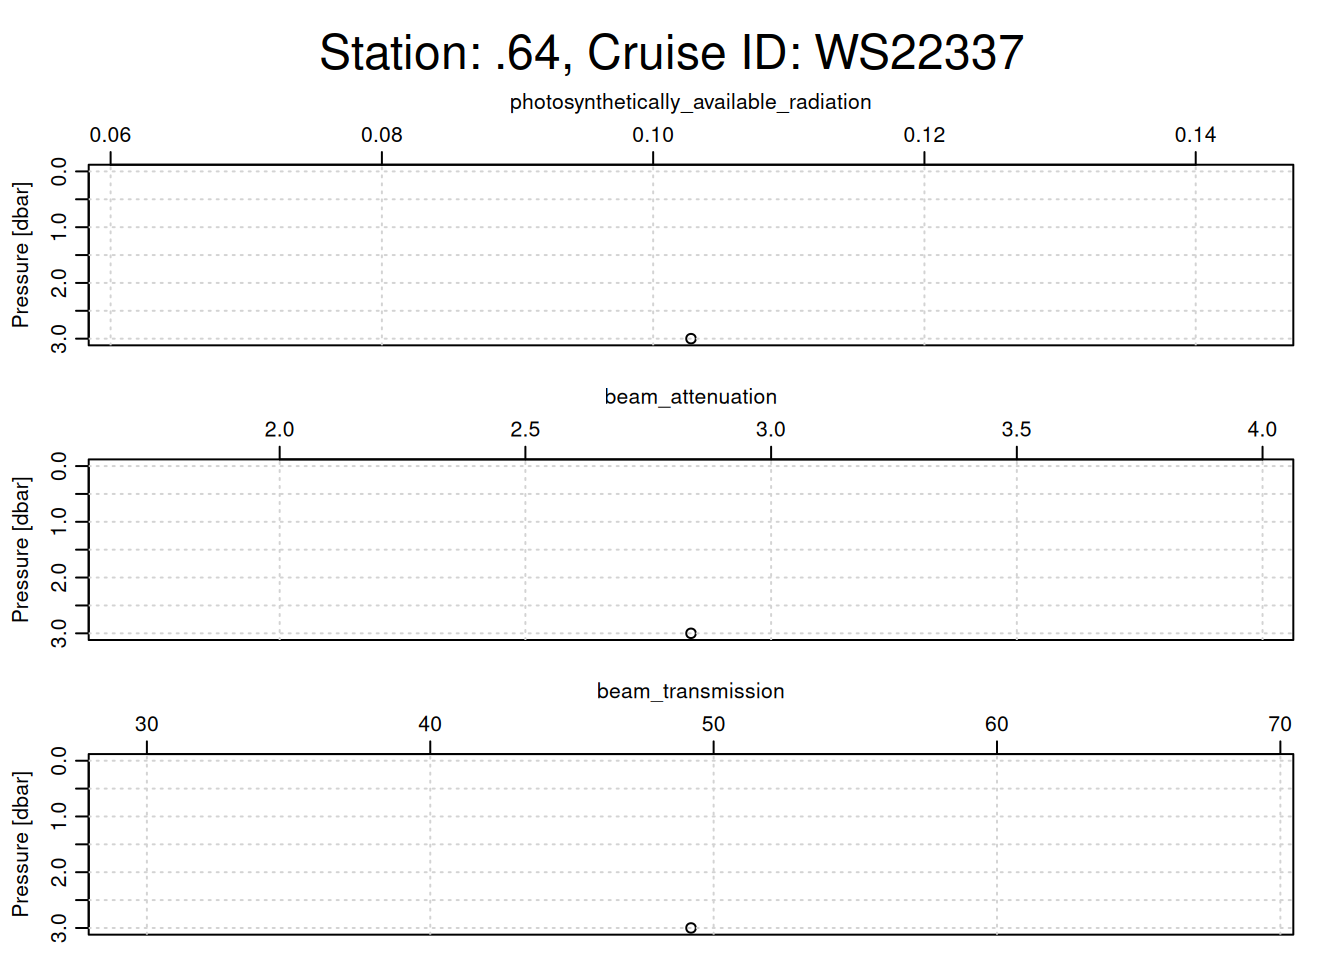
plotting other optical parameters for each cast
# Loop through each CTD castfor (i inseq(ctd_FK)){ cast <- ctd_FK[[i]] # Assuming each sublist contains only one relevant CTD objecttryCatch({# Extract metadata for station name and cruise ID station_name <- cast@metadata$station[1] cruise_id <- cast@data$cruise_id[1]# Generate a title with station name and cruise ID overall_title <- glue::glue("Station: {station_name}, Cruise ID: {cruise_id}")# Set margins: increase the outer margin for the titlepar(oma =c(0, 0, 3, 0)) # Top outer margin increased for title# Plotting function with specific parameters oce::plot(x =ctdDecimate(ctdTrim(cast)),which =c("photosynthetically_available_radiation","beam_attenuation","beam_transmission" ),main =""# No main title for individual subplots )# Place a single overall title at the top of the plot framemtext(overall_title, side =3, line =1, outer =TRUE, cex =1.5)# Reset outer margins to defaultpar(oma =c(0, 0, 0, 0)) }, error =function(e) {print(e$message) # Print any errors that occur during plotting })}
[1] "need finite 'xlim' values"
[1] "unknown xtype value (\"0.098924\")"
loop through every cast, clean, & save
combined_df <-data.frame()for (i inseq(ctd_FK)){tryCatch({ cast <- ctd_FK[[i]] # 1 is selecting only the first sublist# print(class(cast))# clean cast trimmed_cast <-ctdTrim(cast) decimated_cast <-ctdDecimate(trimmed_cast, p =0.5) # binned to 0.5 m# convert to df cast_df <-as.data.frame(decimated_cast@data)# Add metadata# assumes station ID and cruise ID the same for all & just uses 1st one cast_df <-mutate( cast_df,station = cast@data$station[1],cruise_id = cast@data$cruise_id[1] )# drop NA rows left by cleaning cast_df <-subset(cast_df, !is.na(scan))# Append the data to the combined dataframe combined_df <-rbind(combined_df, cast_df) }, error =function(e){print(glue("error in cast {cast@metadata$station[1]}"))print(e) })}# Save to CSVfile_path <-here(glue("data/cleaned/{cruise_id}.csv"))write.csv(combined_df, file_path, row.names =FALSE)