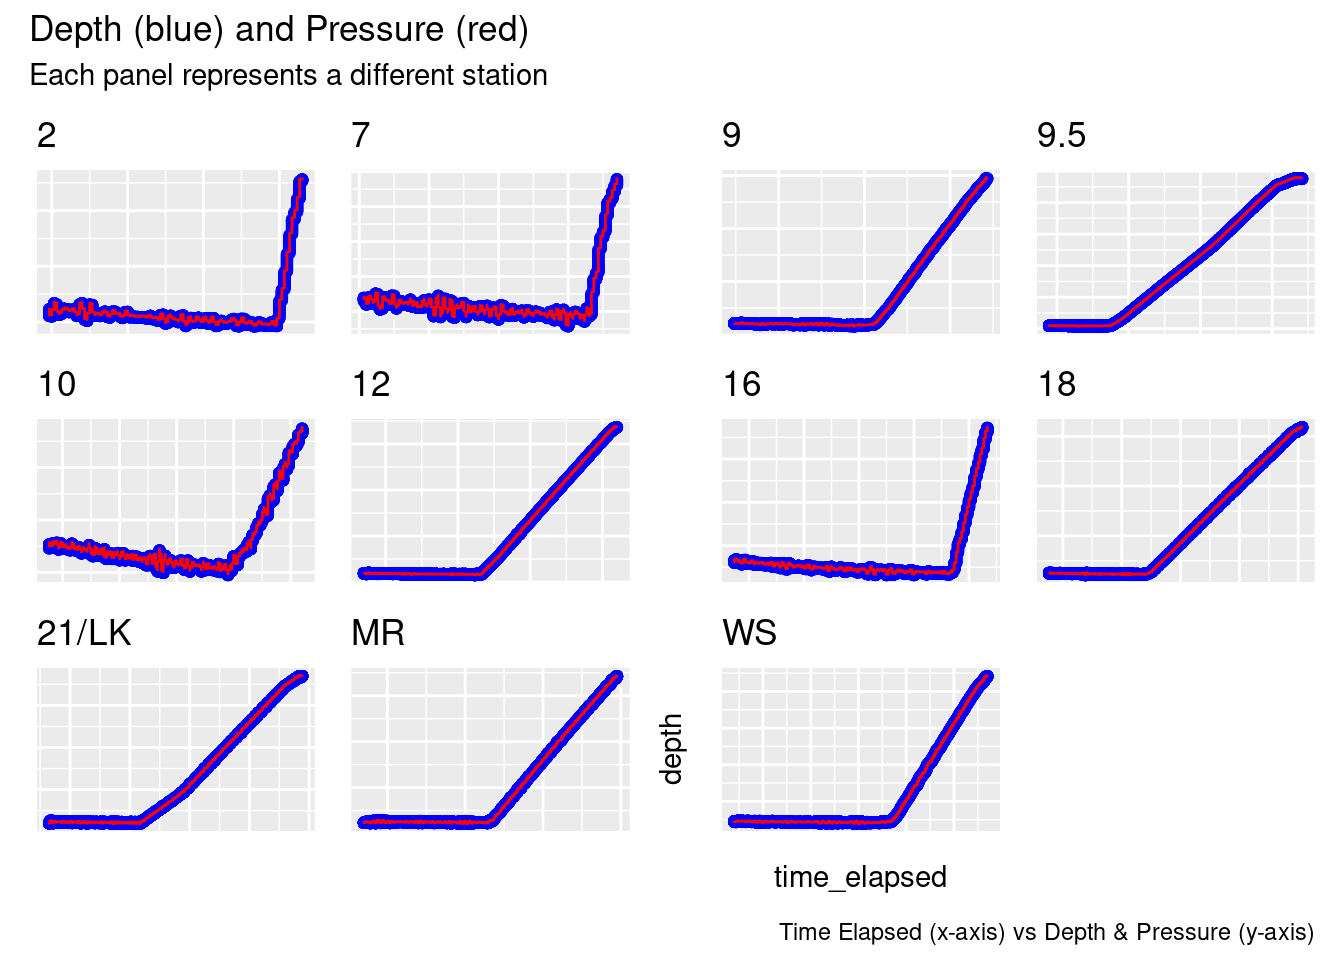
tryCatch({ plots <-list()for (station_name inunique(cruise_df$station)) { subset_df <-filter(cruise_df, station == station_name) plots[[station_name]] <-ggplot(subset_df, aes(x = time_elapsed)) +geom_point(aes(y = depth), color ="blue") +# Plot depth in bluegeom_line(aes(y = sea_water_pressure), color ="red") +# Plot sea water pressure in redggtitle(glue("{station_name}")) +theme(axis.title.x =element_blank(),axis.title.y =element_blank(),axis.text.x =element_blank(),axis.text.y =element_blank(),axis.ticks.x =element_blank(),axis.ticks.y =element_blank() ) # Remove individual axis titles and text }# drop nulls plots <- purrr::compact(plots)# Combine all plots into a grid combined_plot <-wrap_plots(plots) +plot_layout(ncol =4) +# Adjust ncol to set number of columns in the gridplot_annotation(title ="Depth (blue) and Pressure (red)",subtitle ="Each panel represents a different station",caption ="Time Elapsed (x-axis) vs Depth & Pressure (y-axis)" ) +theme(plot.tag =element_text(size =12, face ="bold"),plot.tag.position ="topleft",axis.title.x =element_text(margin =margin(t =10)),axis.title.y =element_text(margin =margin(r =10)) )print(combined_plot)}, error =function(er){print(er)});
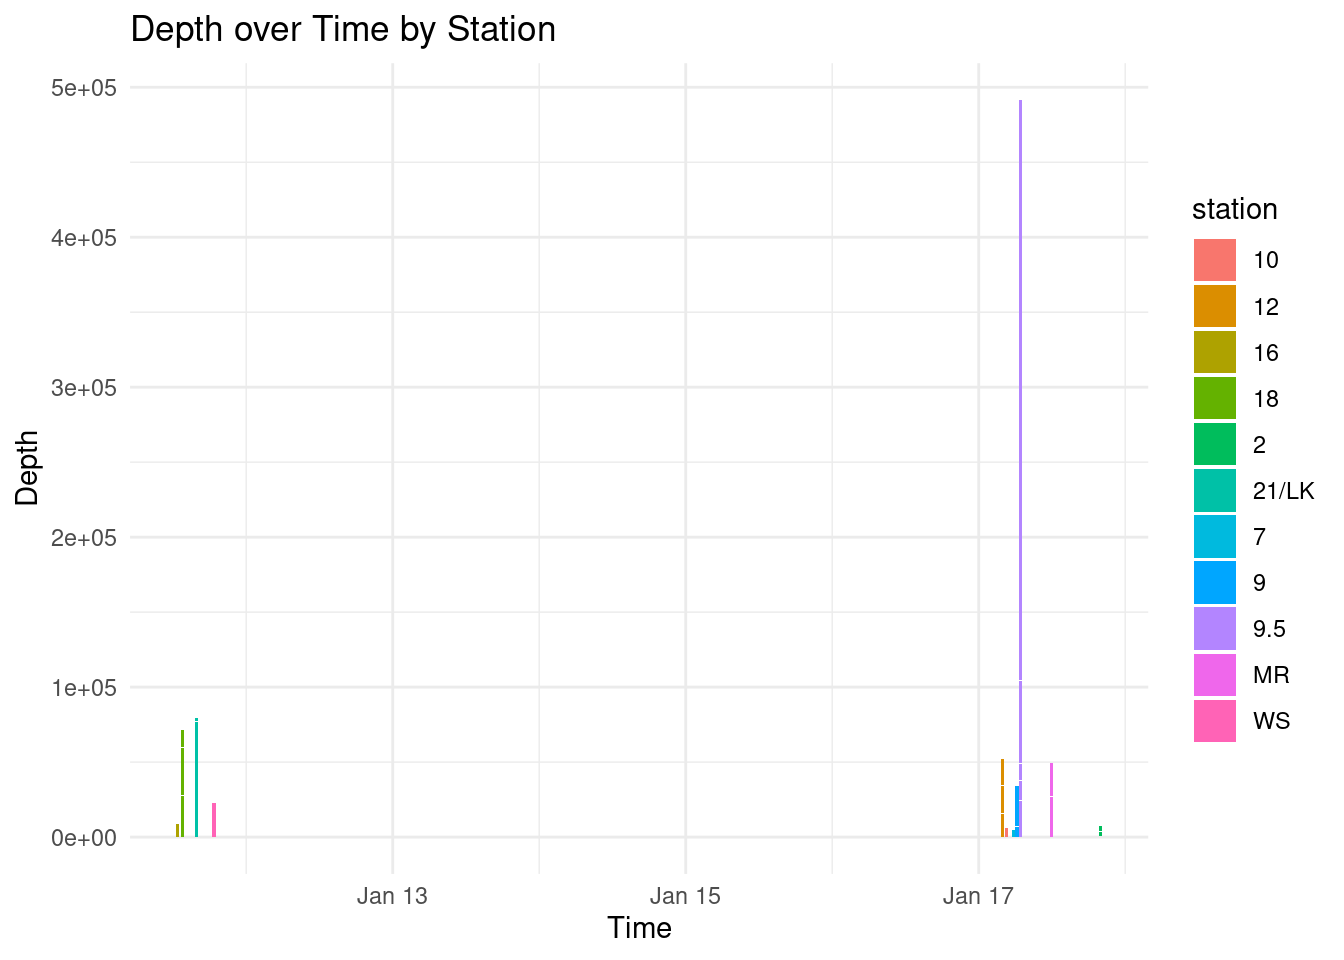
plot across all stations
p <-ggplot(cruise_df, aes(x = time, y = depth, fill = station)) +geom_col() +# This creates the bars# geom_text(aes(label = station), vjust = -0.3) + # This adds labels to each bar, adjust vjust for positionlabs(x ="Time", y ="Depth", title ="Depth over Time by Station") +# Set labels and titletheme_minimal() # Use a minimal themeprint(p)
create oce.ctd objects from dataframes
ctd_load <-function(data, other_params =NULL) {# create csv into ctd object test_ctd <-as.ctd(salinity = data$sea_water_salinity,temperature = data$sea_water_temperature,pressure = data$sea_water_pressure,station = data$station )# add additional columns to ctd objectif (!is.null(other_params)) {for (param_name in other_params) { test_ctd <-oceSetData(object = test_ctd,name = param_name,value = data[[param_name]] ) } }print(glue("{data$station[1]}:\t{length(test_ctd@data$scan)} scans"))return(test_ctd)}# Define other parameters to addother_params <-c("cruise_id", "station", "time", "time_elapsed", "latitude", "longitude", "sea_water_electrical_conductivity", "CDOM", "dissolved_oxygen","oxygen_saturation", "chlorophyll_concentration", "chlorophyll_fluorescence", "photosynthetically_available_radiation", "beam_attenuation","beam_transmission", "depth", "sea_water_sigma_t","descent_rate", "sound_velocity","altimeter")# Split data by station and create data listctd_FK <- cruise_df %>%split(.$station) %>%map(~ctd_load(.x, other_params = other_params)) # ~ is a lambda(x)
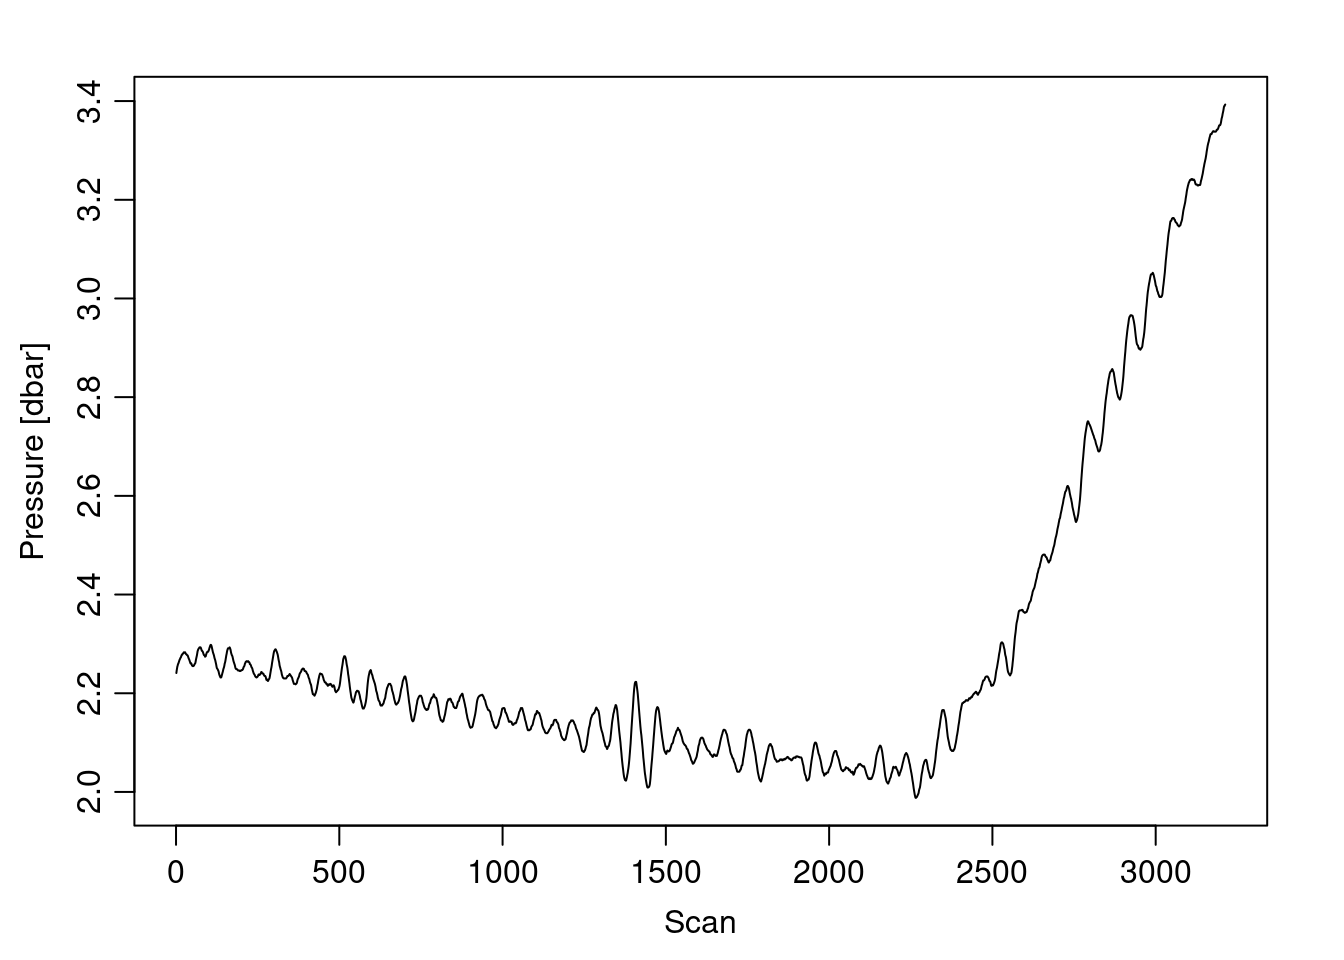
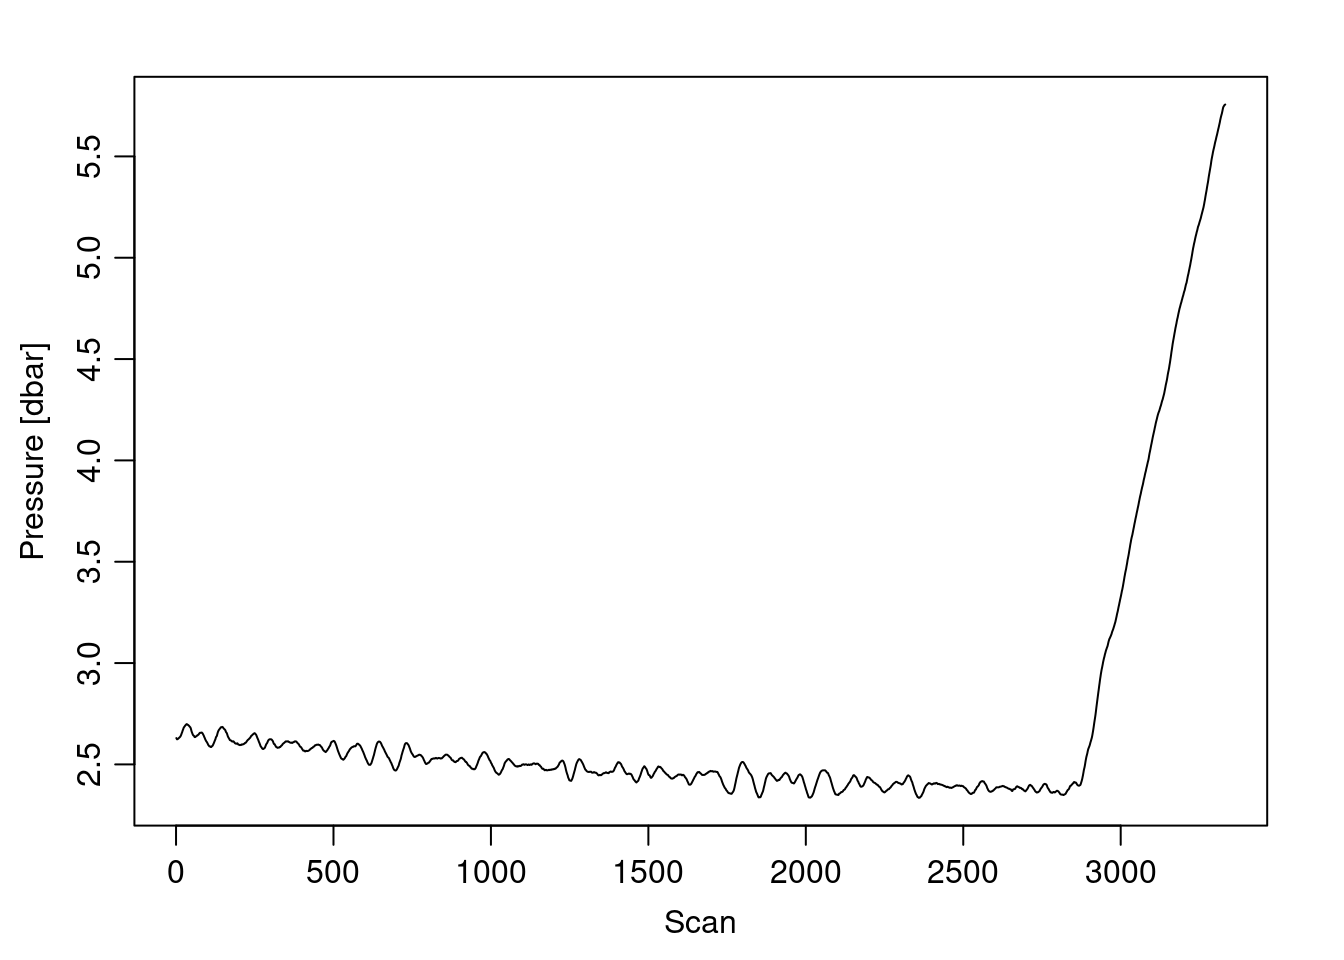
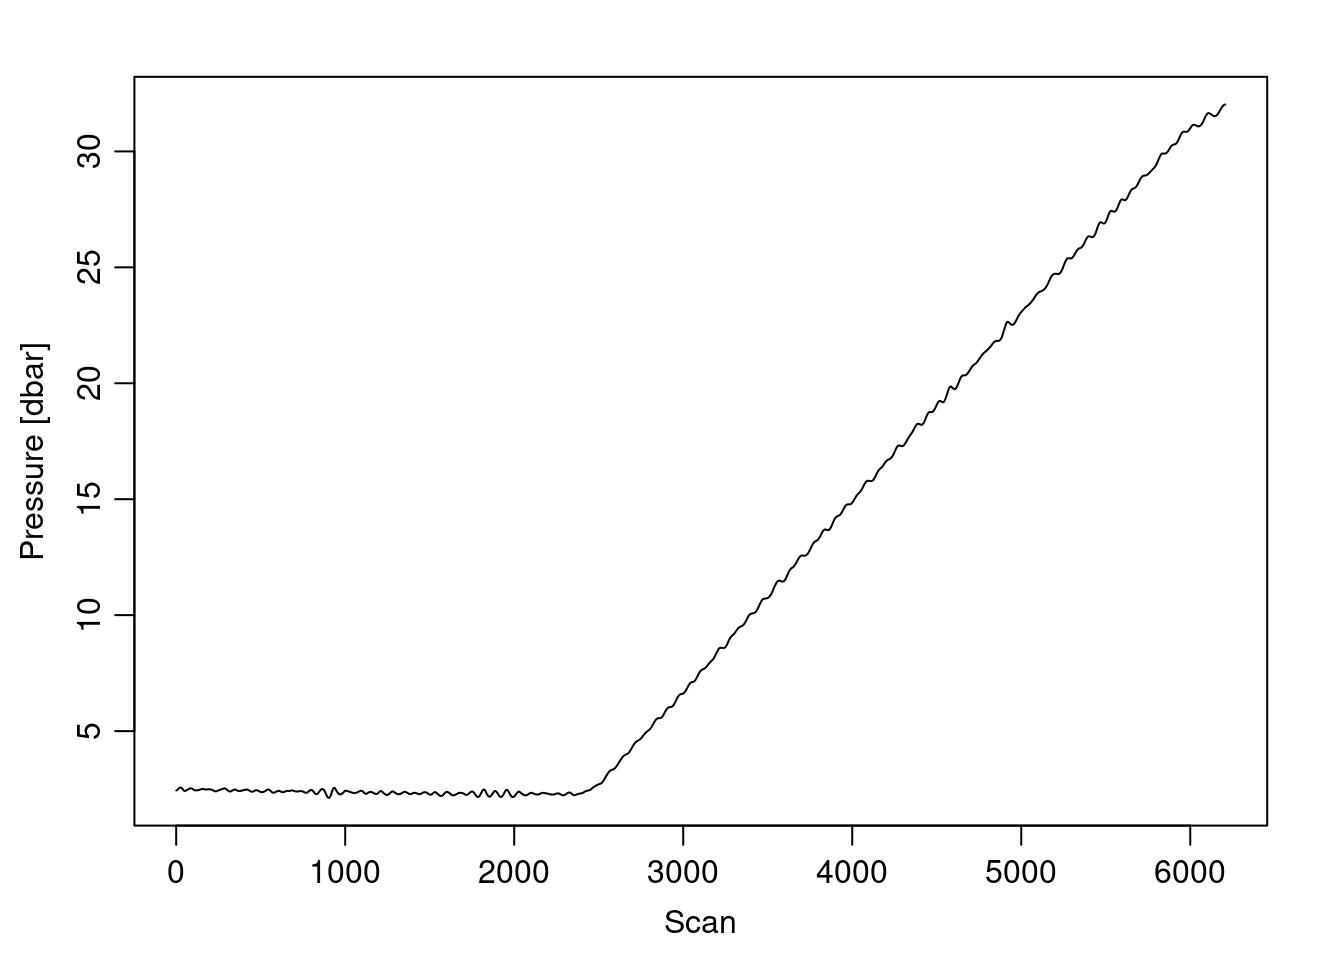
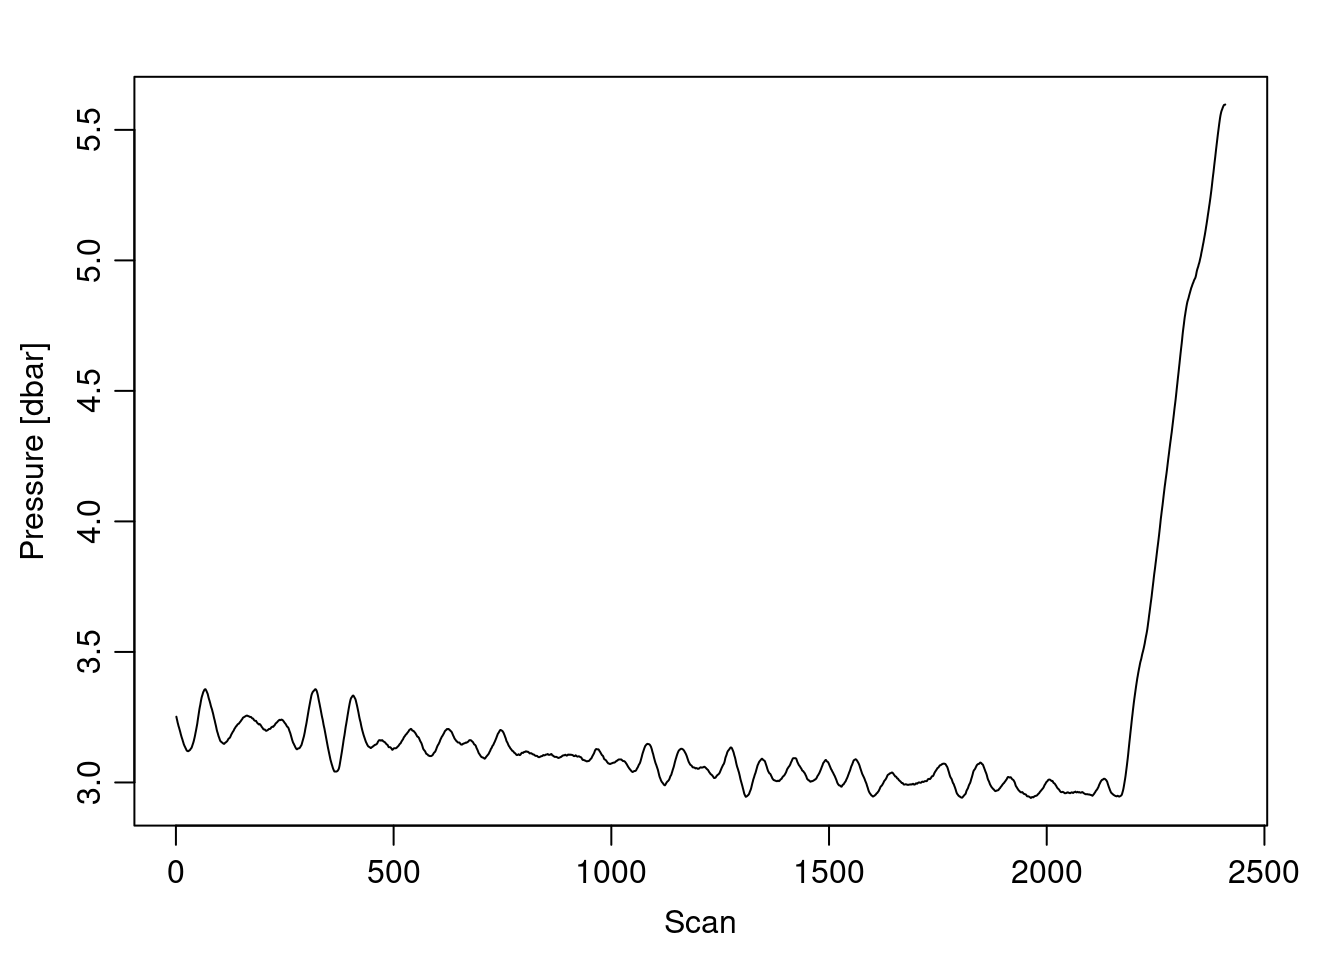
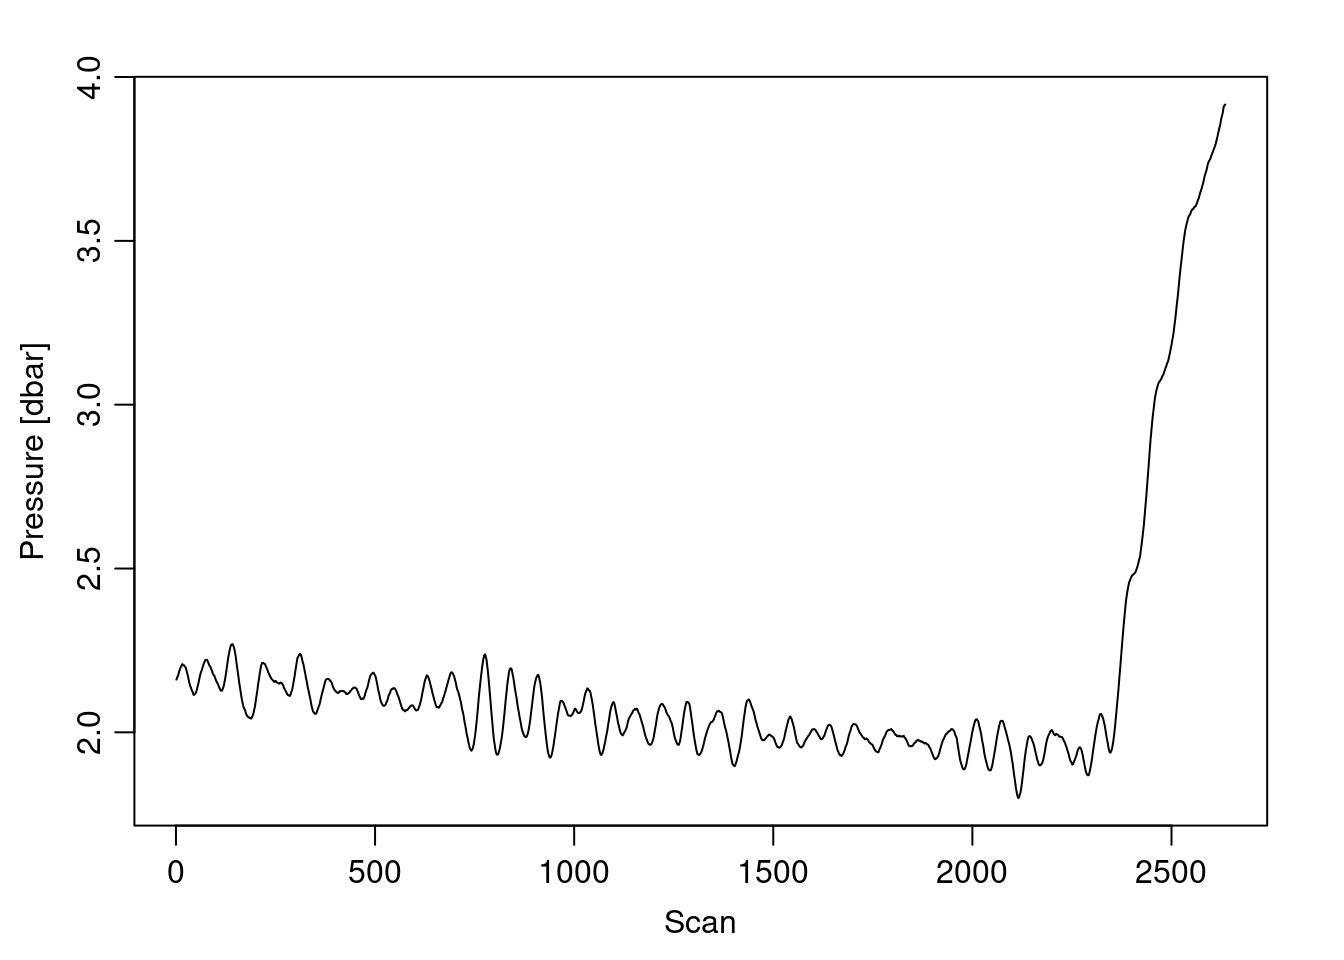
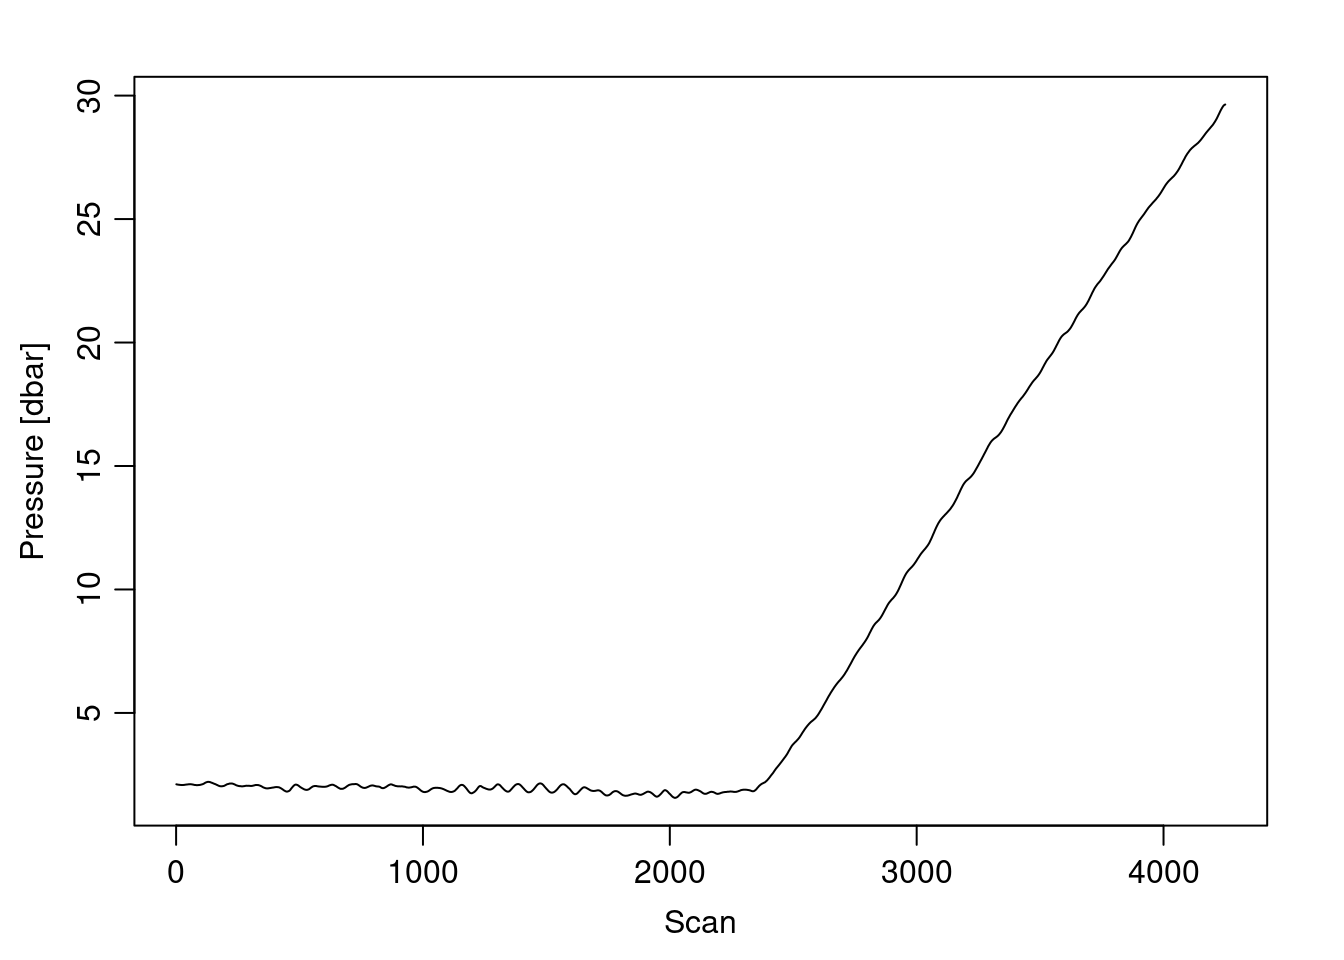
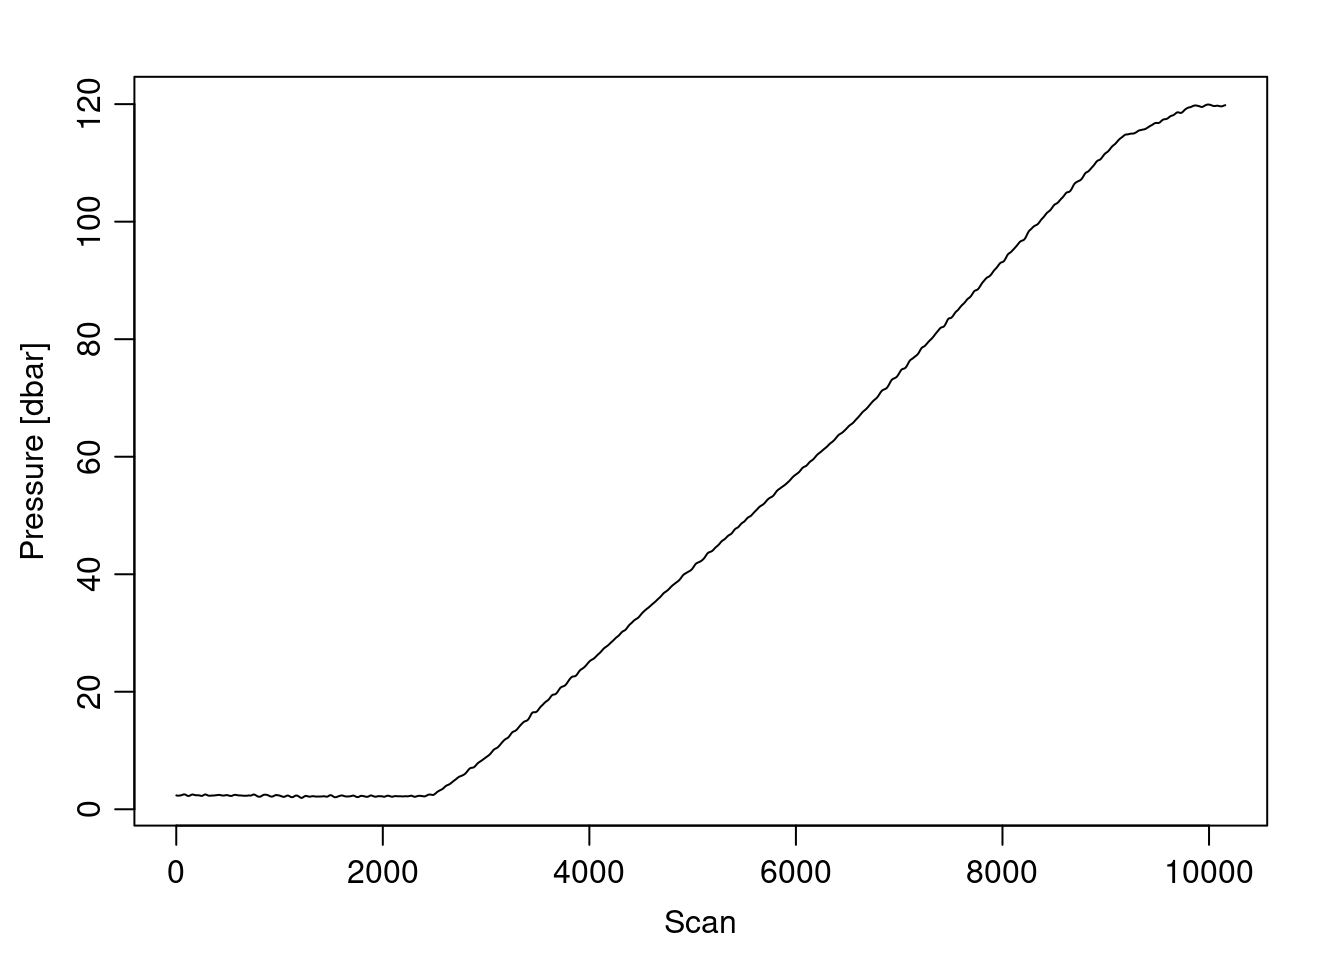
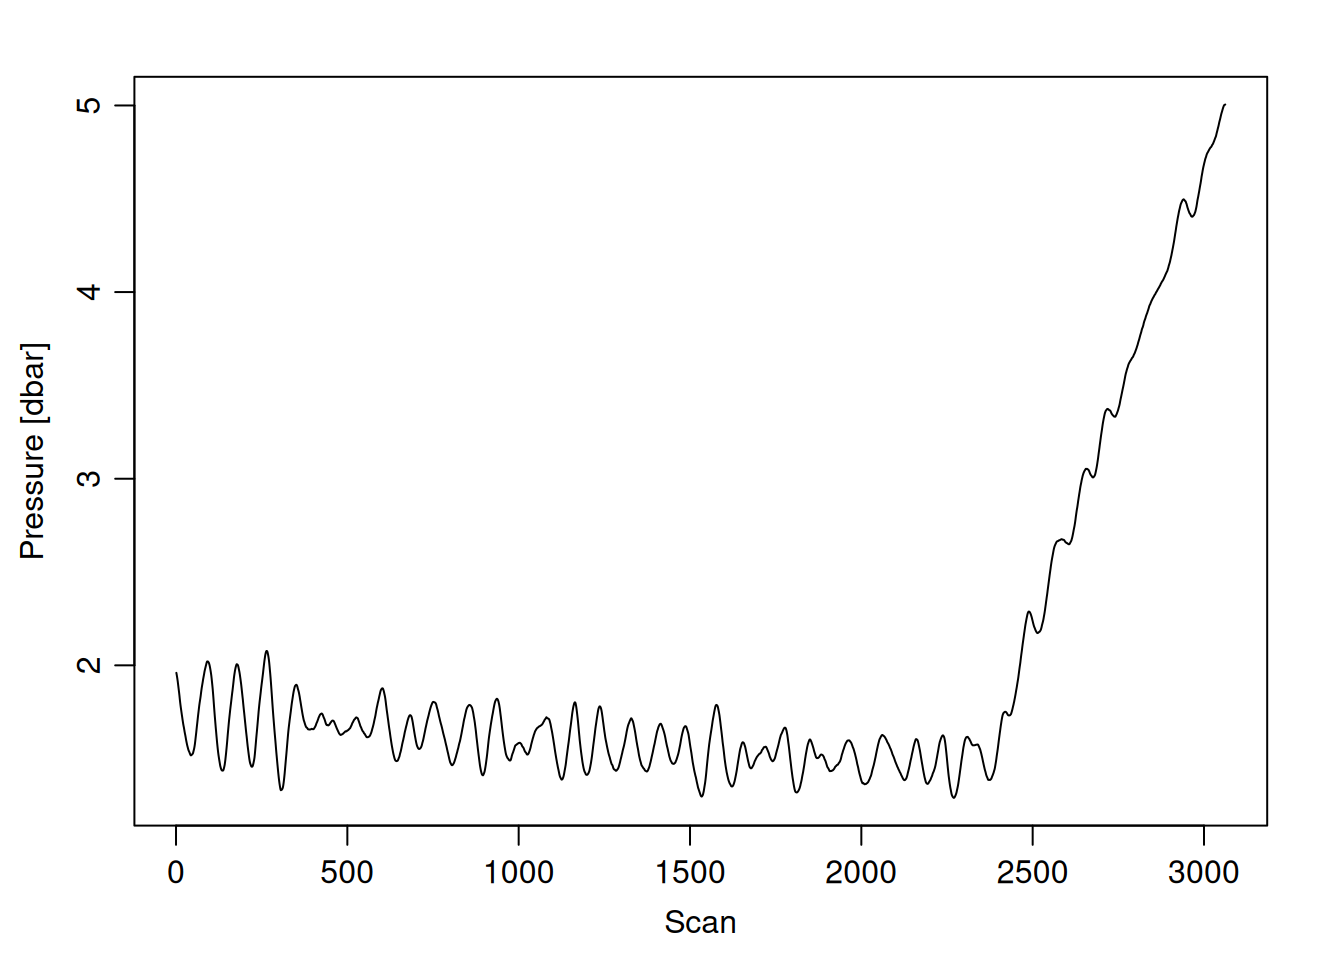
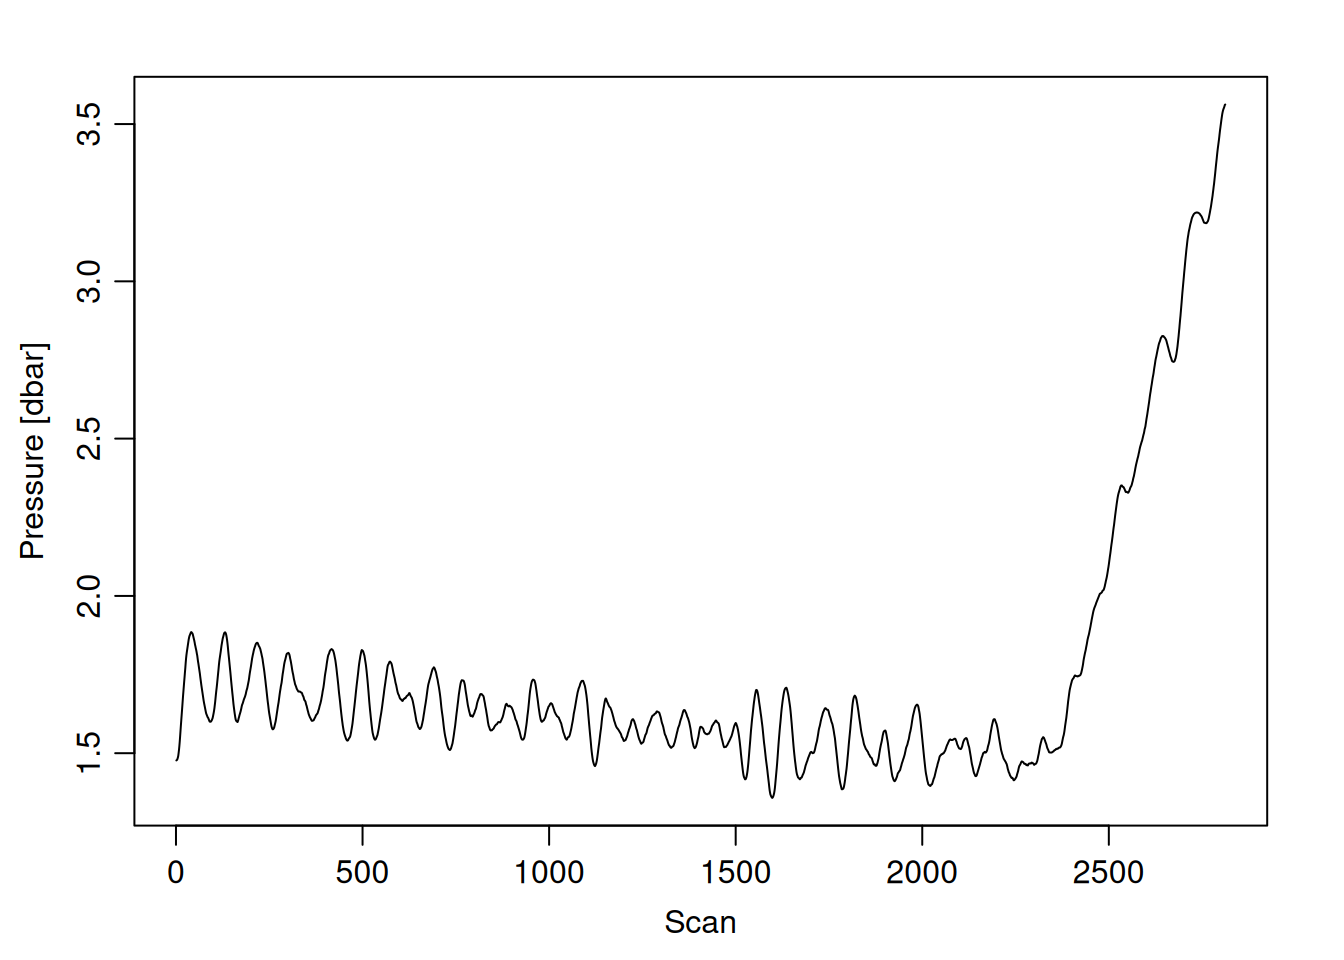
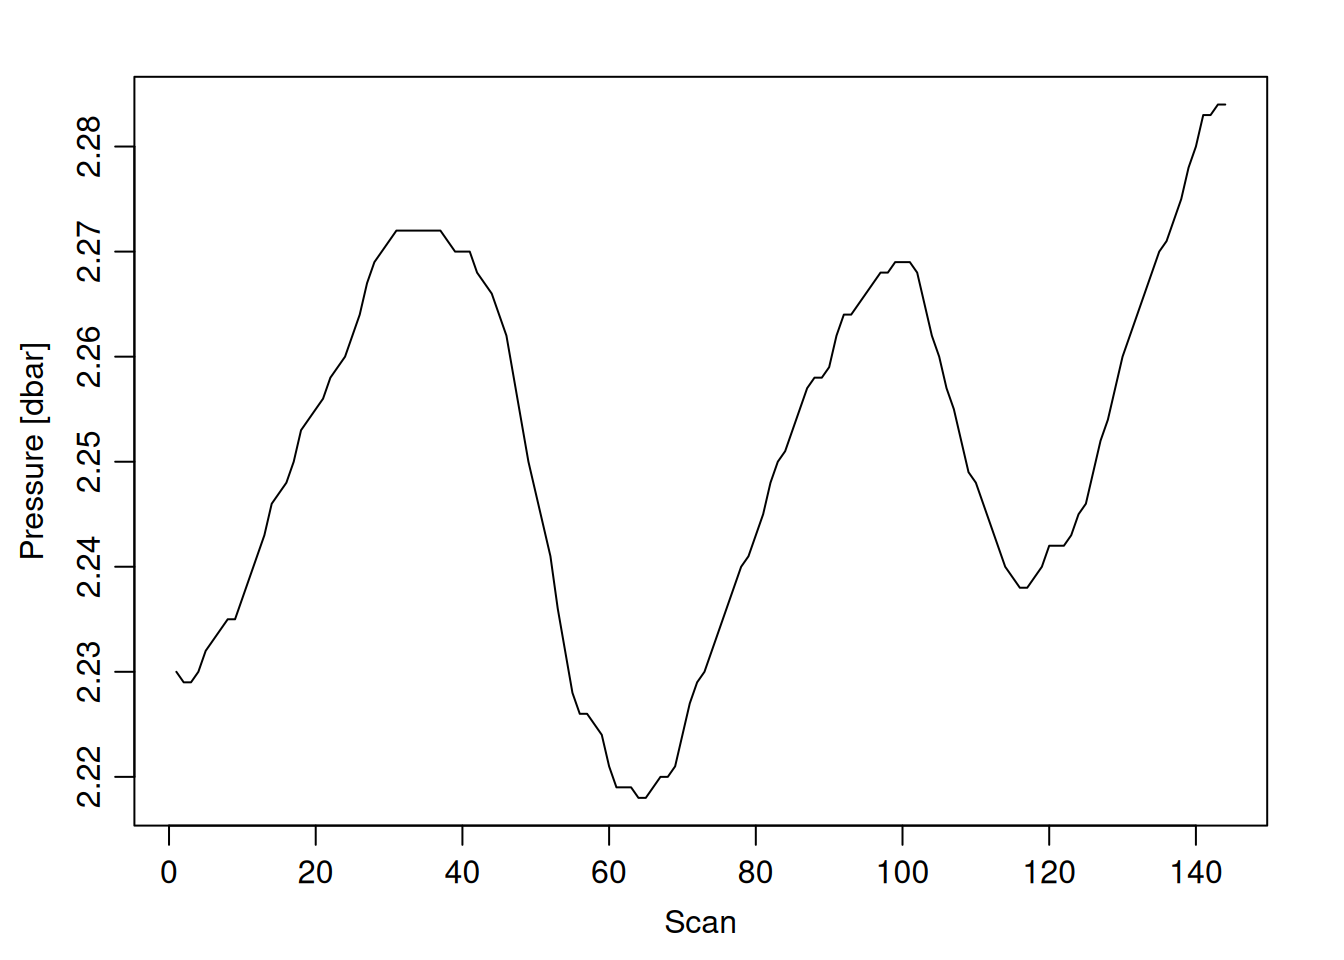
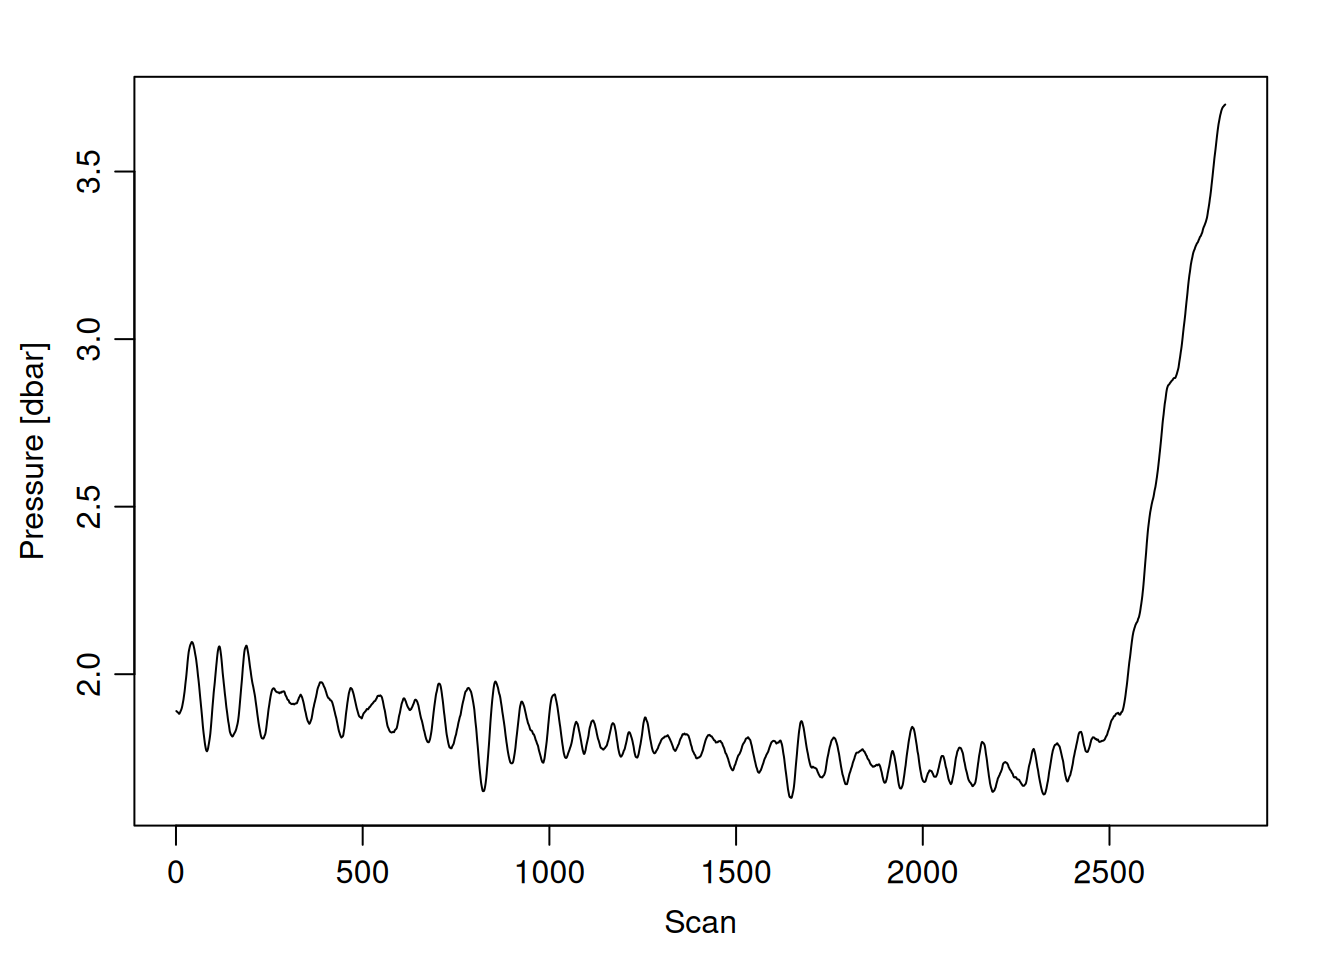
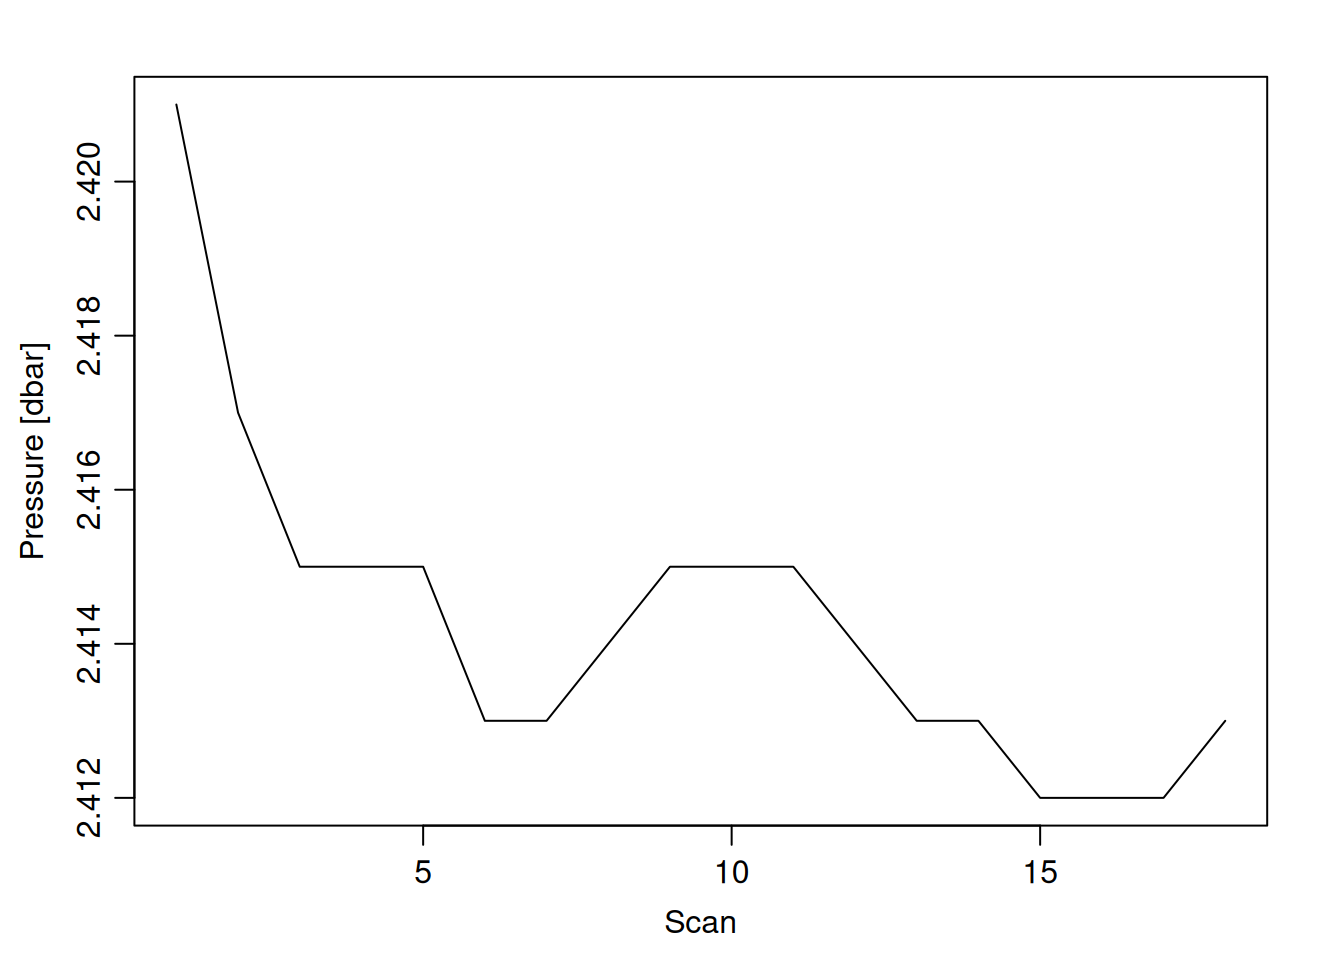
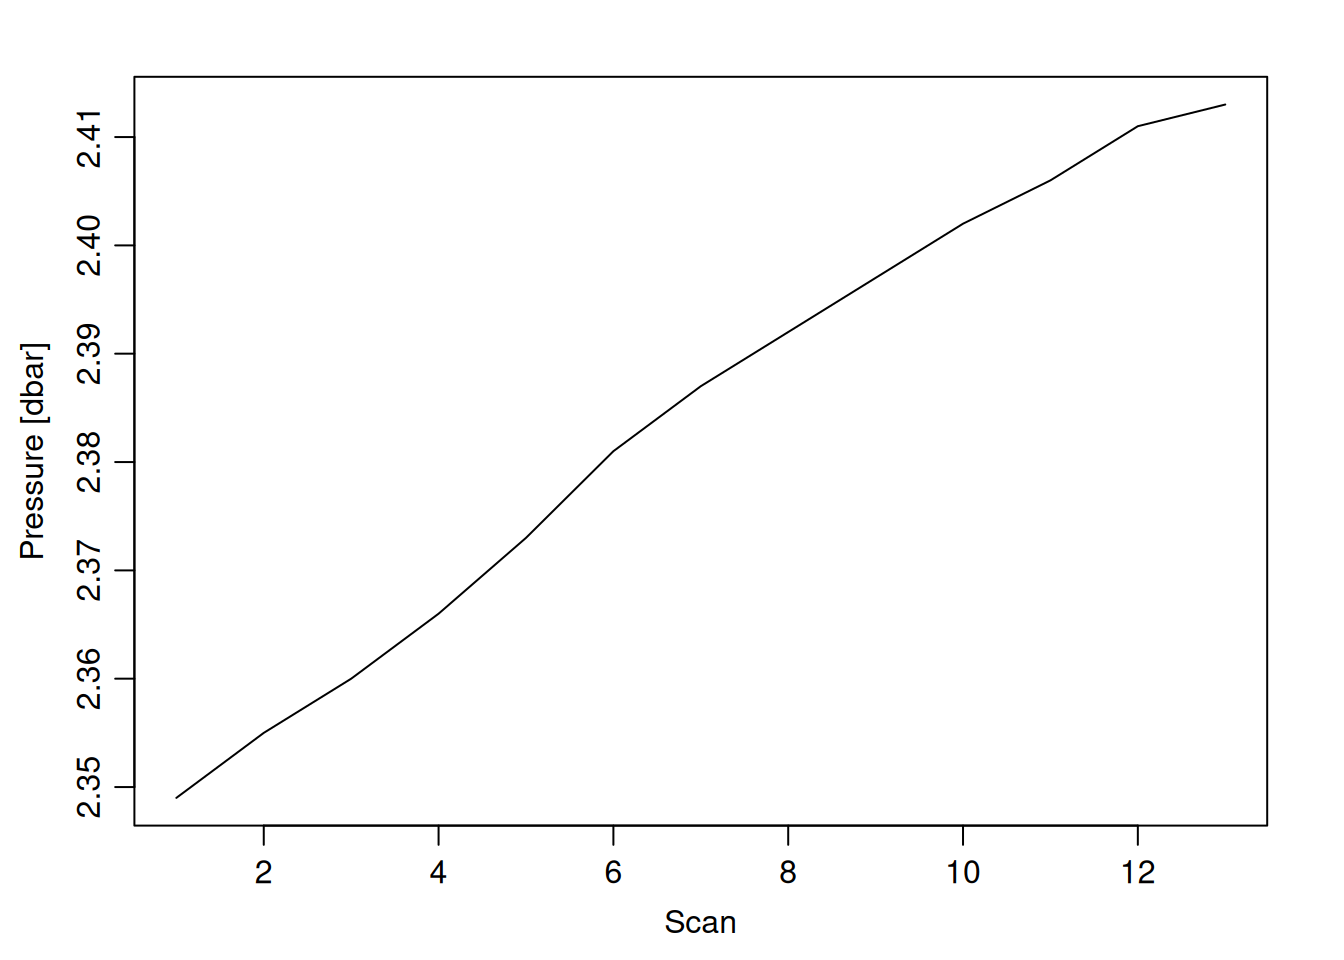
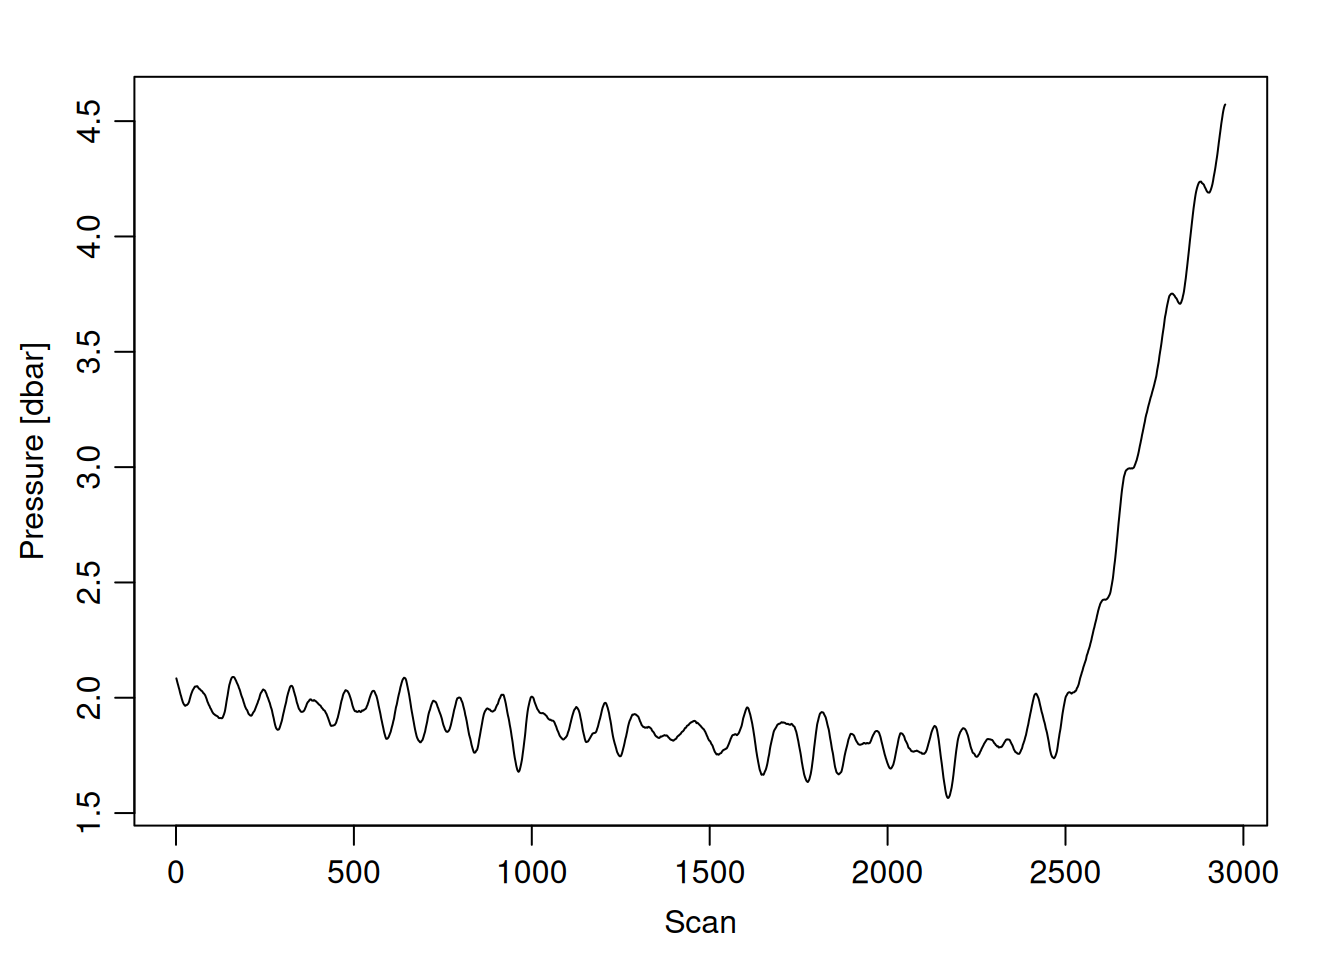
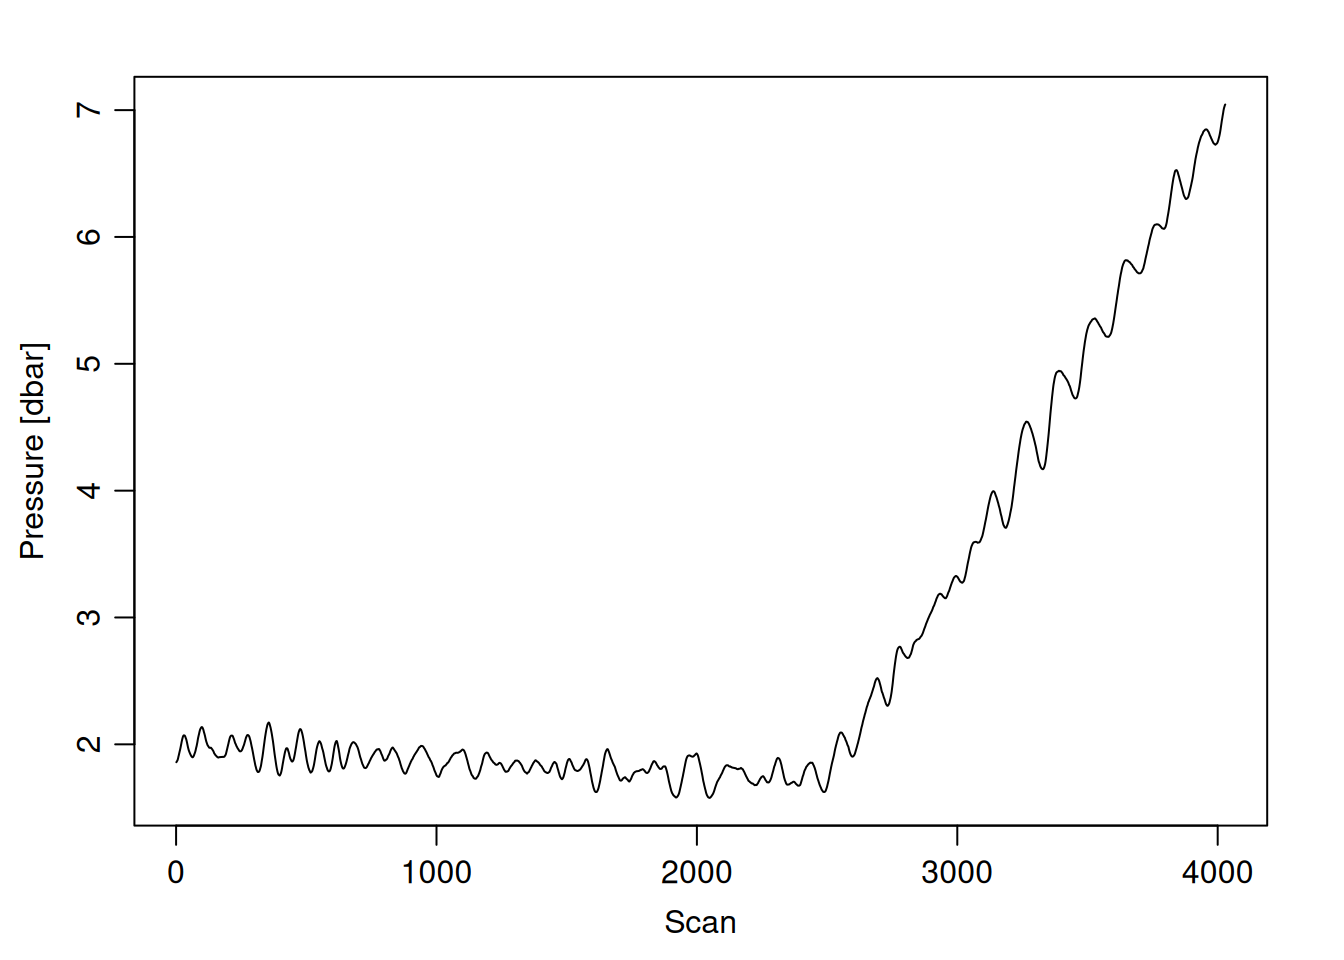
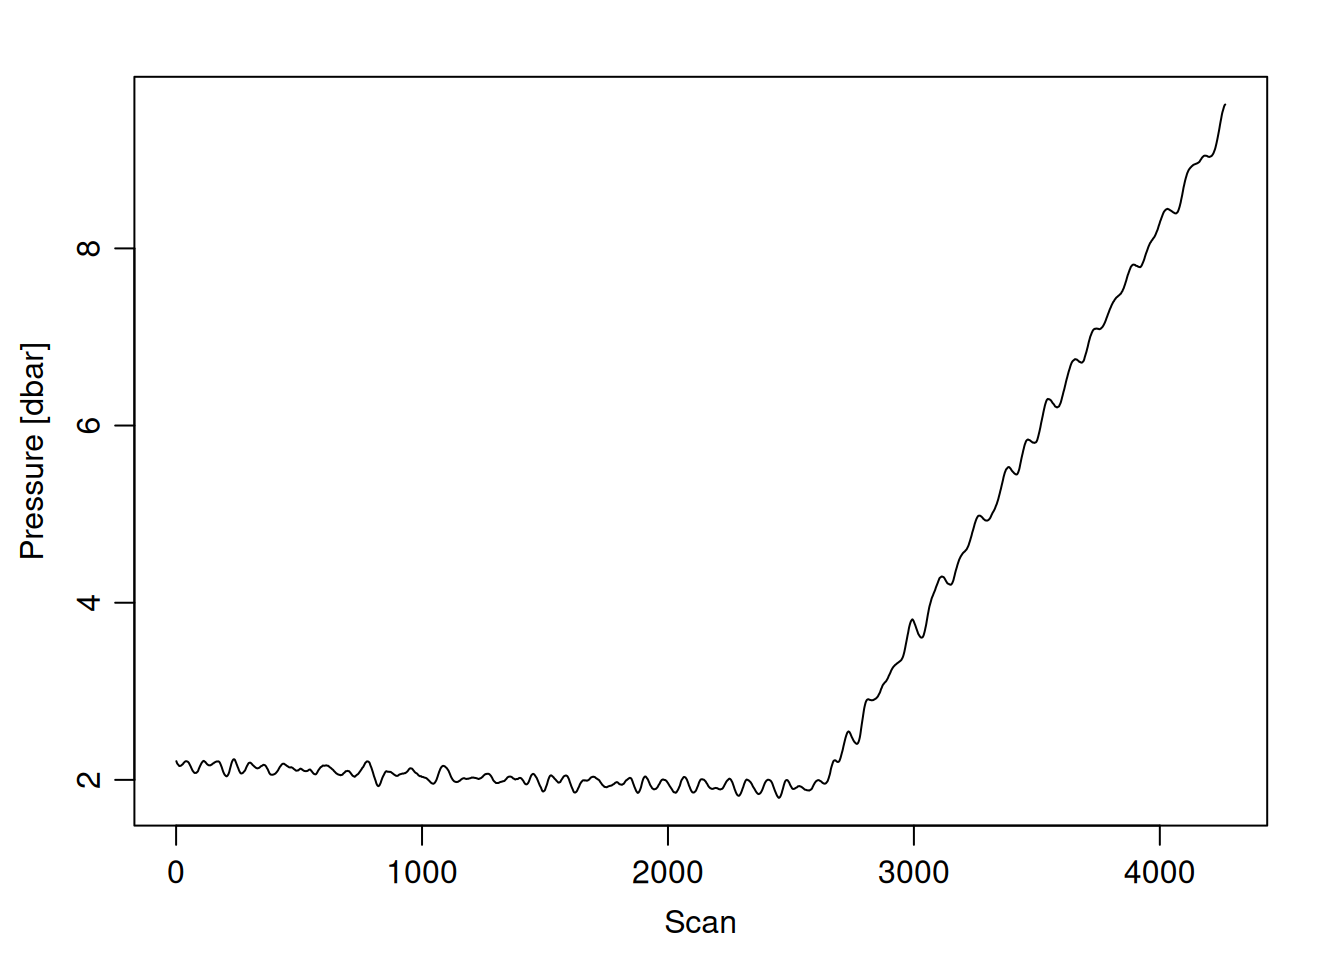
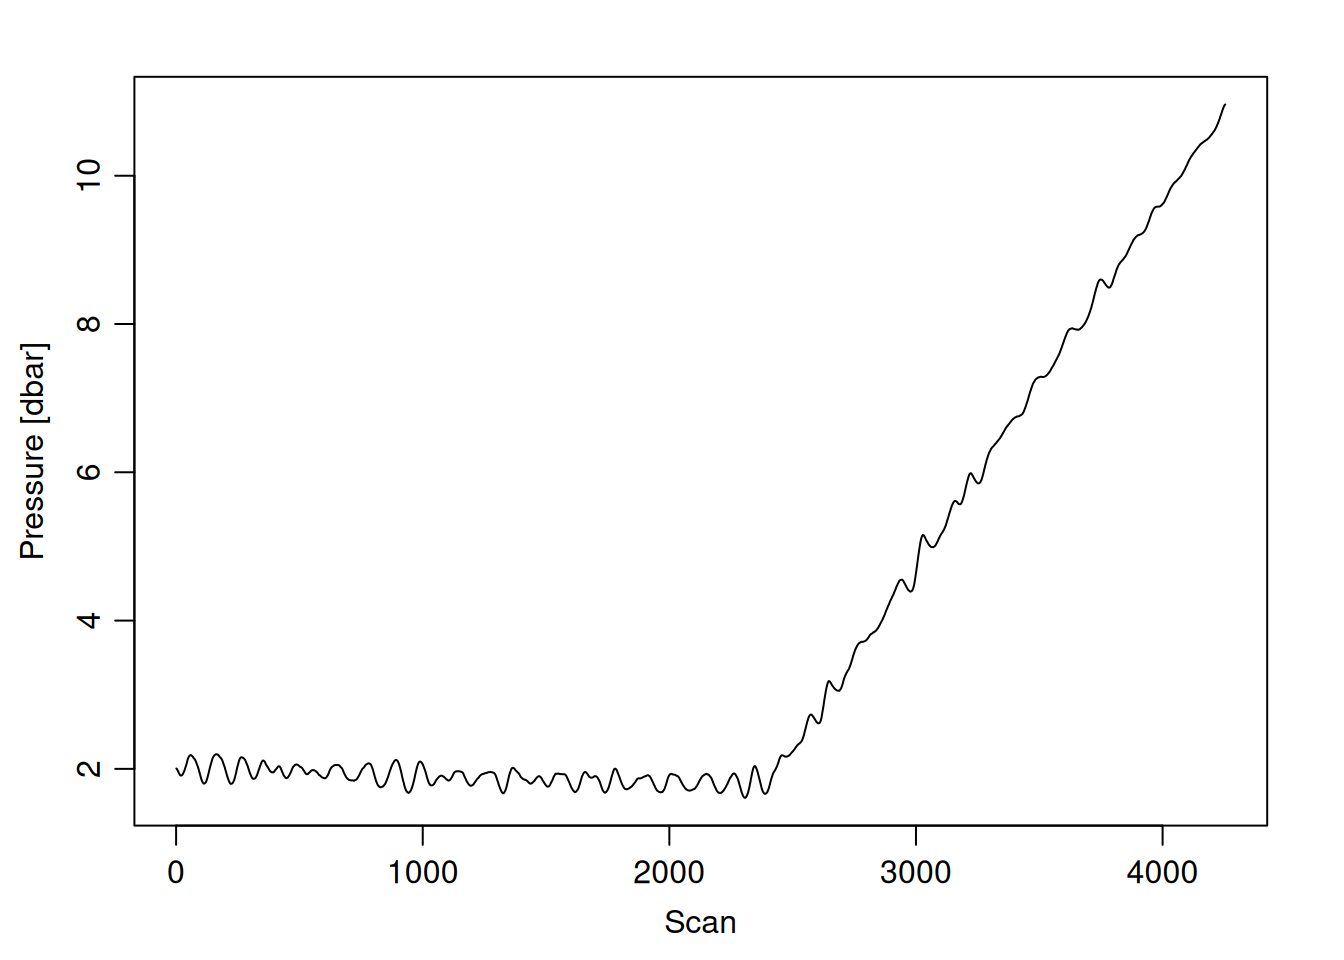
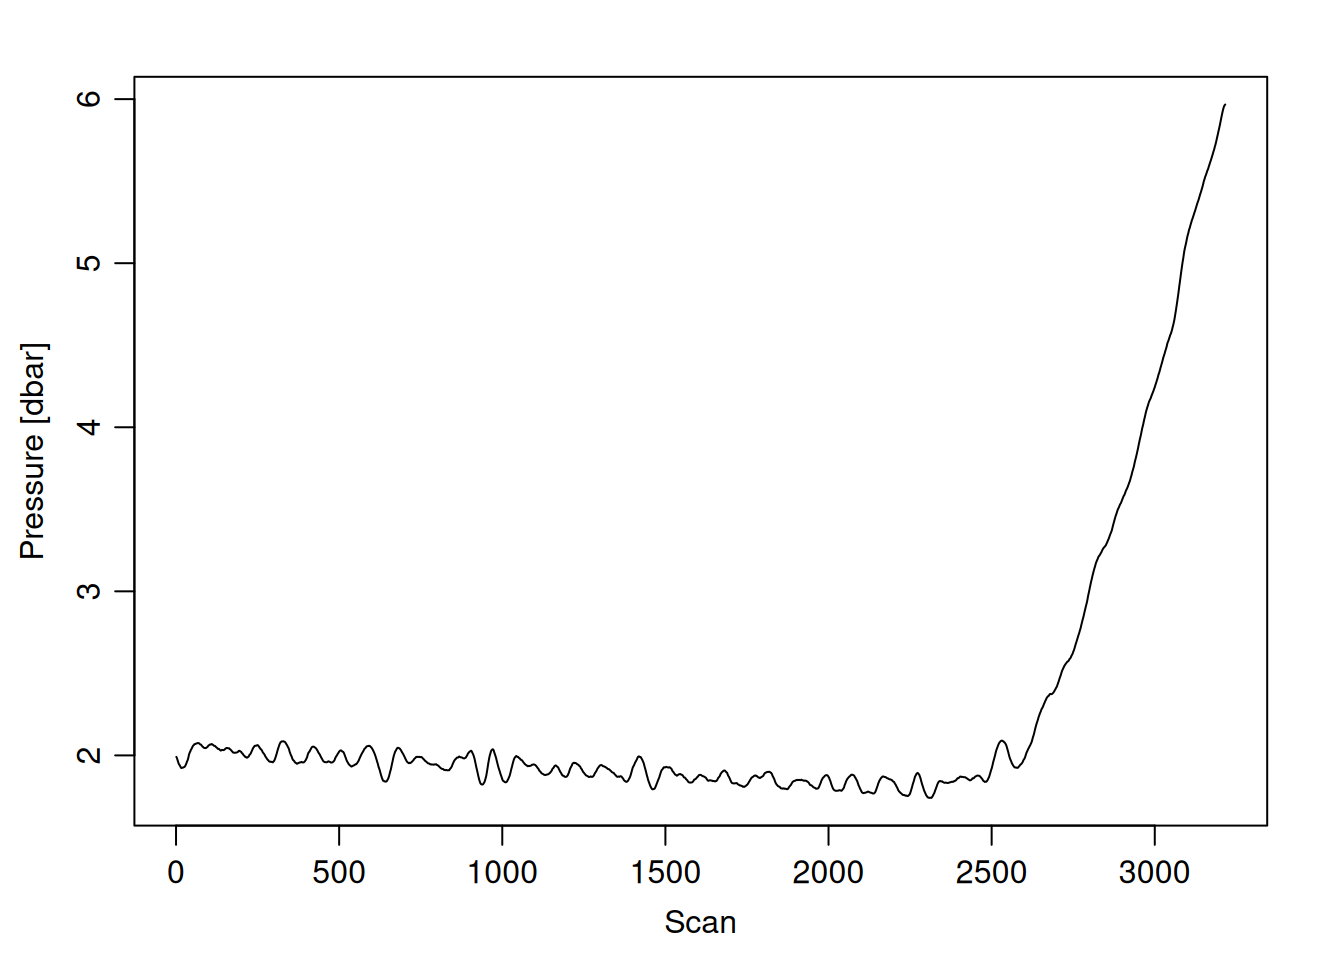
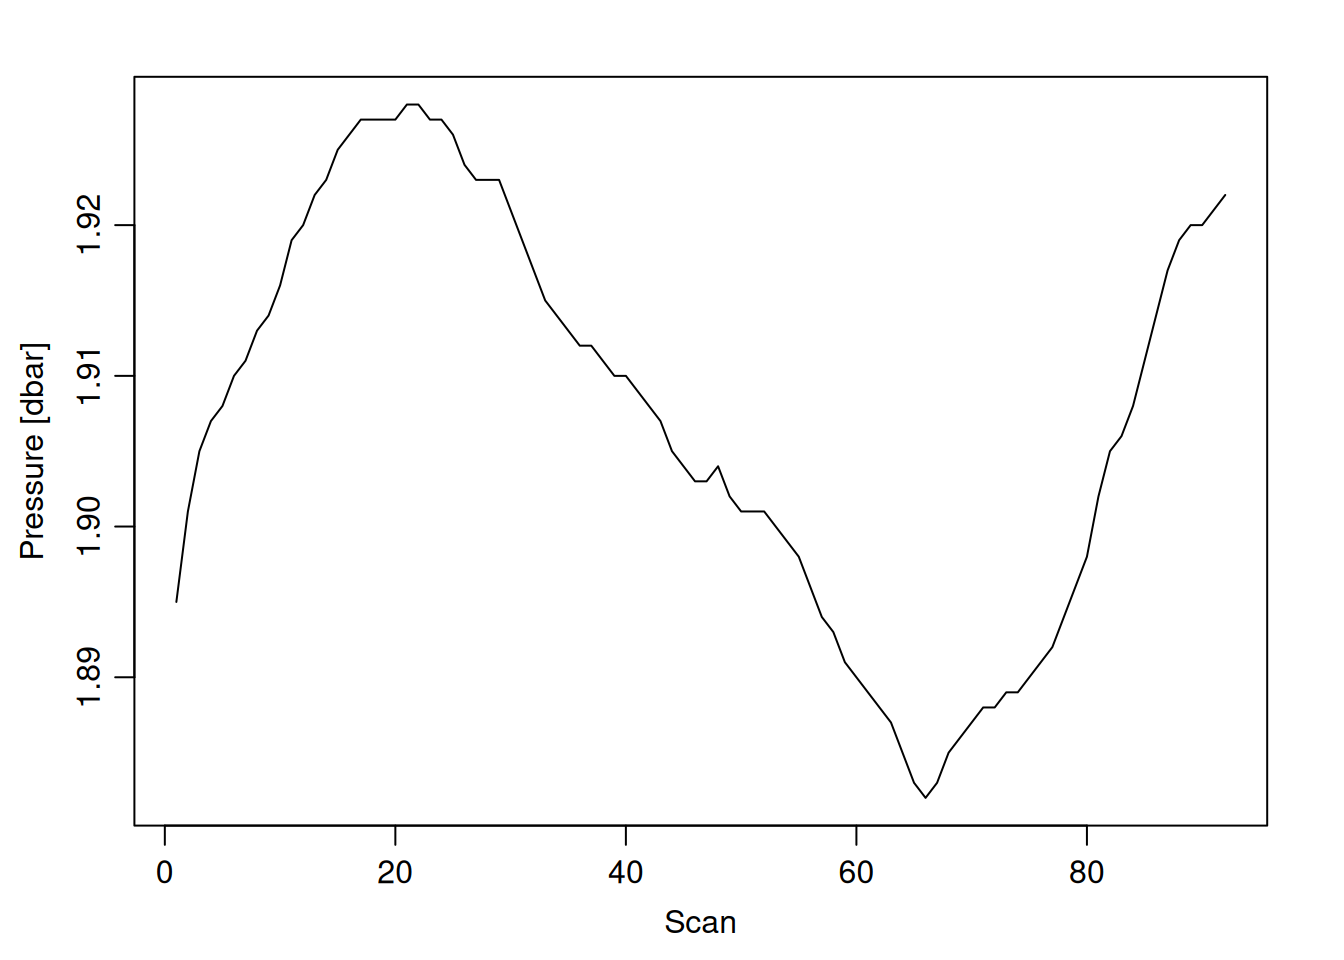
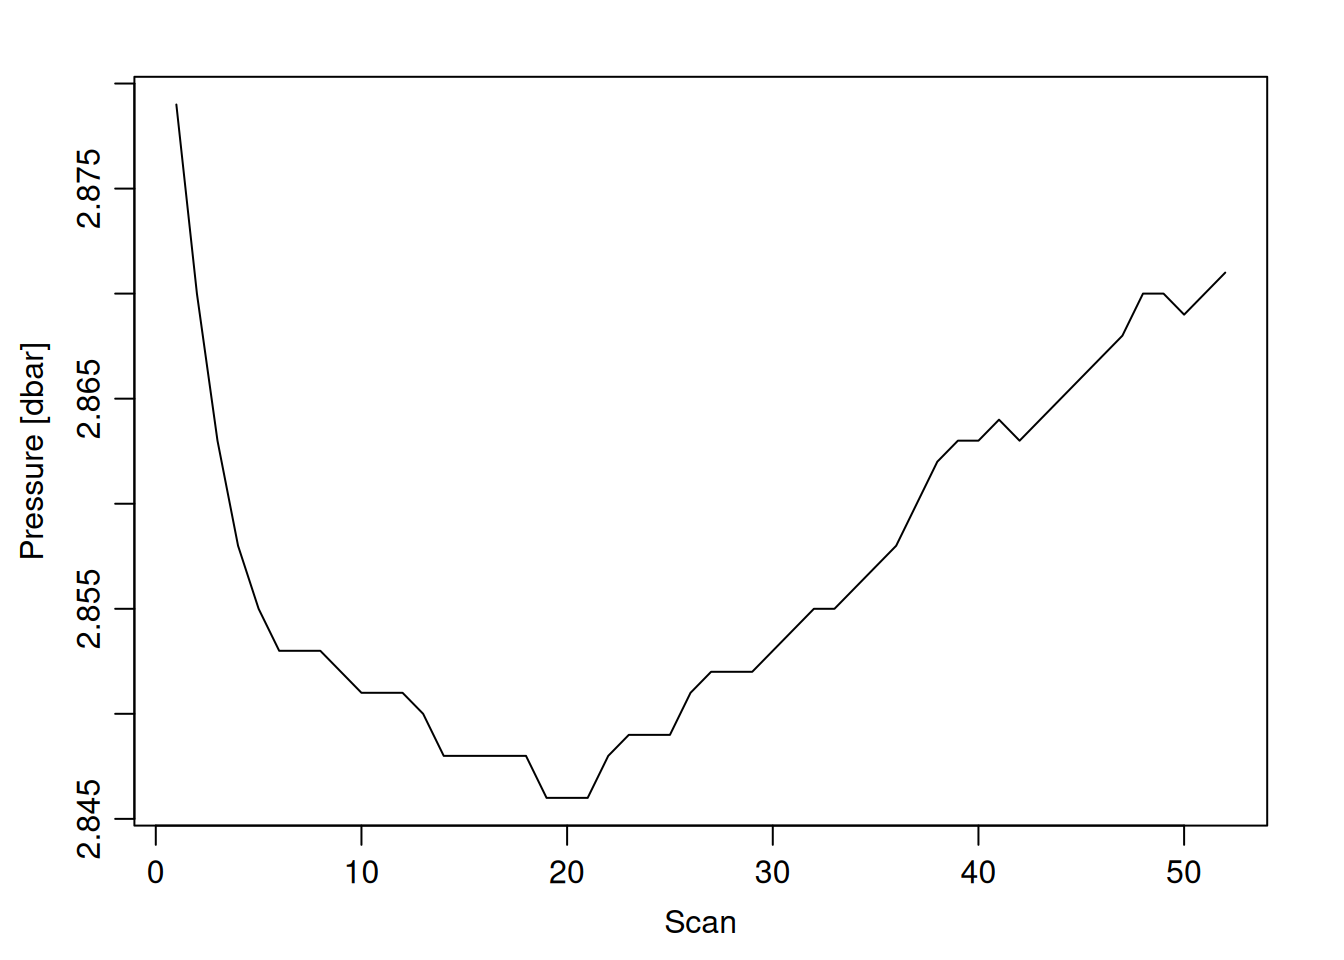
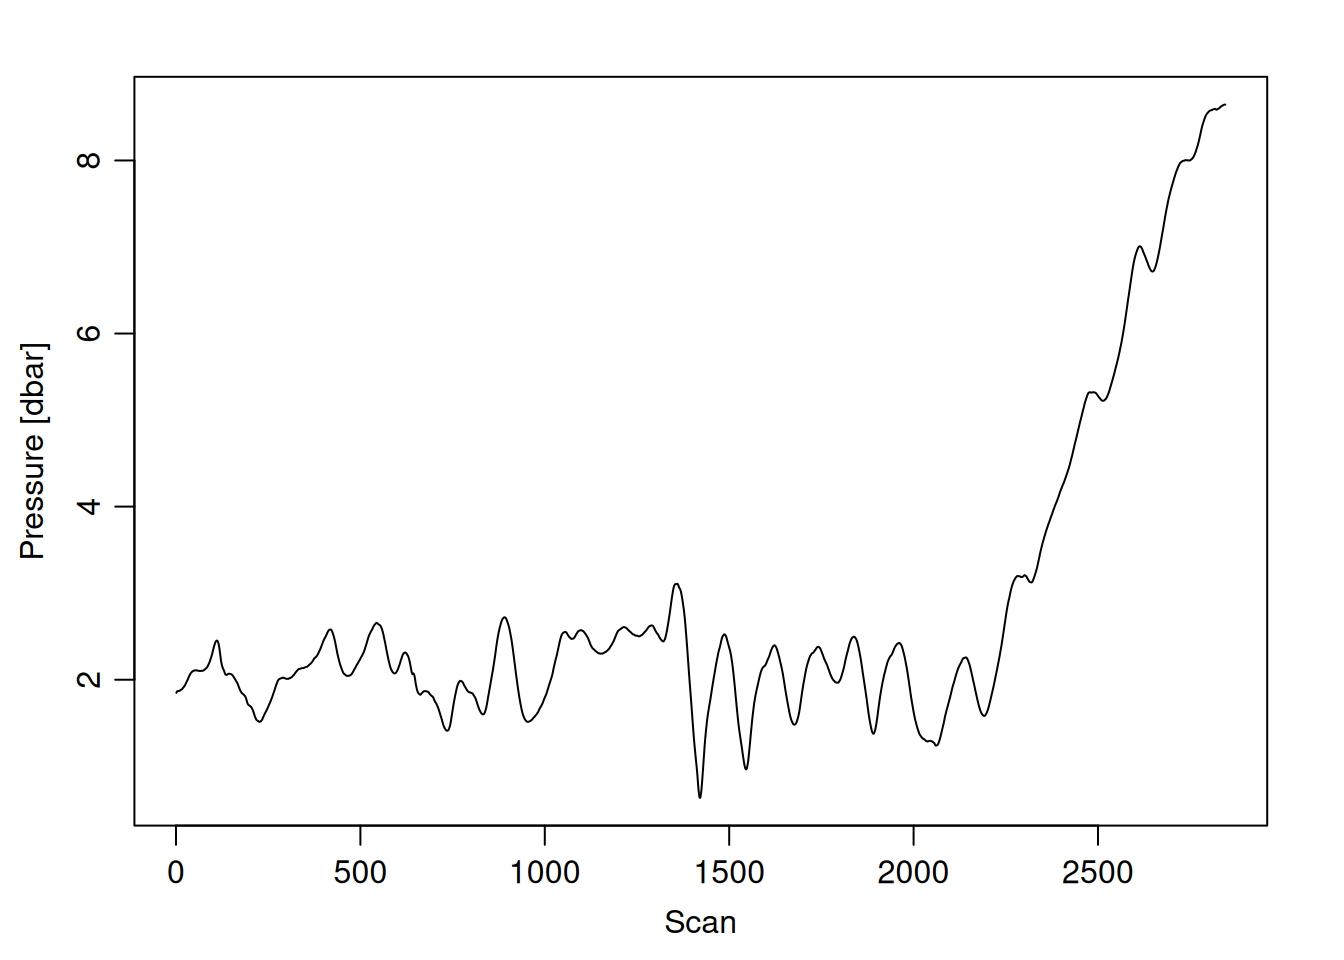
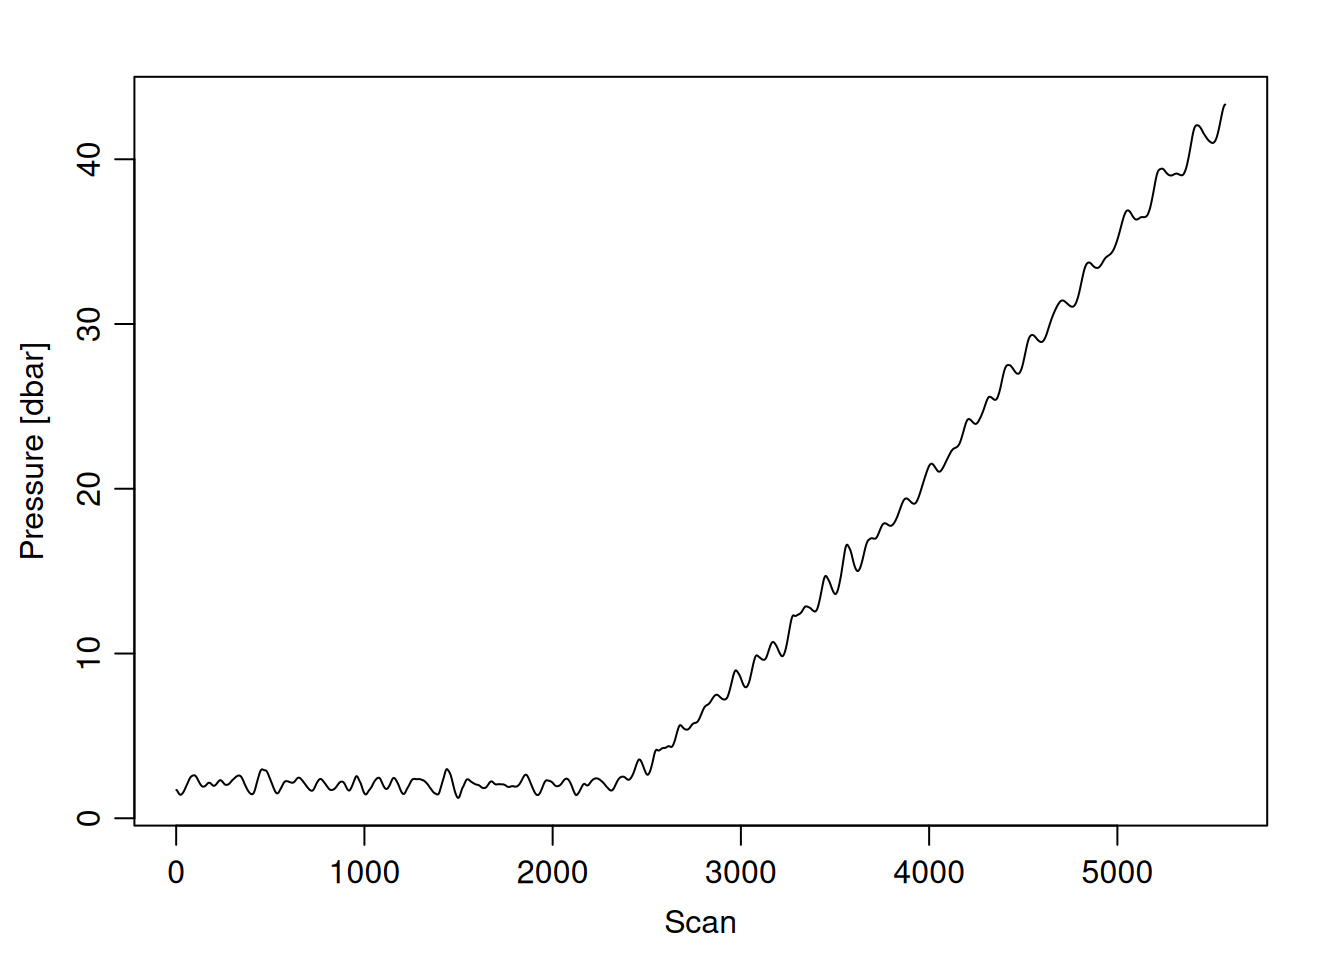
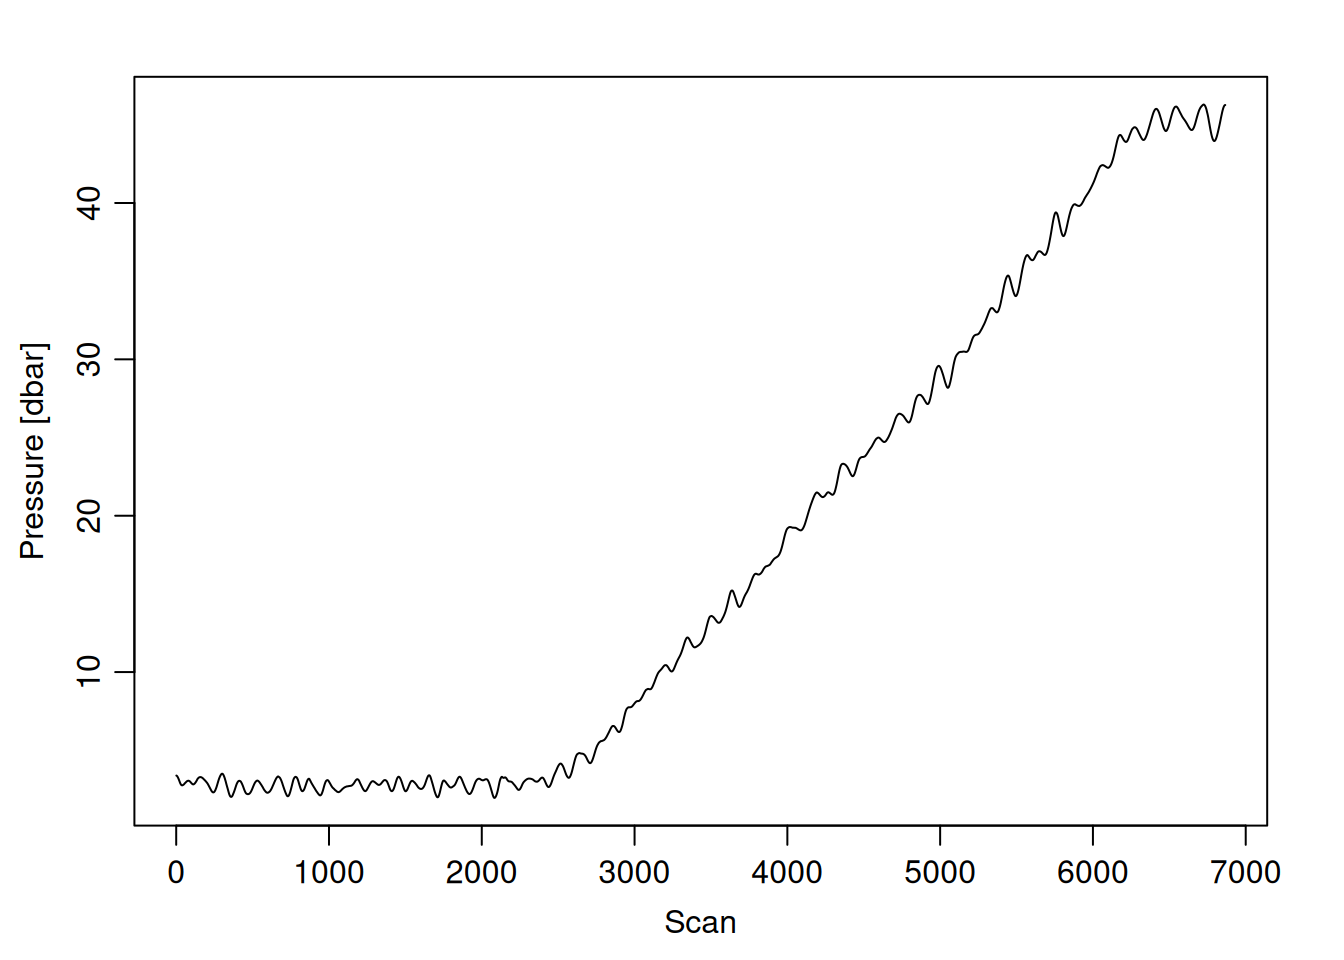
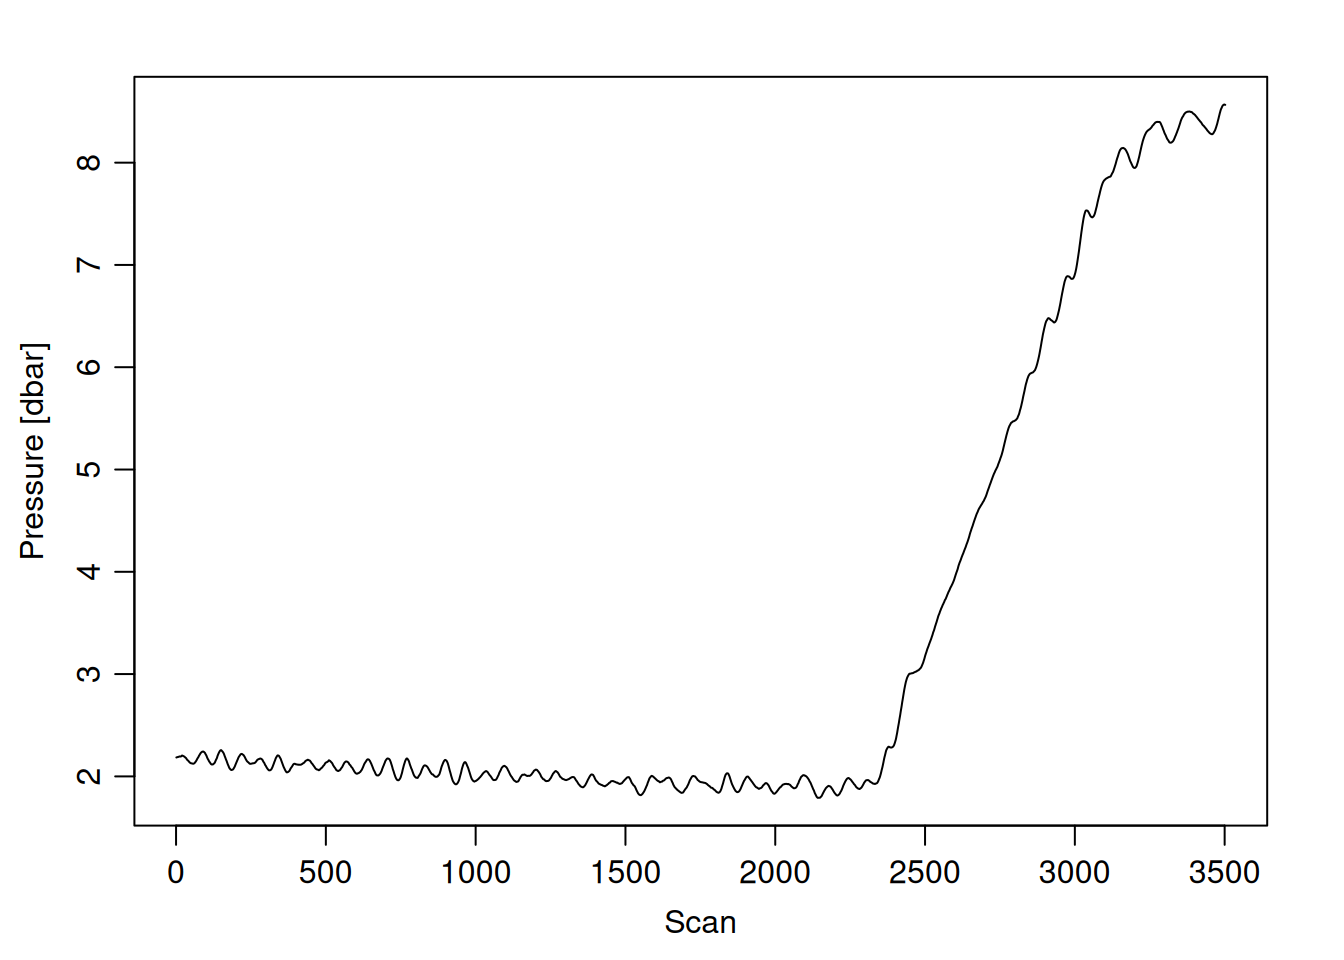
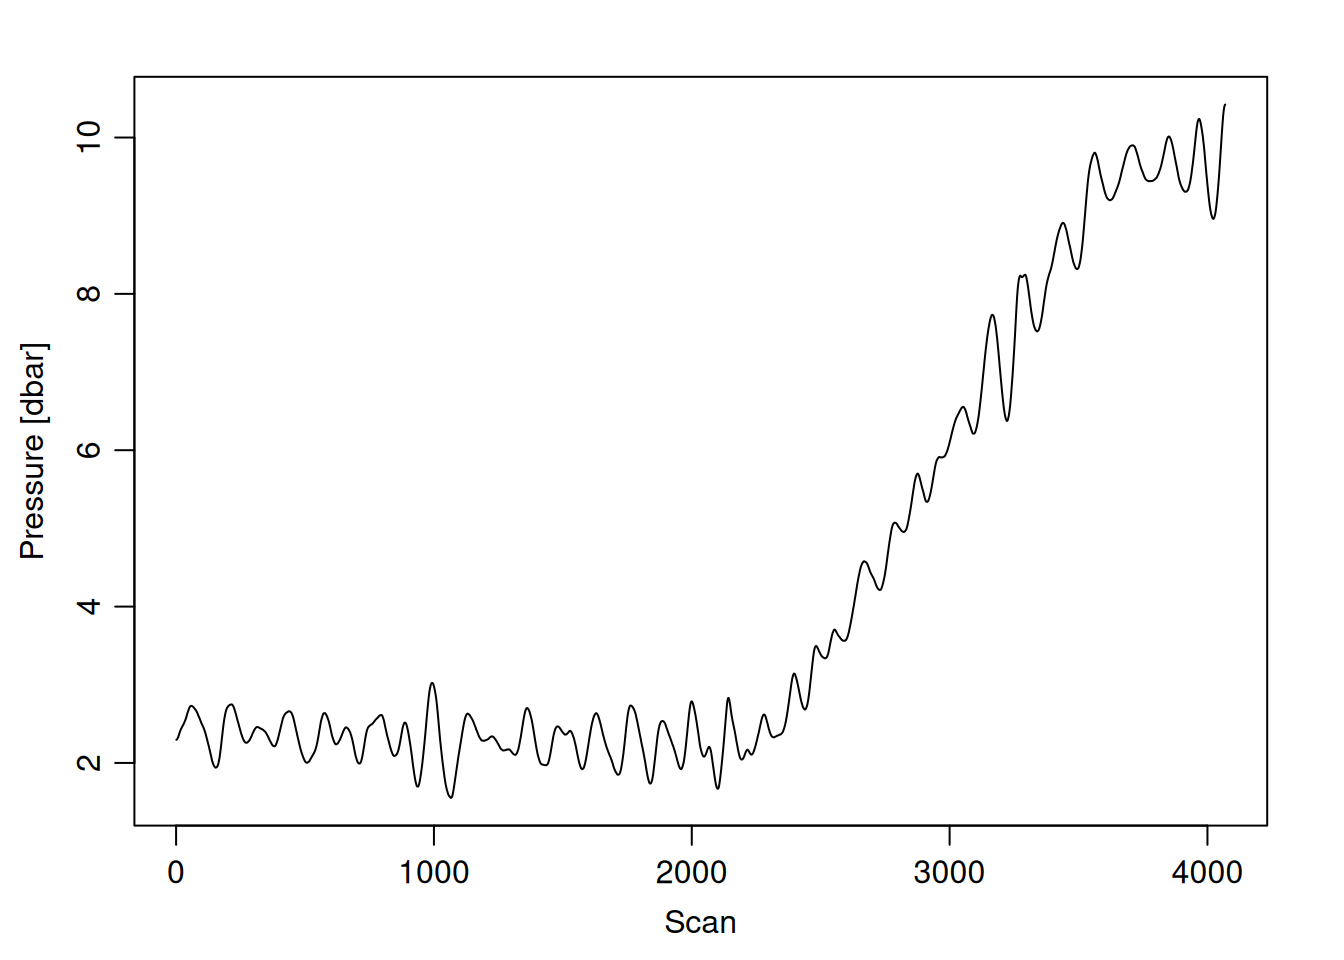
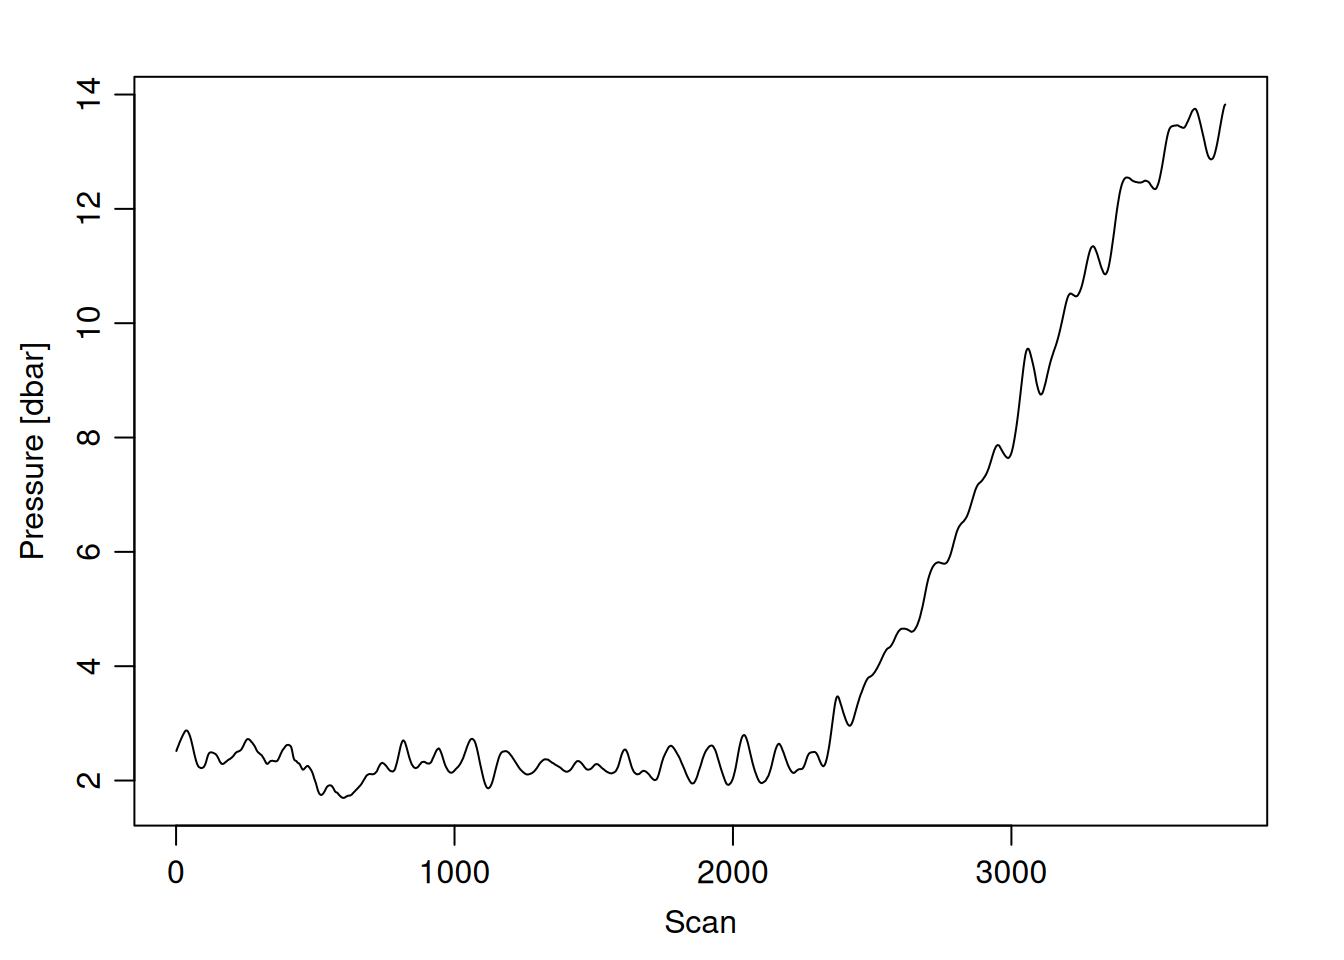
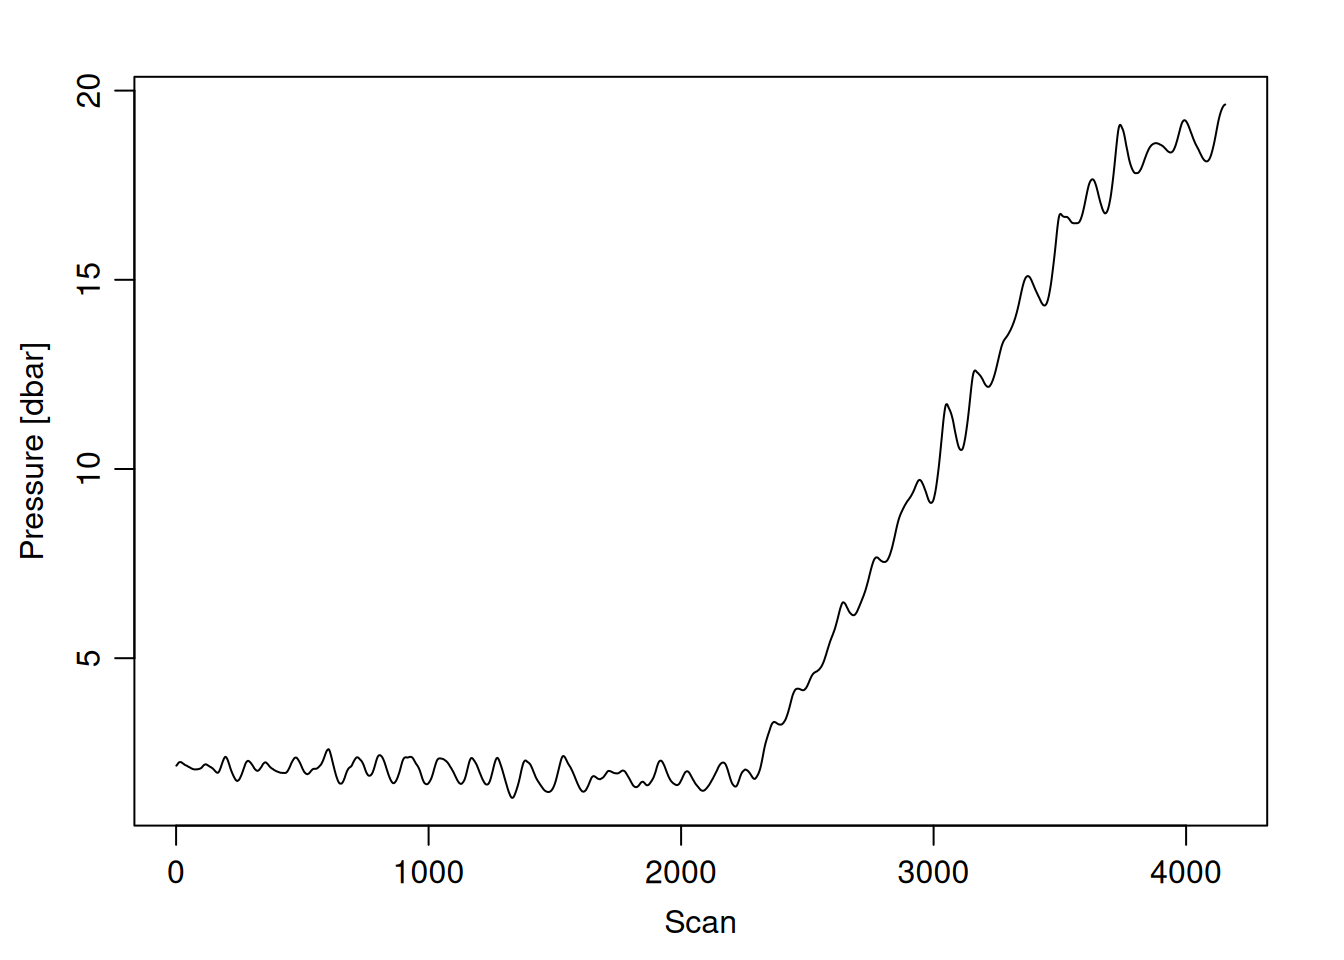
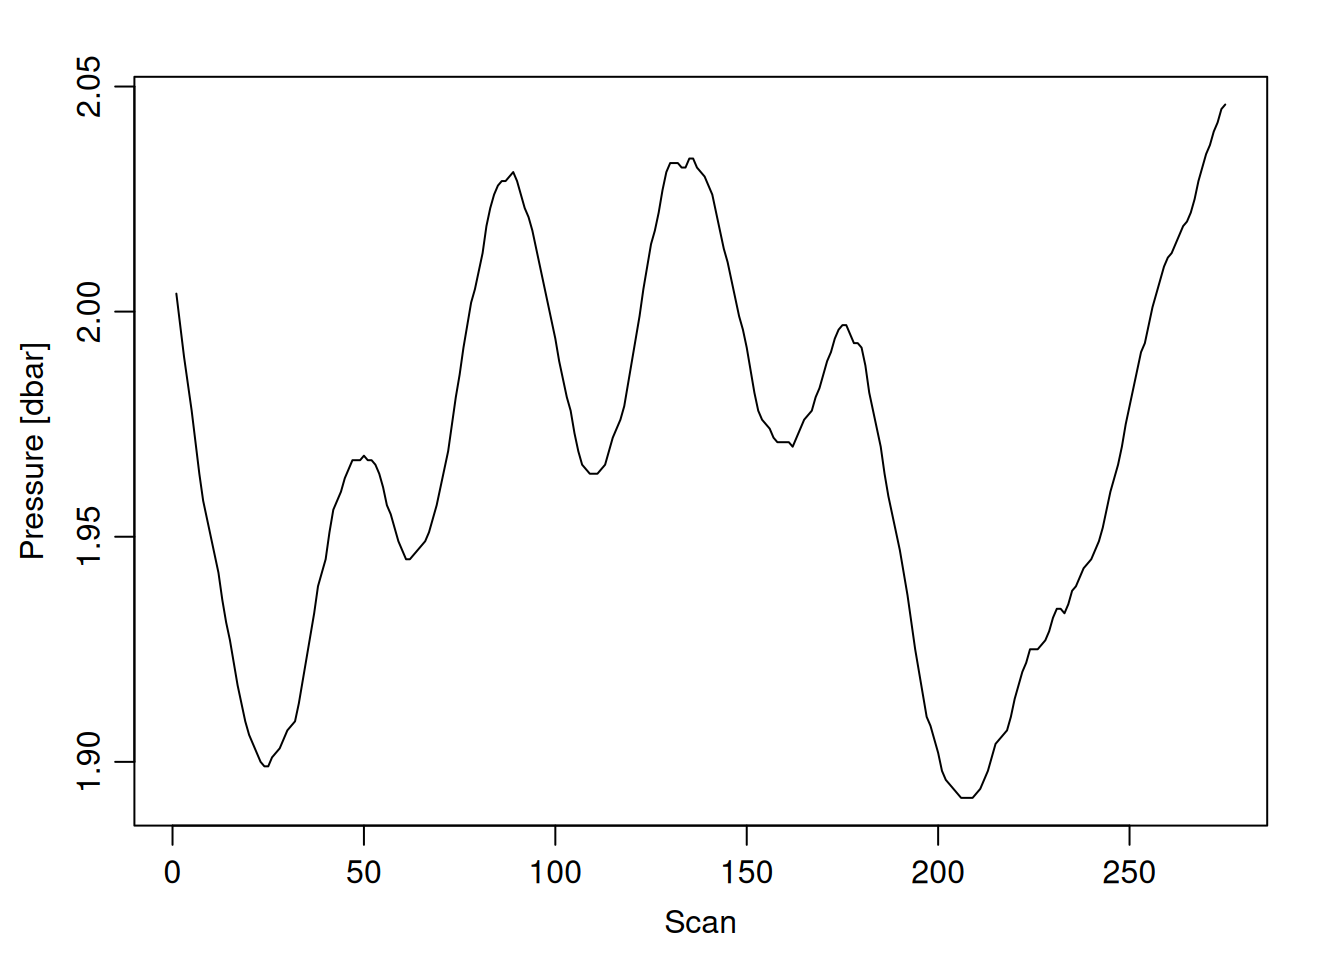
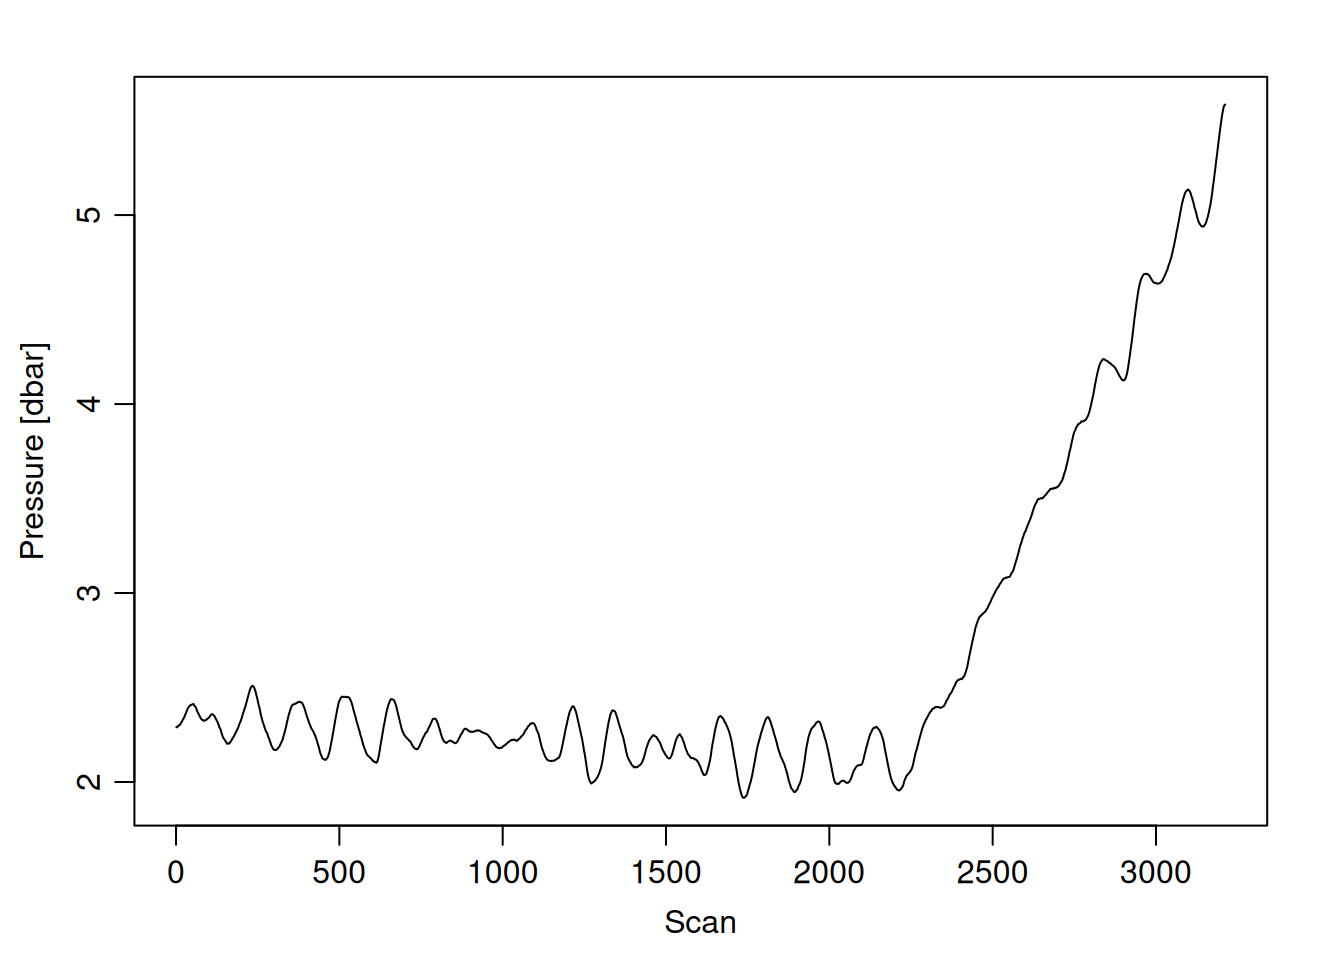
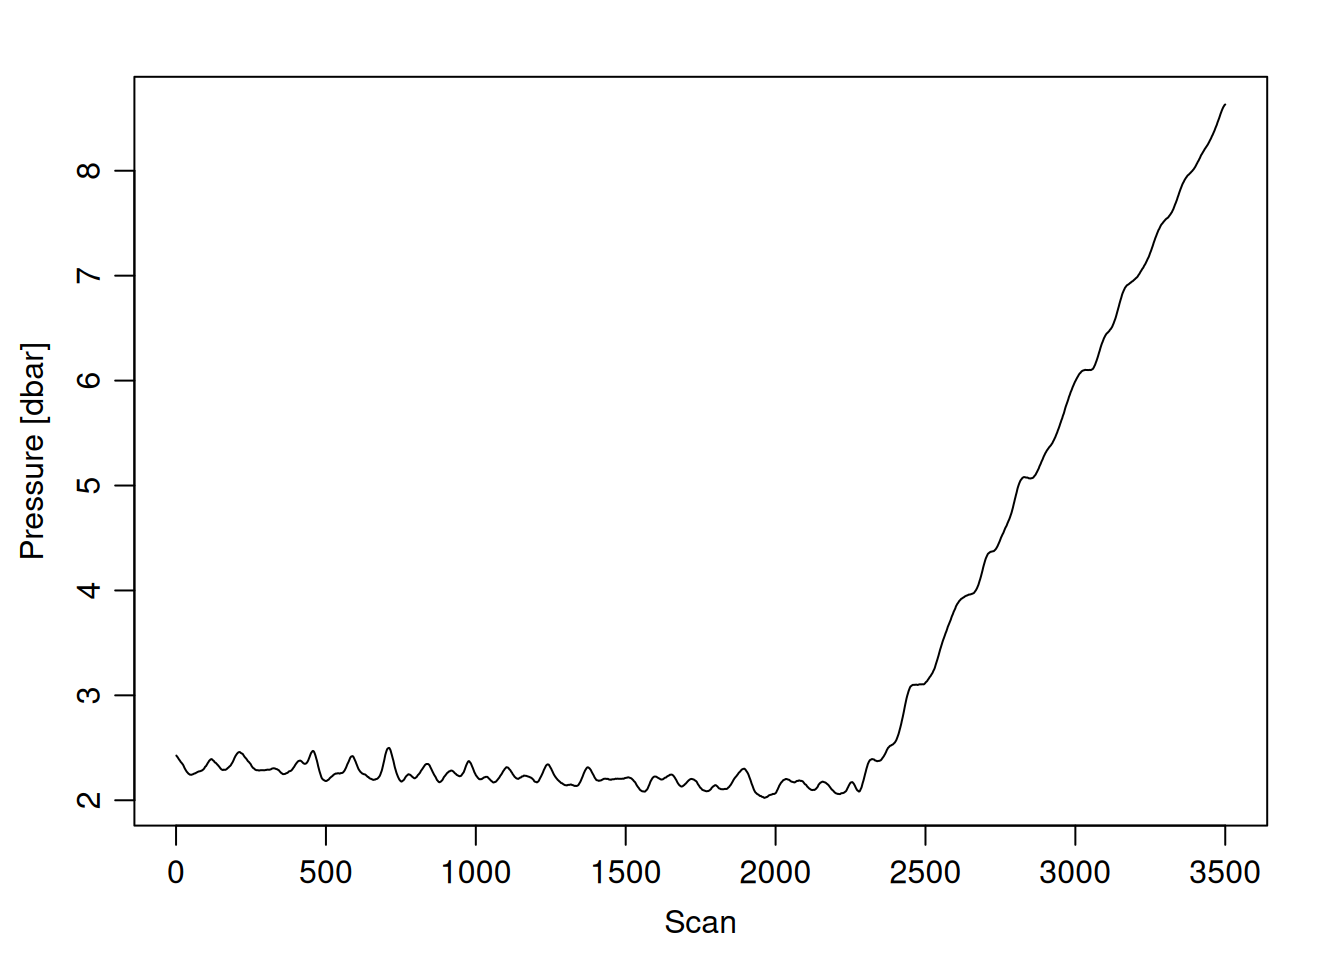
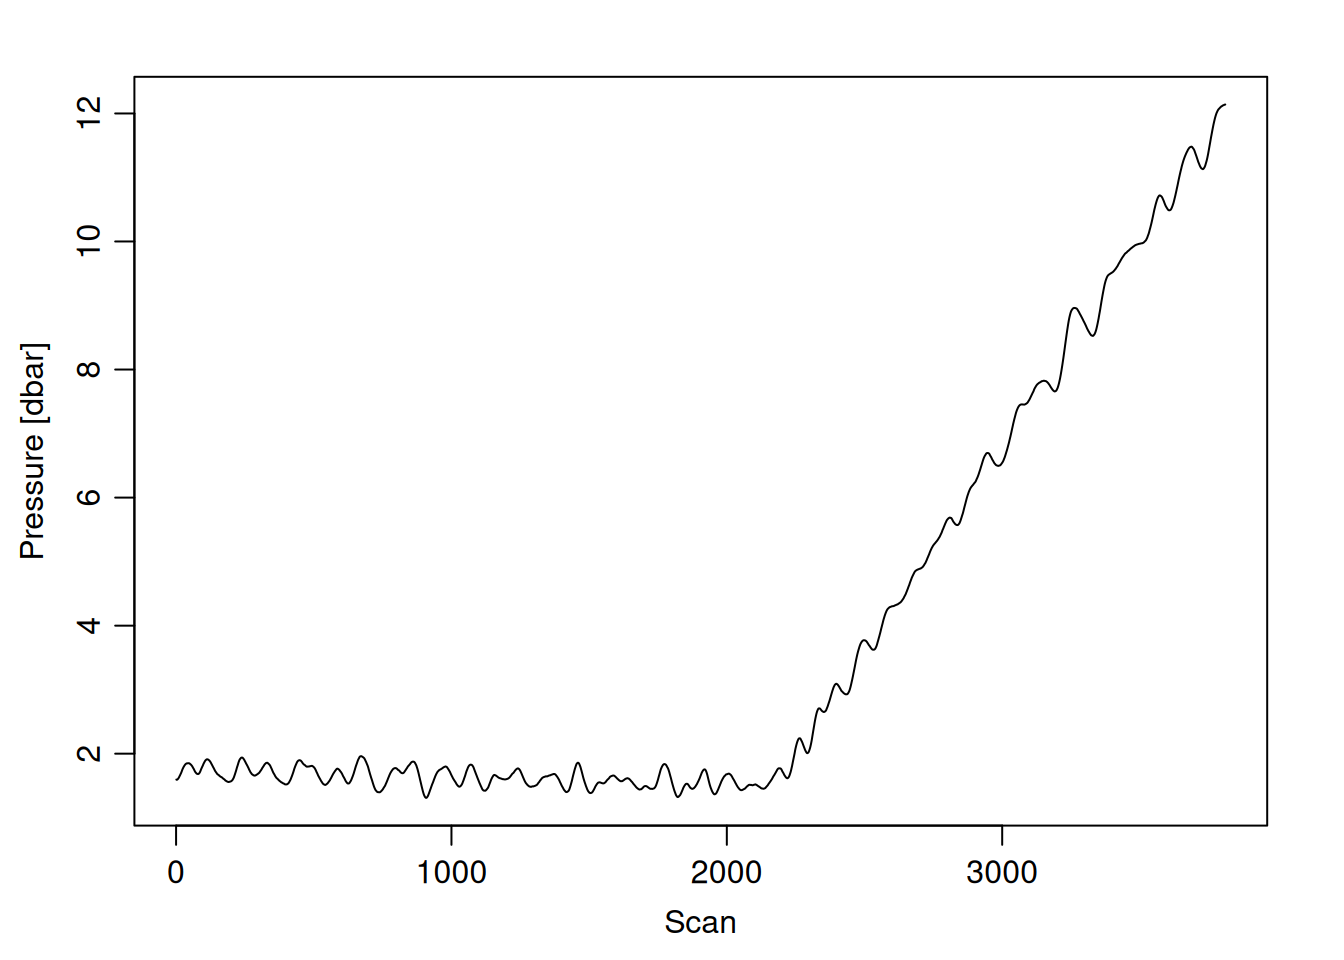
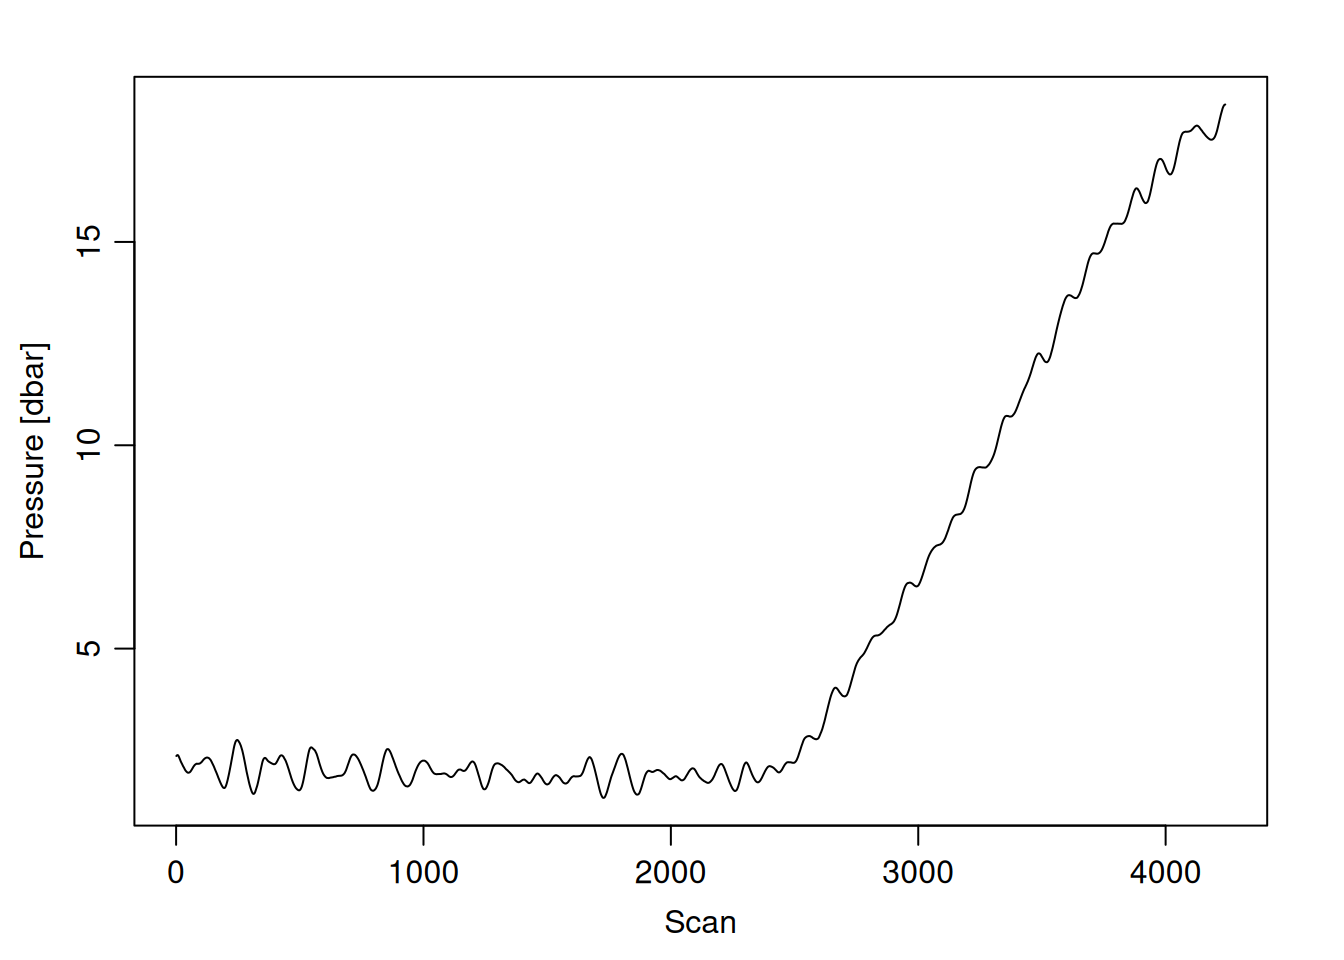
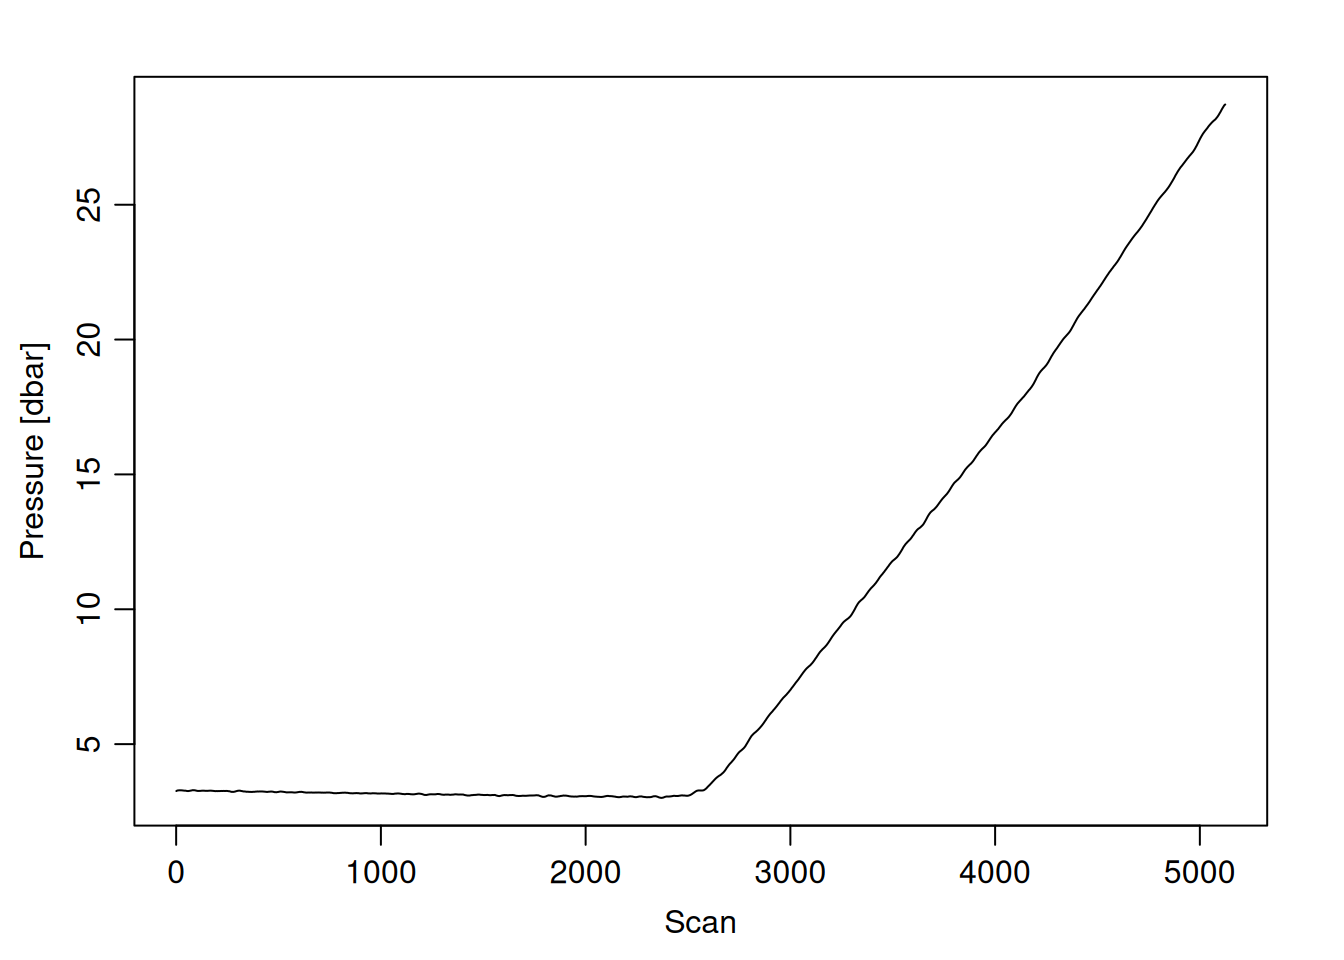
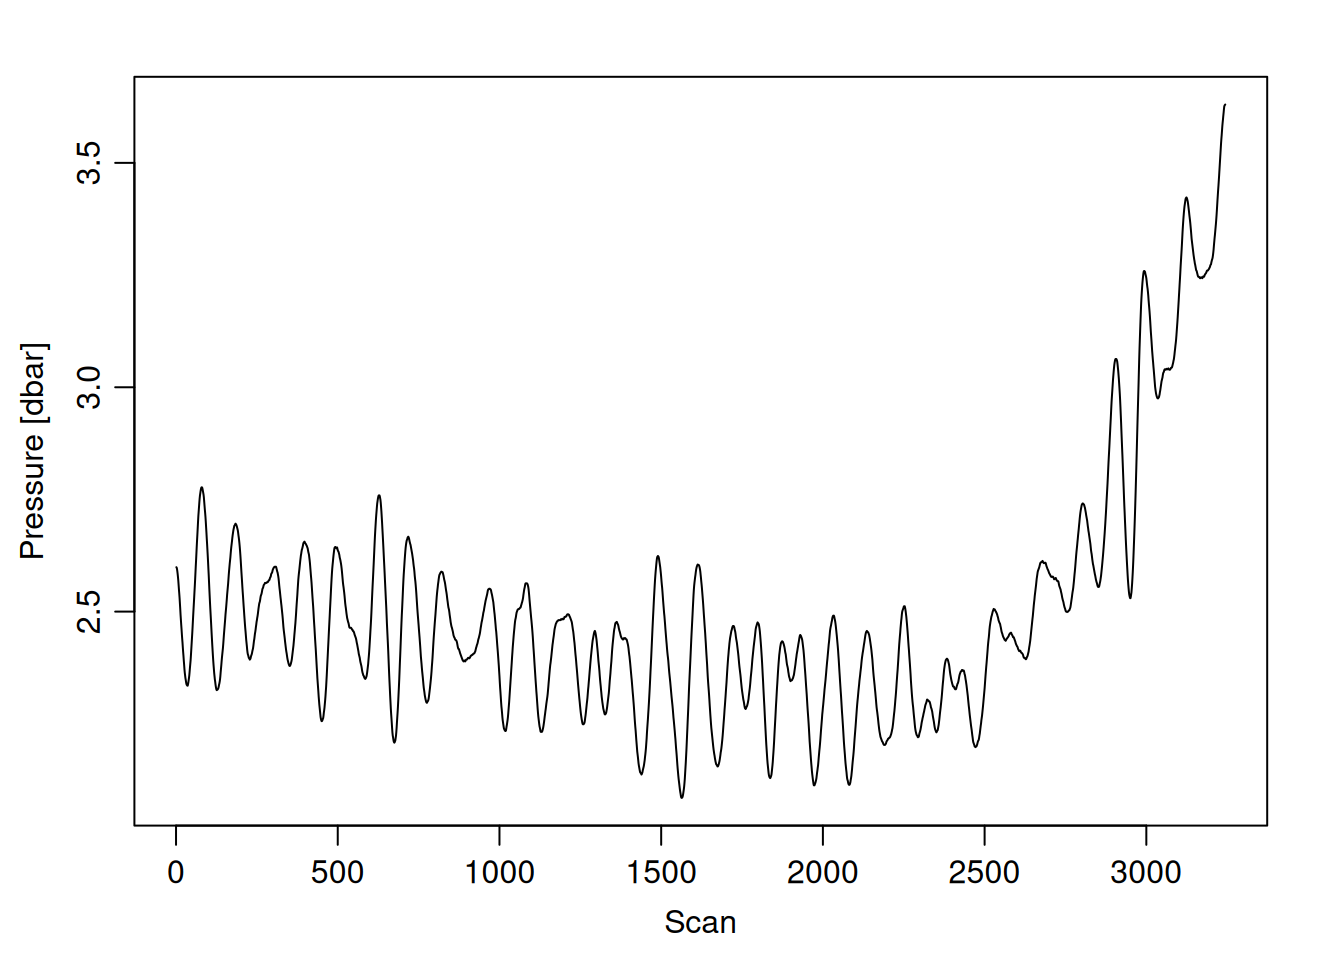
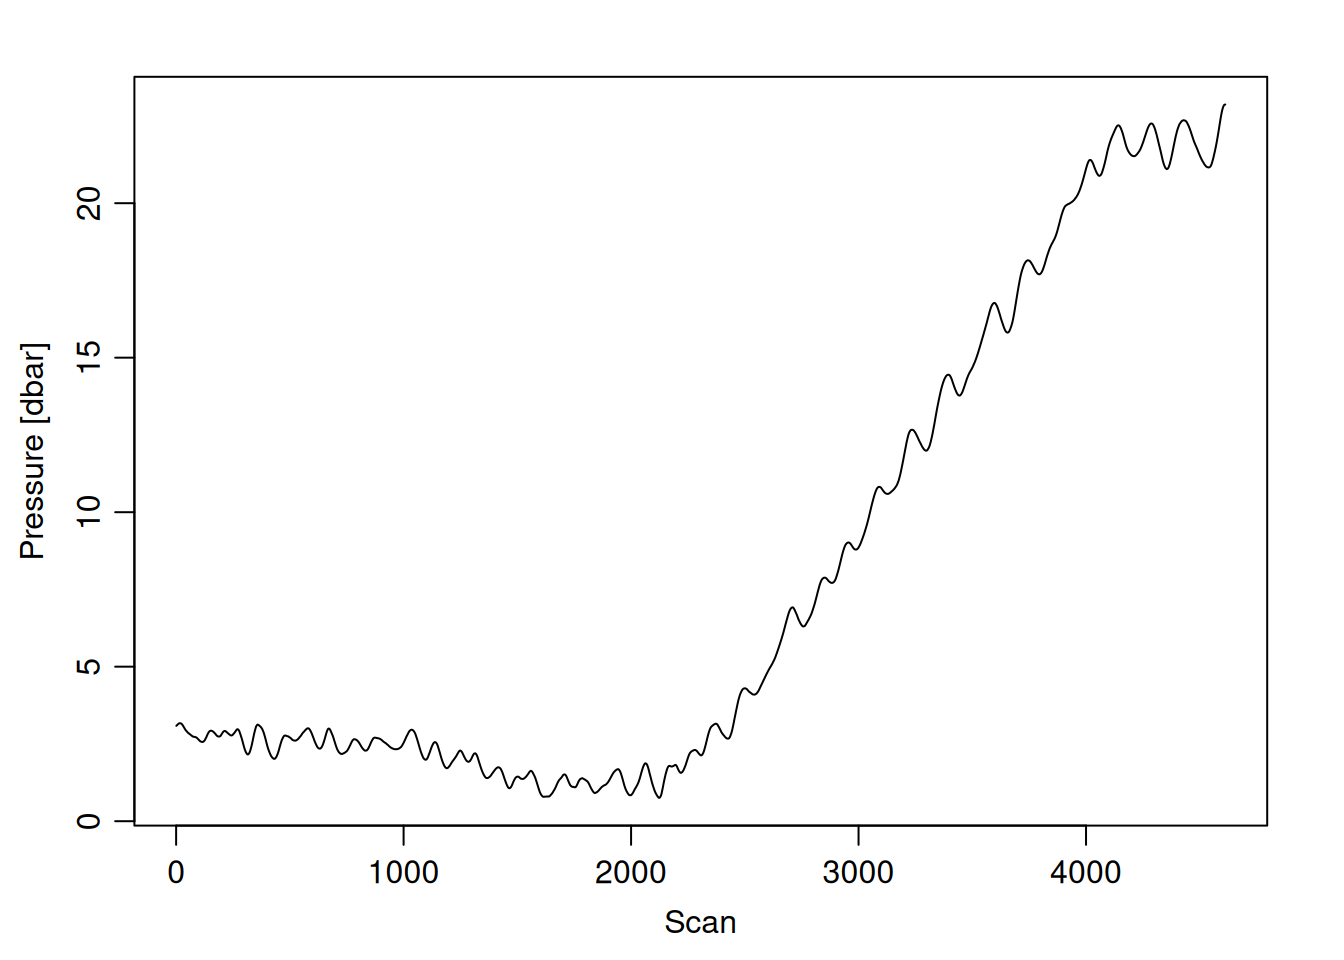
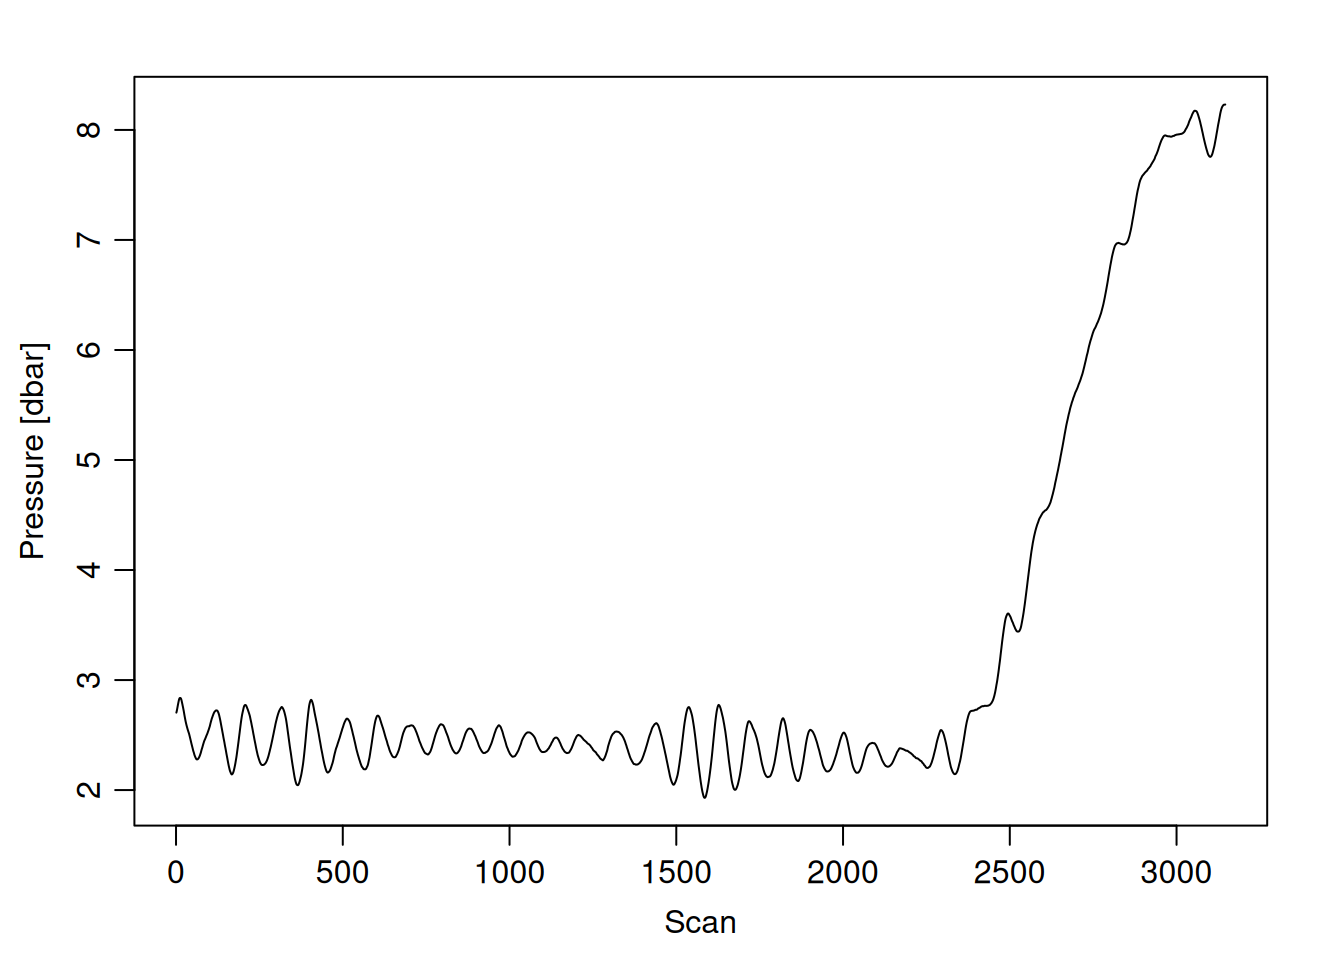
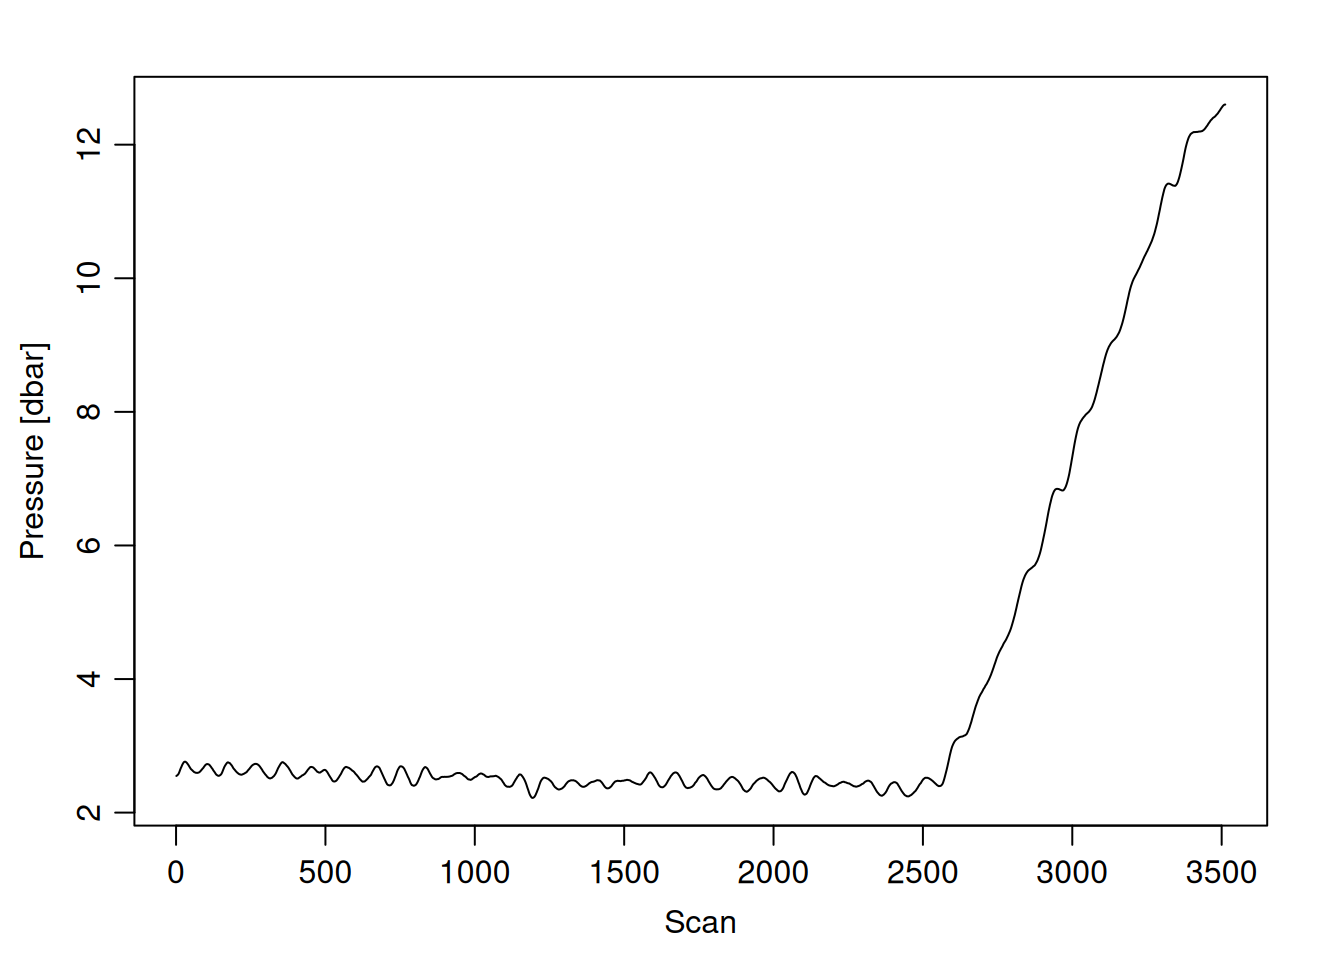
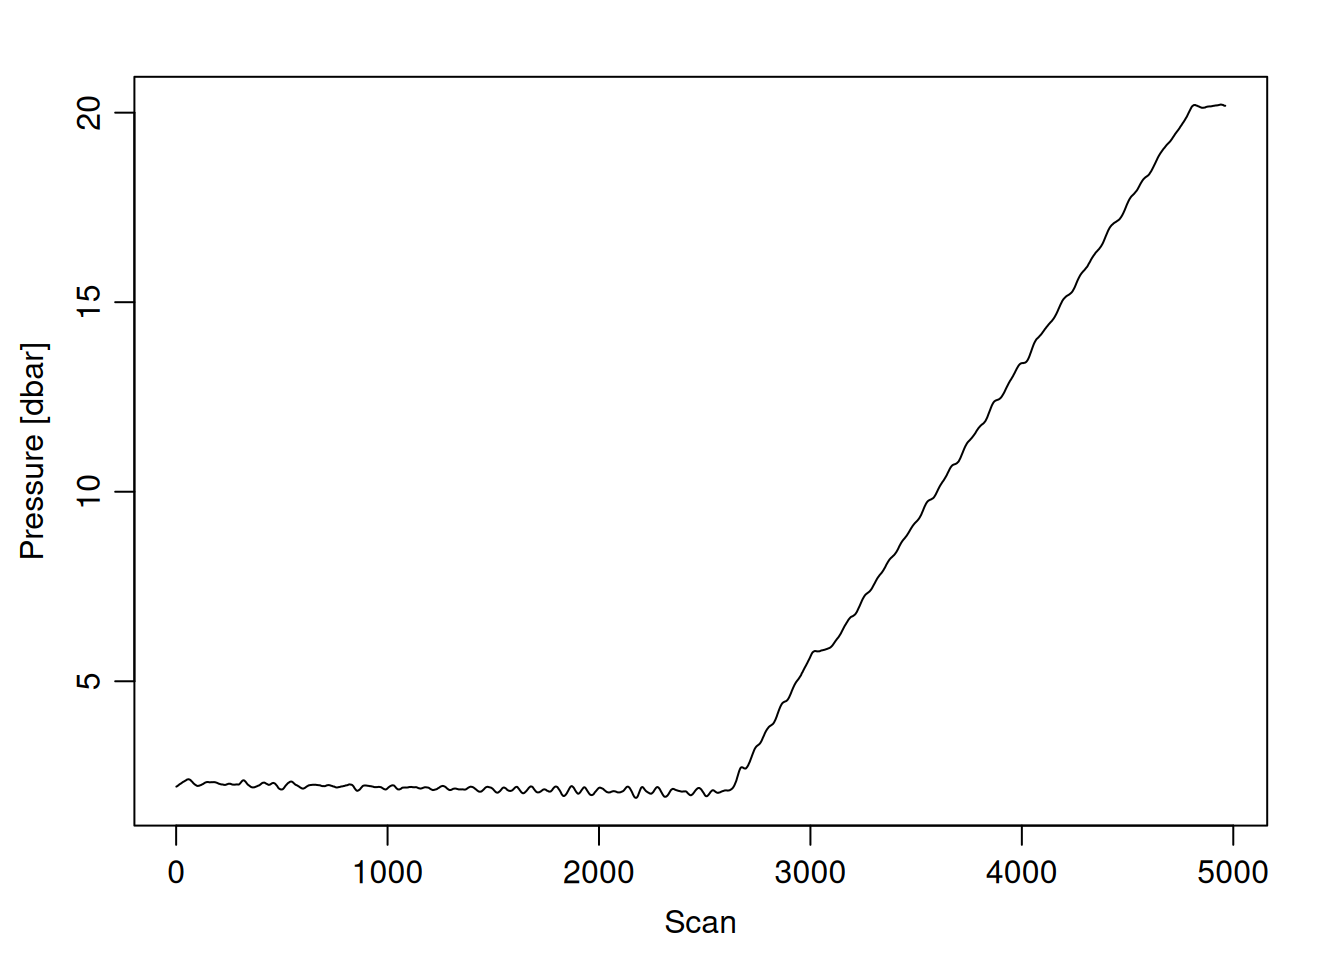
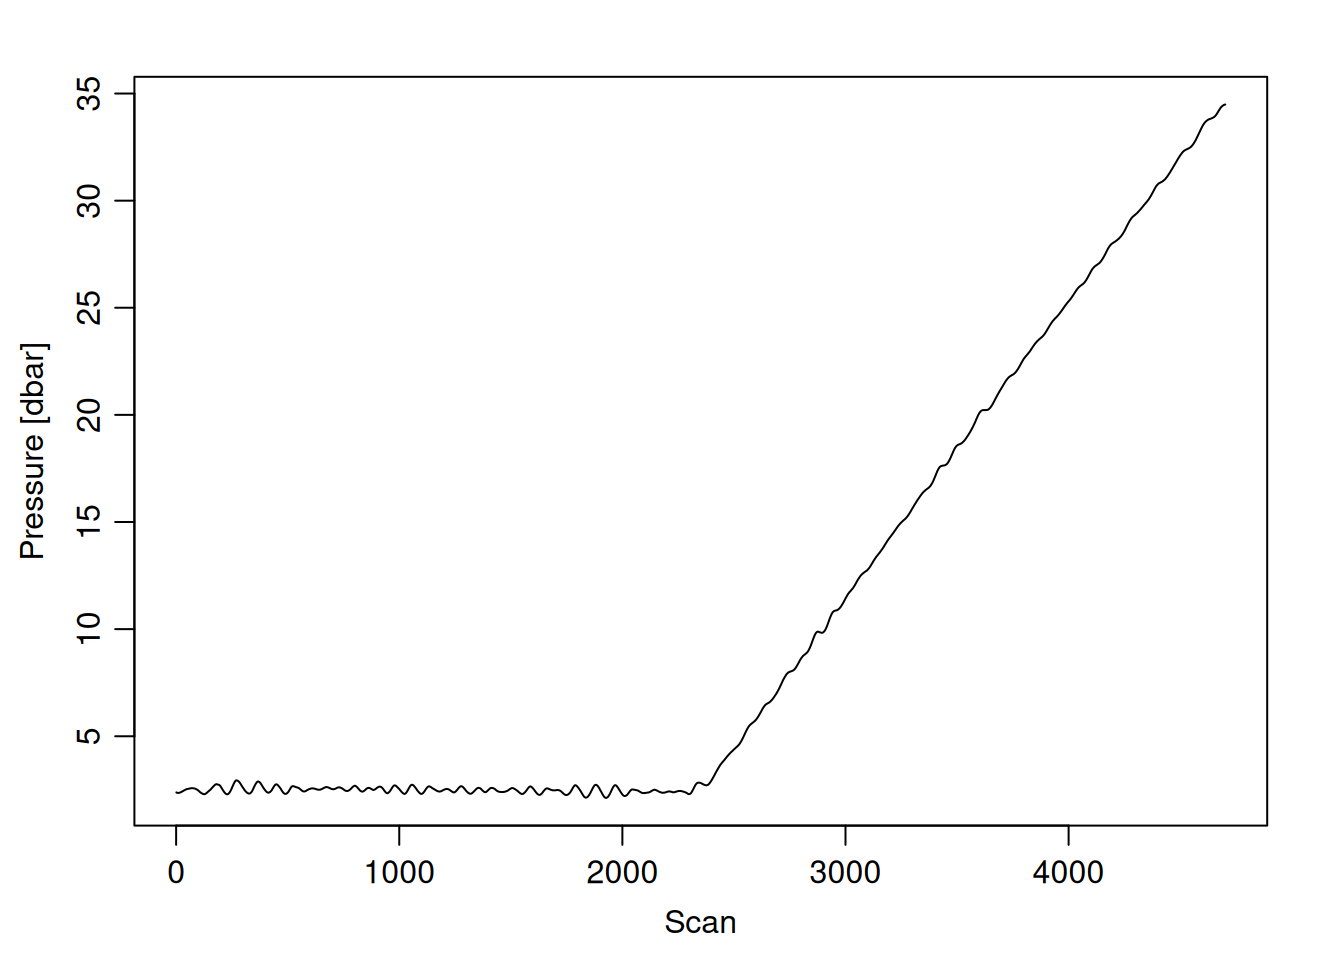
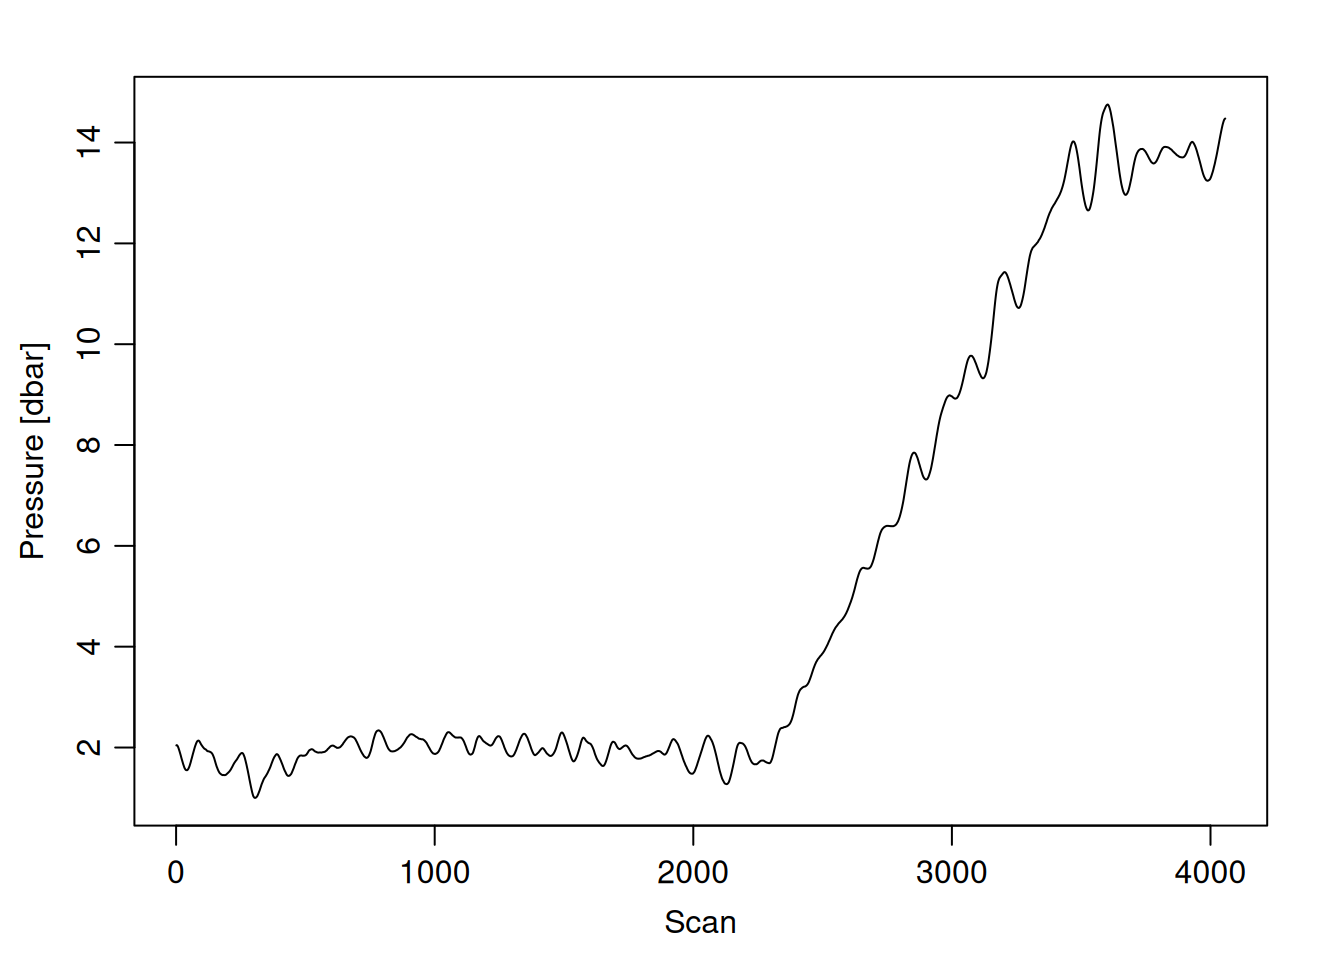
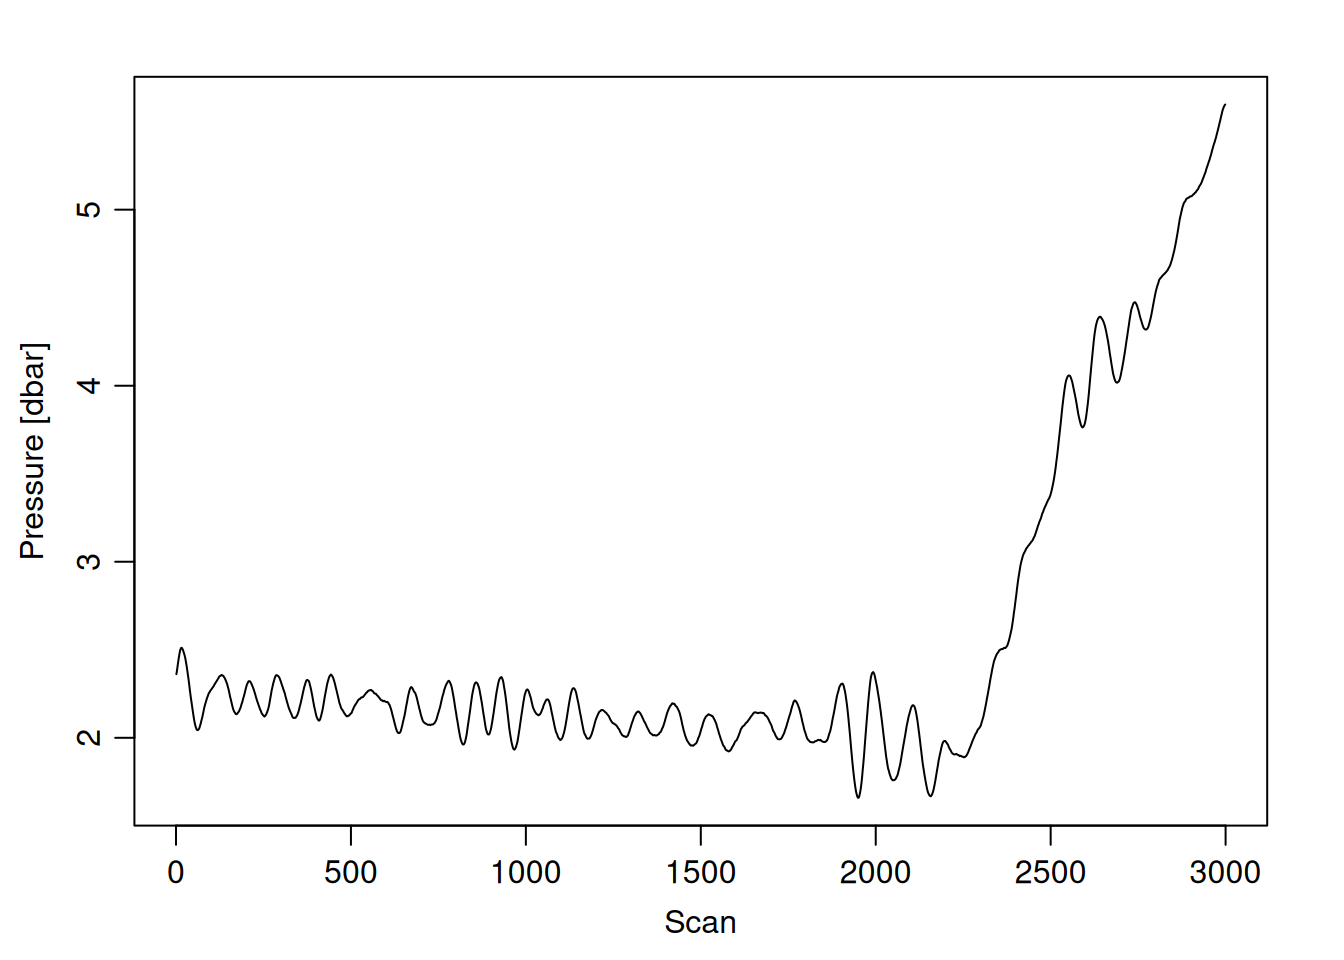
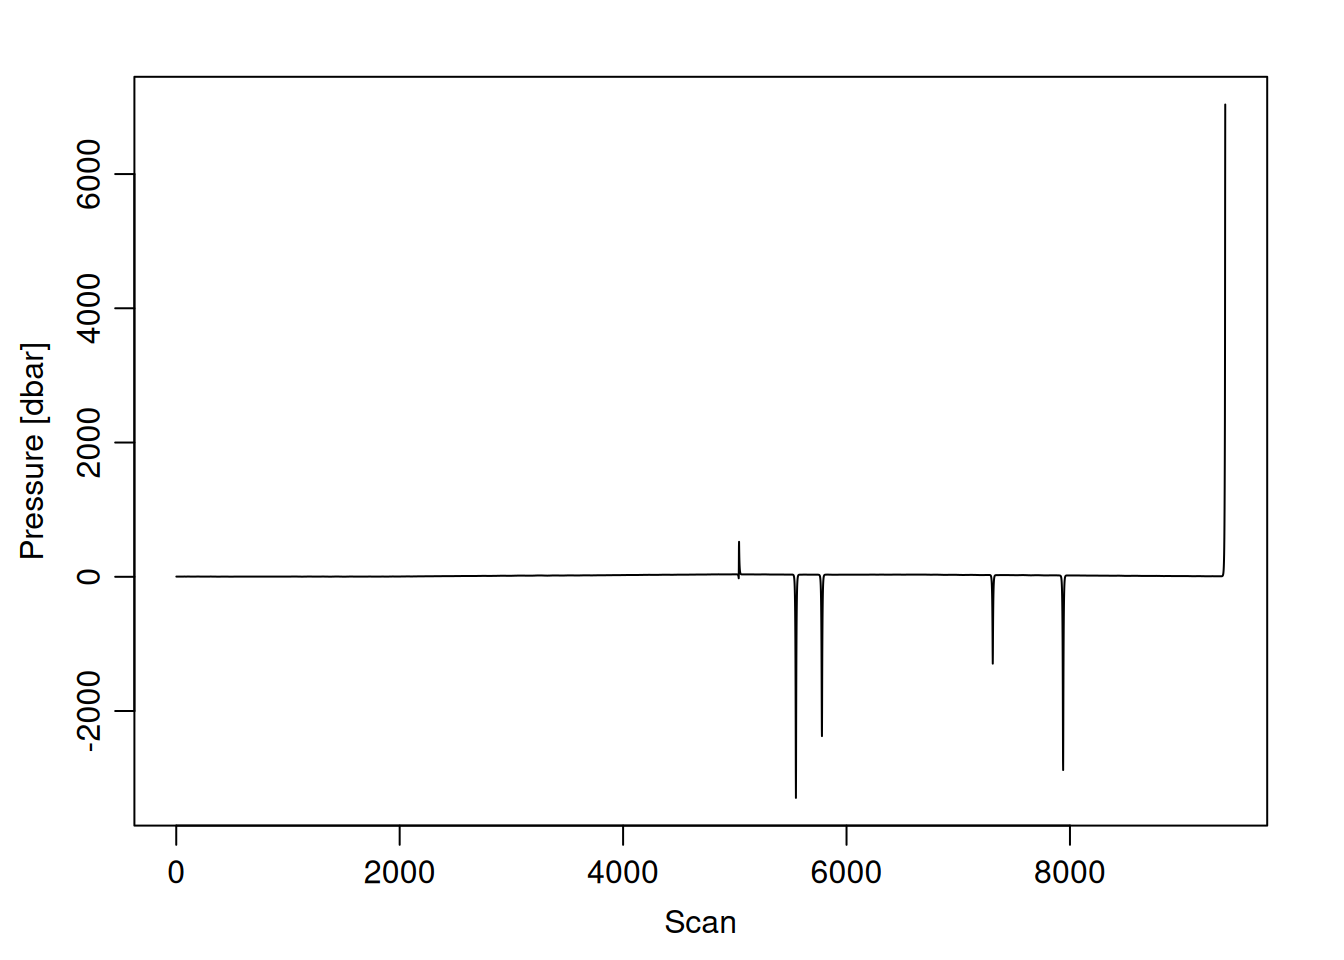
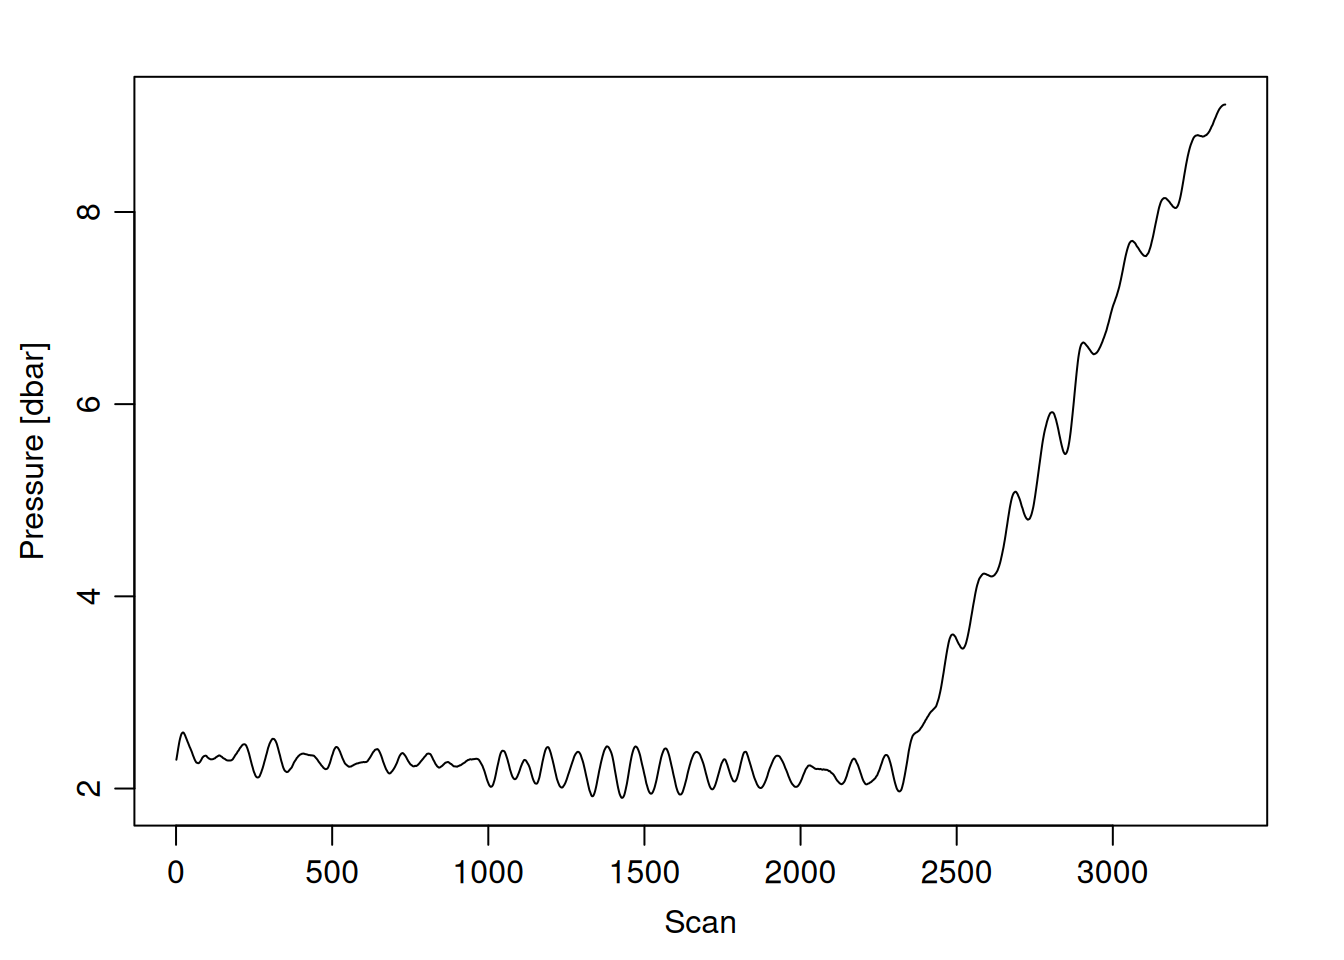
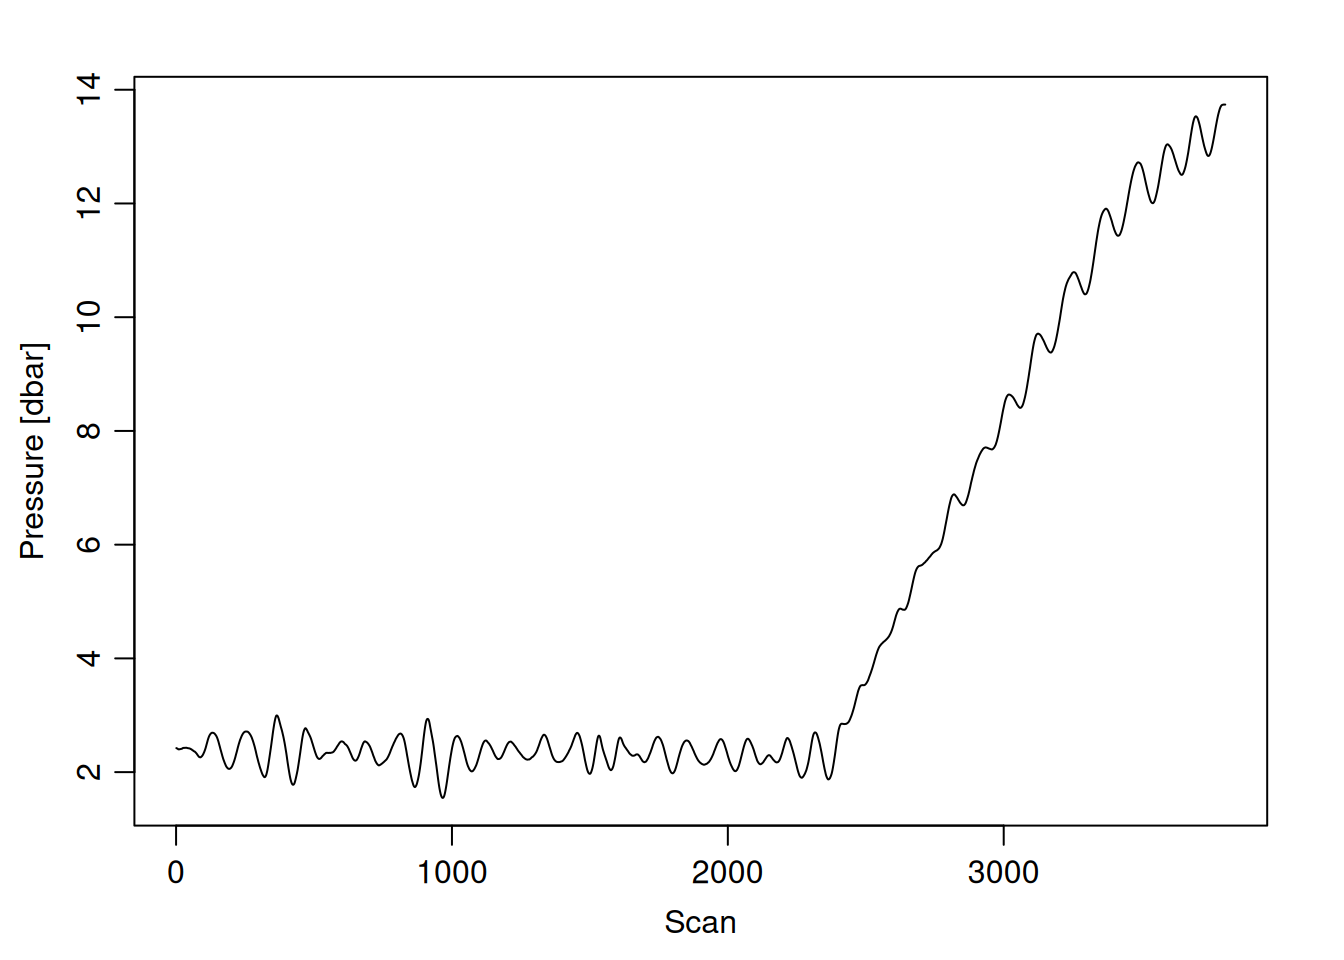
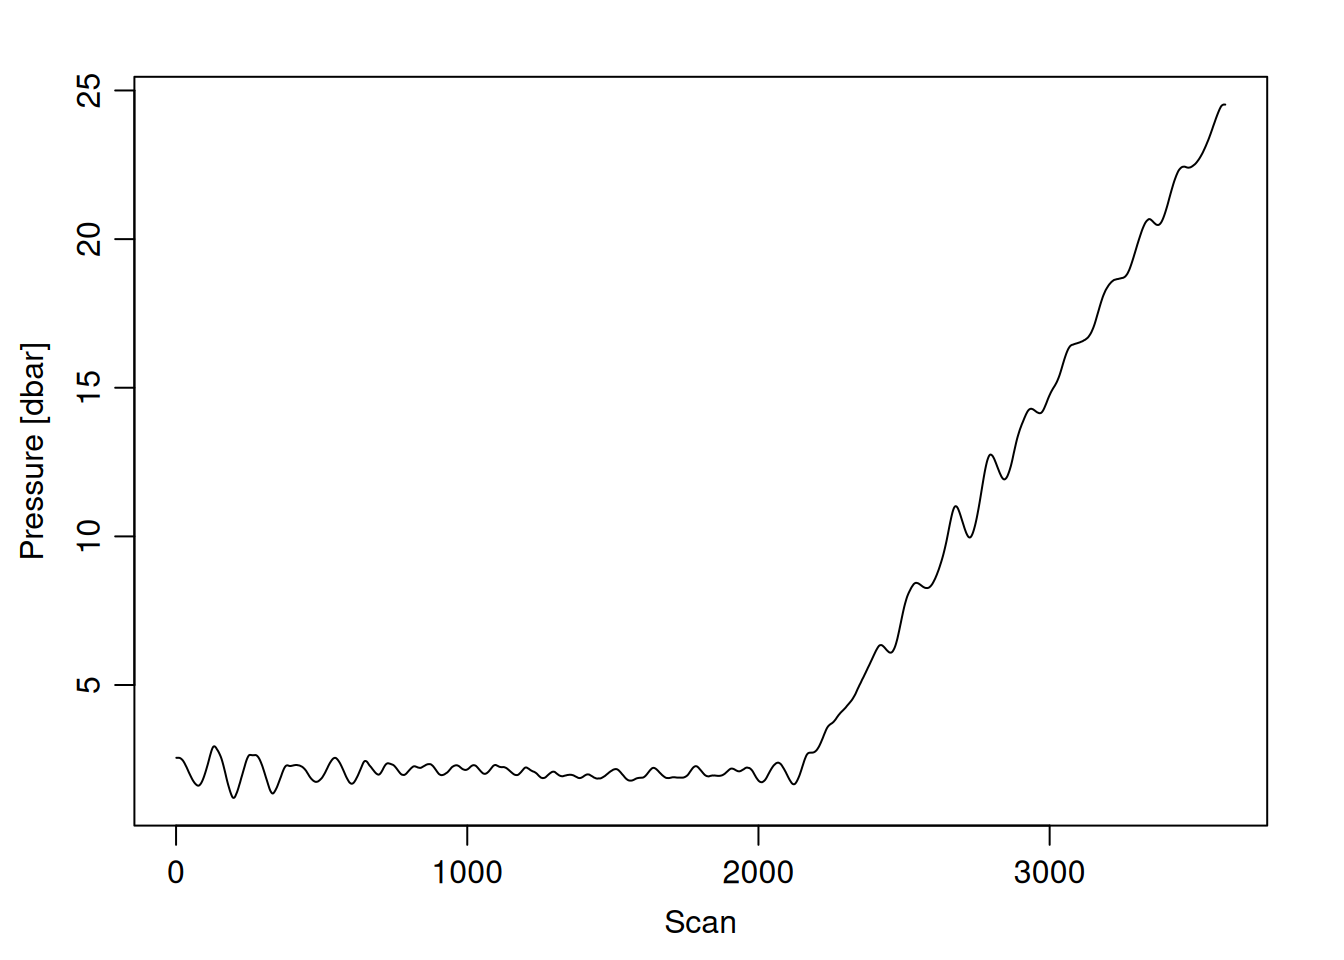
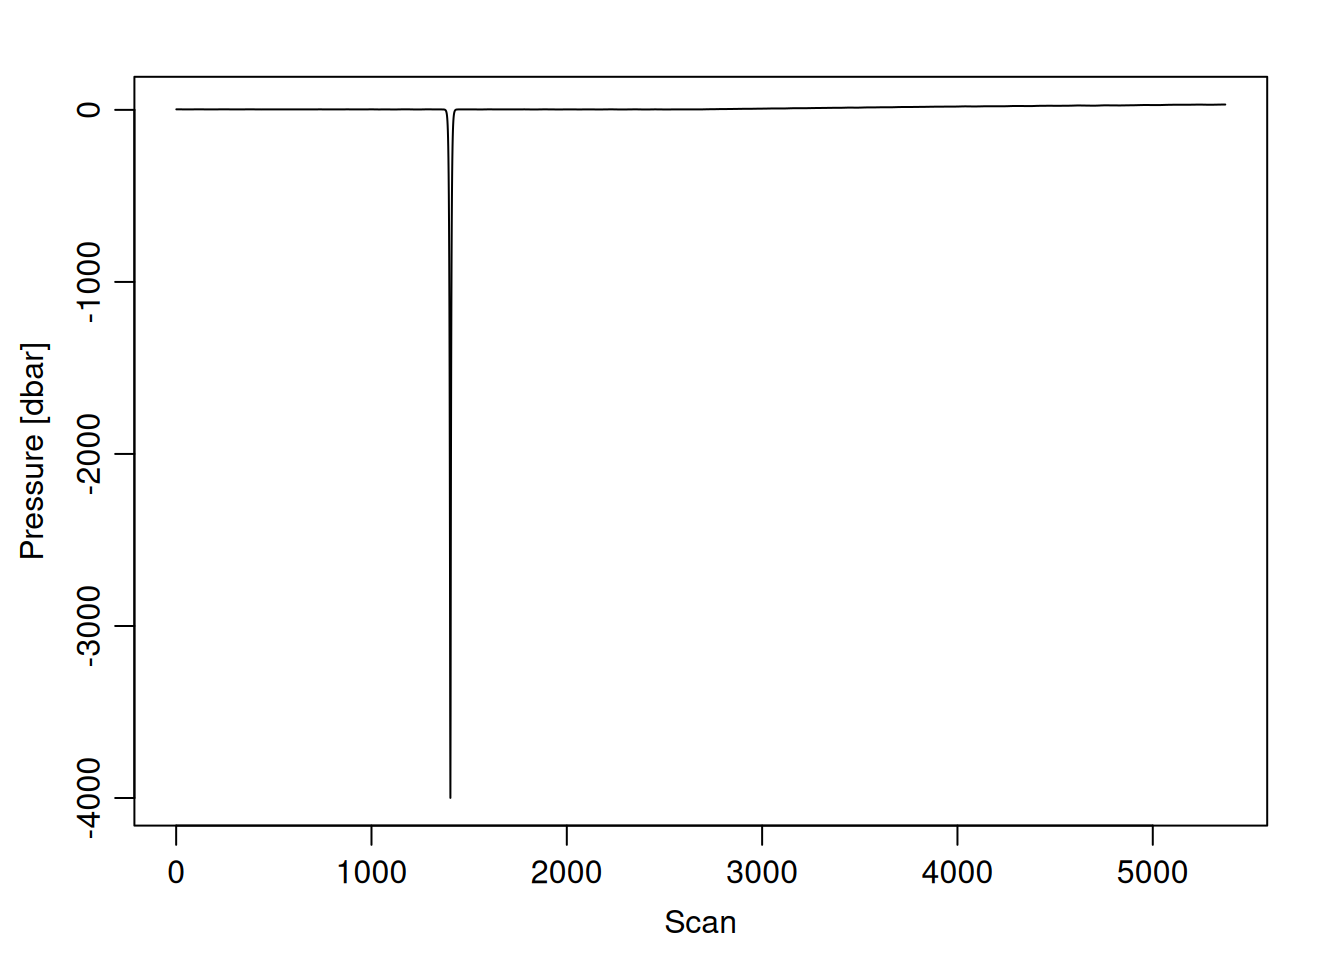
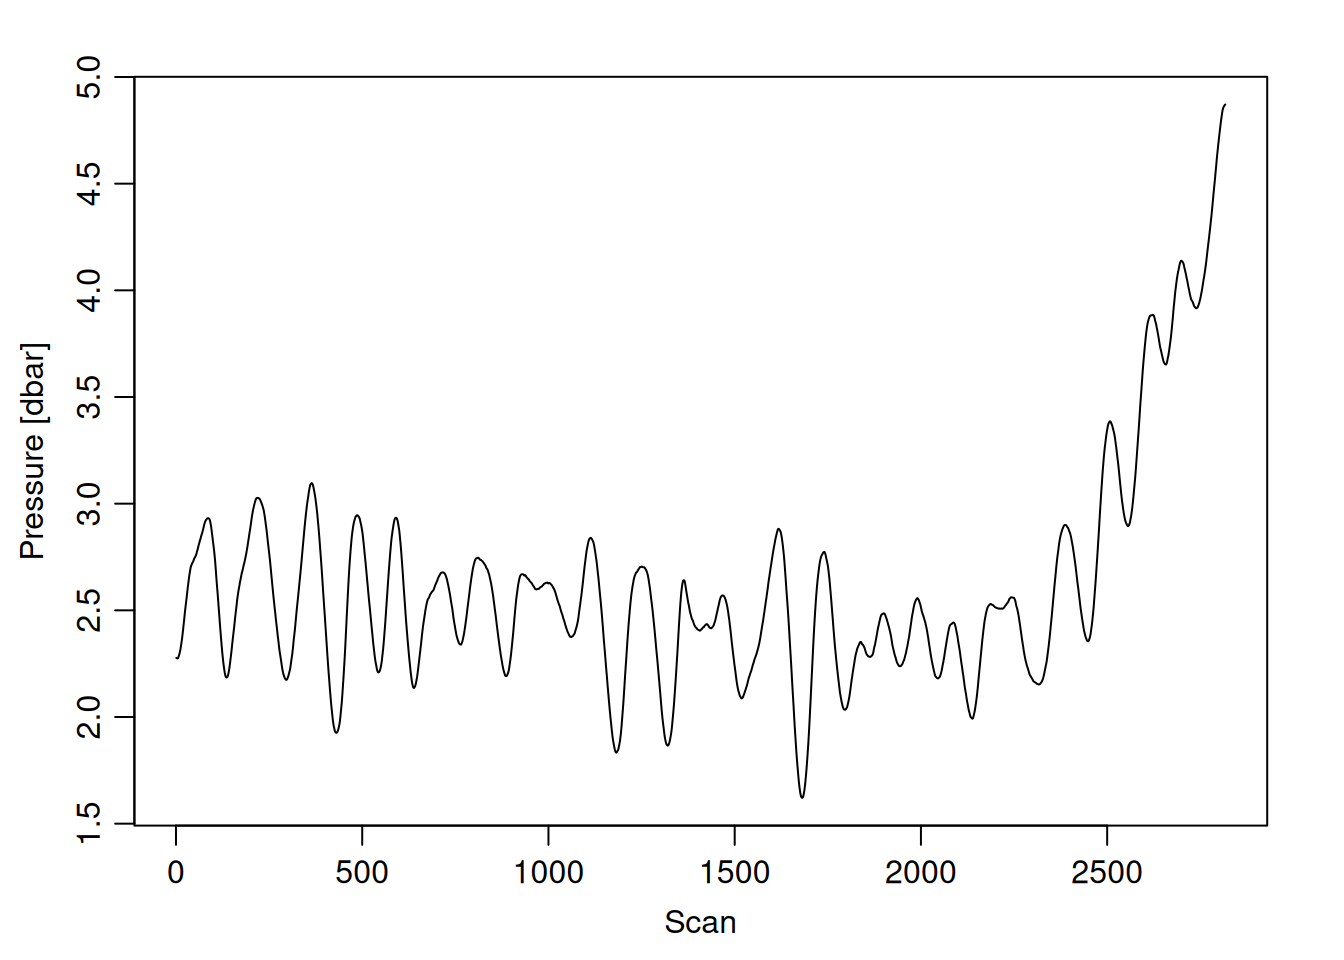
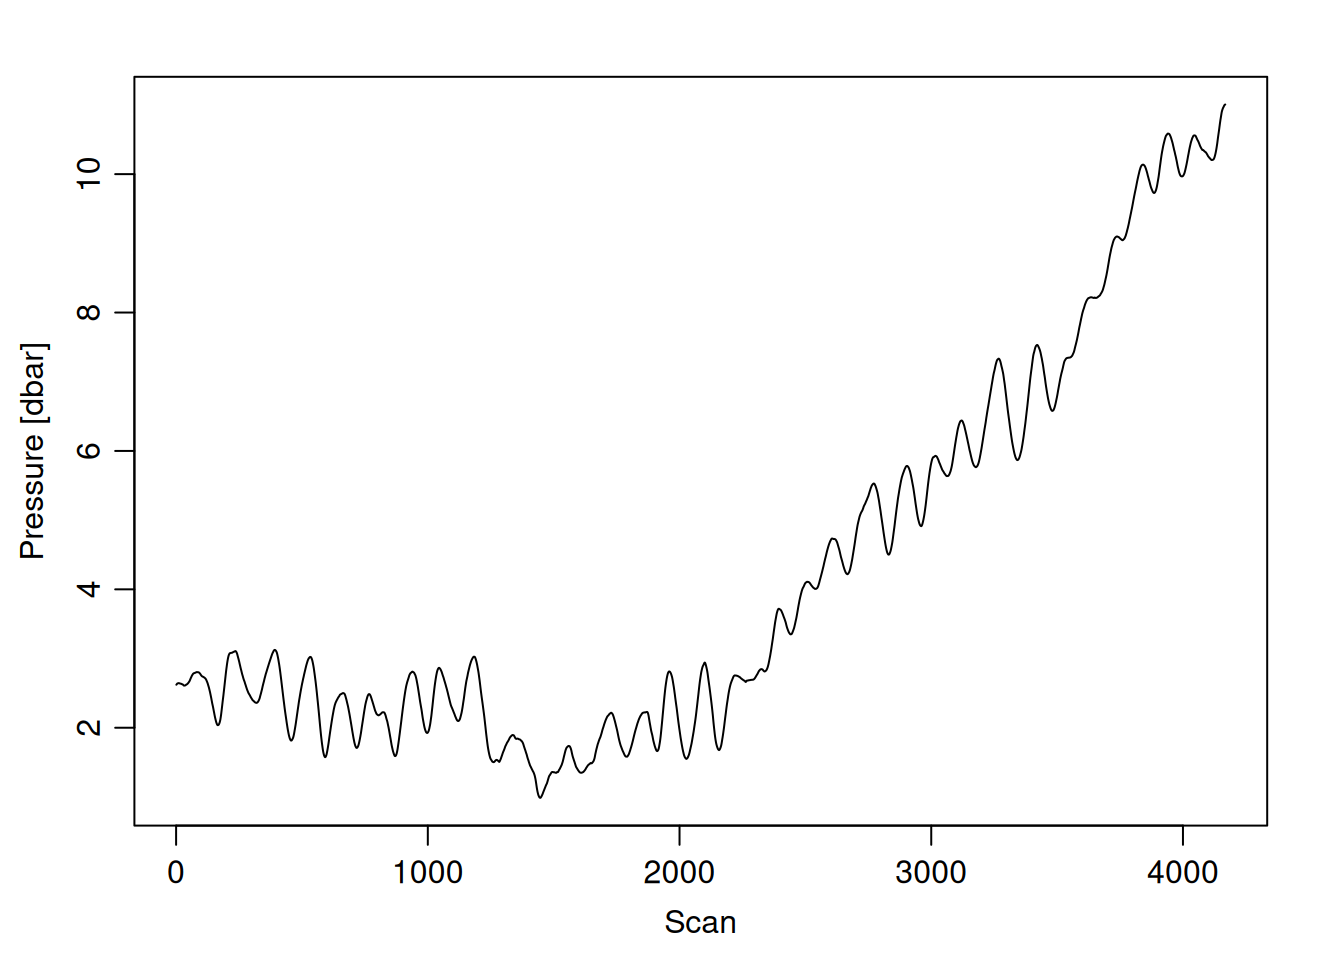
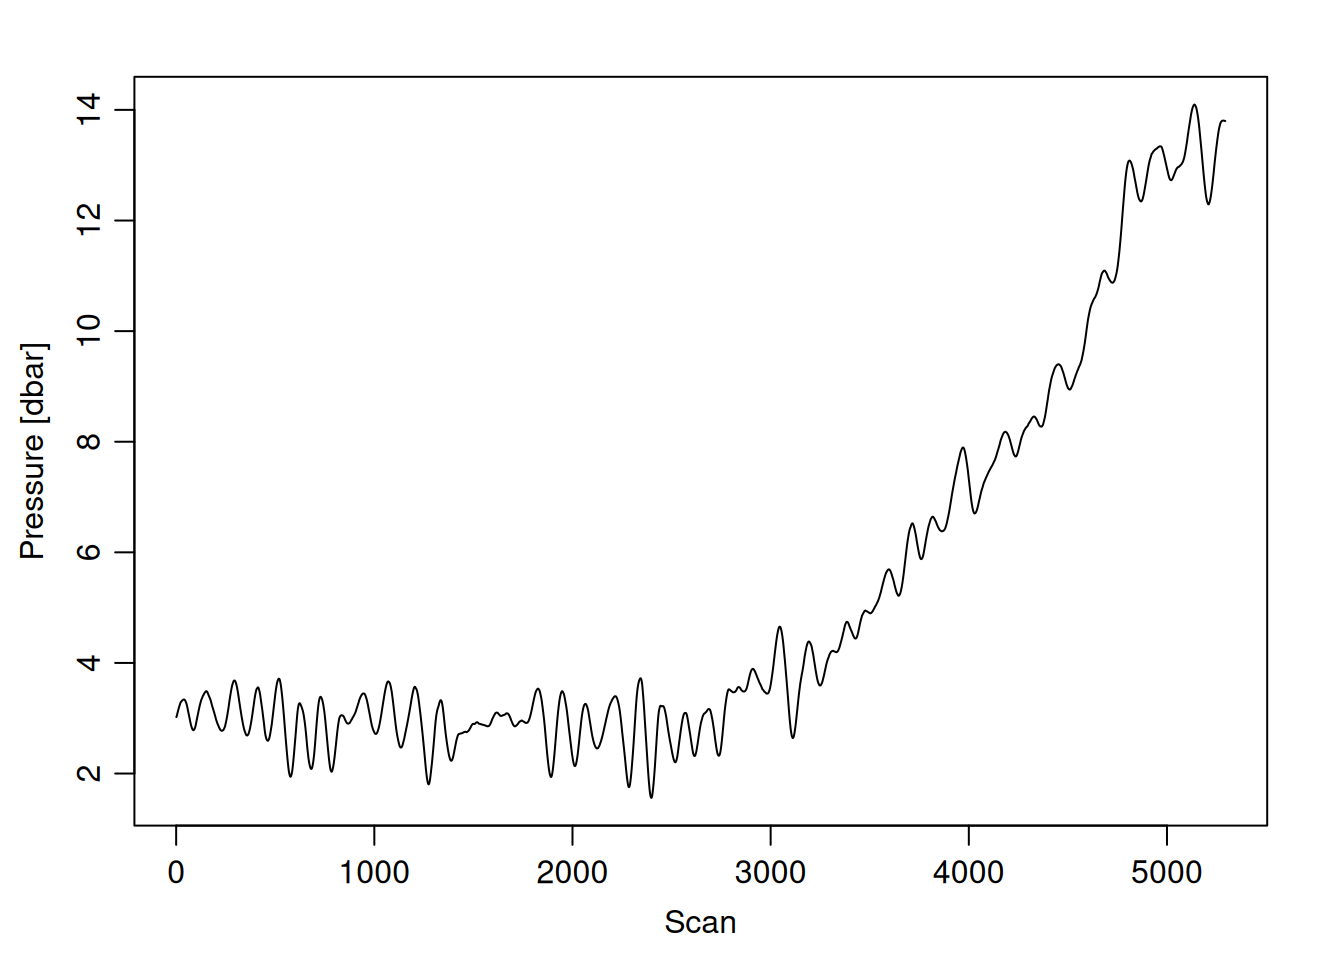
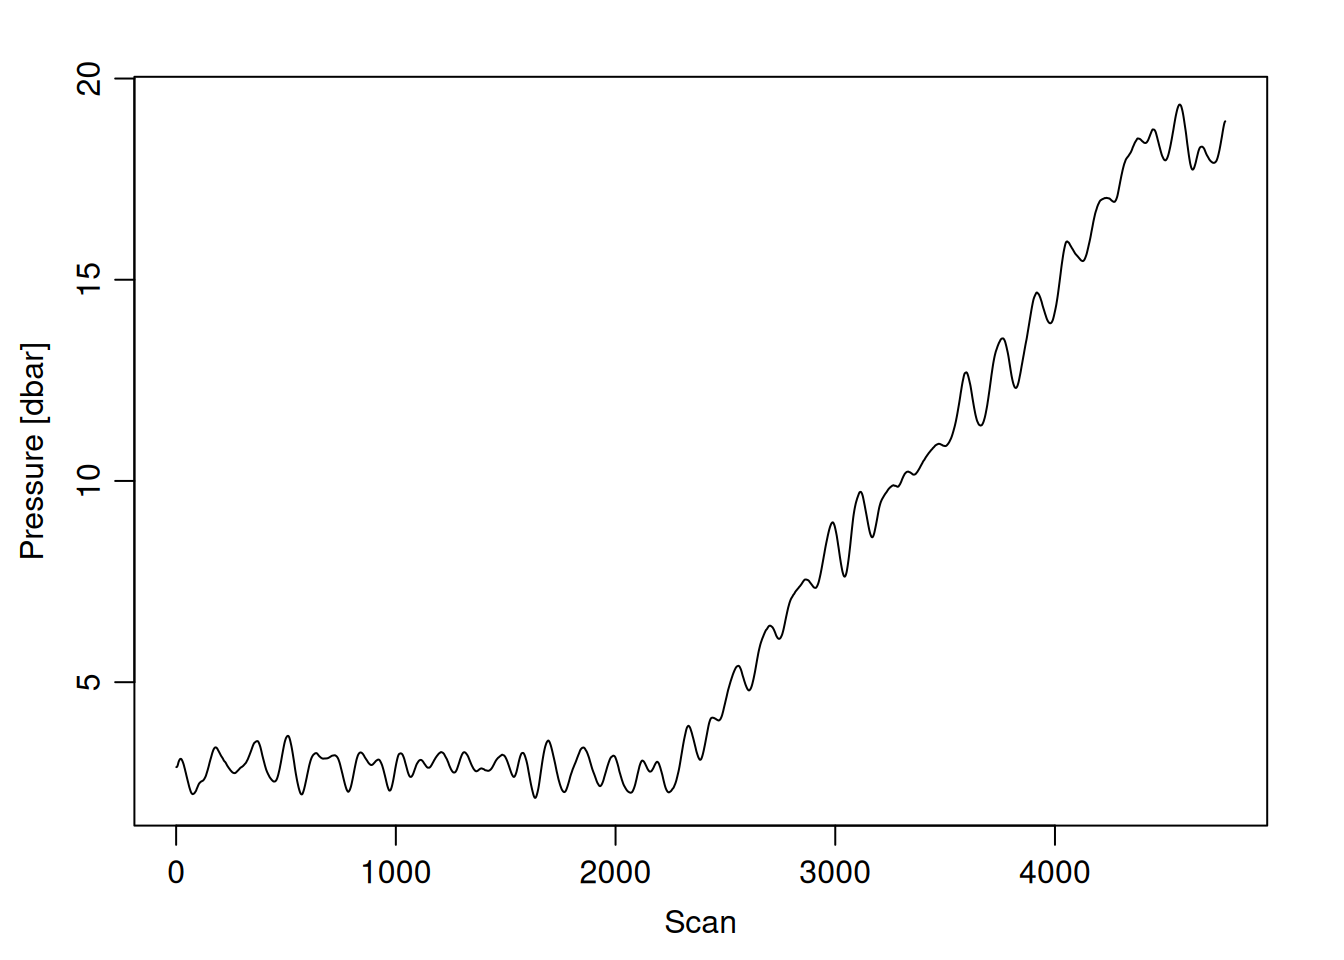
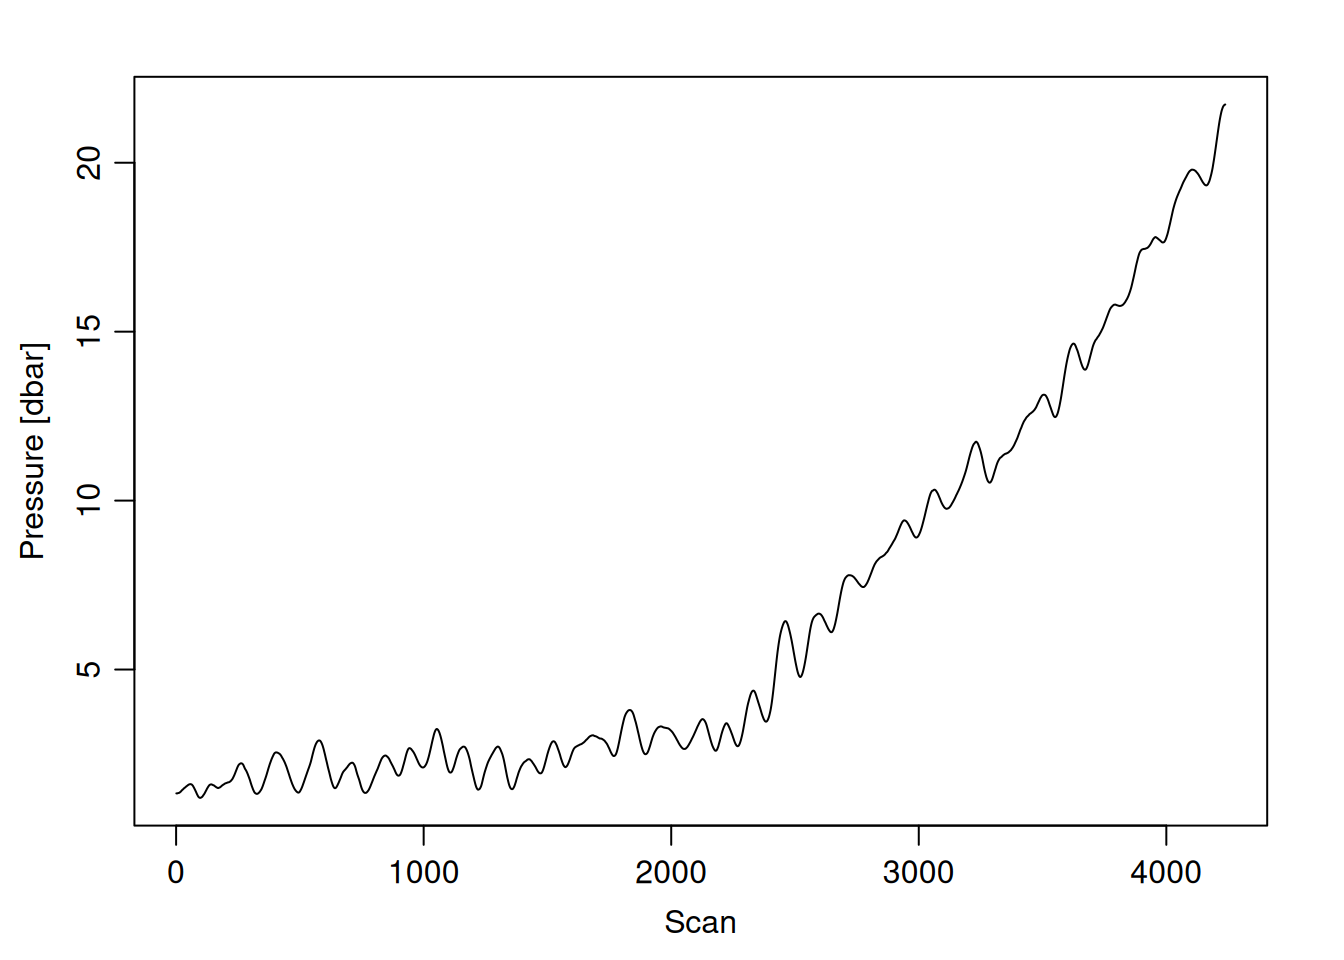
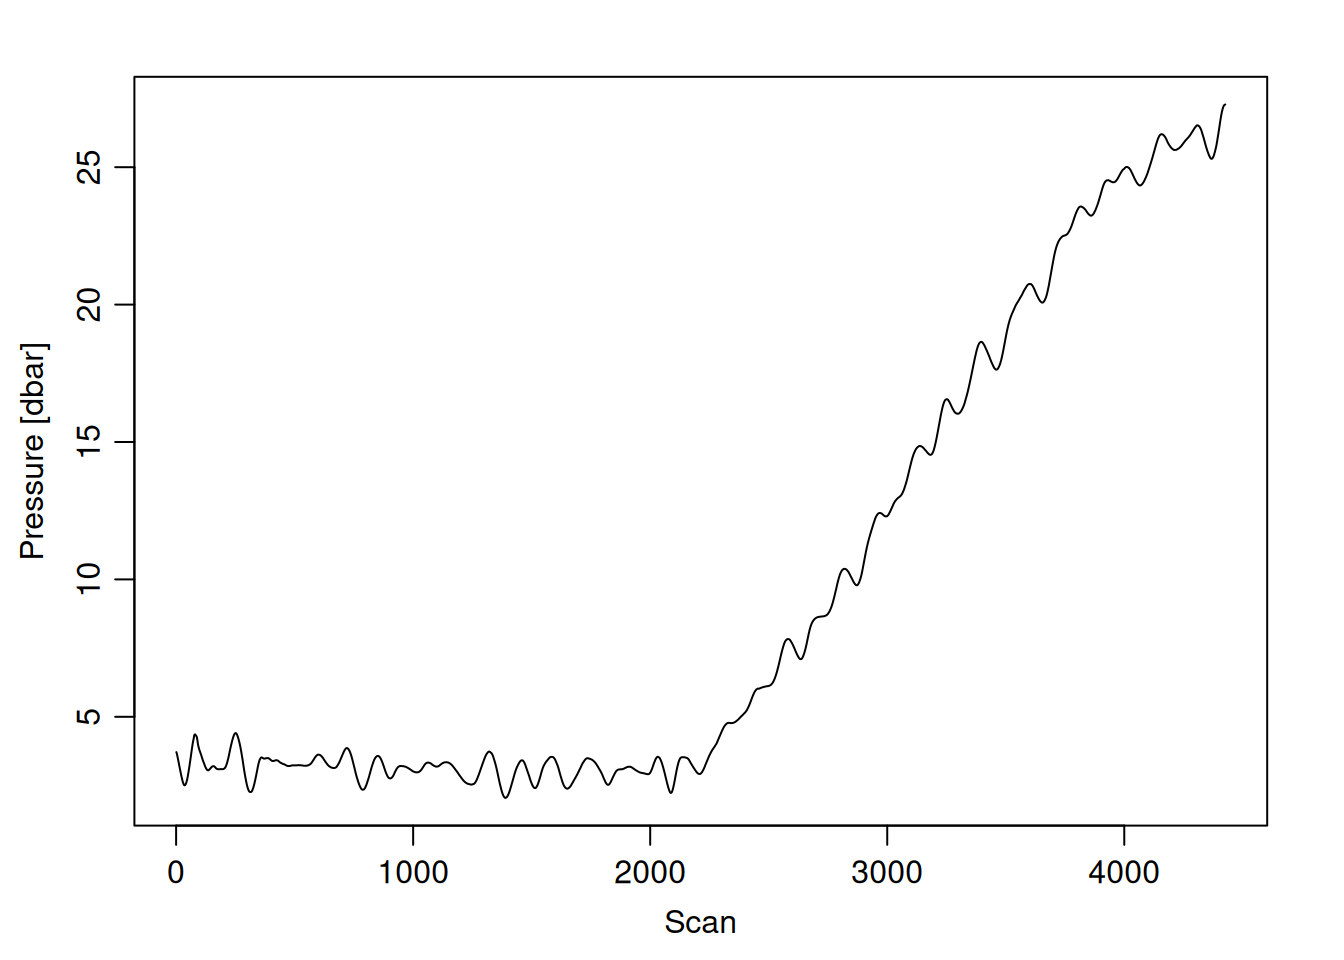
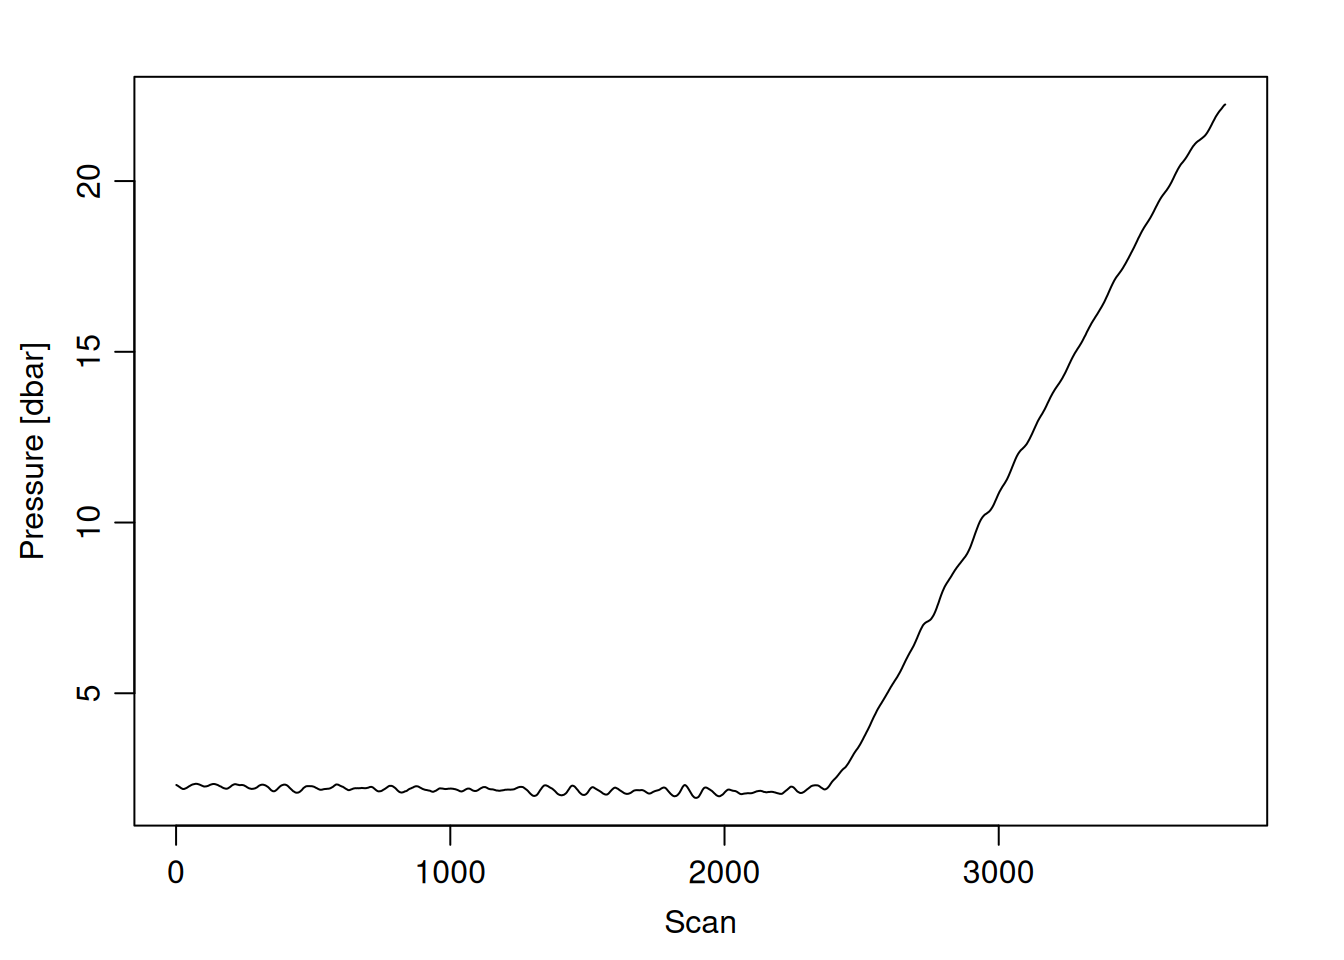
for (i inseq(ctd_FK)){ cast <- ctd_FK[[i]] # 1 is selecting only the first sublist# print(i)print(glue("=== station: {cast@metadata$station[1]}"))print(glue("# scans: {length(cast@data$scan)}"))plotScan(cast)}
=== station: .002
# scans: 2410
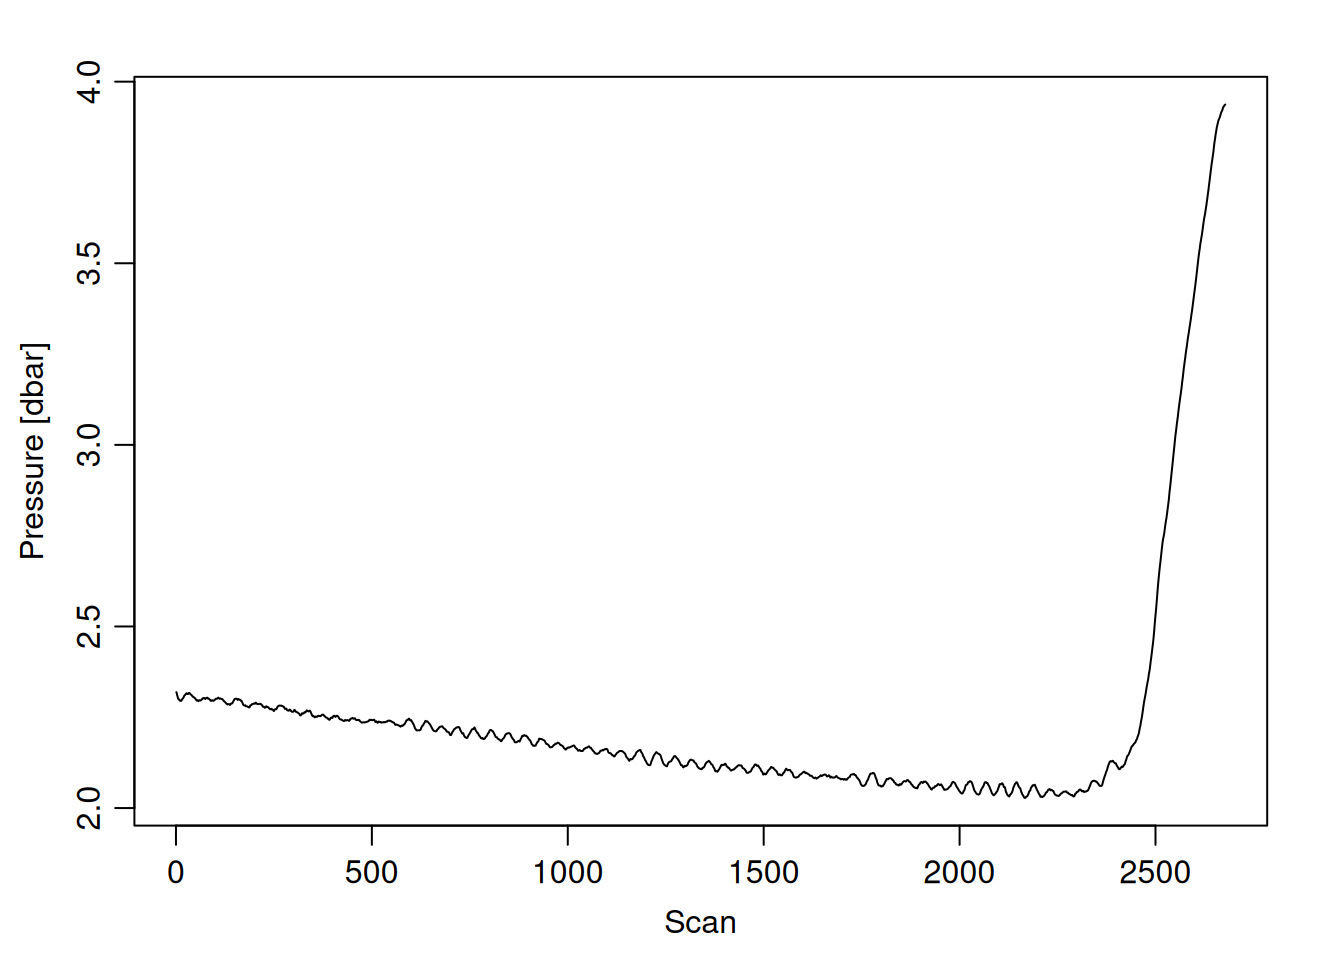
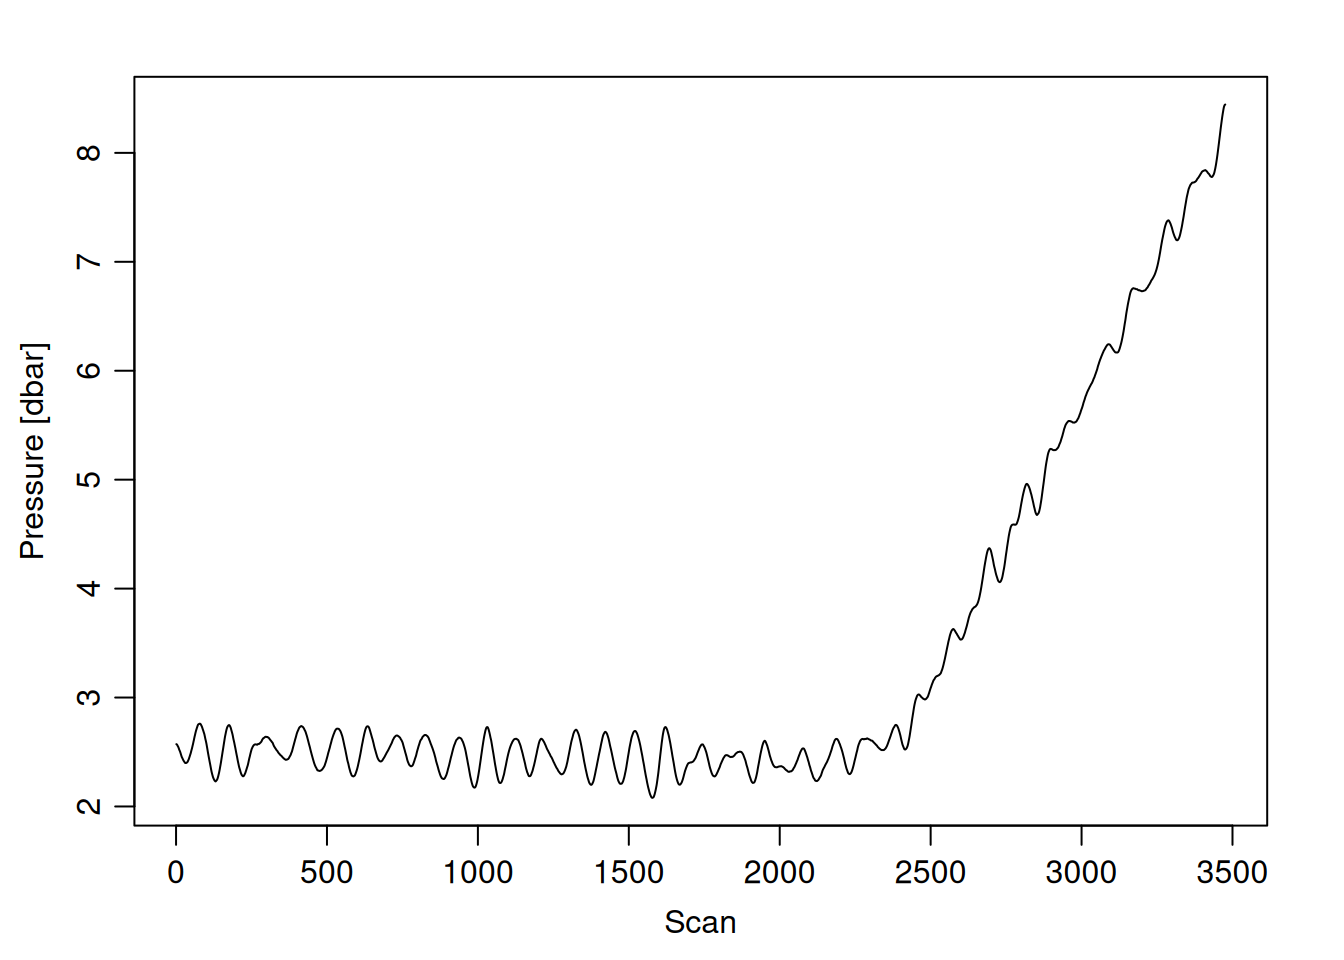
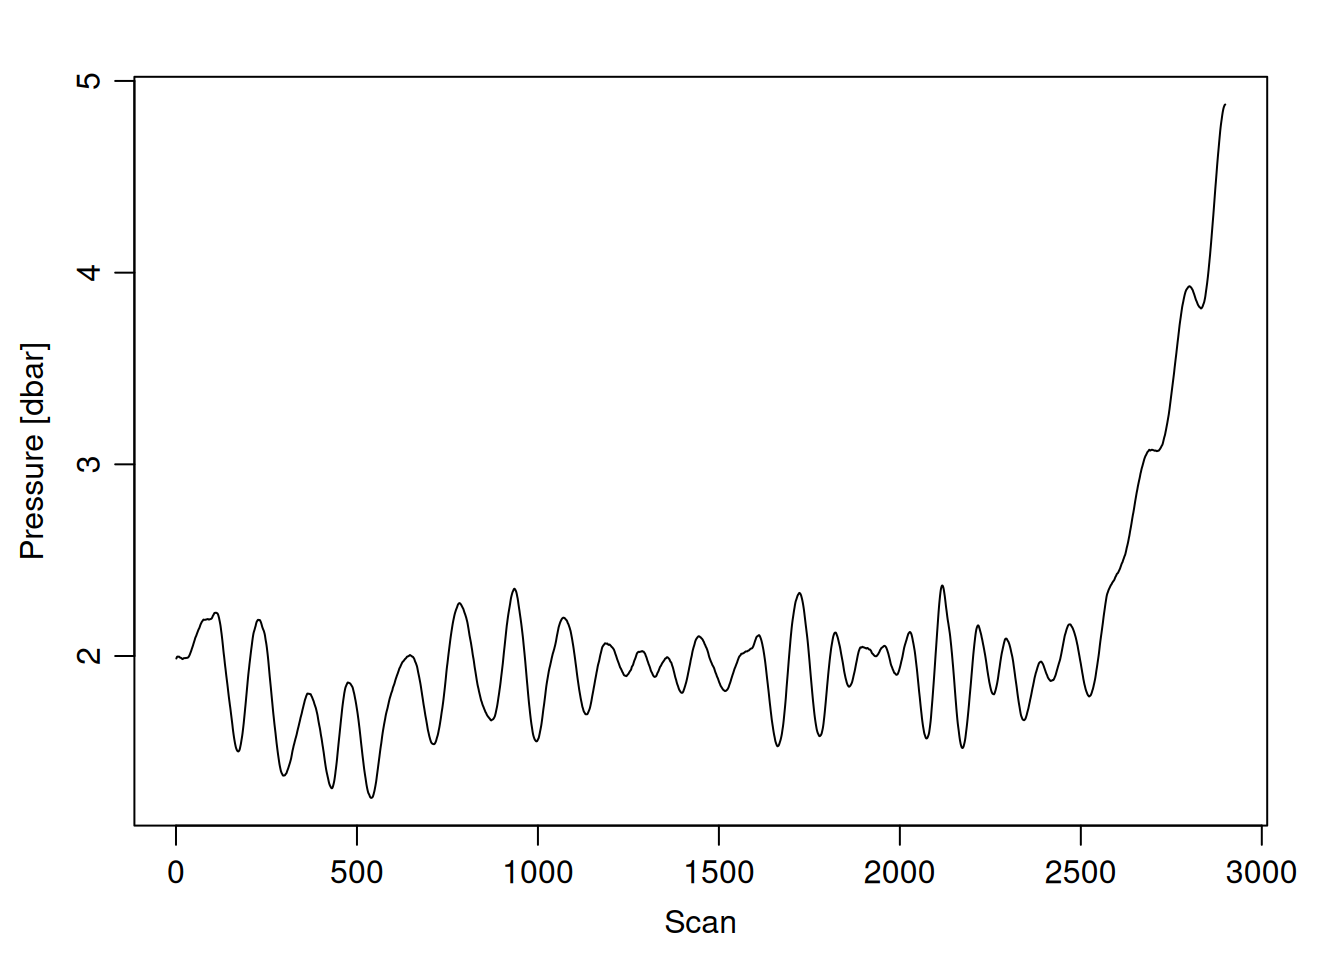
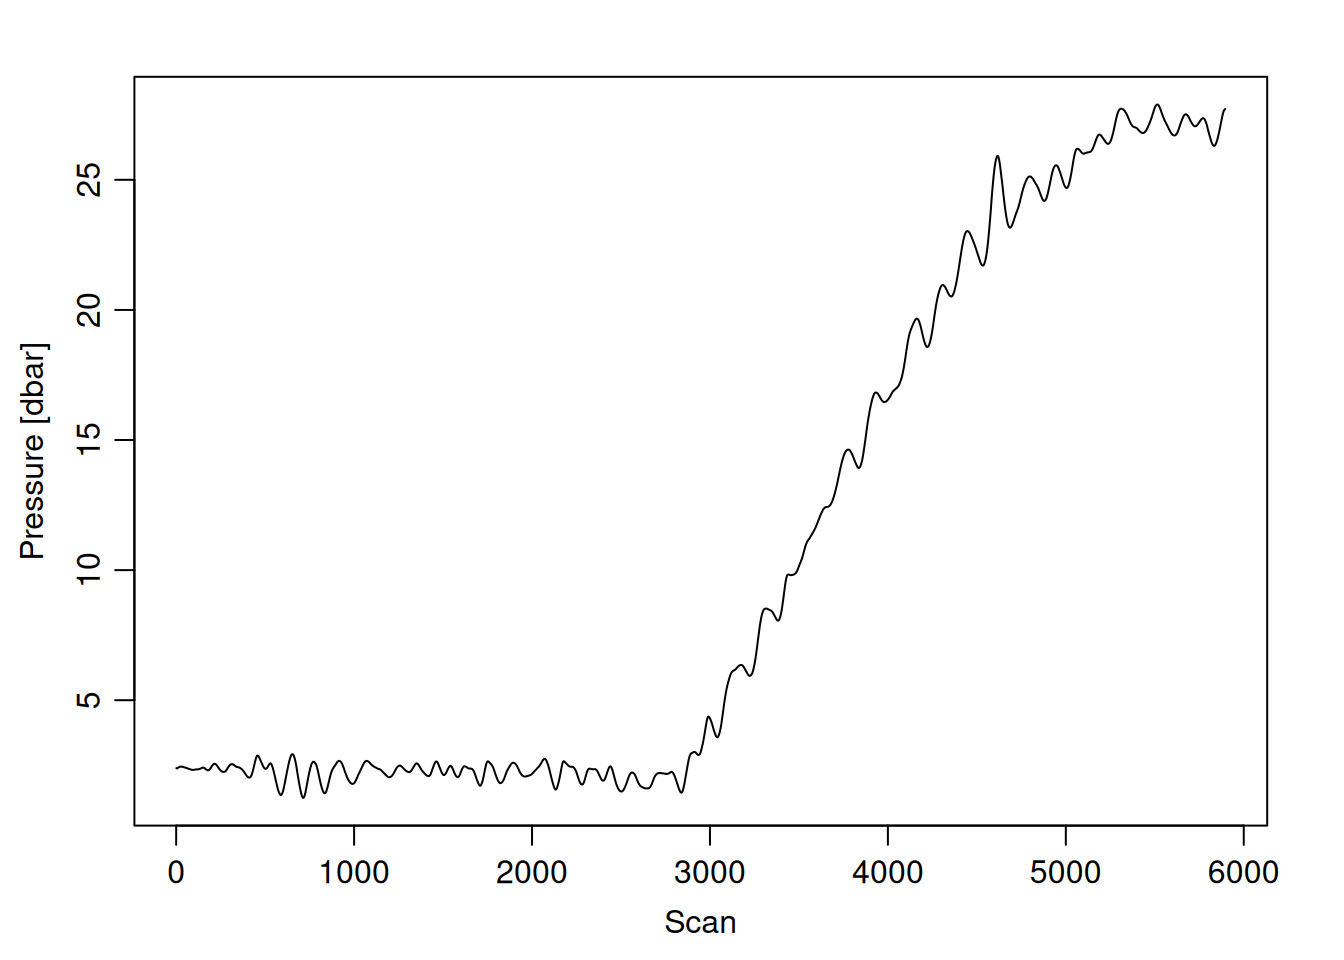
=== station: .007
# scans: 2635
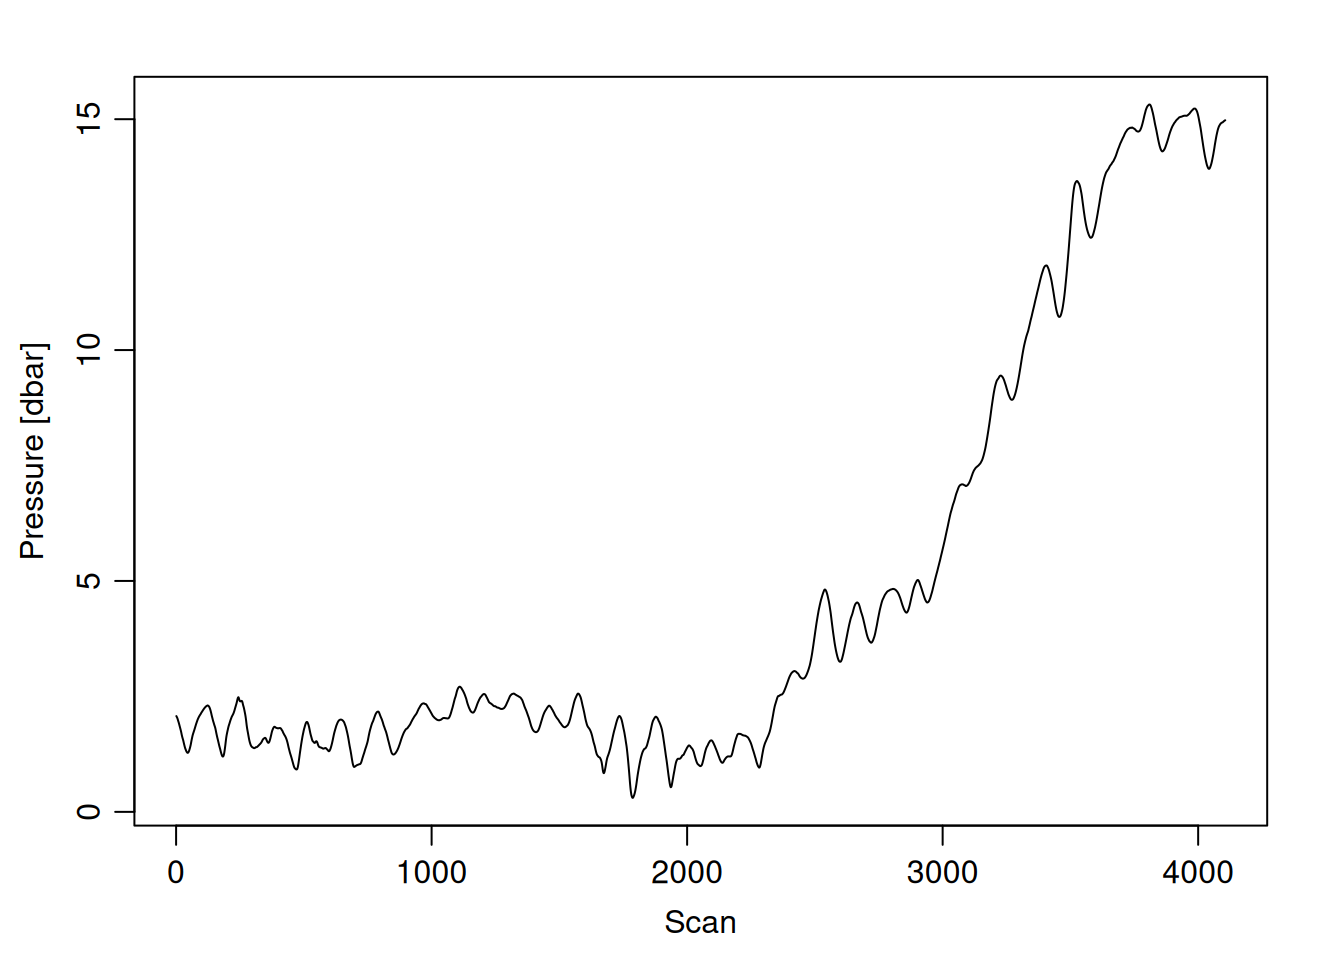
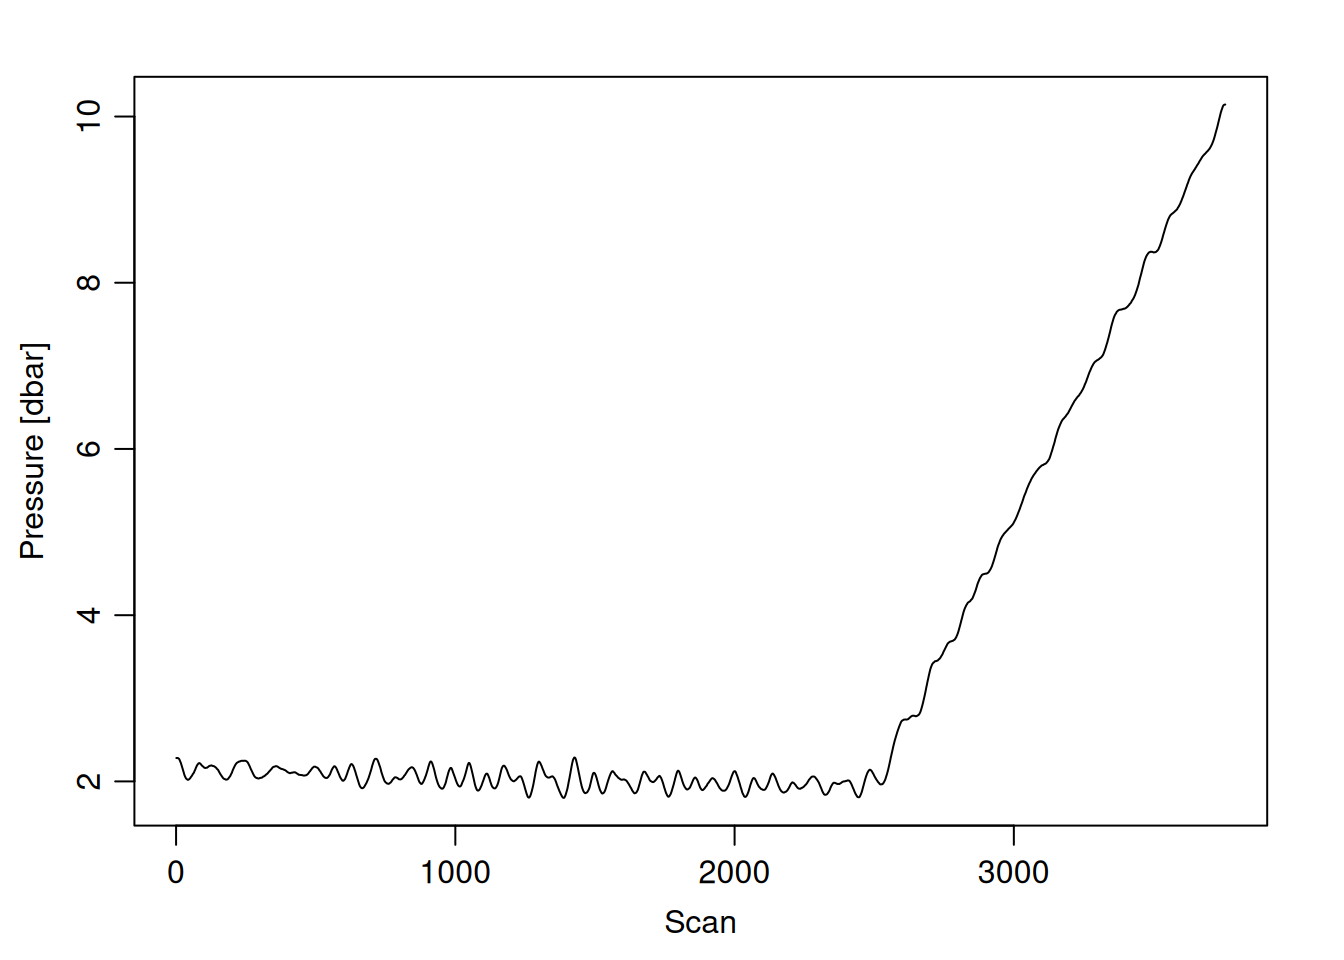
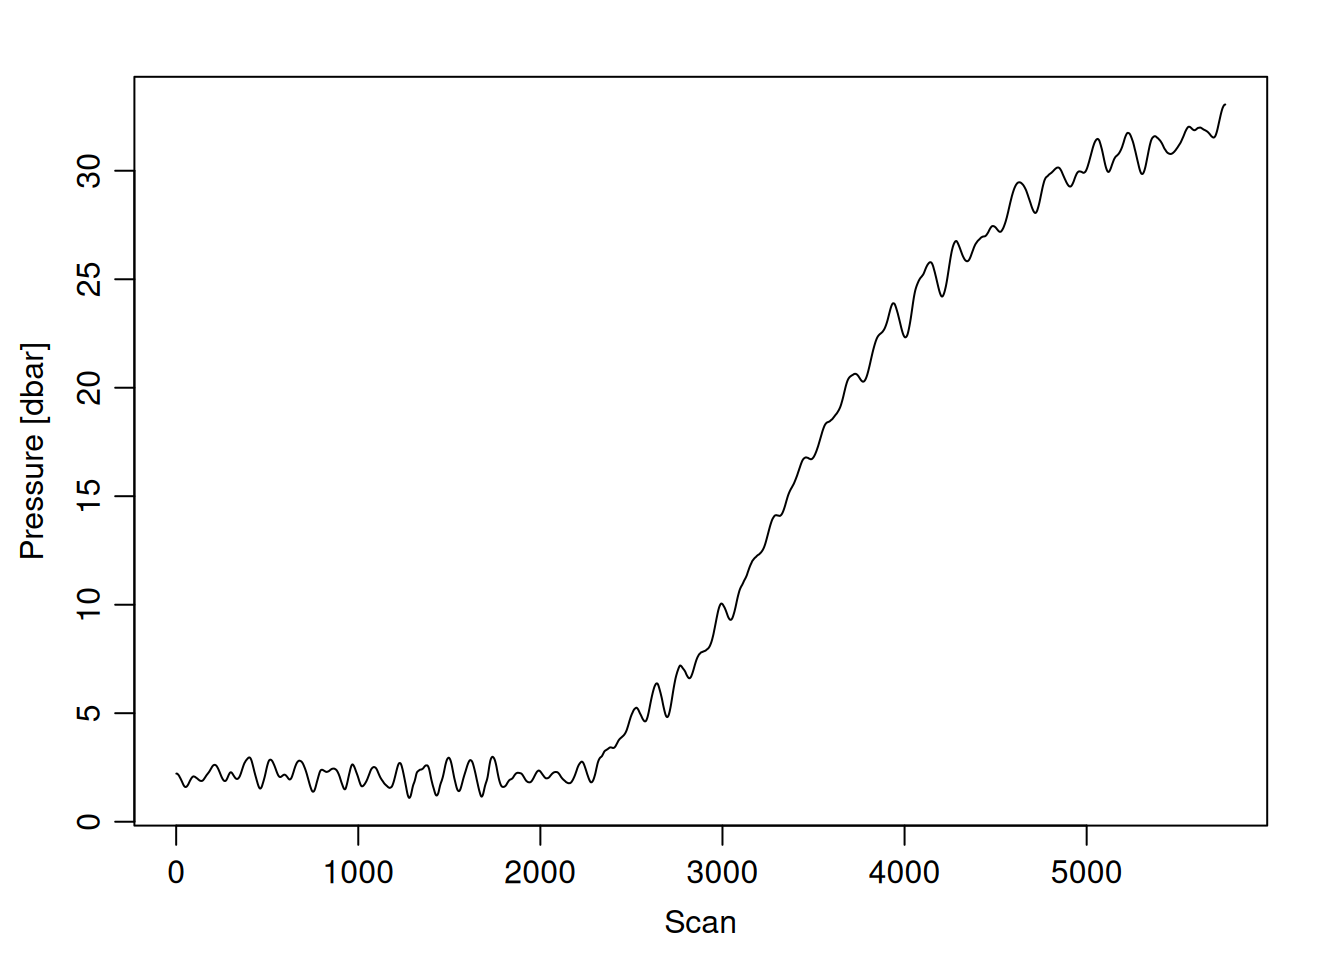
=== station: .009
# scans: 4250
=== station: .009_5
# scans: 10157
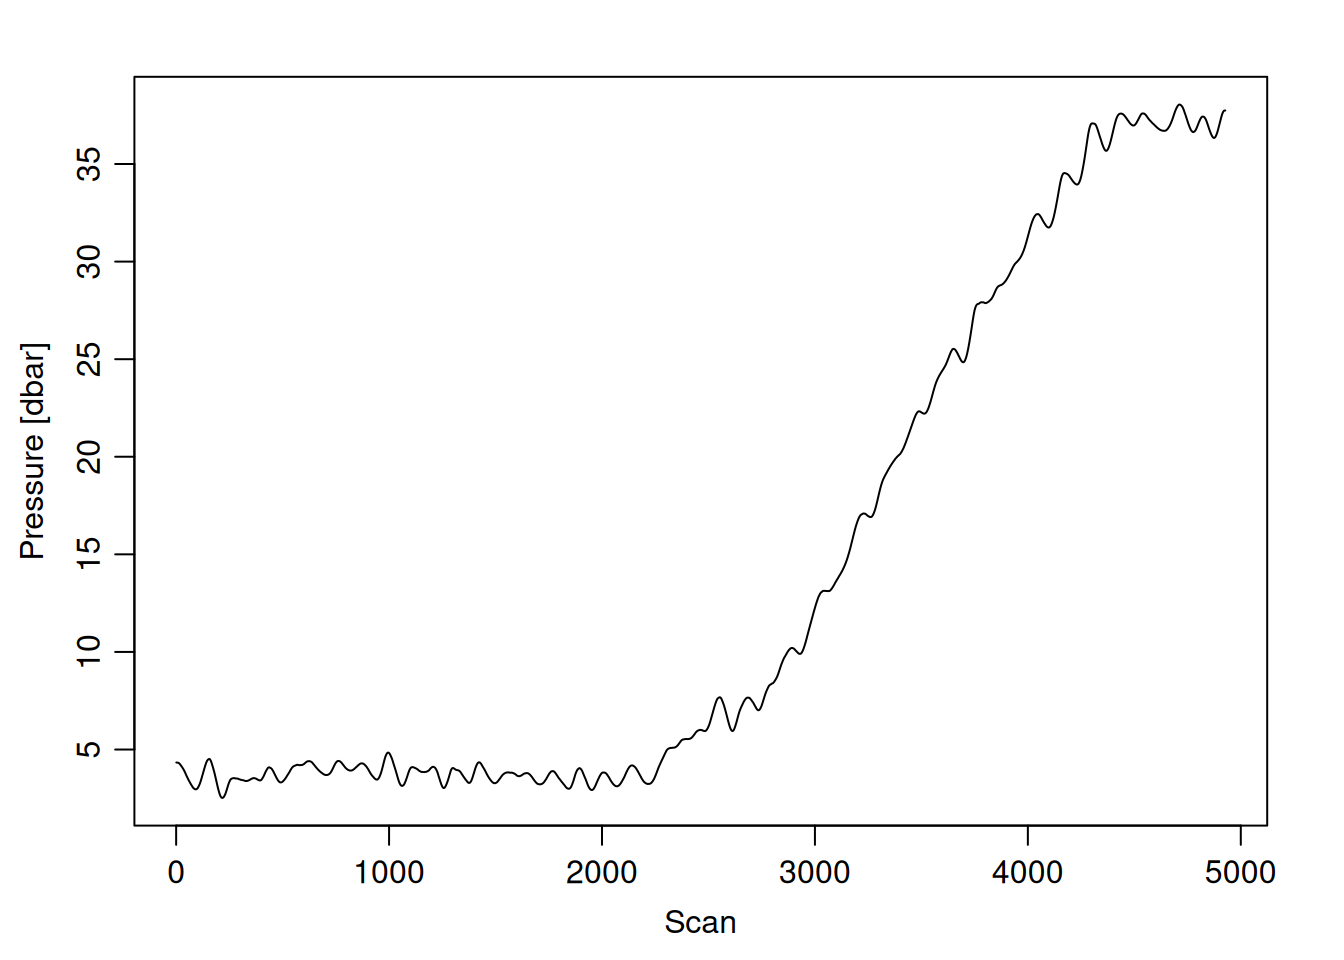
=== station: .010
# scans: 3213
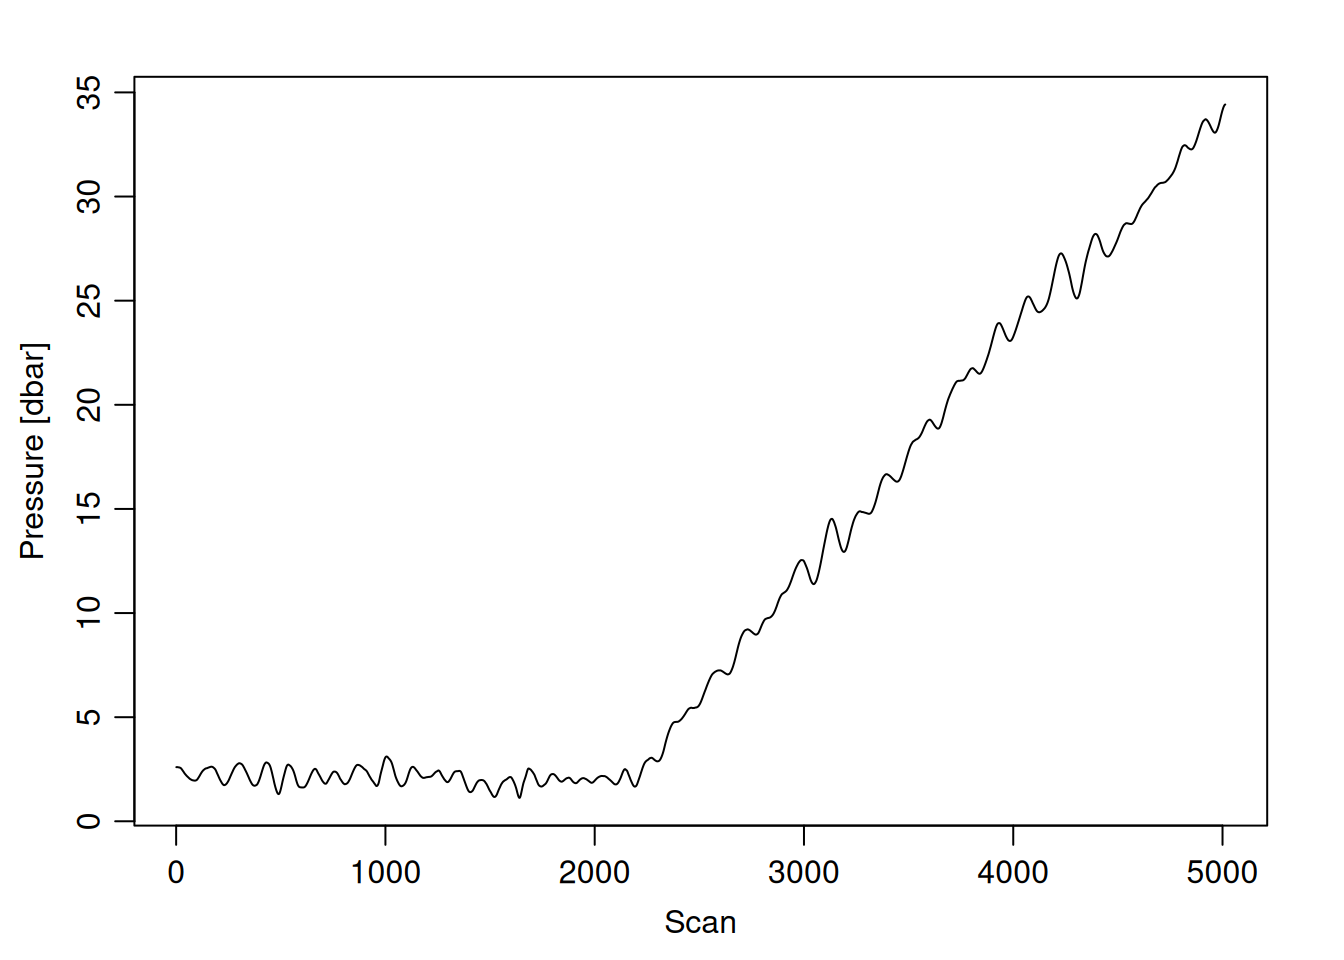
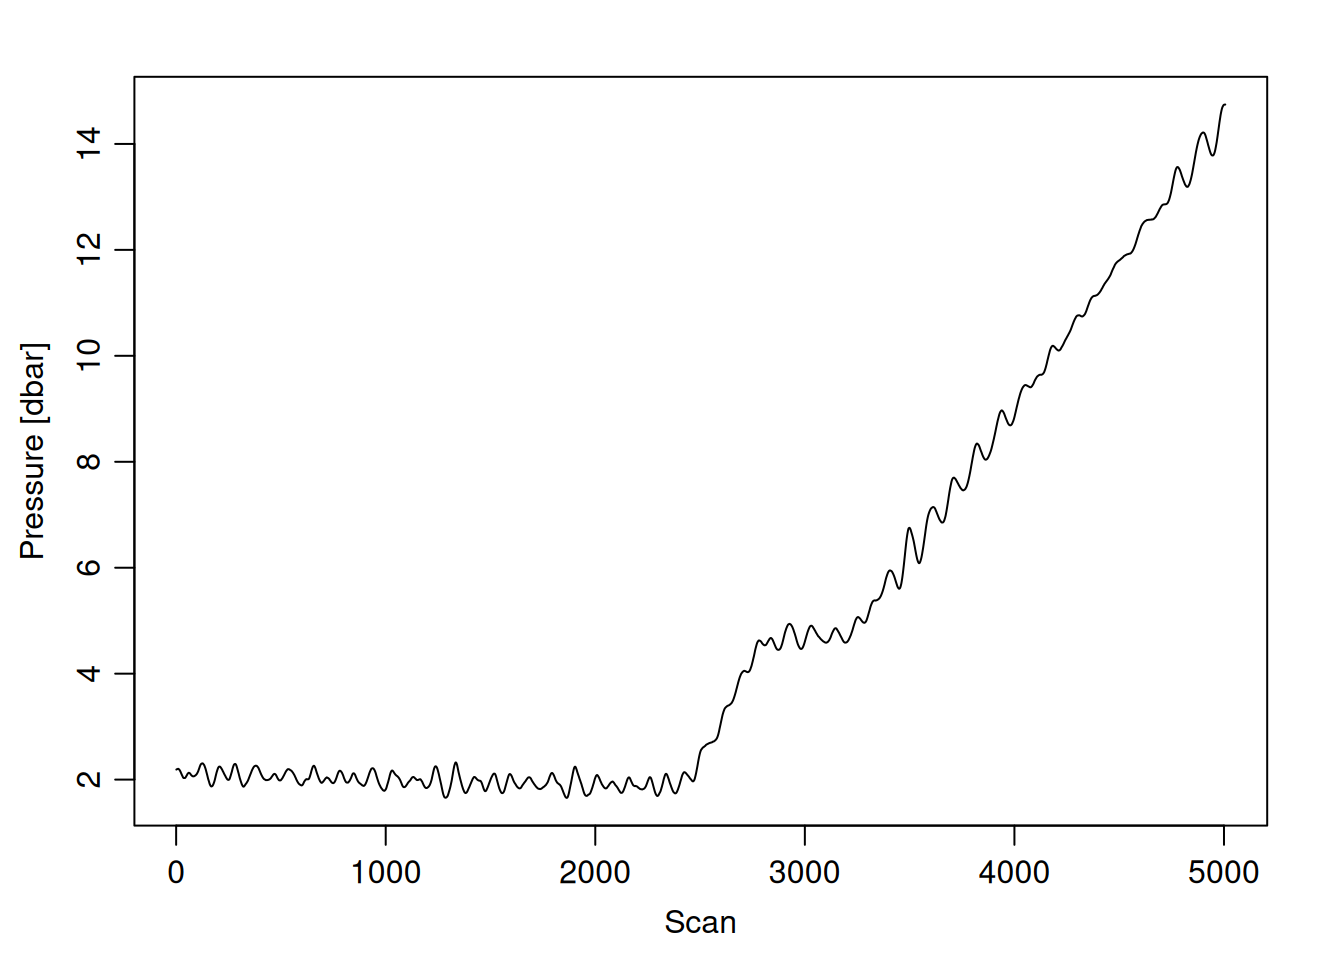
=== station: .012
# scans: 5044
=== station: .016
# scans: 3332
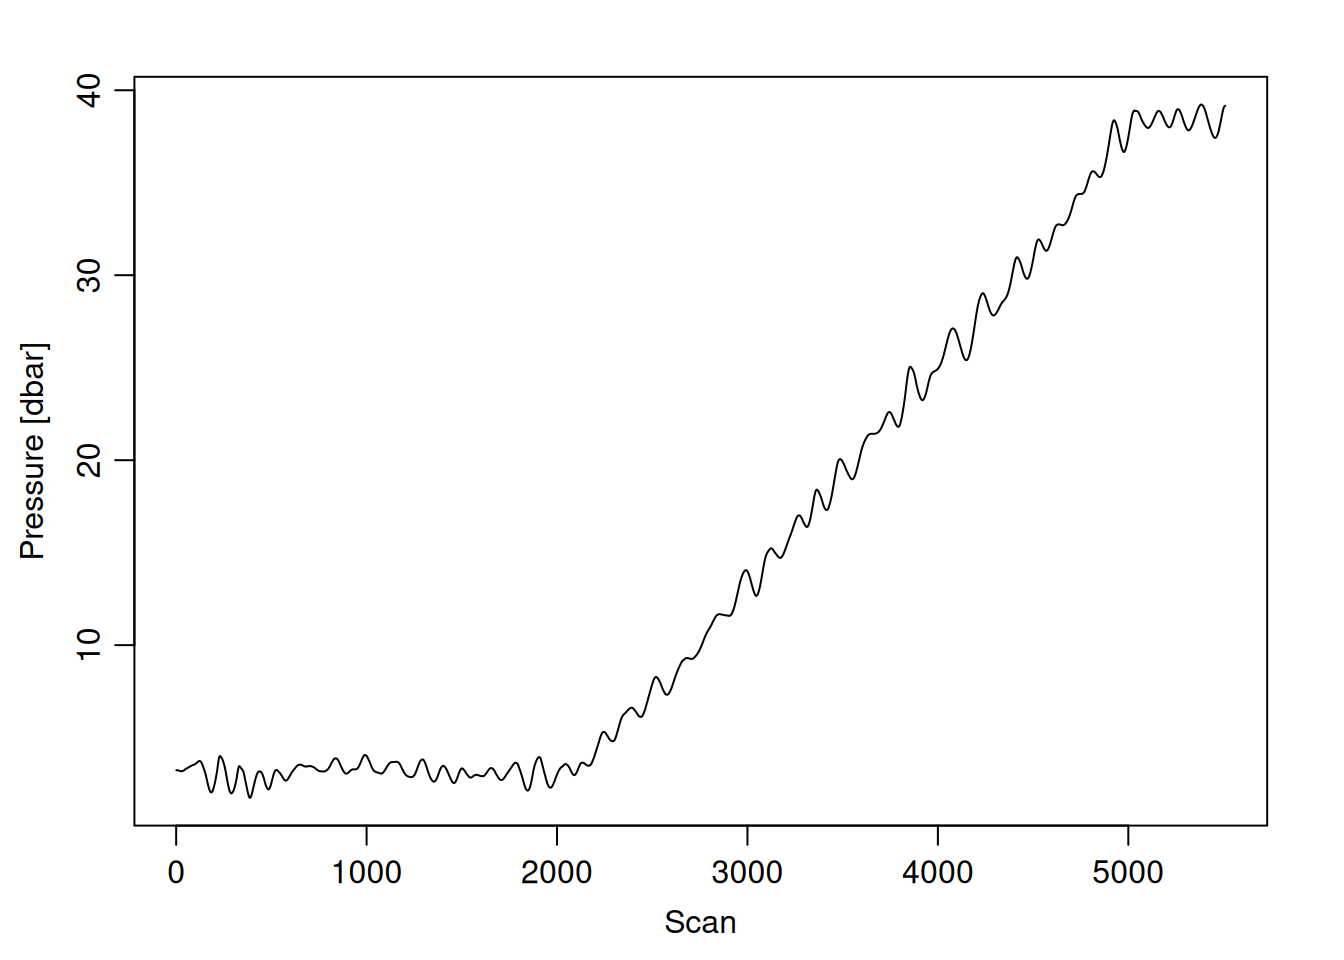
=== station: .018
# scans: 6207
=== station: .030
# scans: 4497
=== station: .031
# scans: 3782
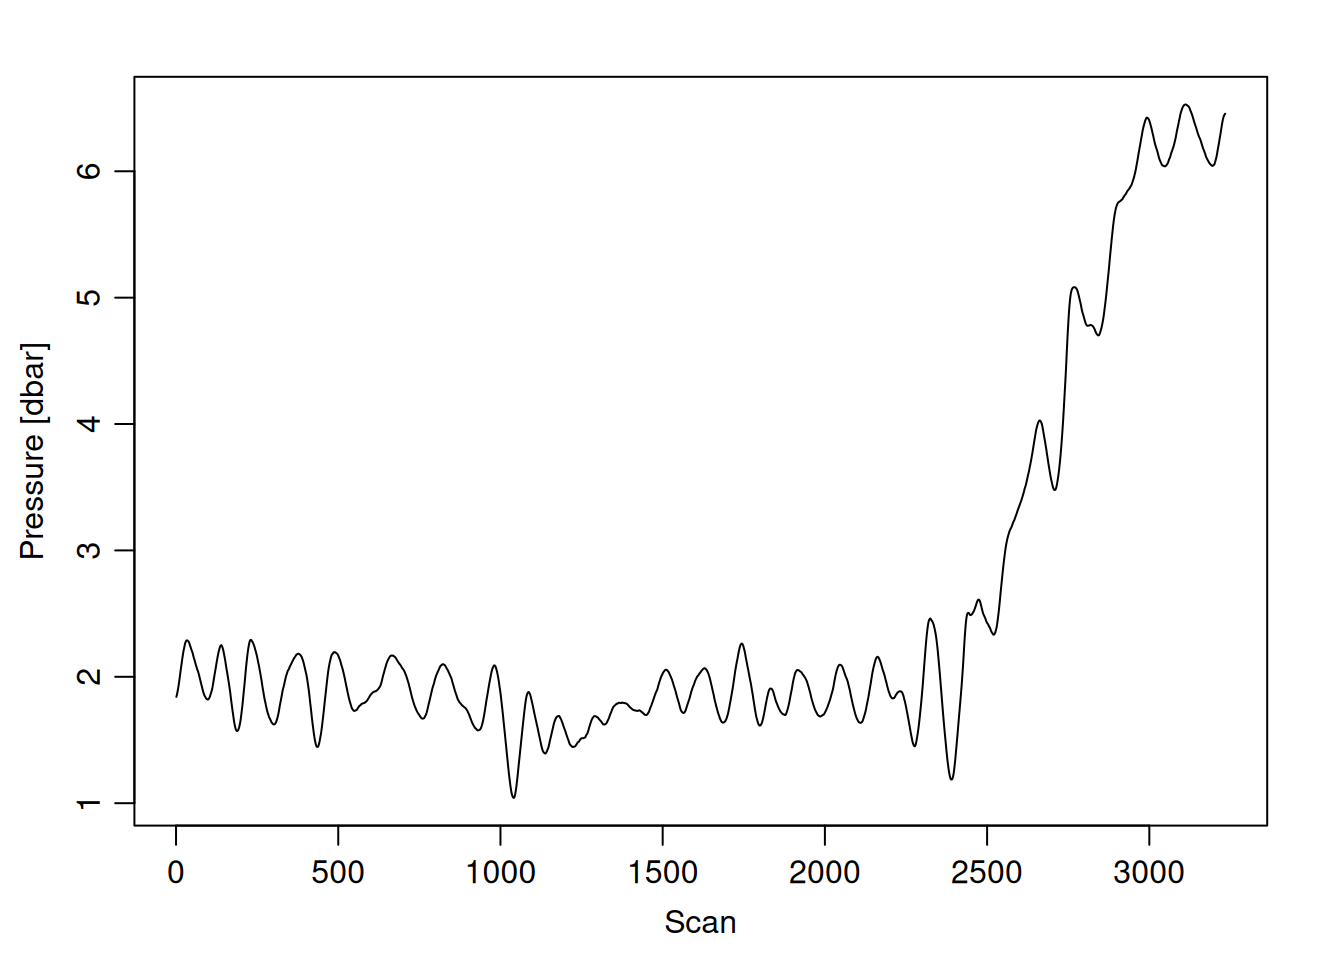
=== station: .033
# scans: 2894
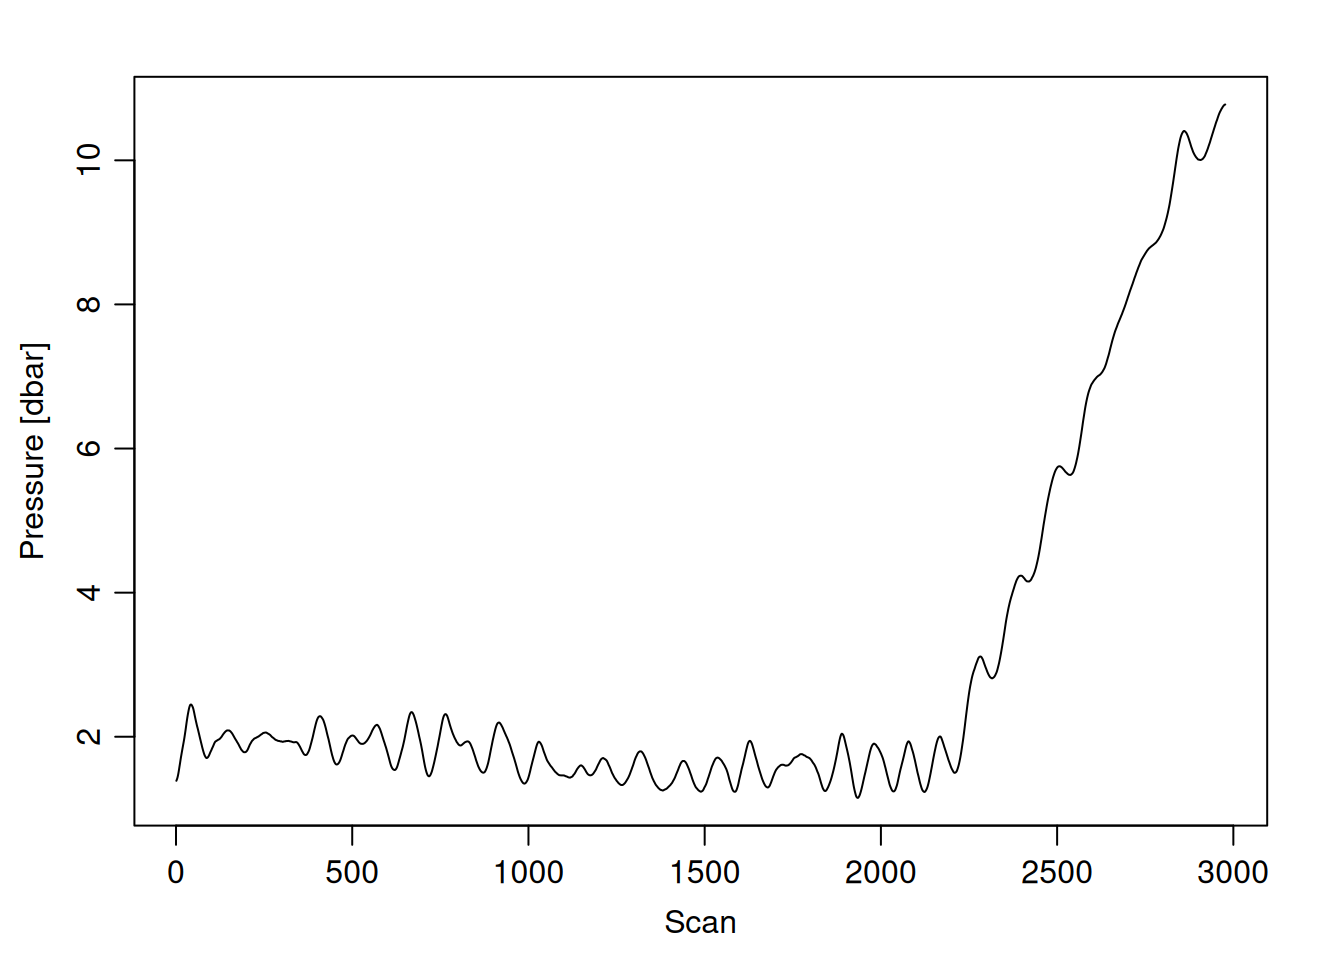
=== station: .041
# scans: 2952
=== station: .045
# scans: 3062
=== station: .047
# scans: 2812
=== station: .049
# scans: 144
=== station: .051
# scans: 2810
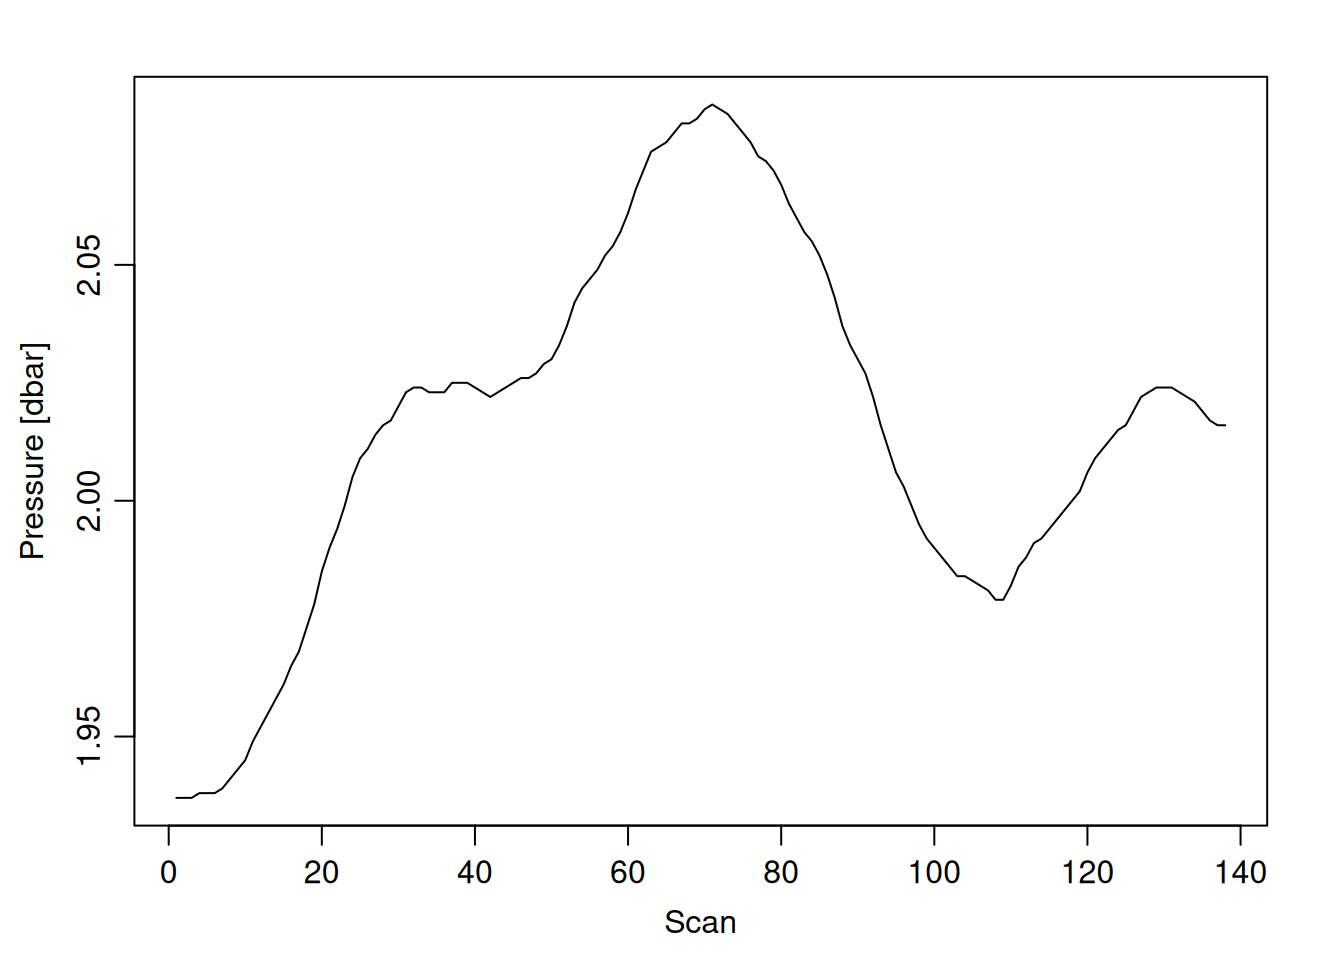
=== station: .053
# scans: 138
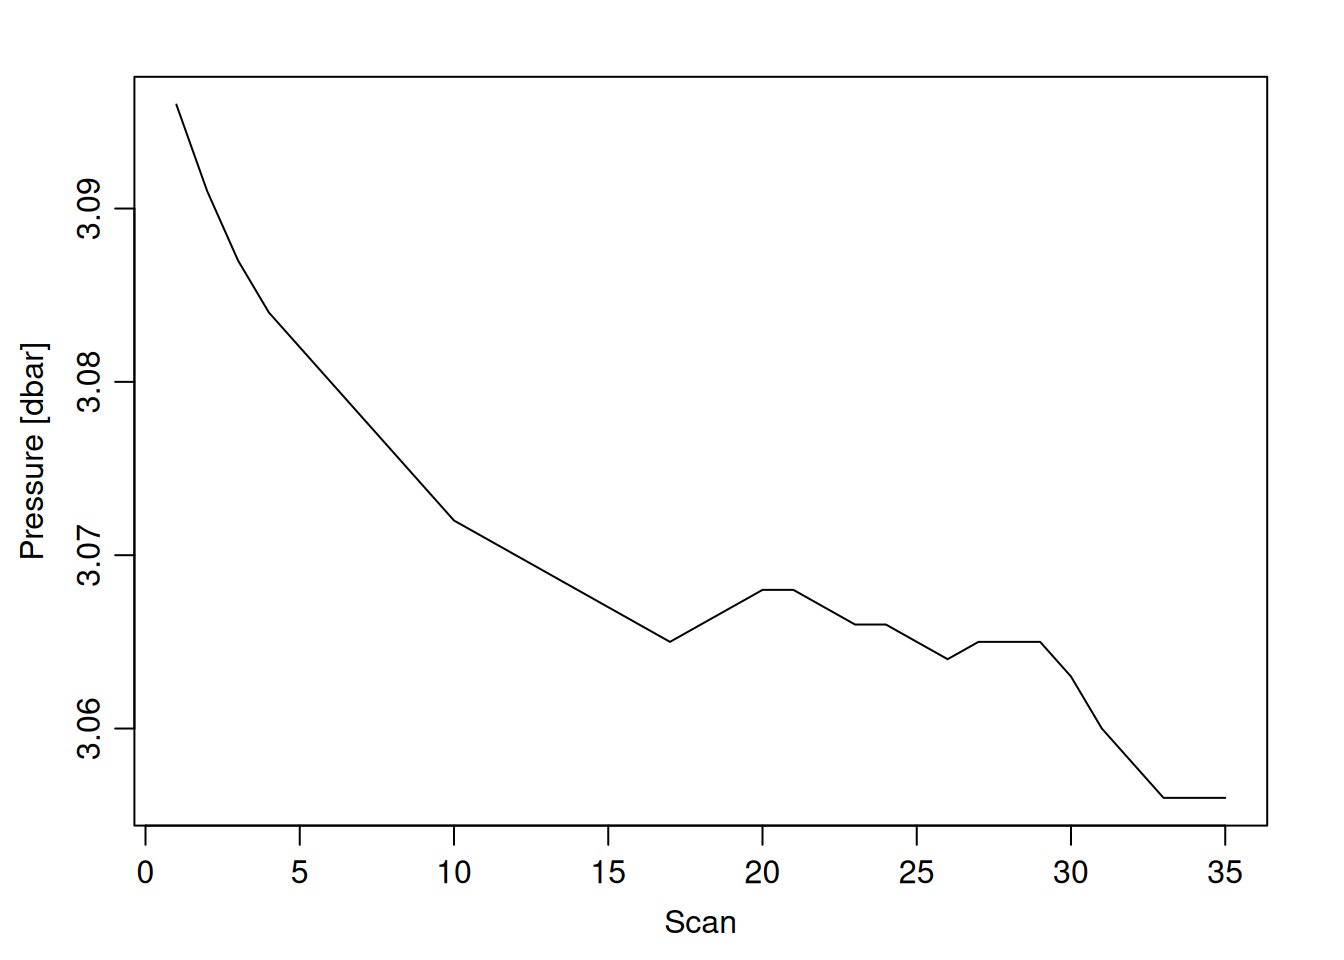
=== station: .054
# scans: 35
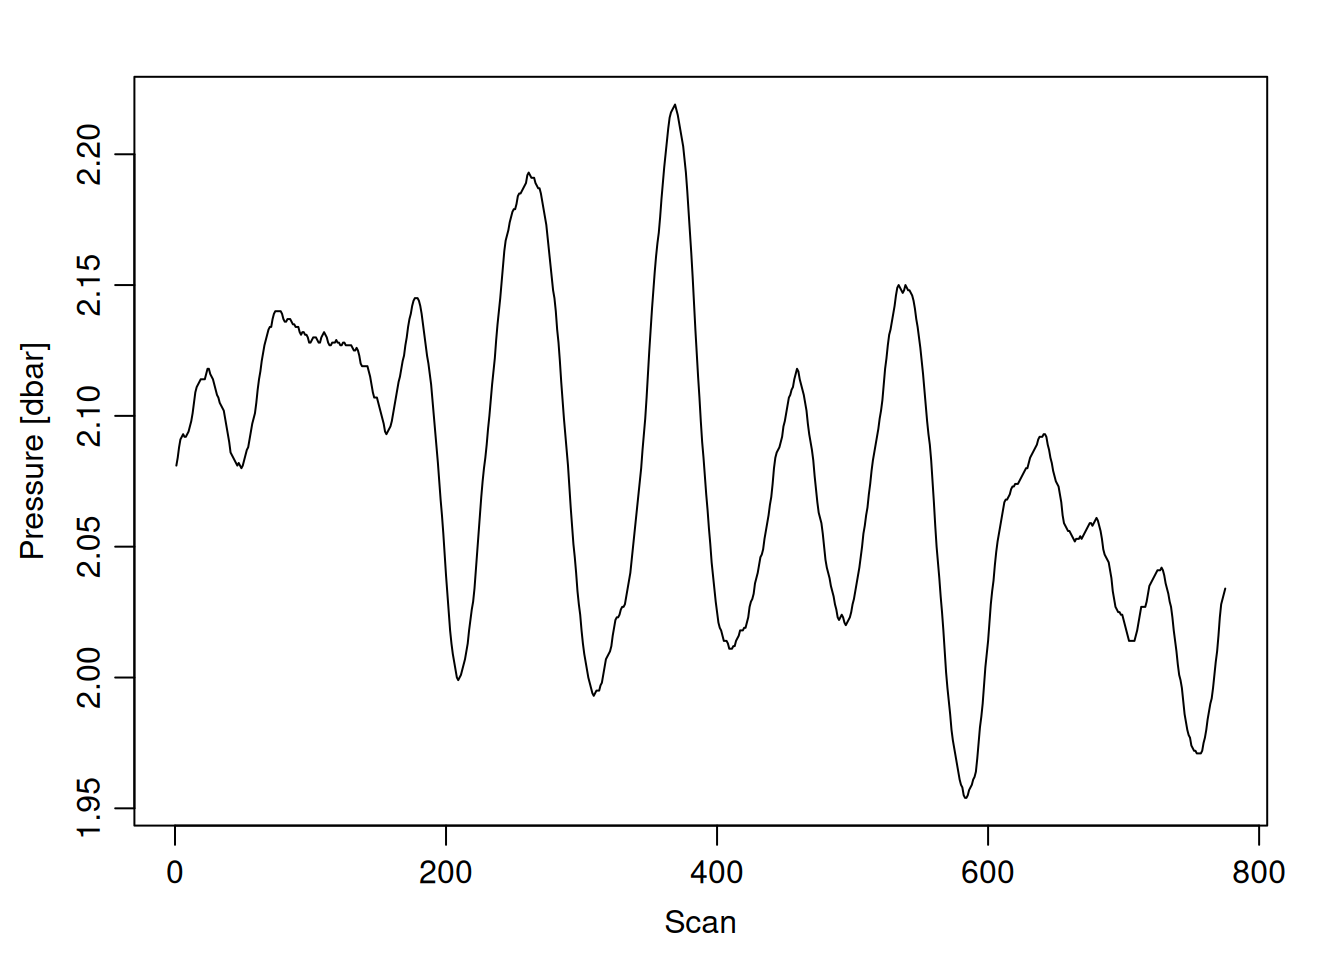
=== station: .055
# scans: 775
=== station: .056
# scans: 18
=== station: .057
# scans: 13
=== station: .057_1
# scans: 2949
=== station: .057_2
# scans: 4029
=== station: .057_3
# scans: 4266
=== station: .058
# scans: 4254
=== station: .060
# scans: 3216
=== station: .064
# scans: 92
=== station: .065
# scans: 52
=== station: .068
# scans: 2678
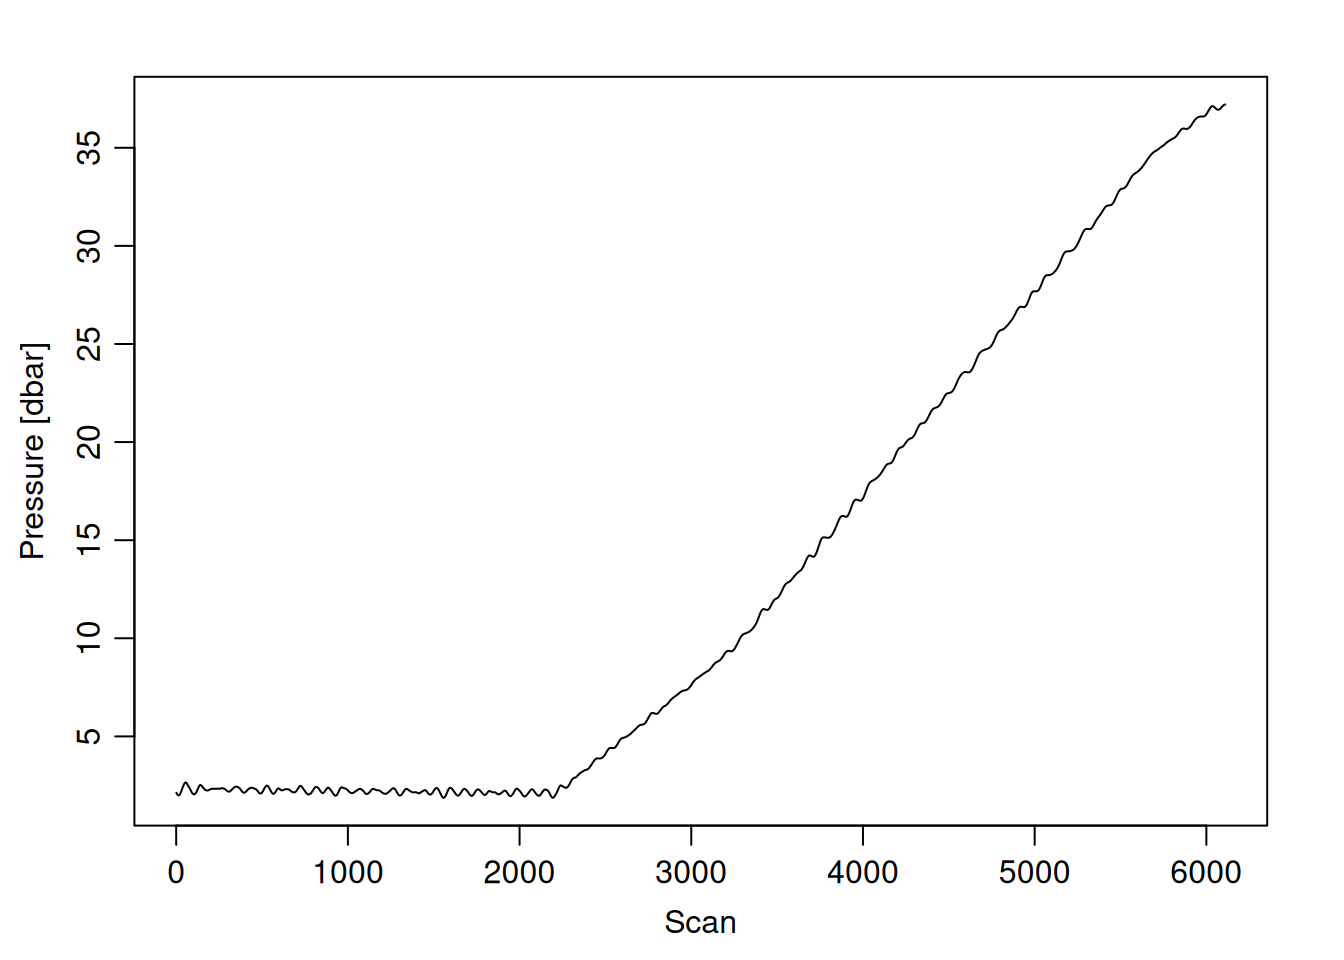
=== station: .21LK
# scans: 6110
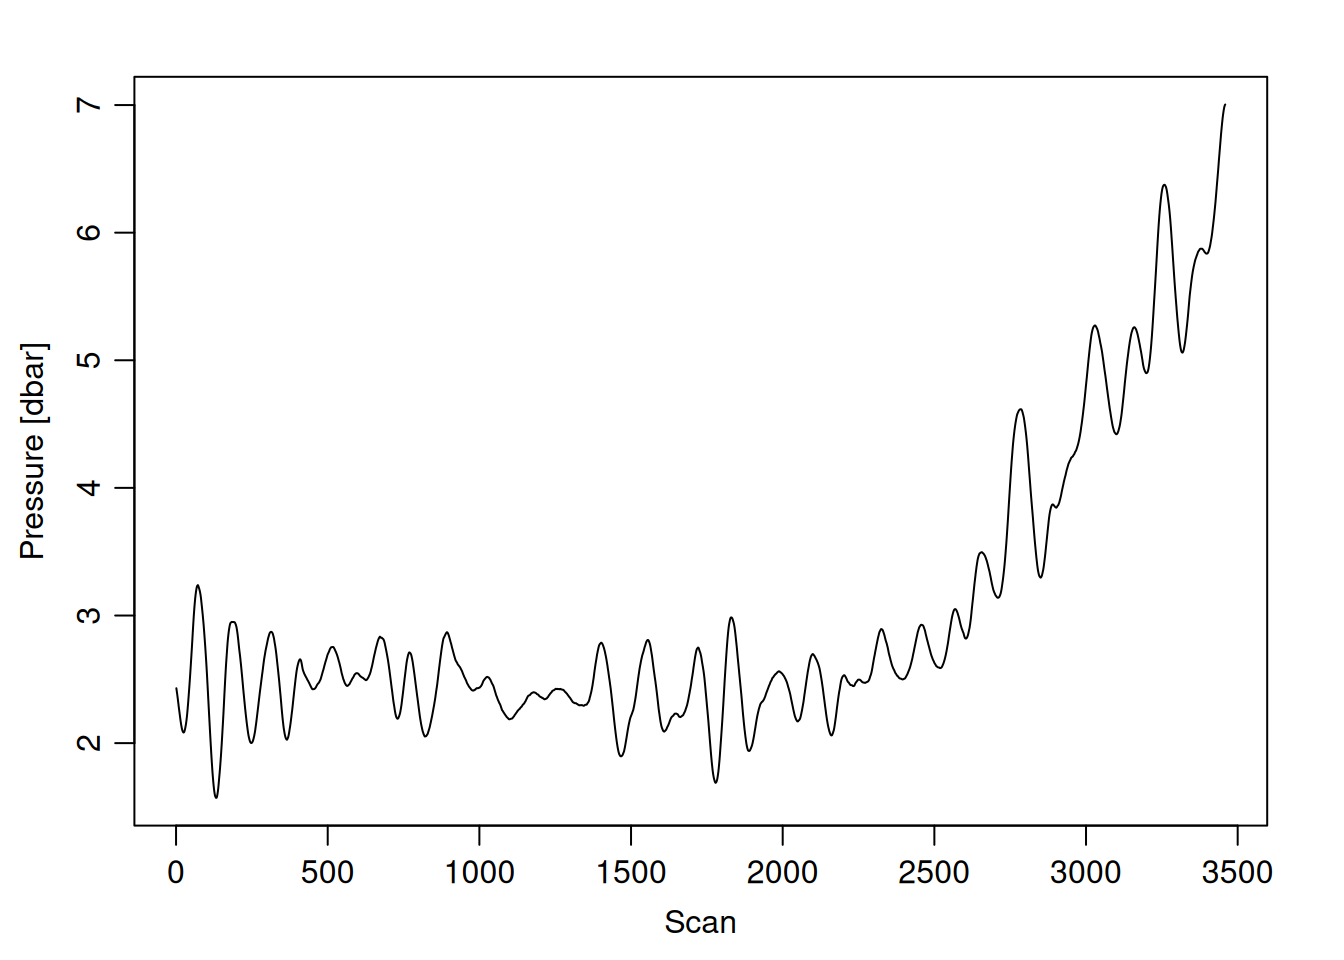
=== station: .AMI1
# scans: 3459
=== station: .AMI2
# scans: 2845
=== station: .AMI3
# scans: 4106
=== station: .AMI4
# scans: 4335
=== station: .AMI5
# scans: 4708
=== station: .AMI6
# scans: 5013
=== station: .AMI7
# scans: 5509
=== station: .AMI8
# scans: 5573
=== station: .AMI9
# scans: 6866
=== station: .BG1
# scans: 3502
=== station: .BG2
# scans: 4069
=== station: .BG3
# scans: 3768
=== station: .BG4
# scans: 4155
=== station: .CAL1
# scans: 275
=== station: .CAL2
# scans: 3212
=== station: .CAL3
# scans: 3500
=== station: .CAL4
# scans: 3810
=== station: .CAL5
# scans: 4241
=== station: .CAL6
# scans: 5124
=== station: .CW1
# scans: 3244
=== station: .CW2
# scans: 3476
=== station: .CW3
# scans: 3757
=== station: .CW4
# scans: 5006
=== station: .GP5
# scans: 4612
=== station: .KW1
# scans: 3146
=== station: .KW2
# scans: 3512
=== station: .KW4
# scans: 4962
=== station: .MR
# scans: 4702
=== station: .RP1
# scans: 2899
=== station: .RP2
# scans: 3234
=== station: .RP3
# scans: 2977
=== station: .RP4
# scans: 4057
=== station: .TB1
# scans: 2999
=== station: .TB10
# scans: 9390
=== station: .TB2
# scans: 3360
=== station: .TB3
# scans: 3803
=== station: .TB4
# scans: 3603
=== station: .TB5
# scans: 5371
=== station: .V1
# scans: 2817
=== station: .V2
# scans: 4168
=== station: .V3
# scans: 5294
=== station: .V4
# scans: 4775
=== station: .V5
# scans: 4238
=== station: .V6
# scans: 4426
=== station: .V7
# scans: 5896
=== station: .V8
# scans: 5761
=== station: .V9
# scans: 4927
=== station: .WS
# scans: 3826
plotting each cast in the first list
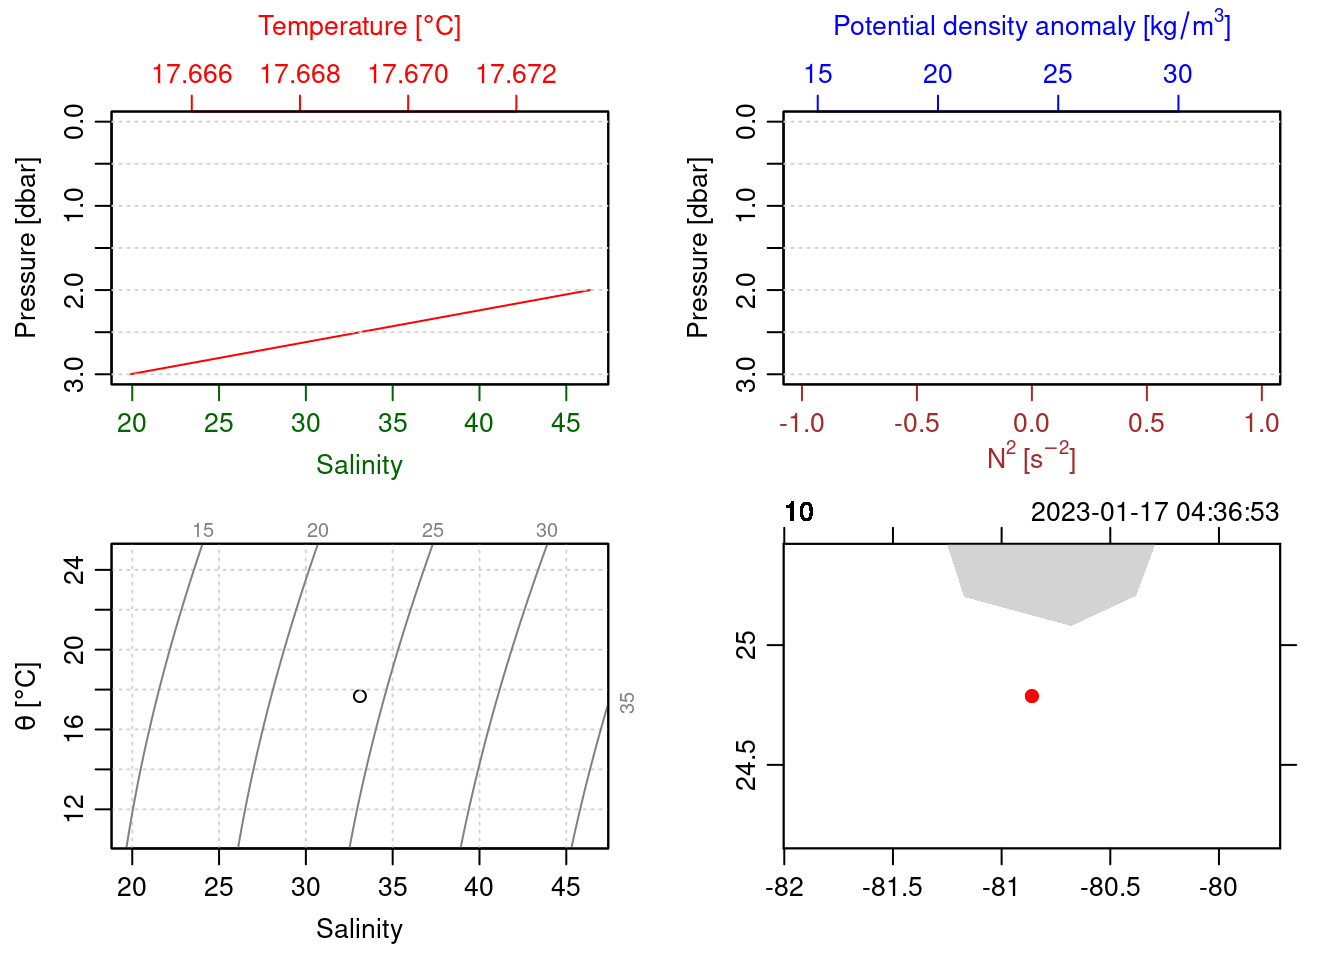
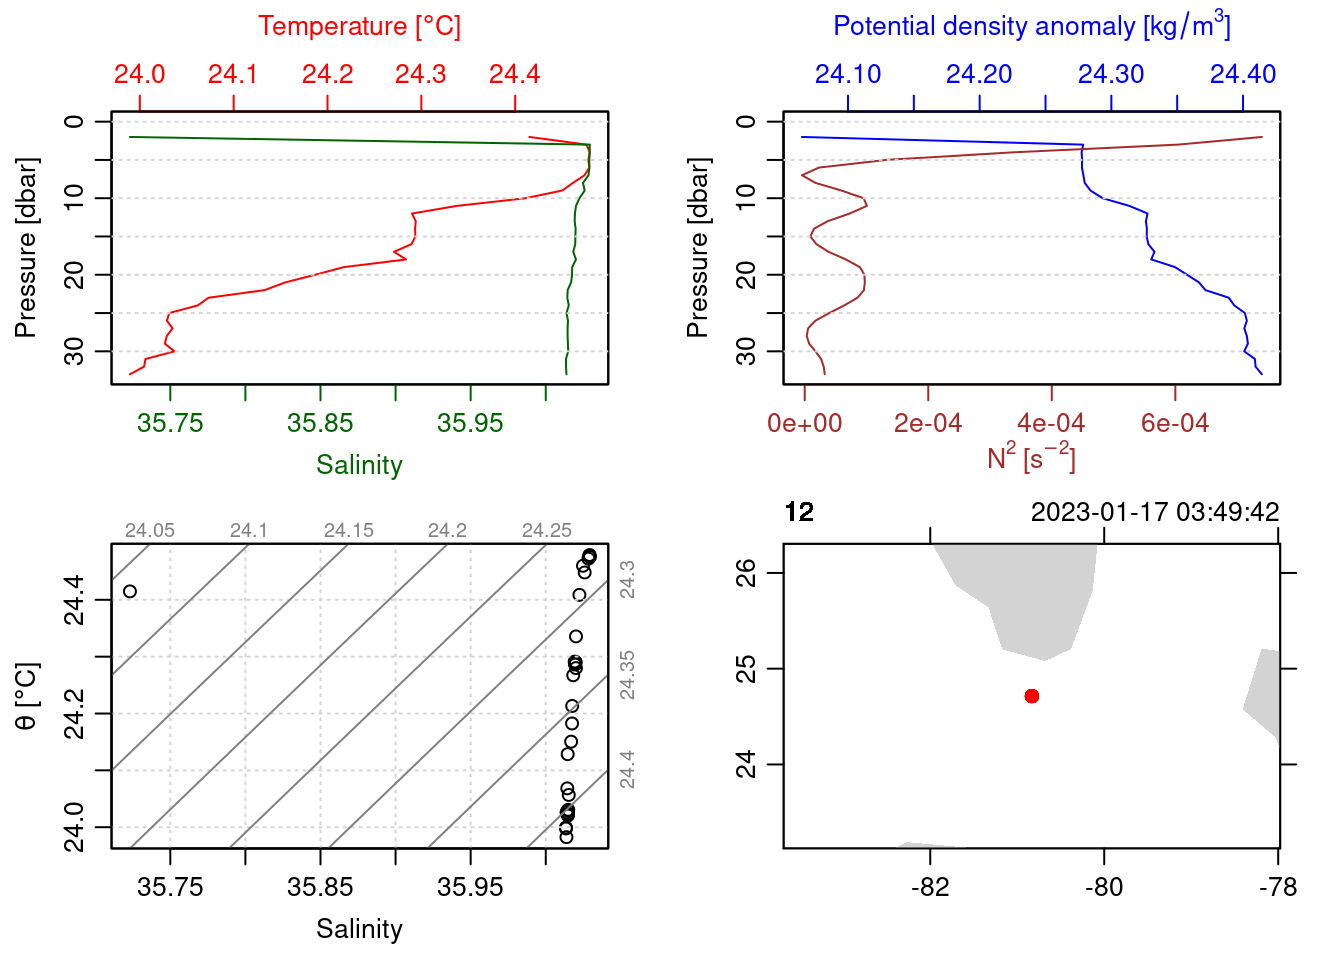
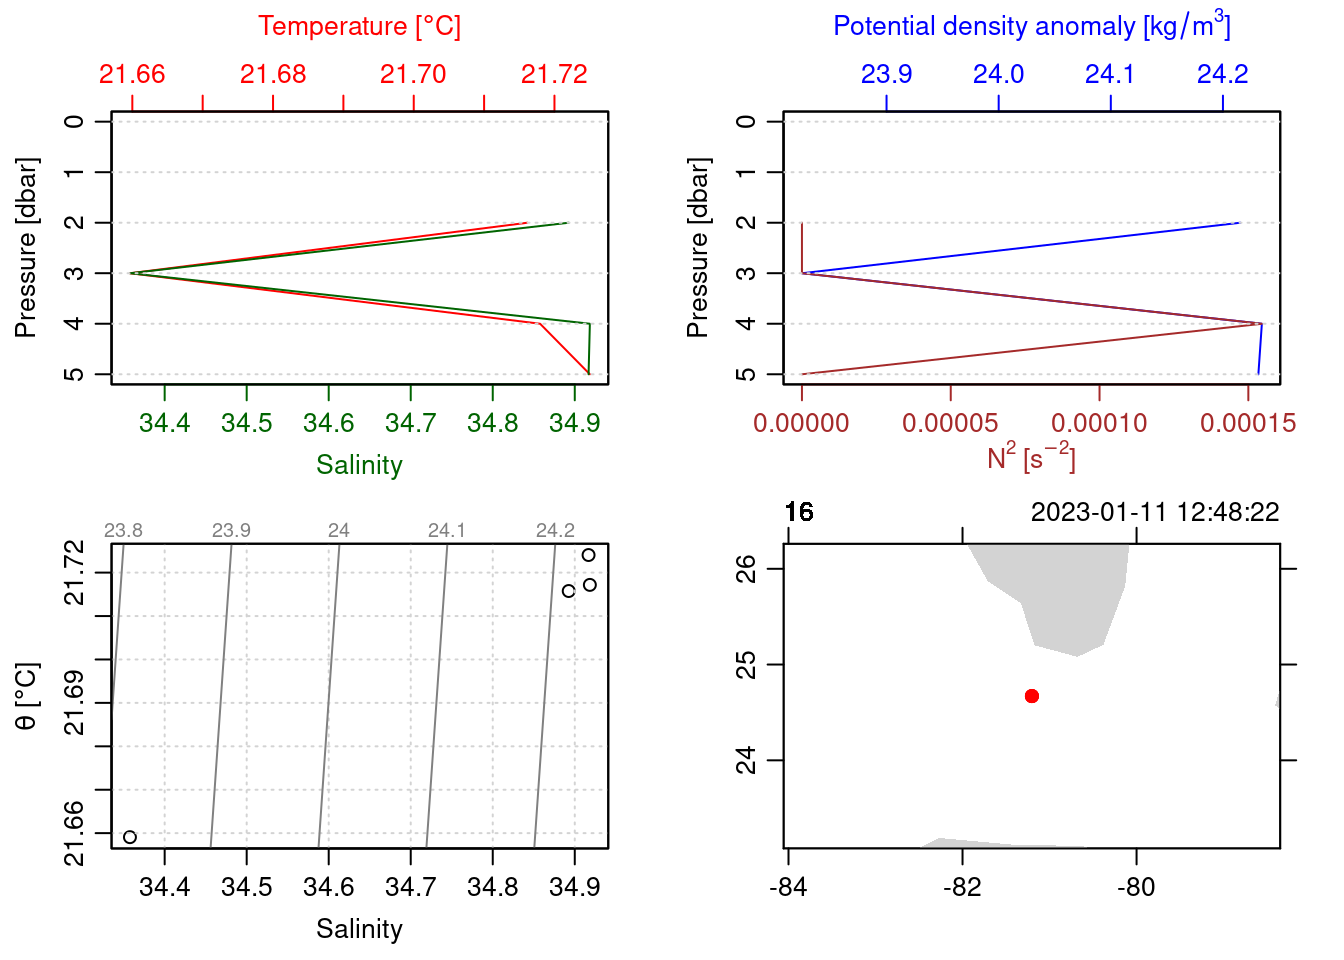
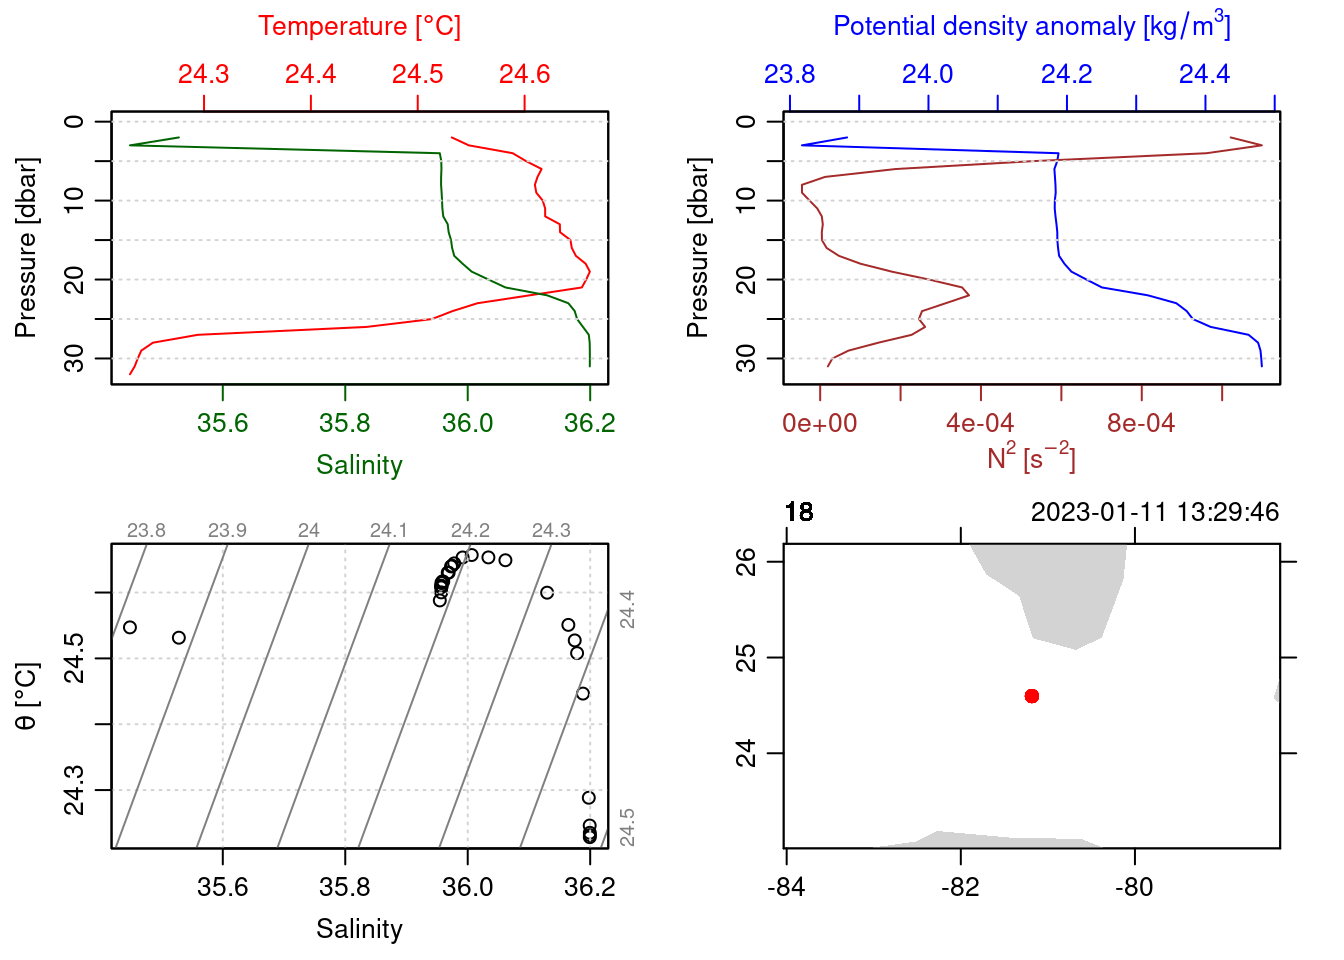
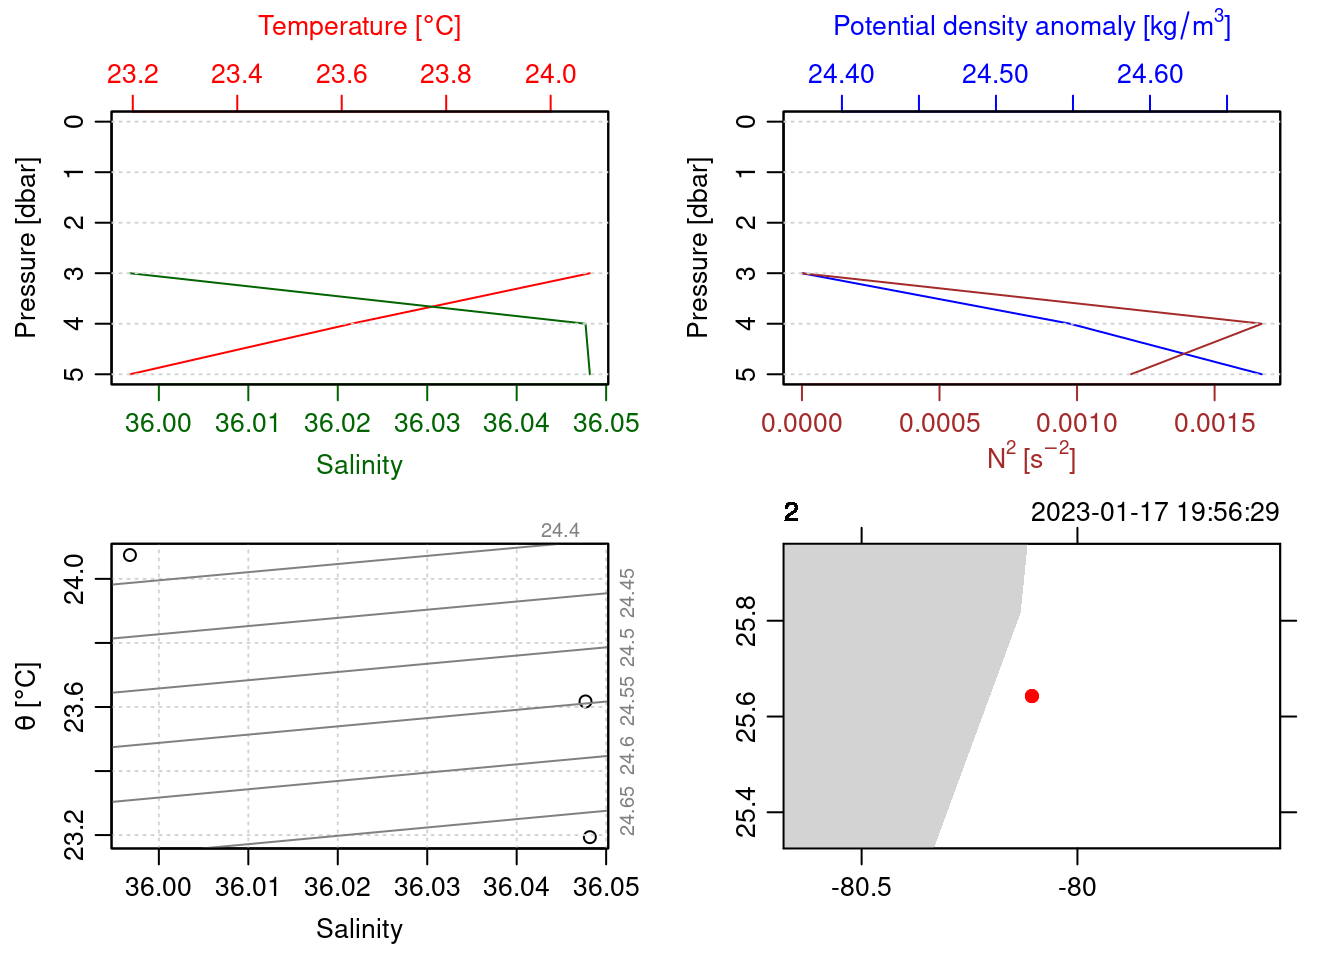
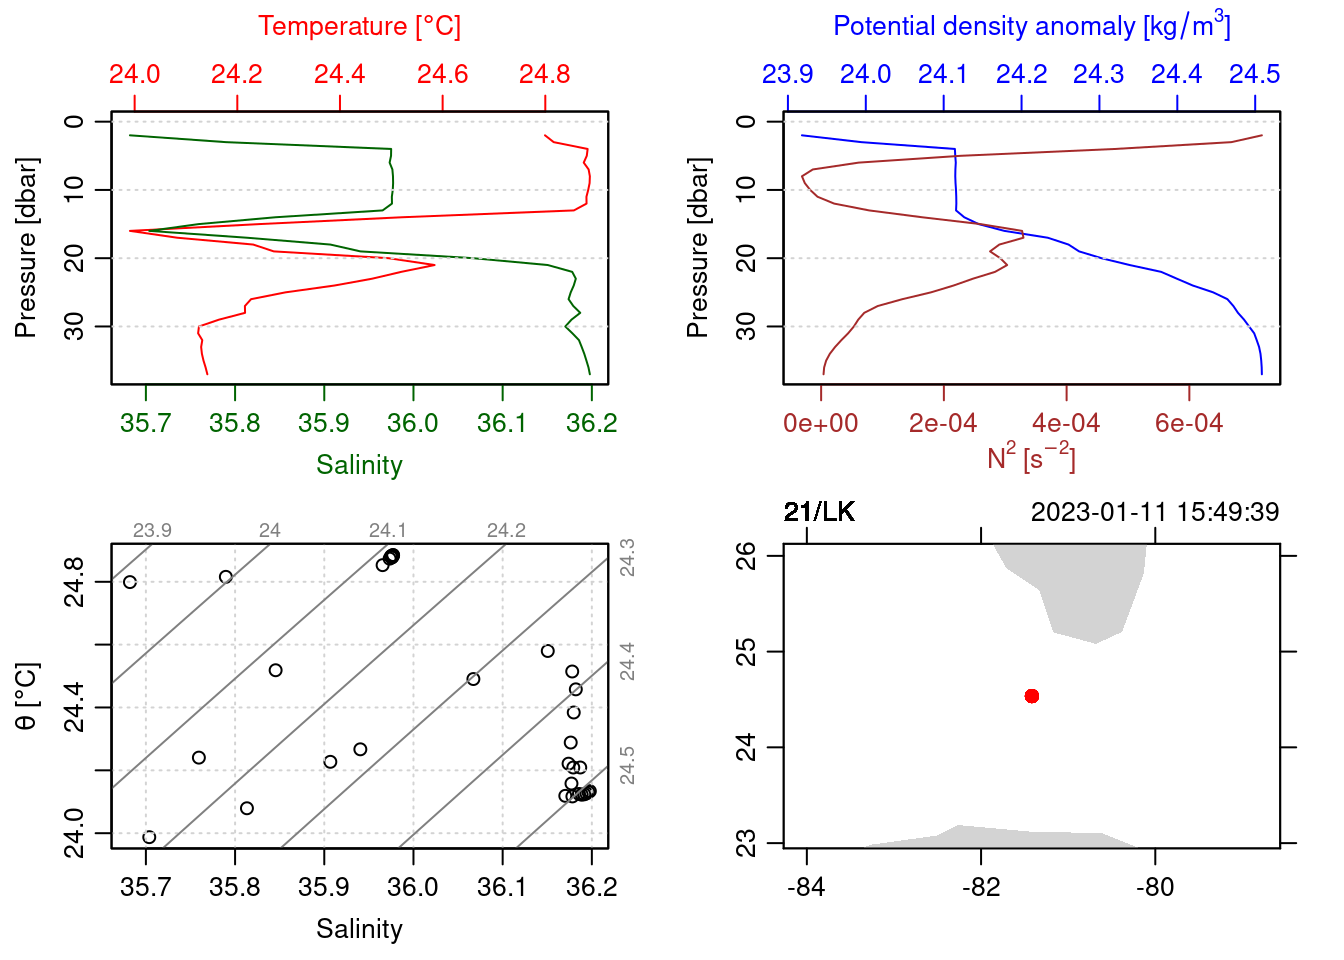
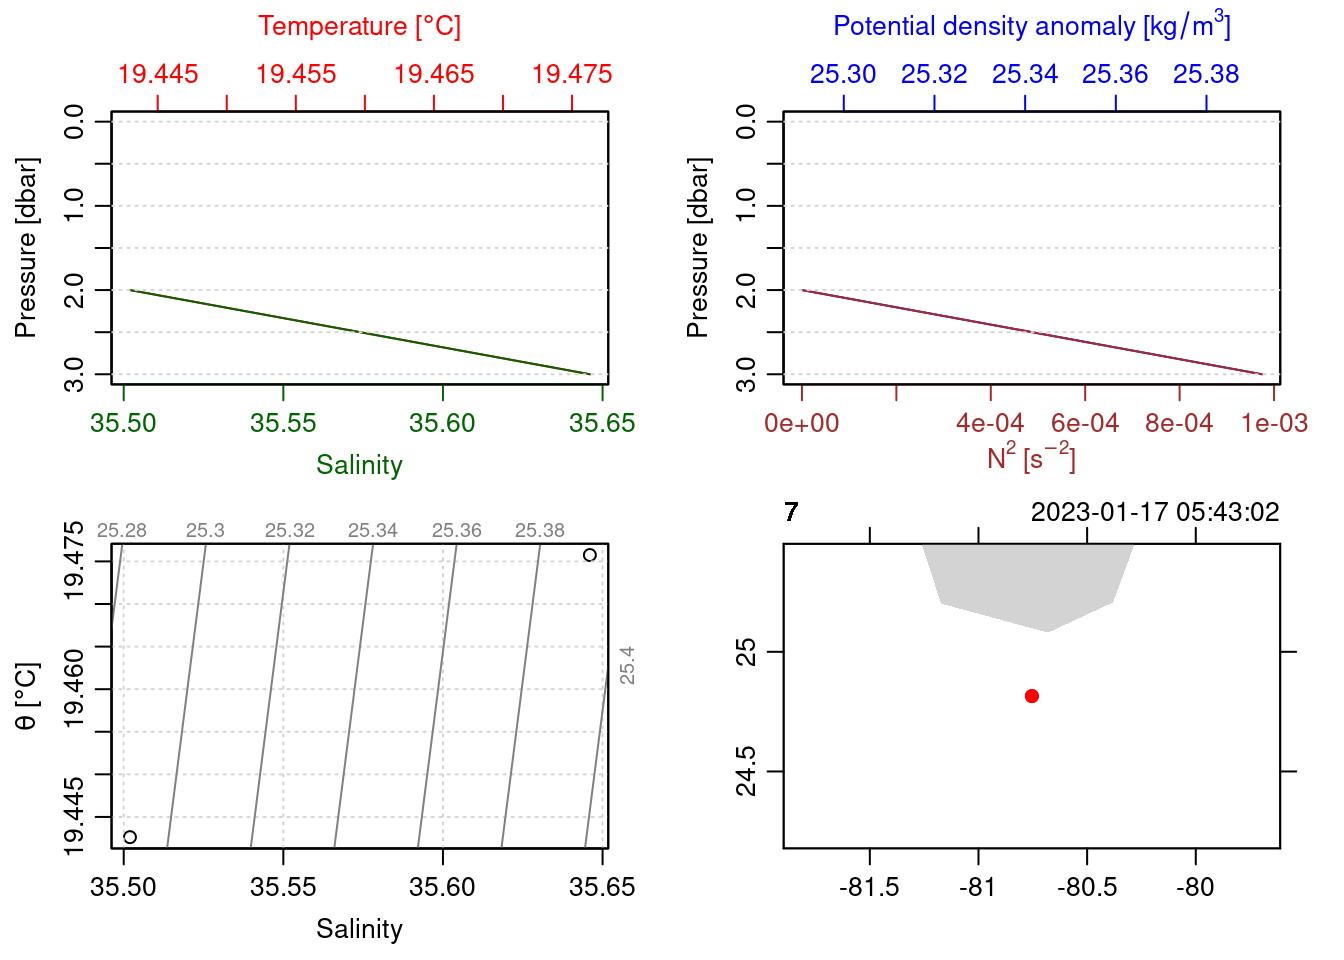
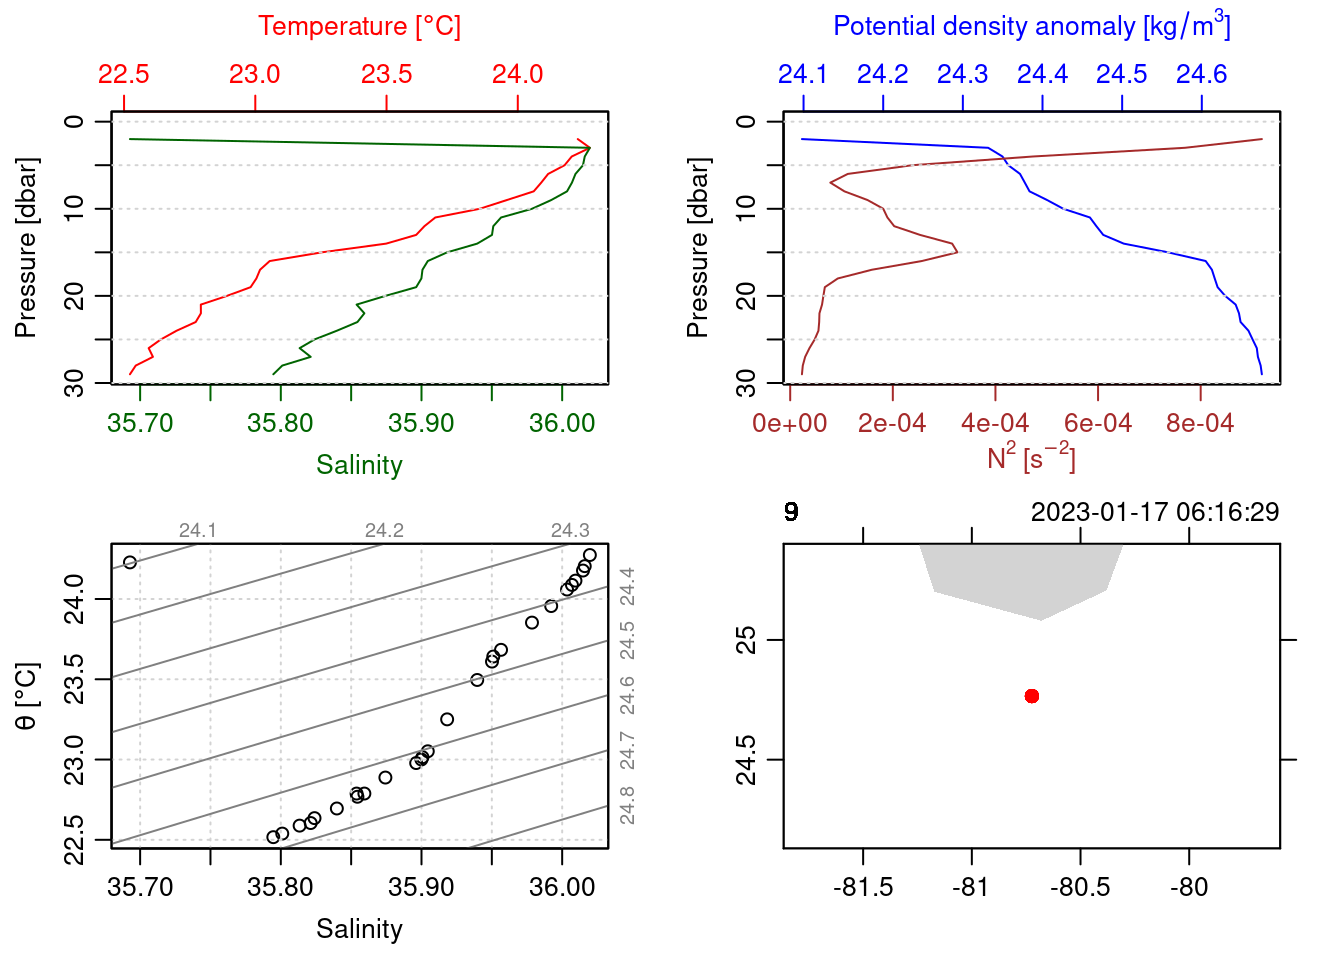
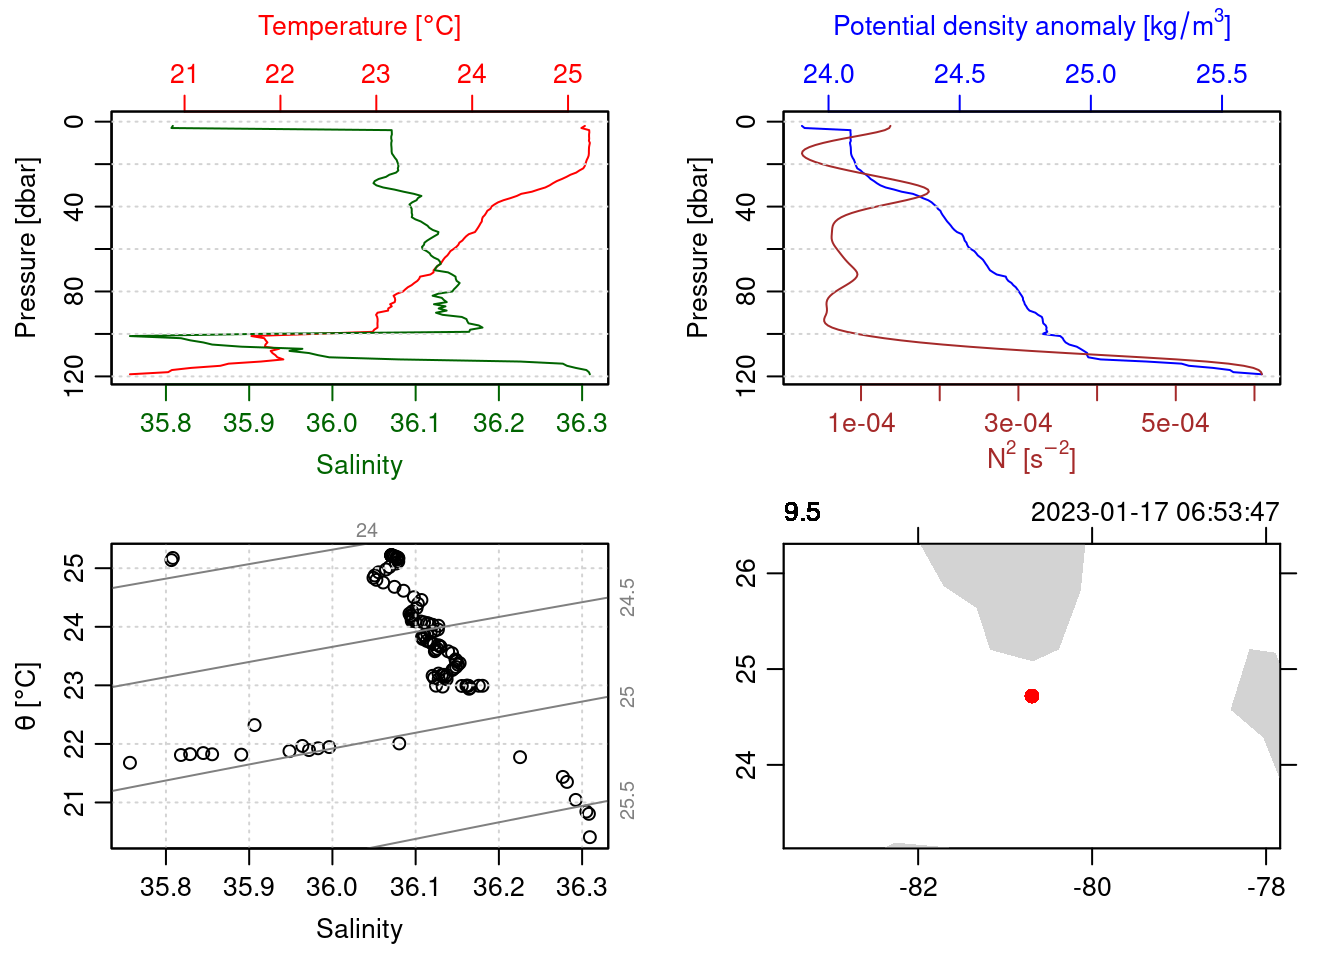
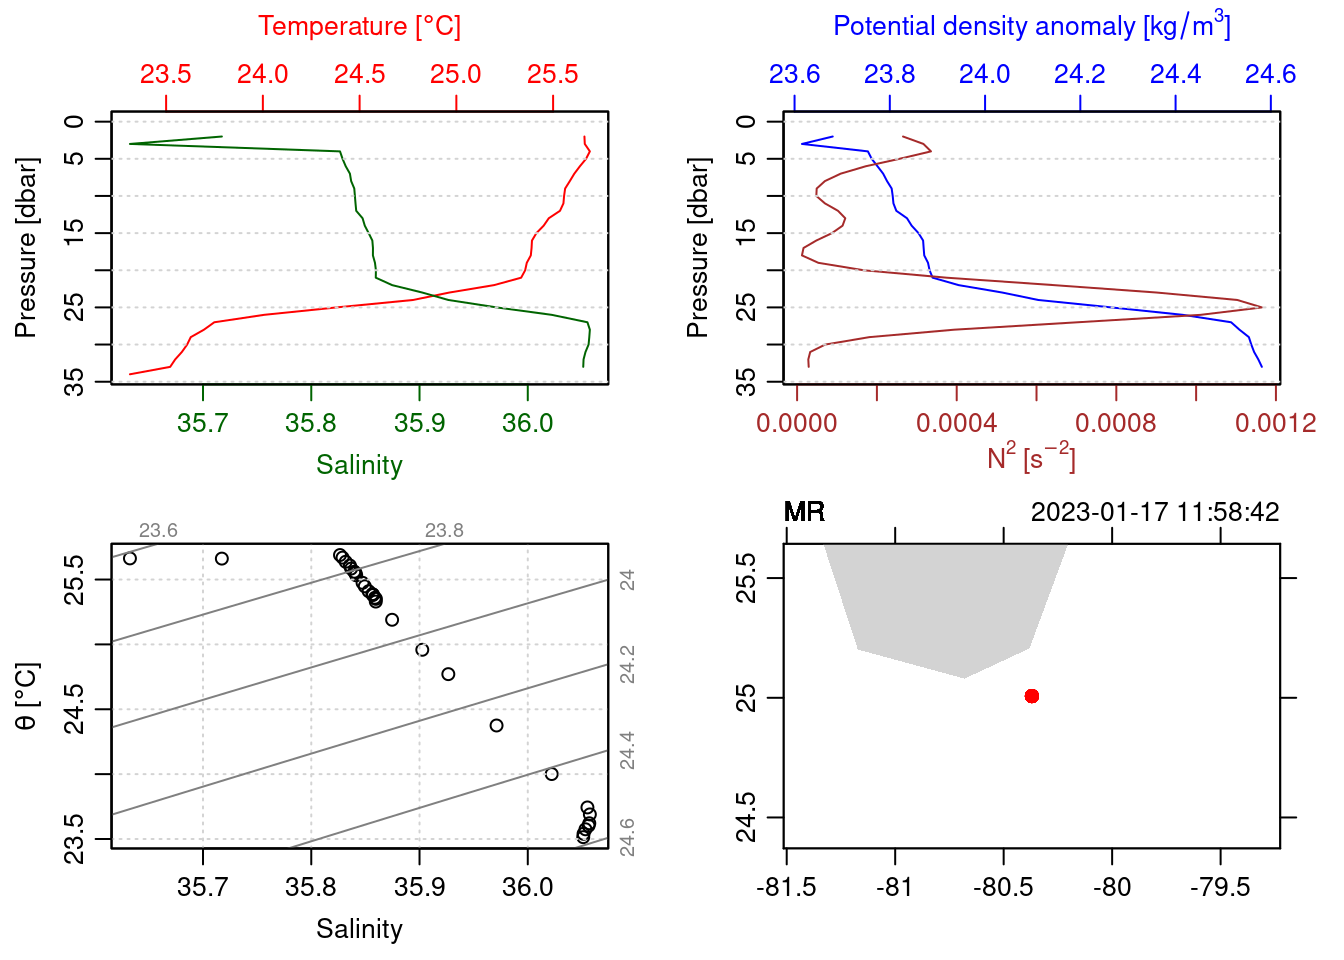
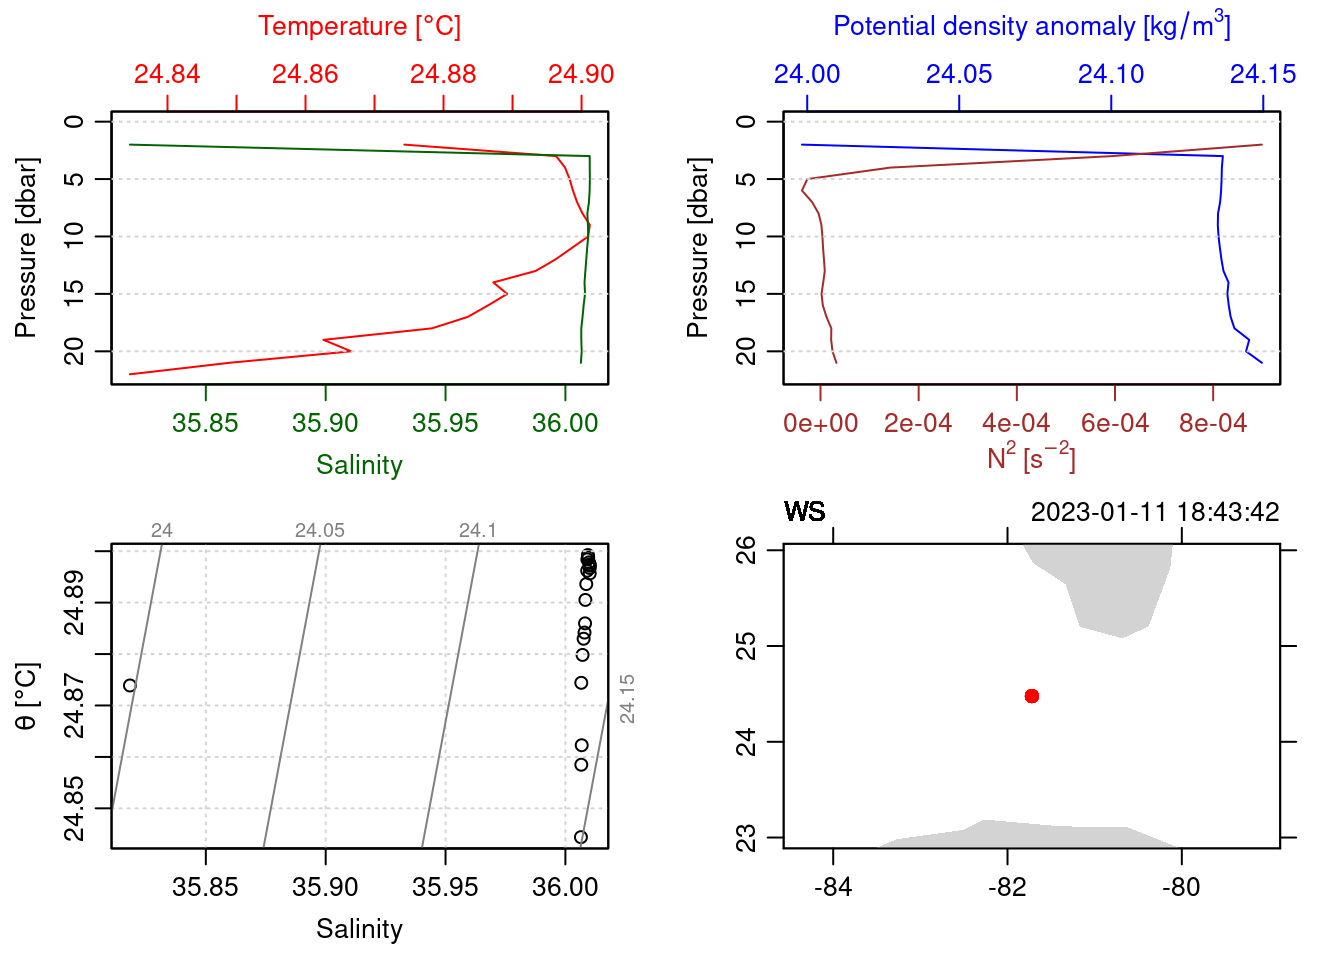
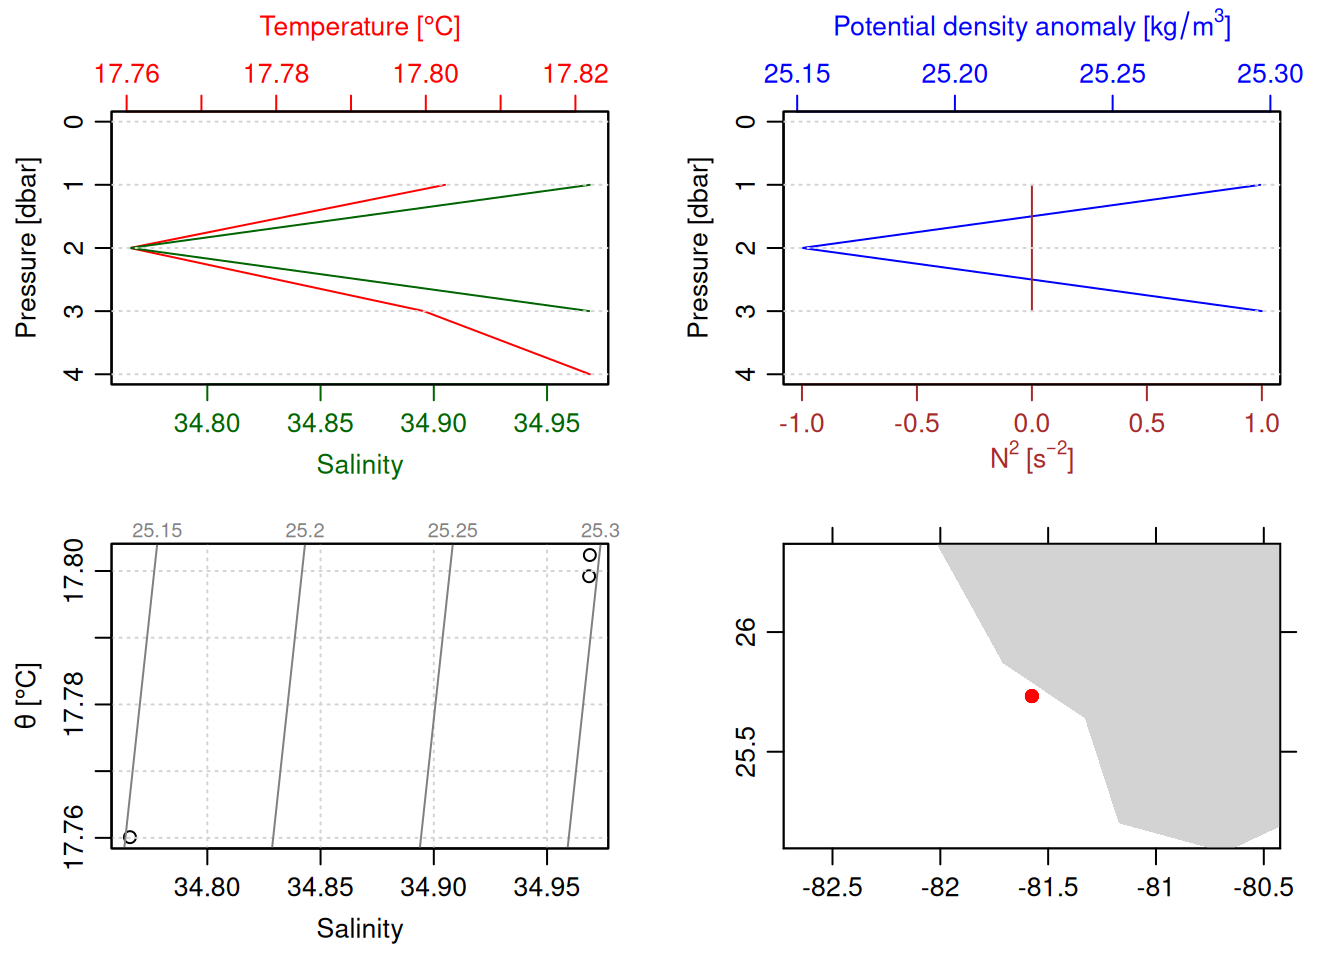
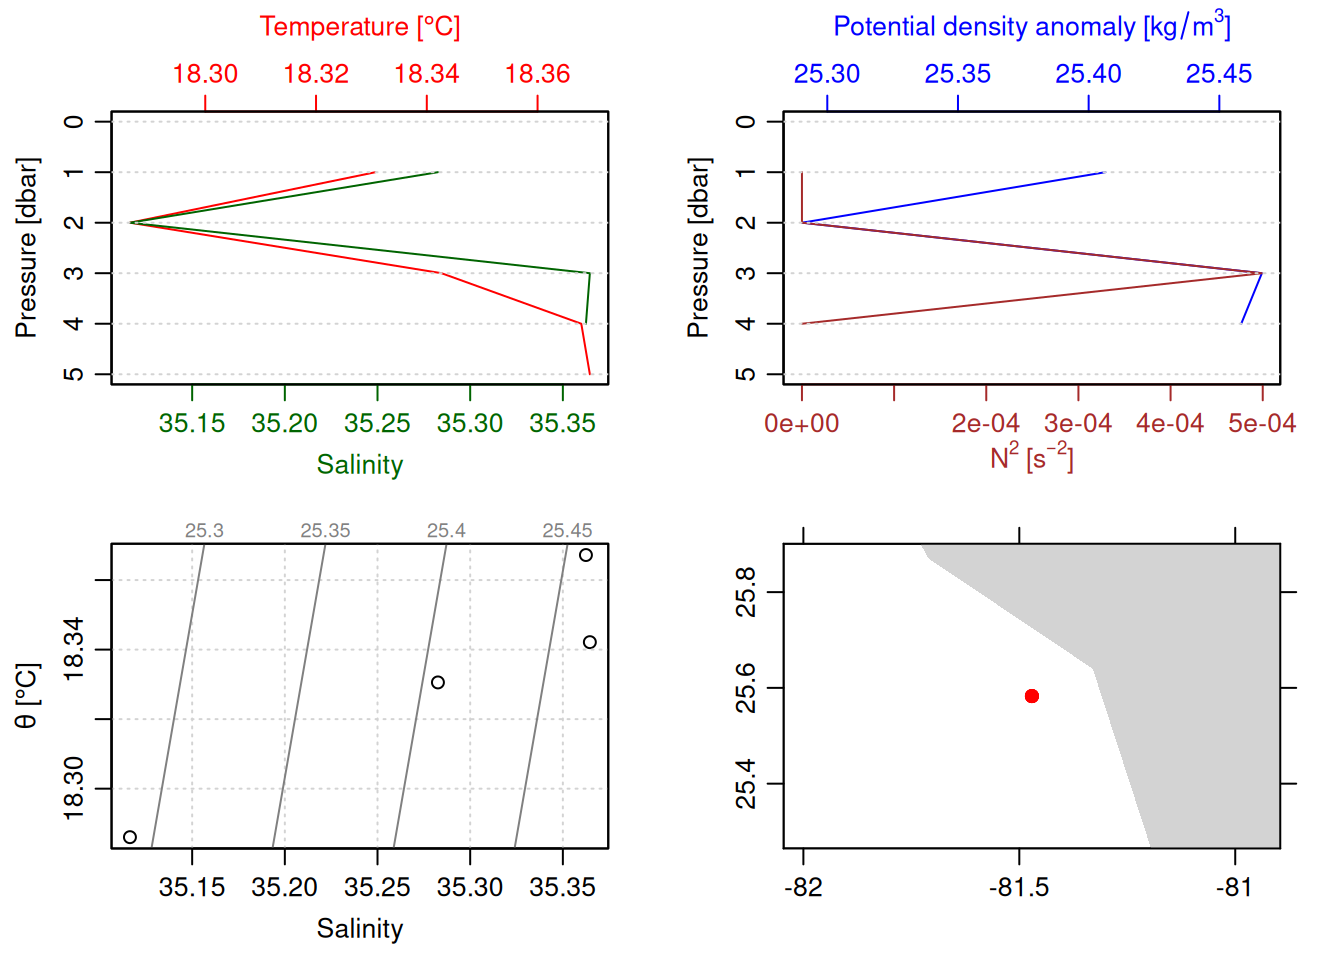
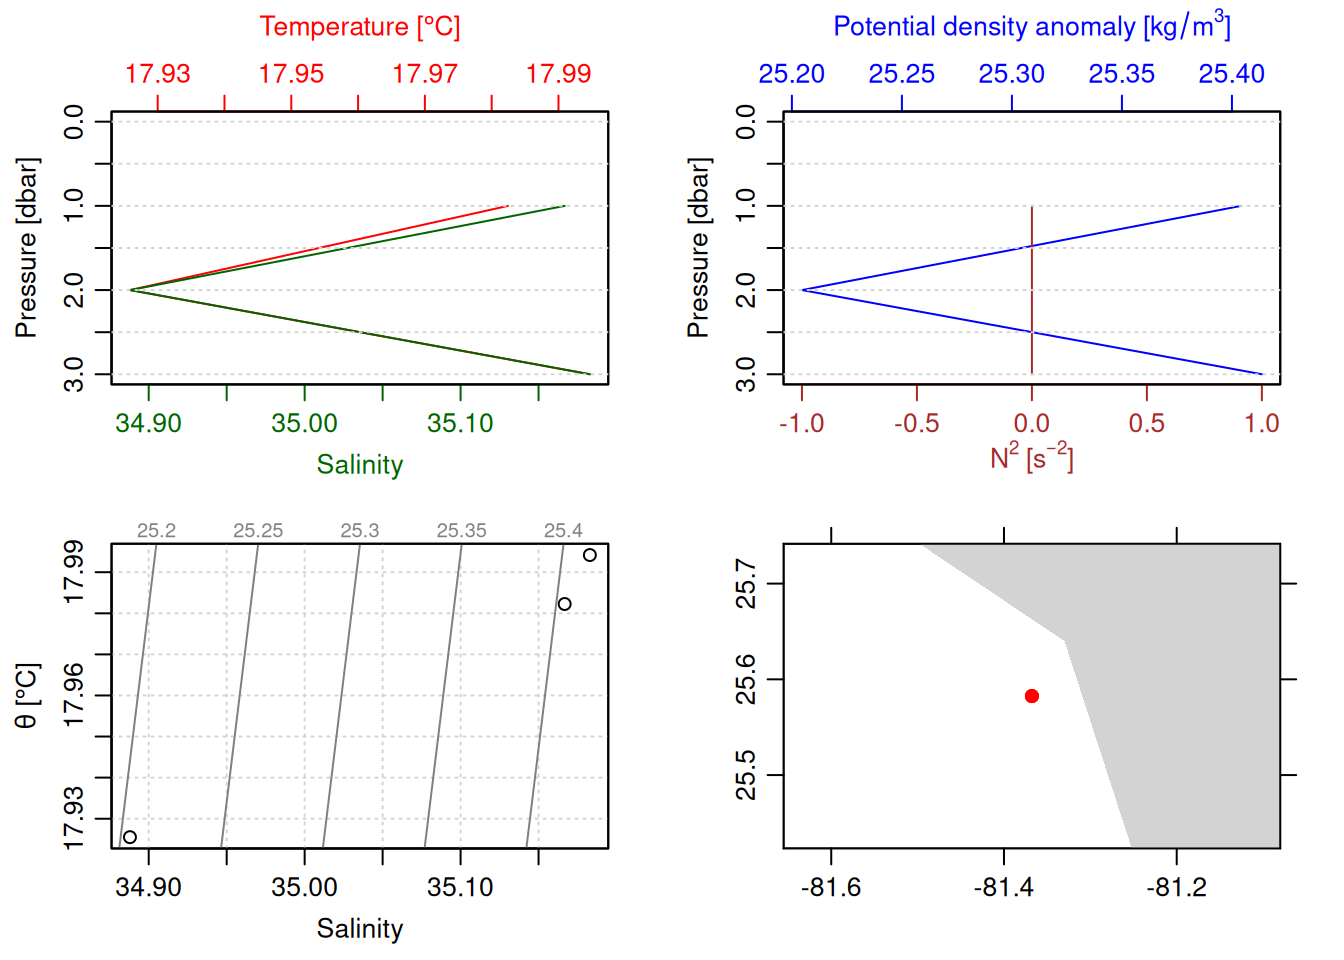
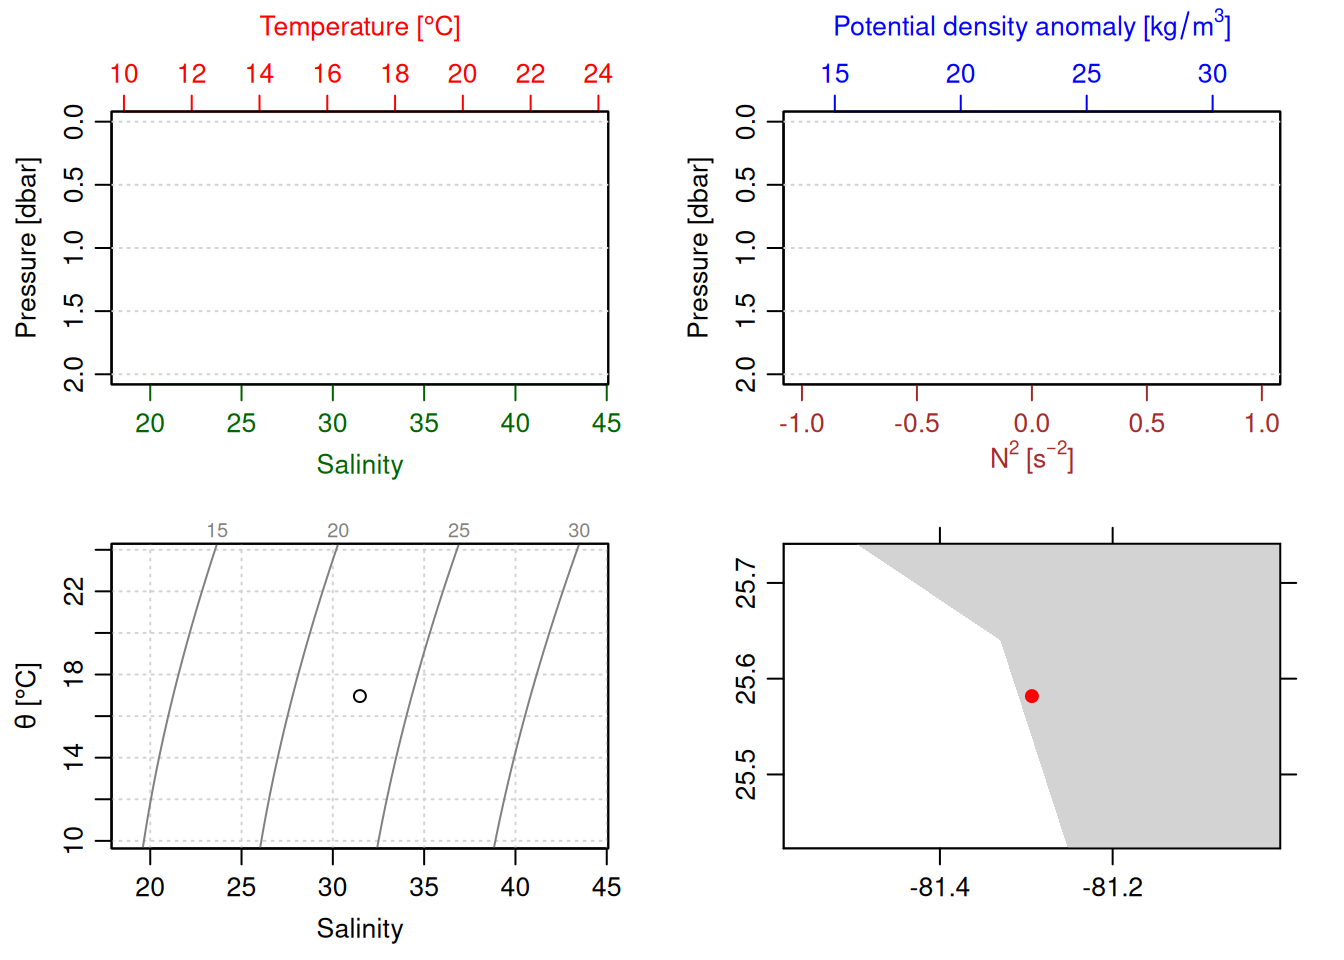
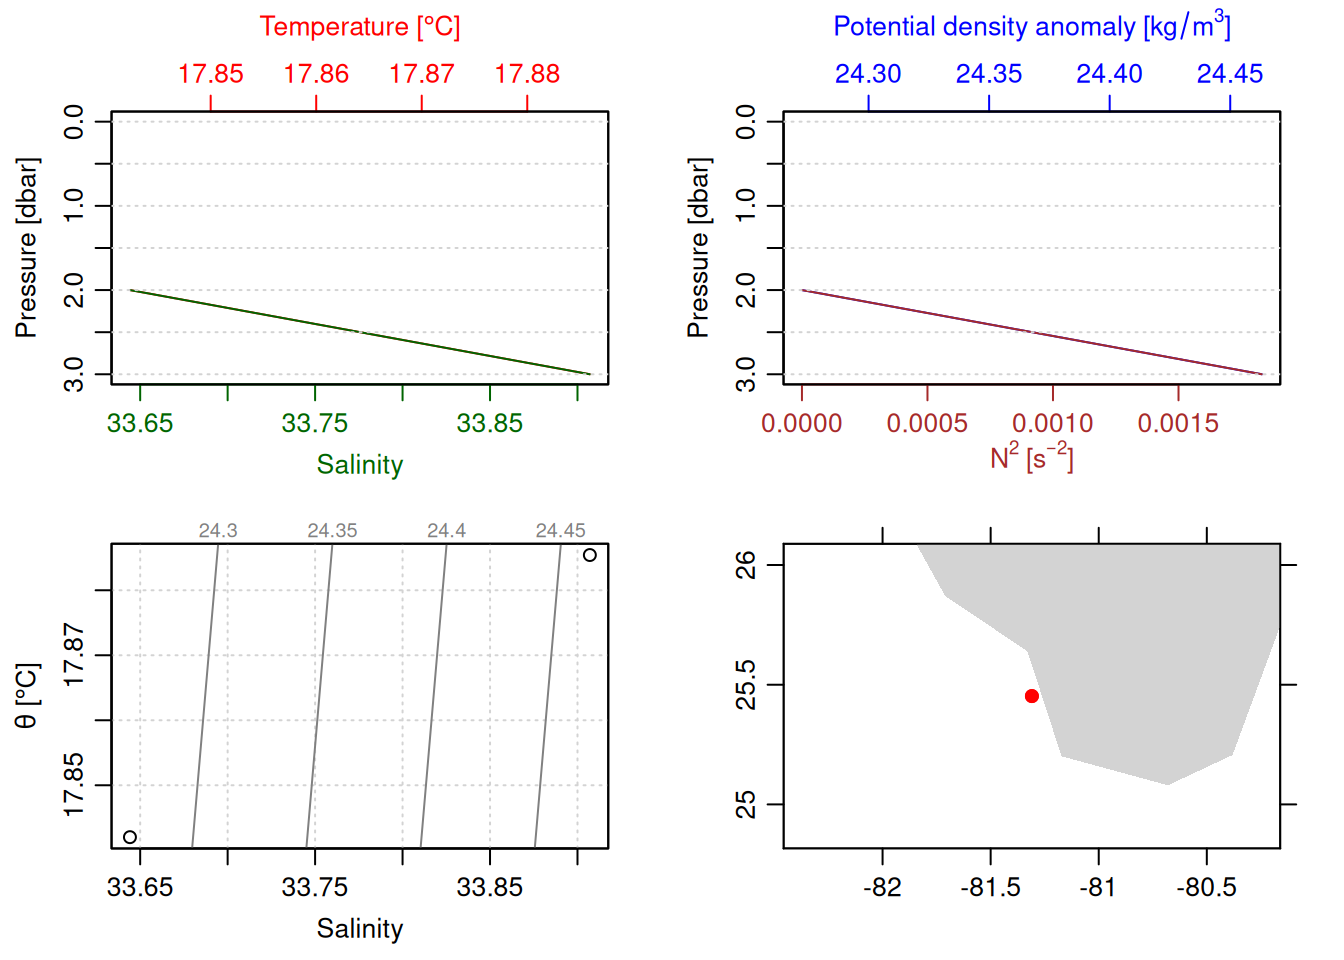
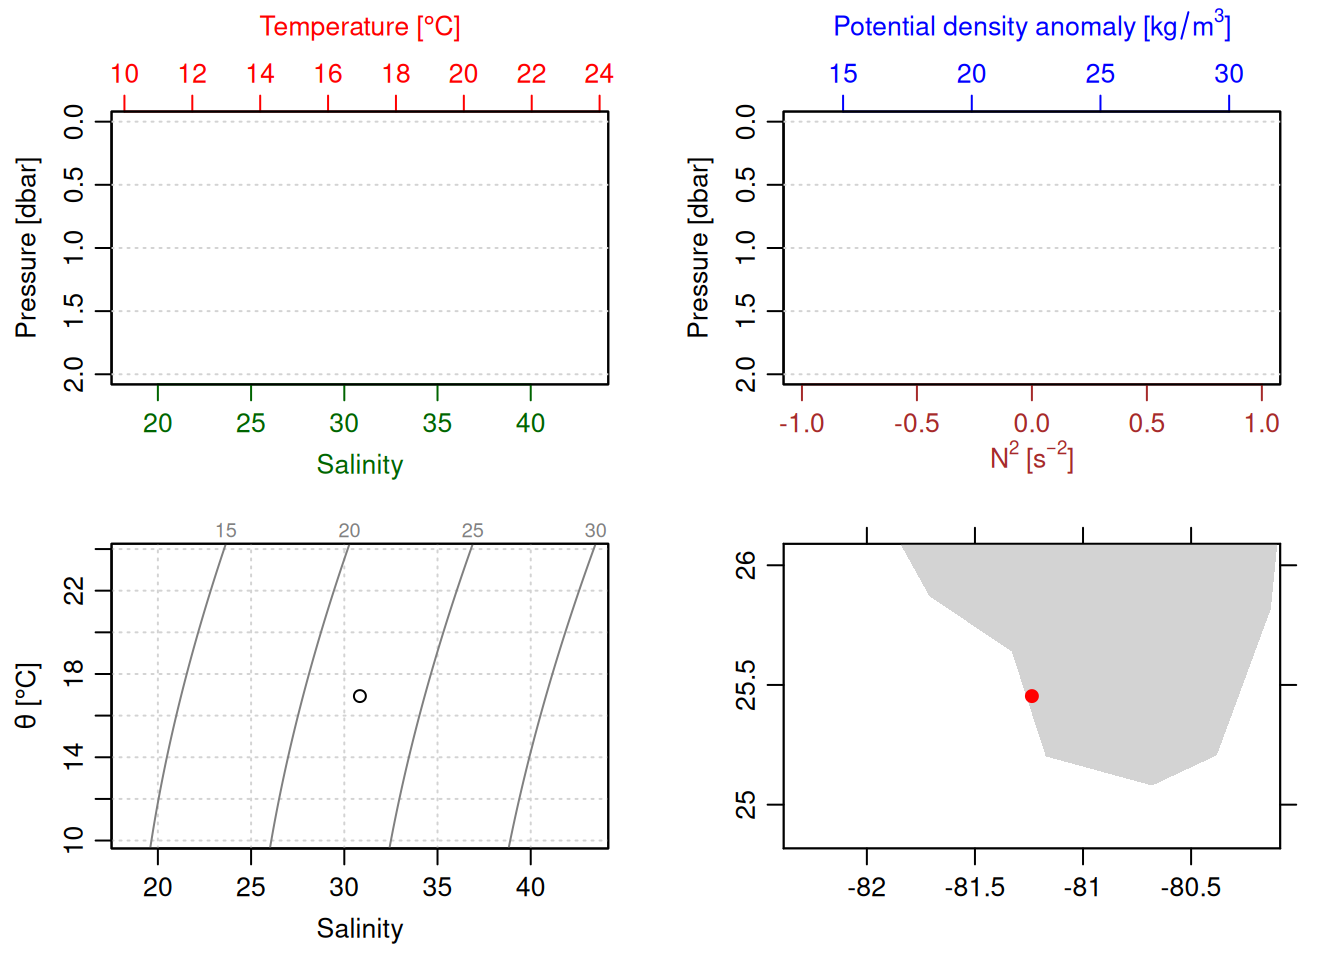
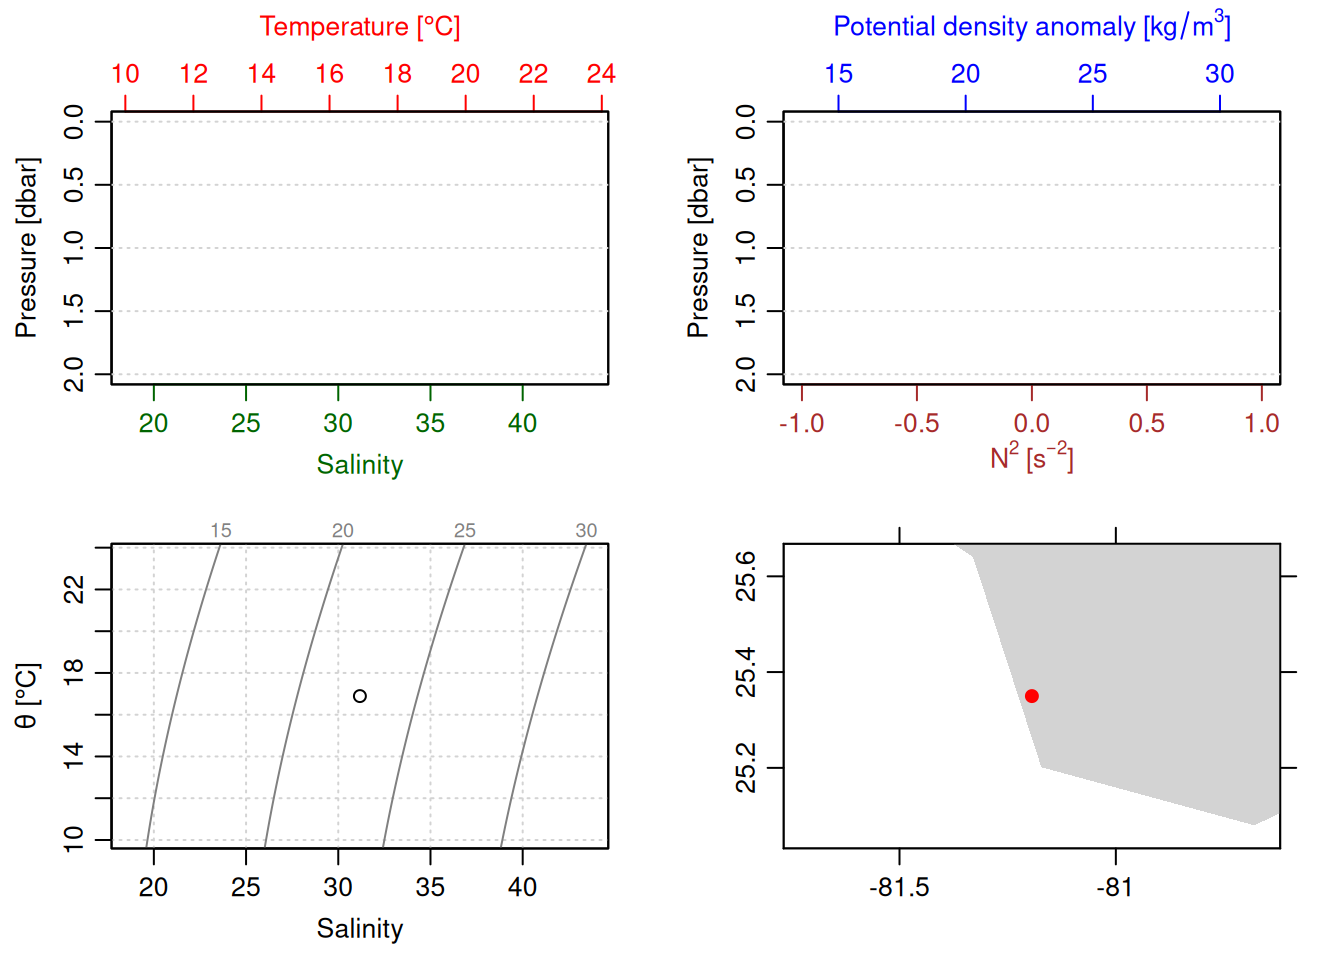
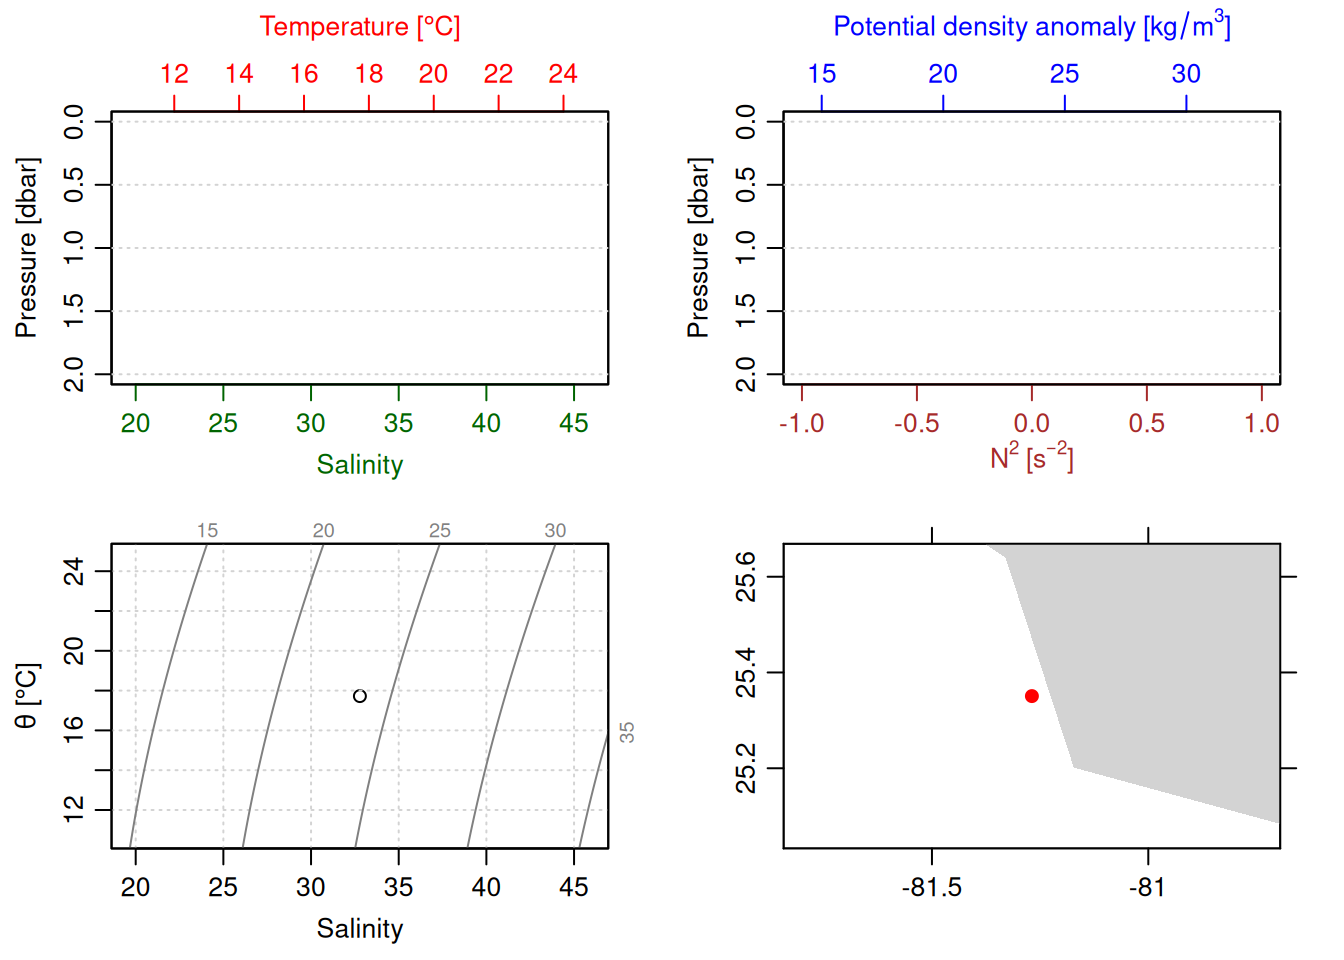
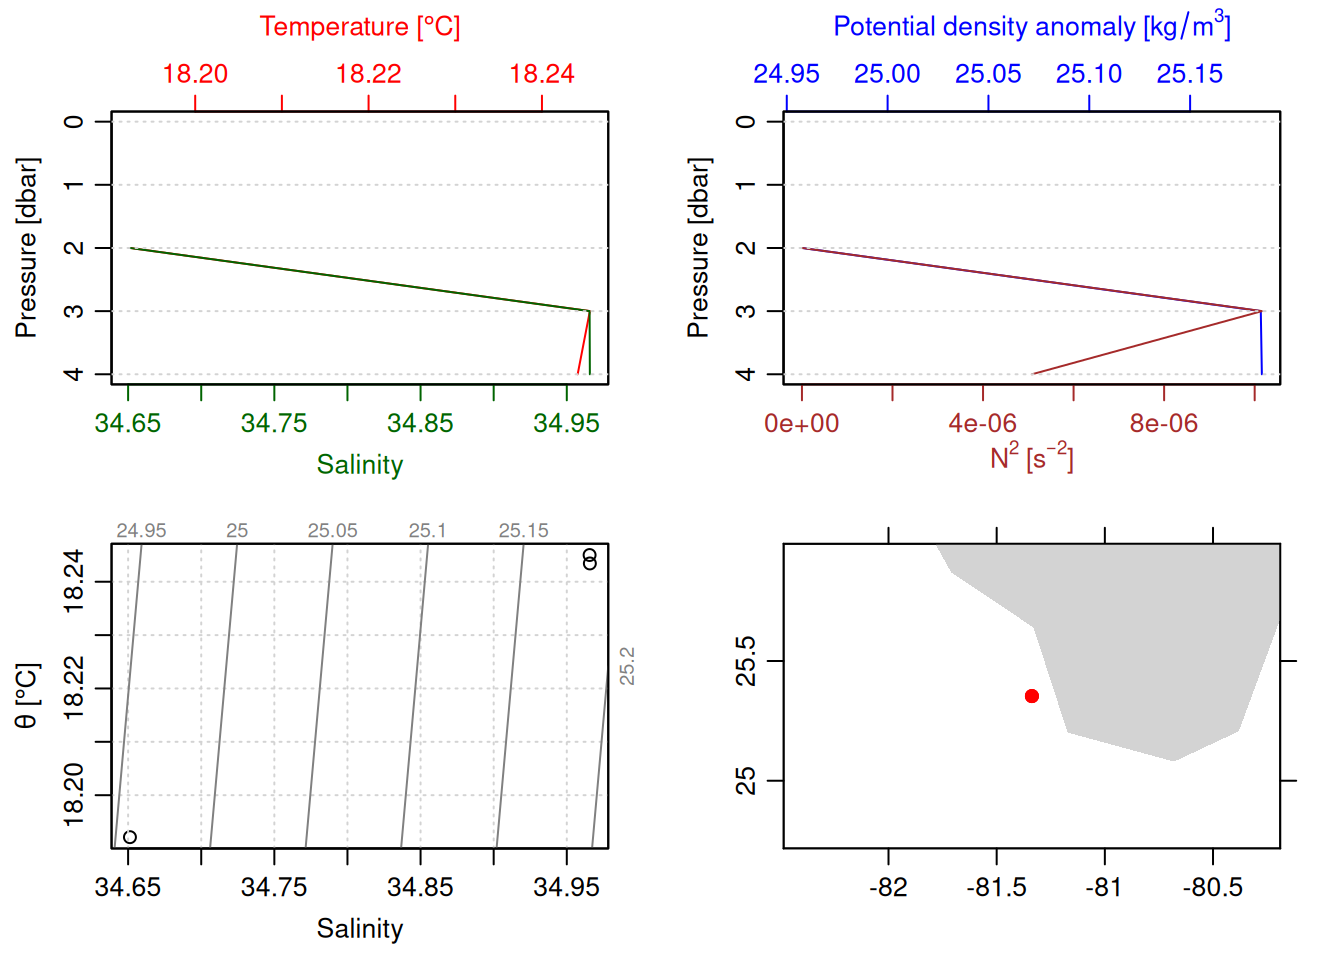
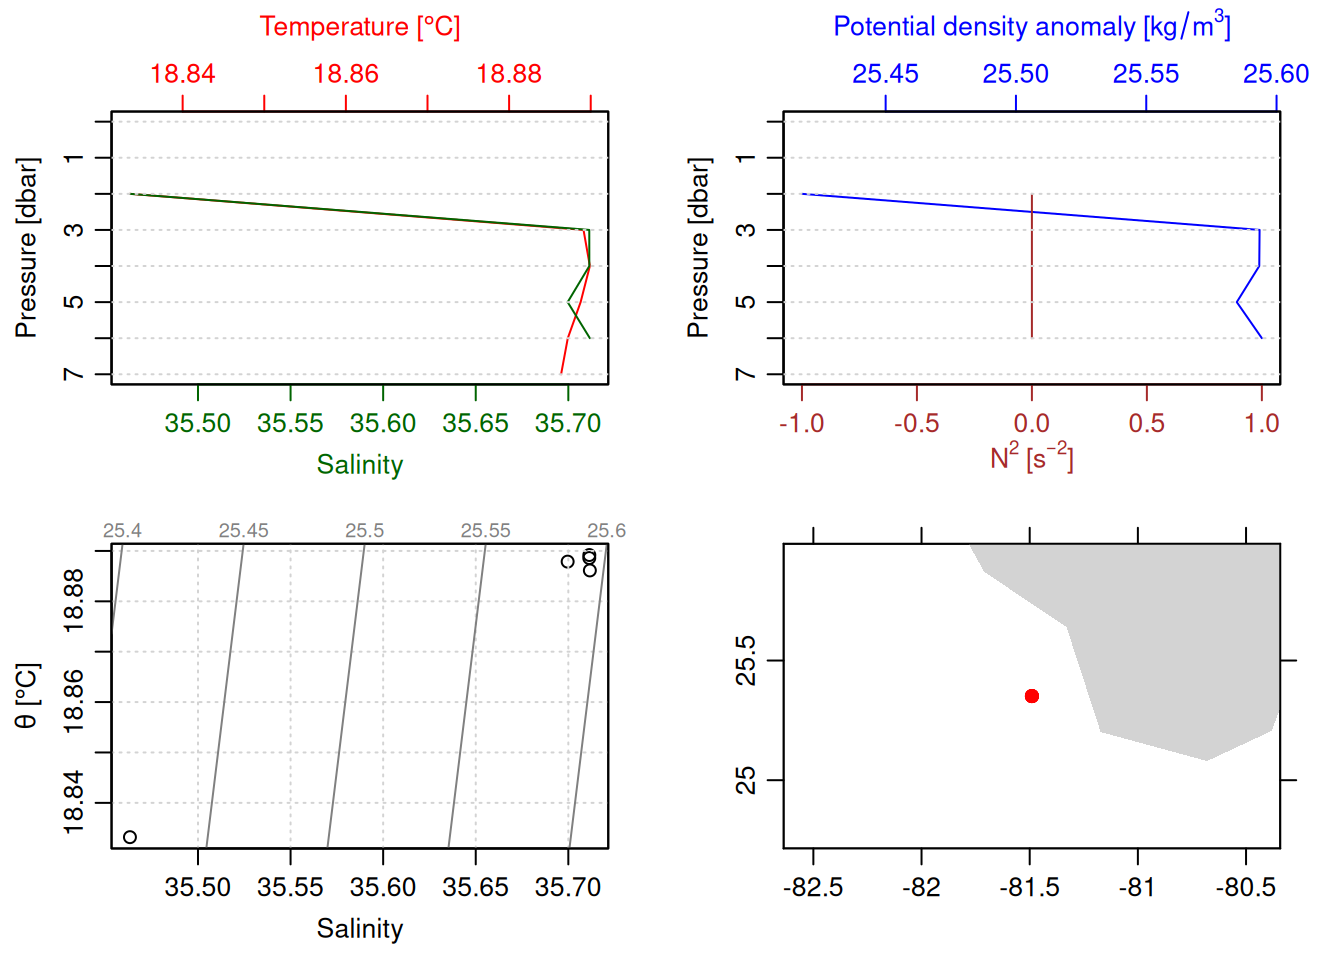
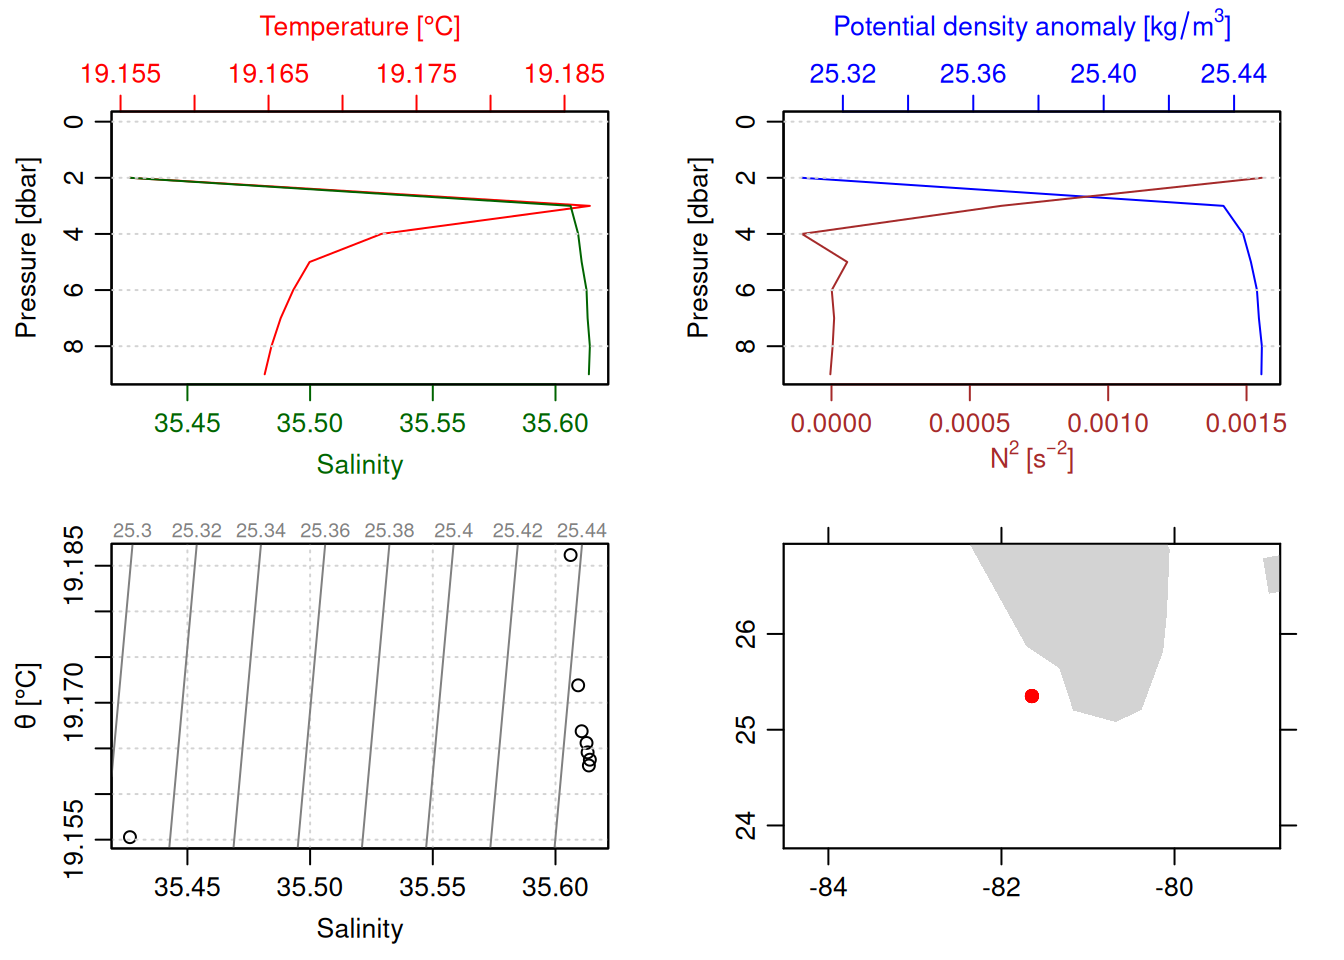
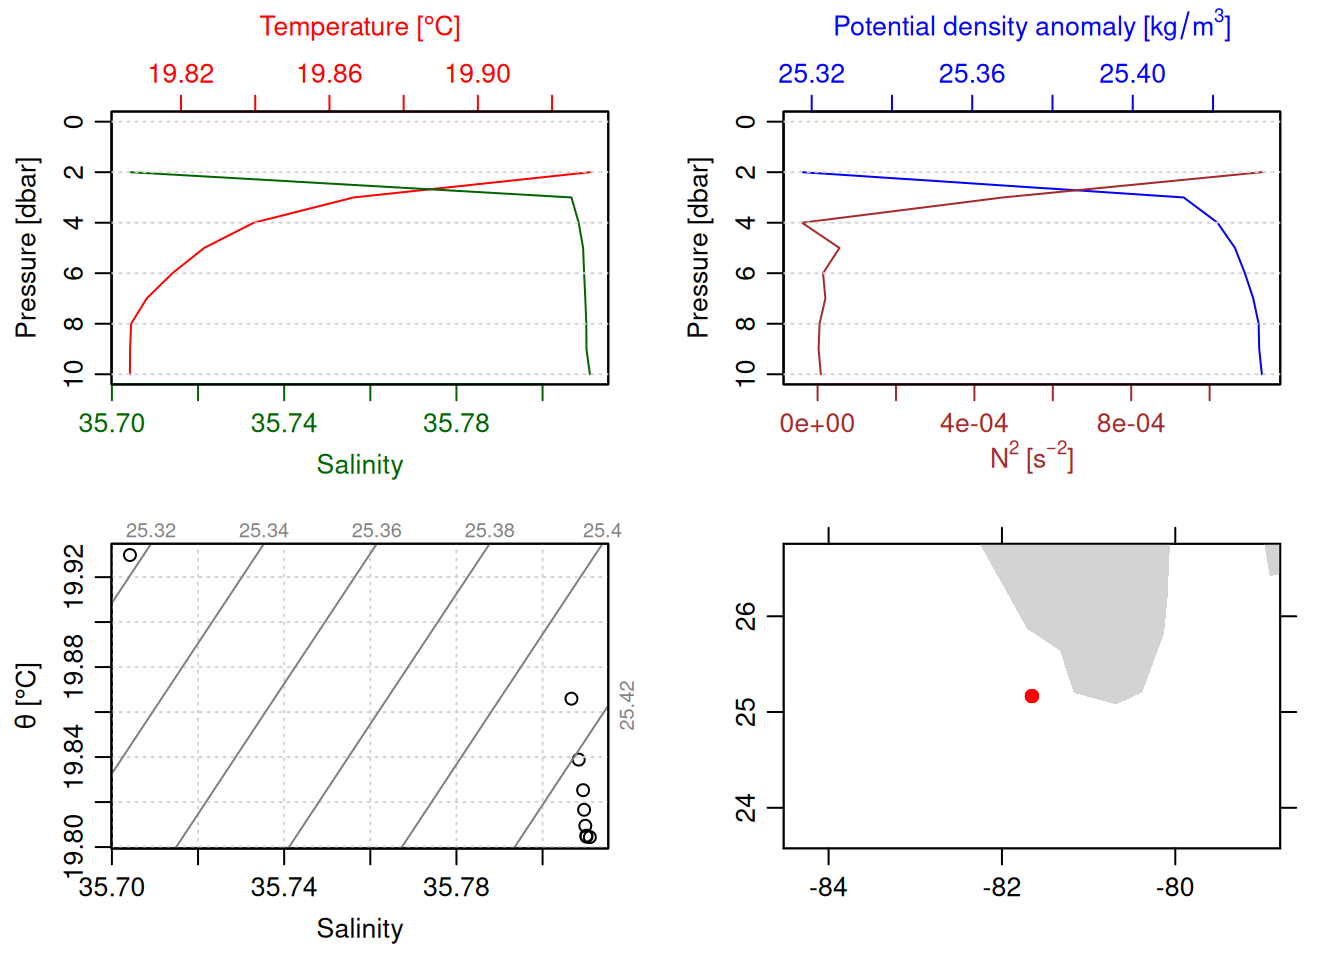
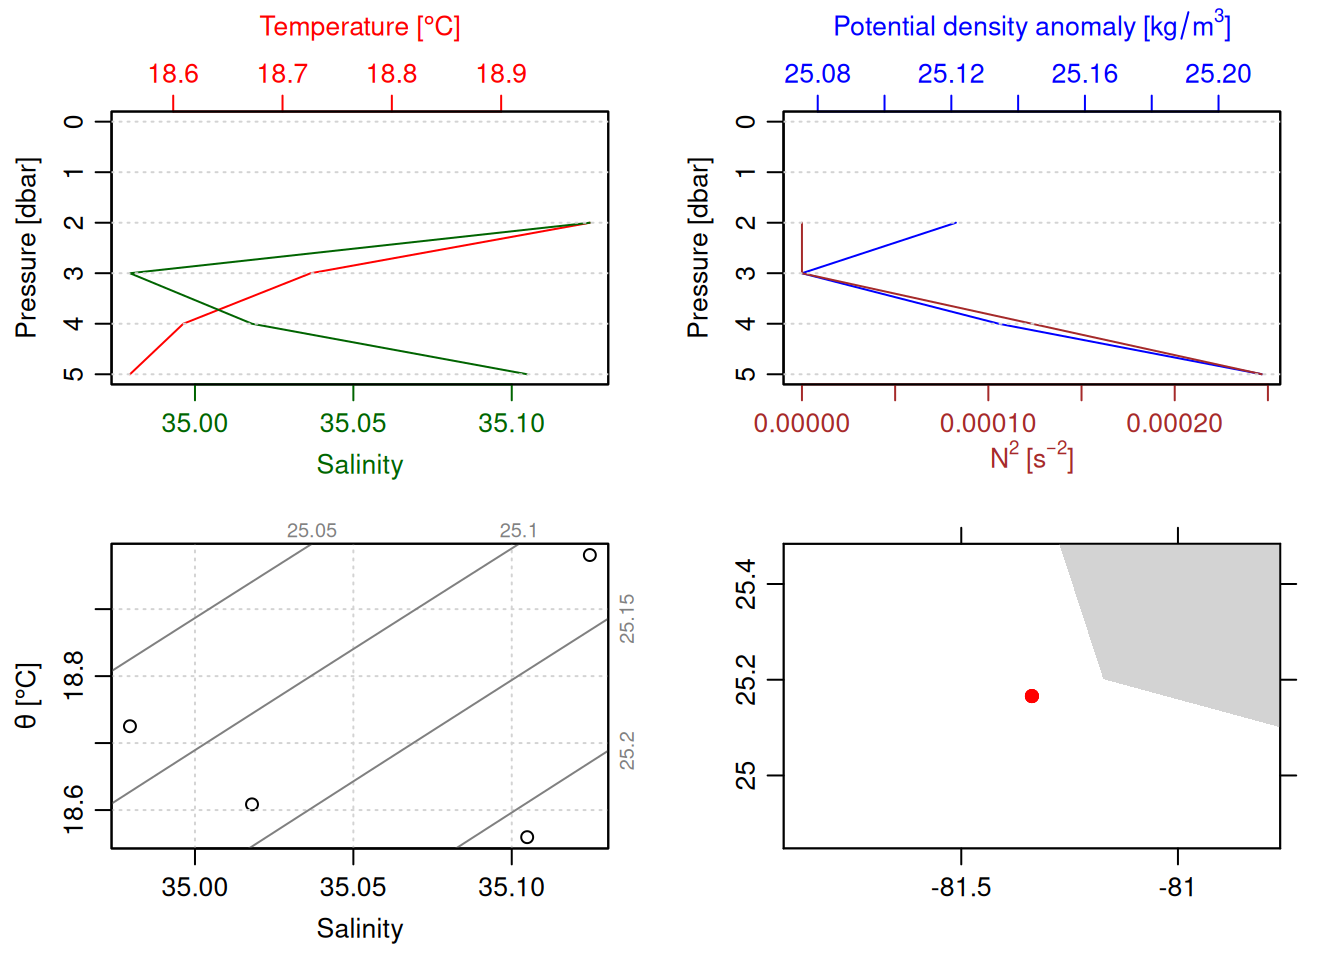
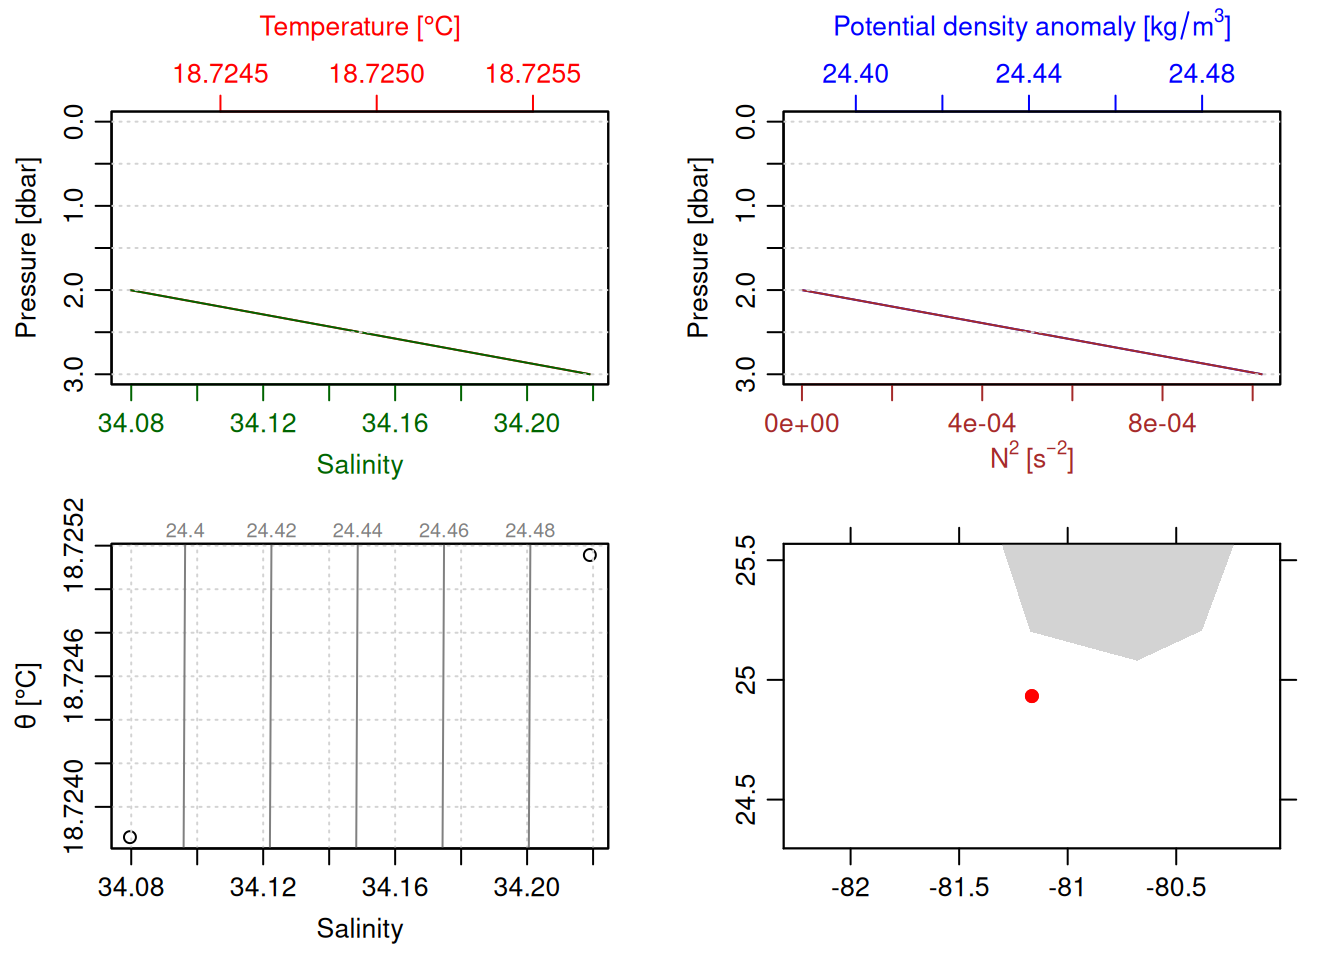
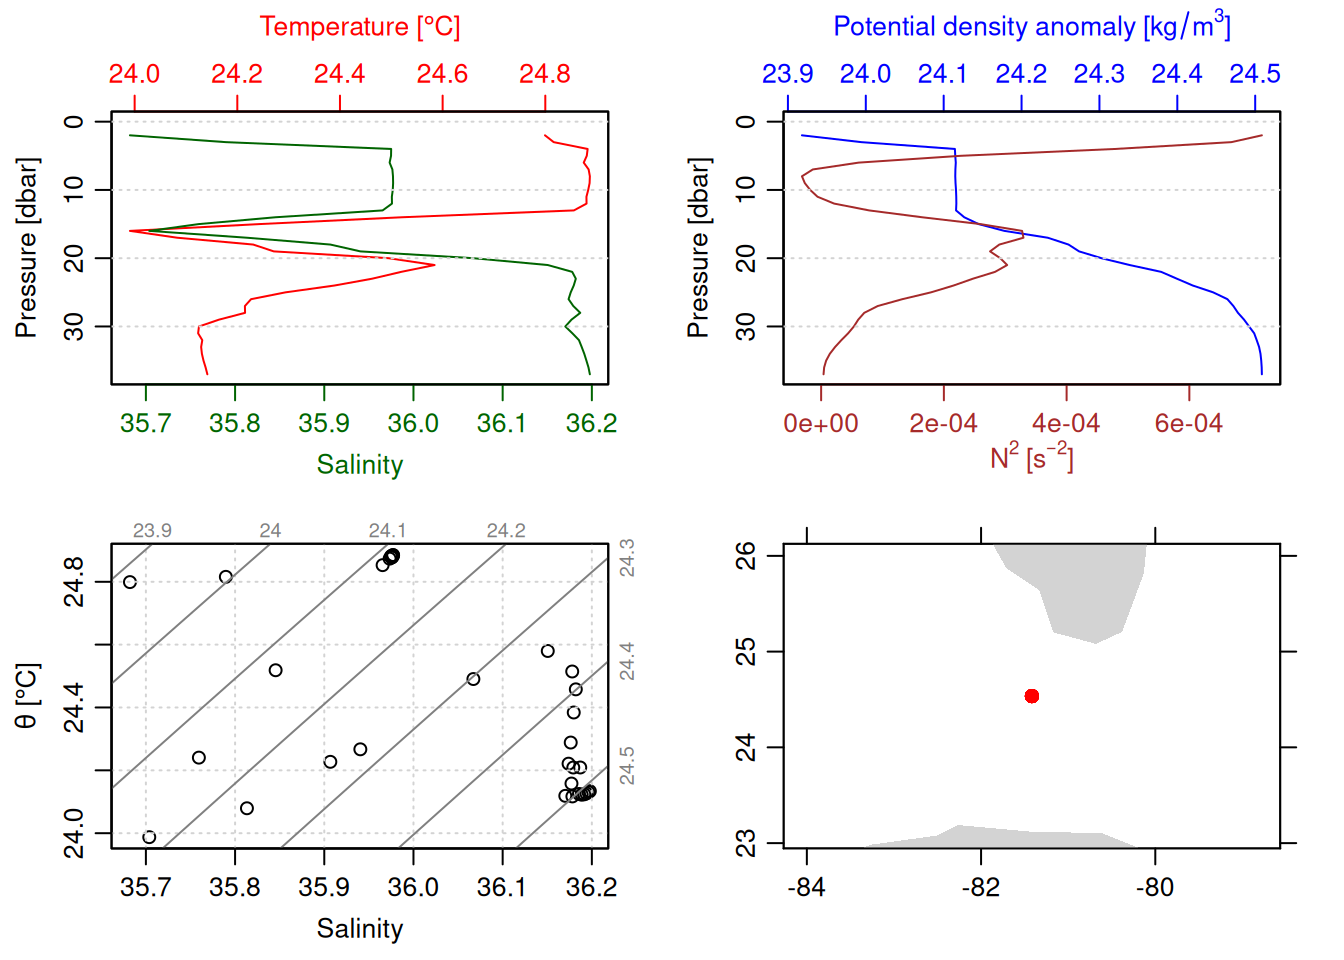
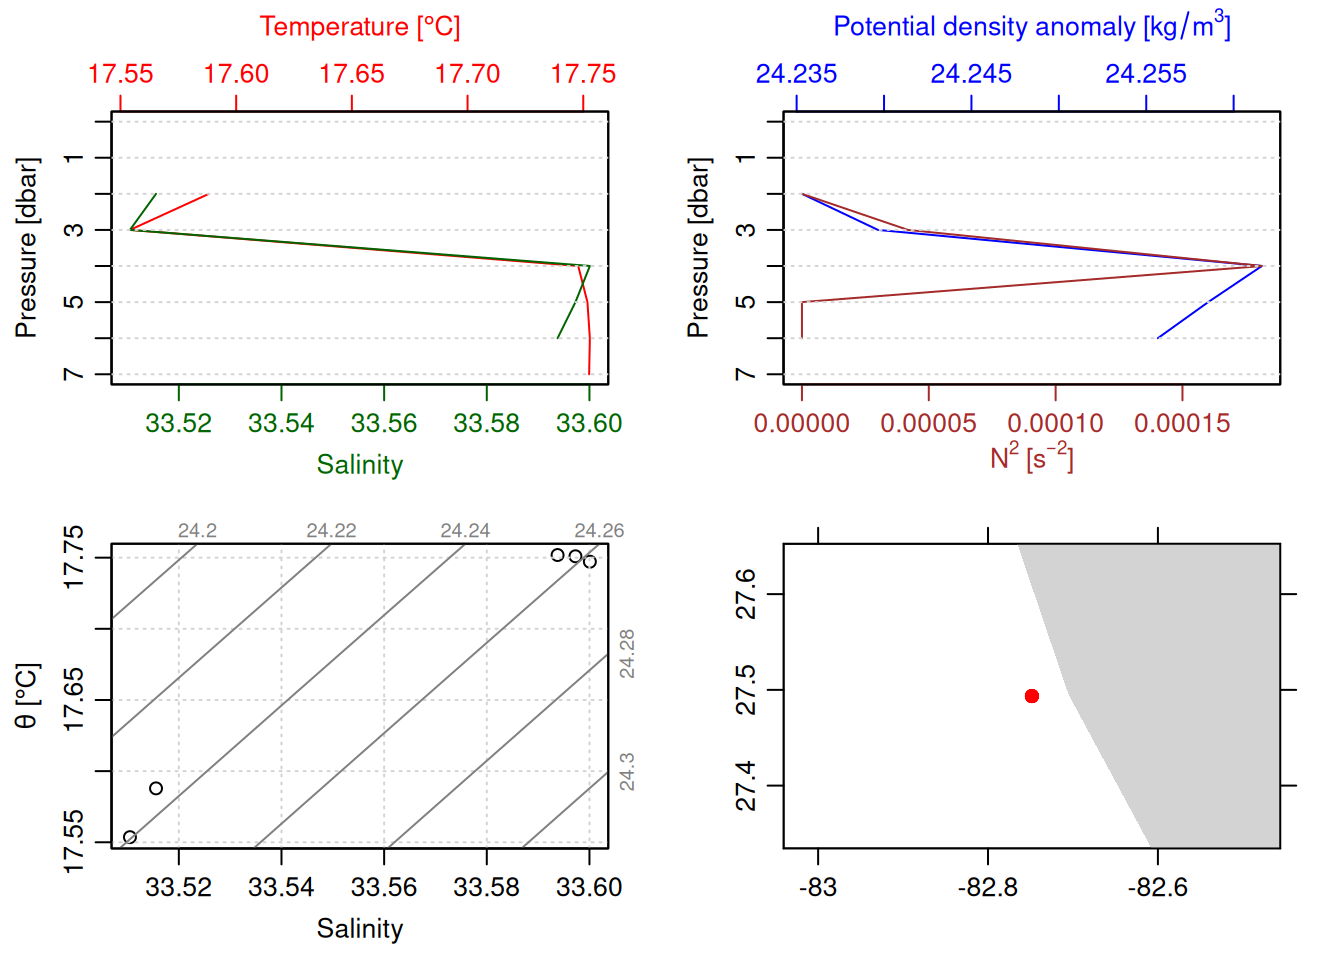
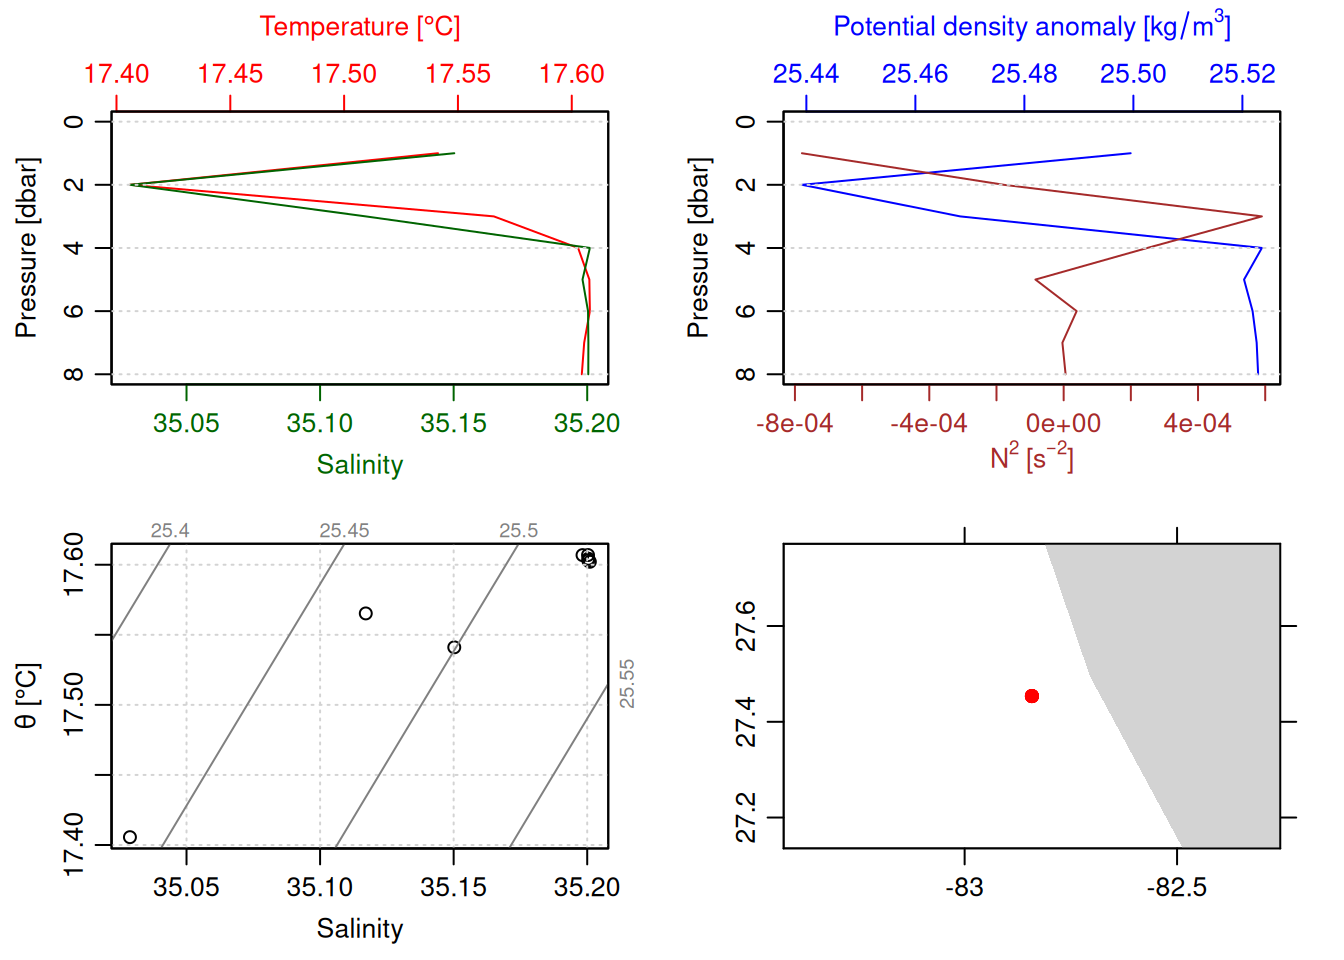
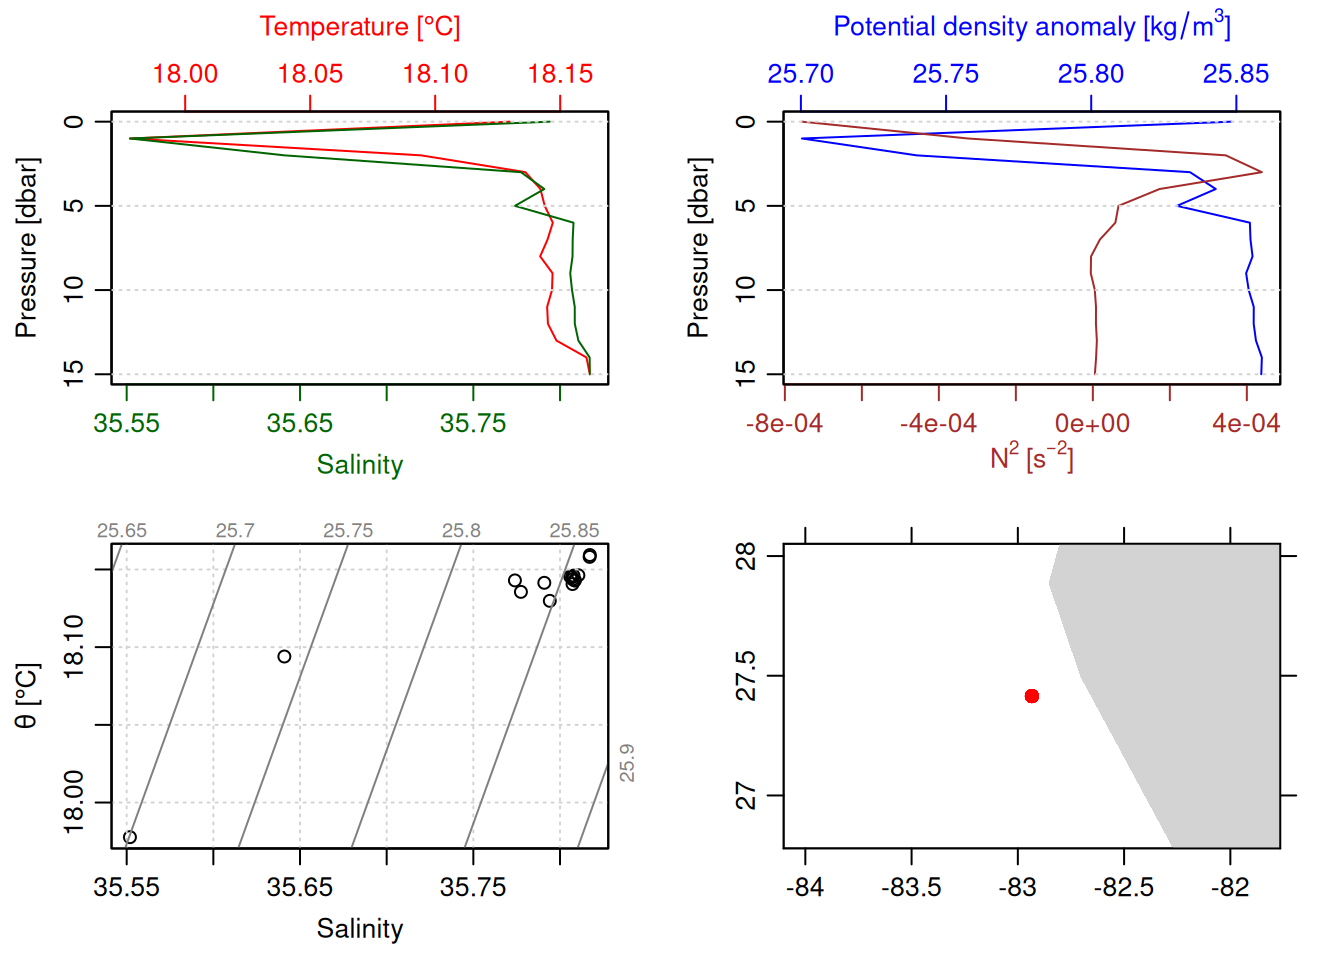
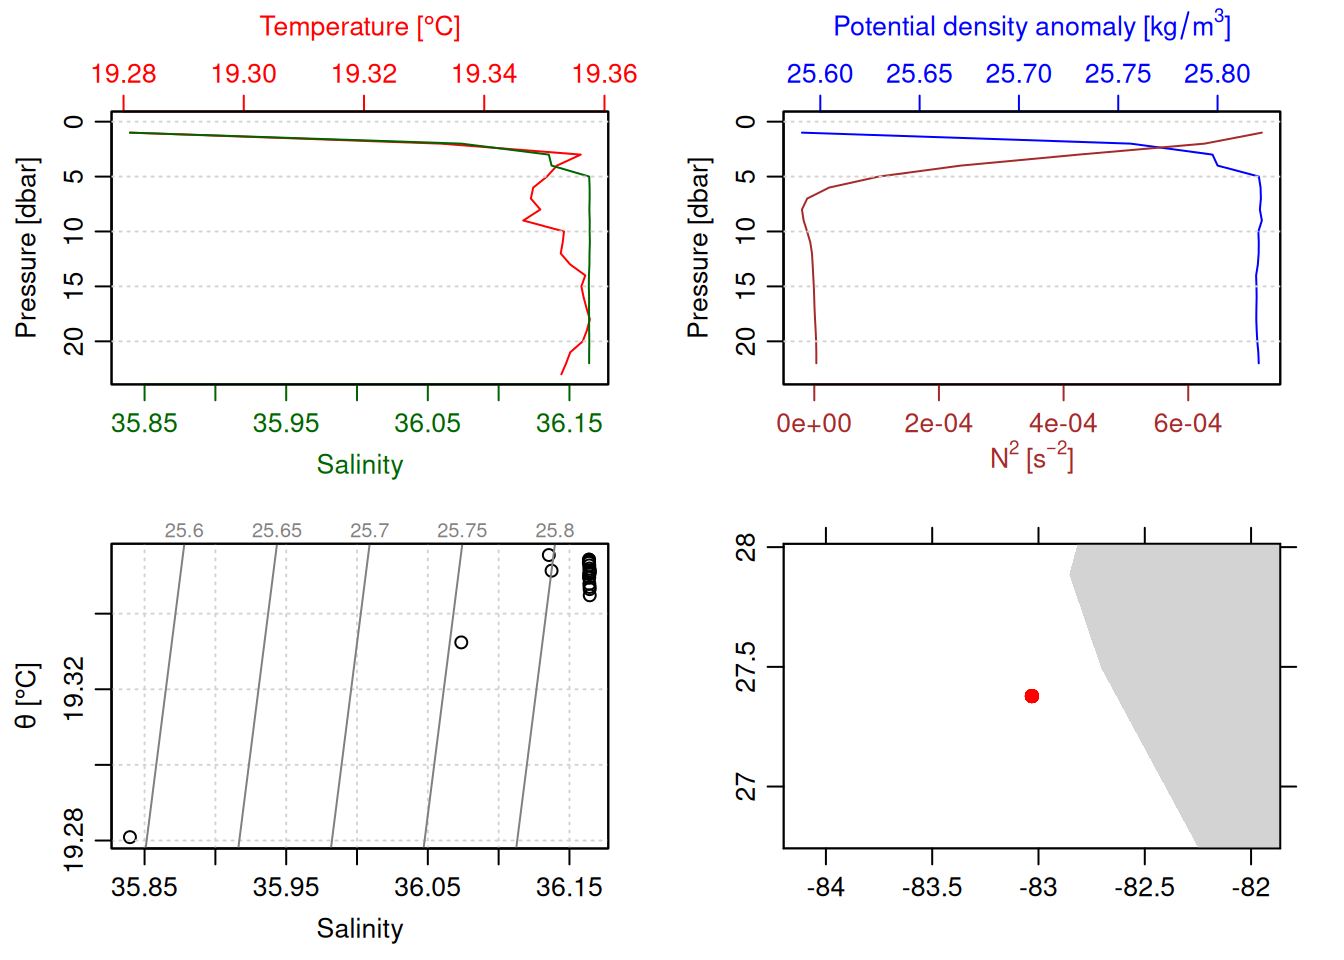
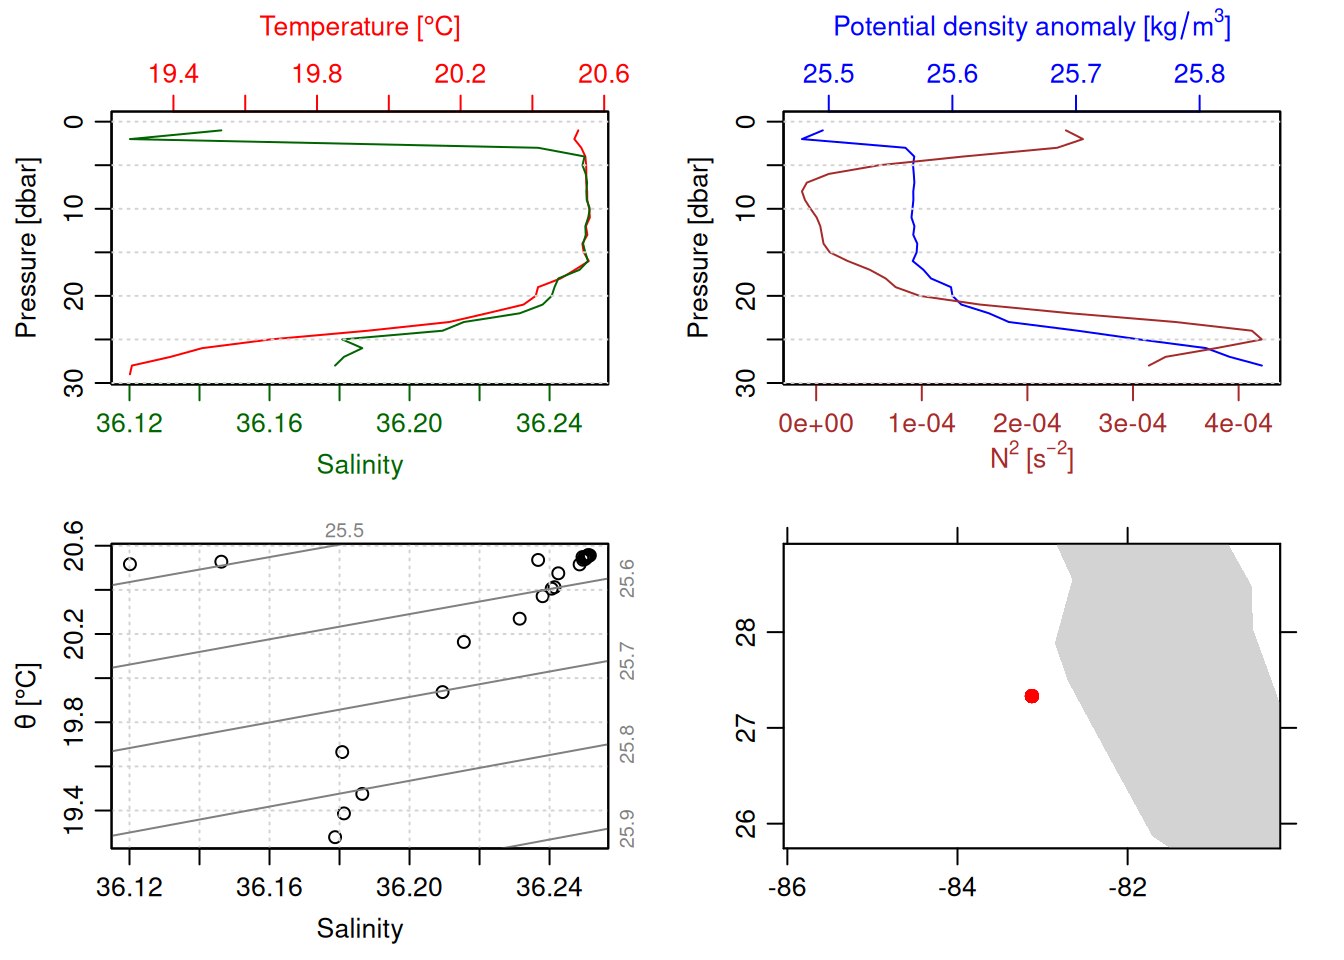
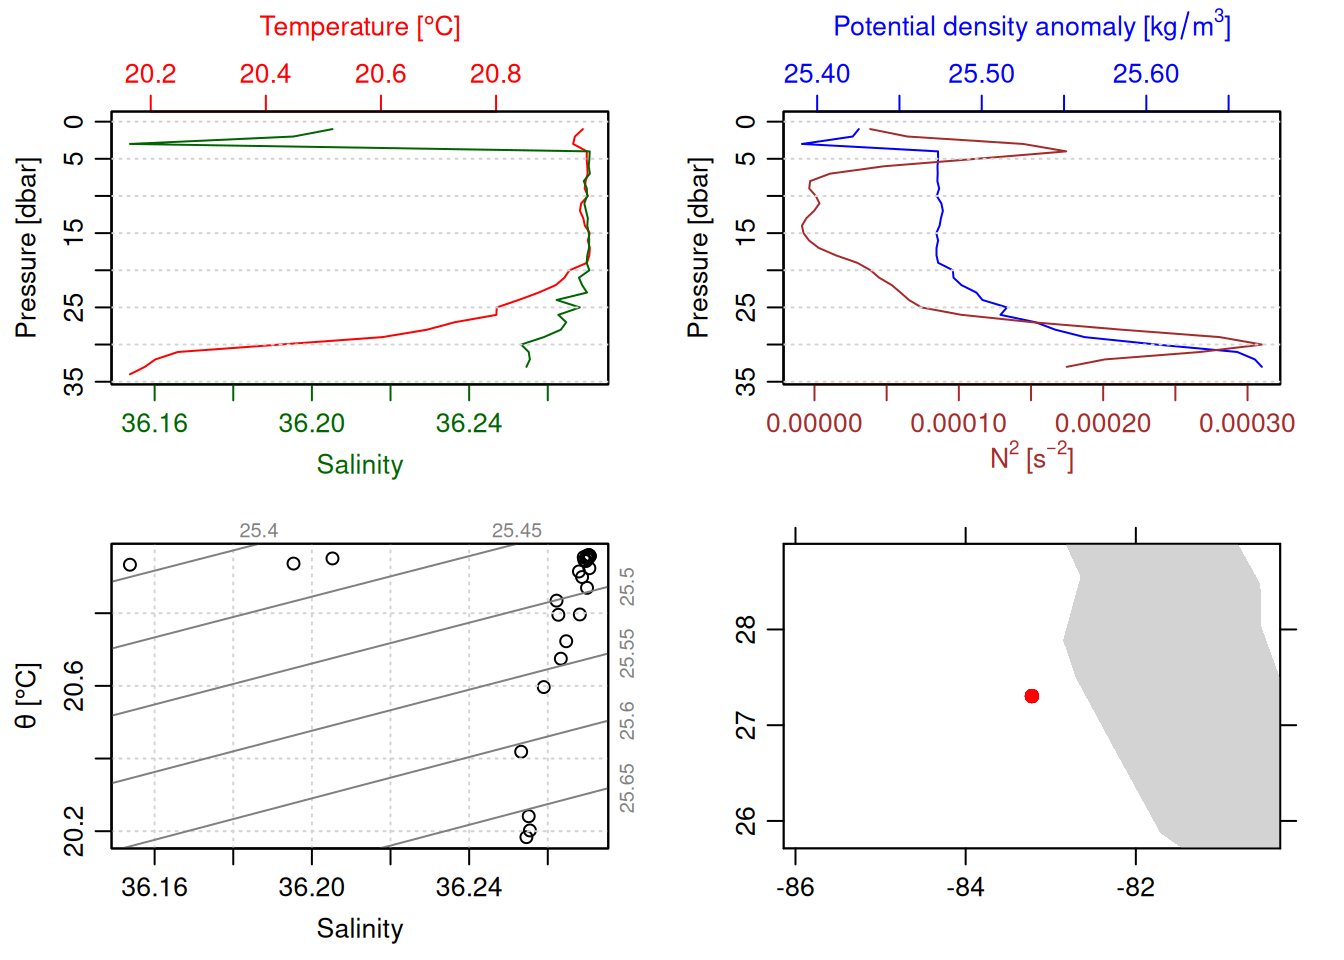
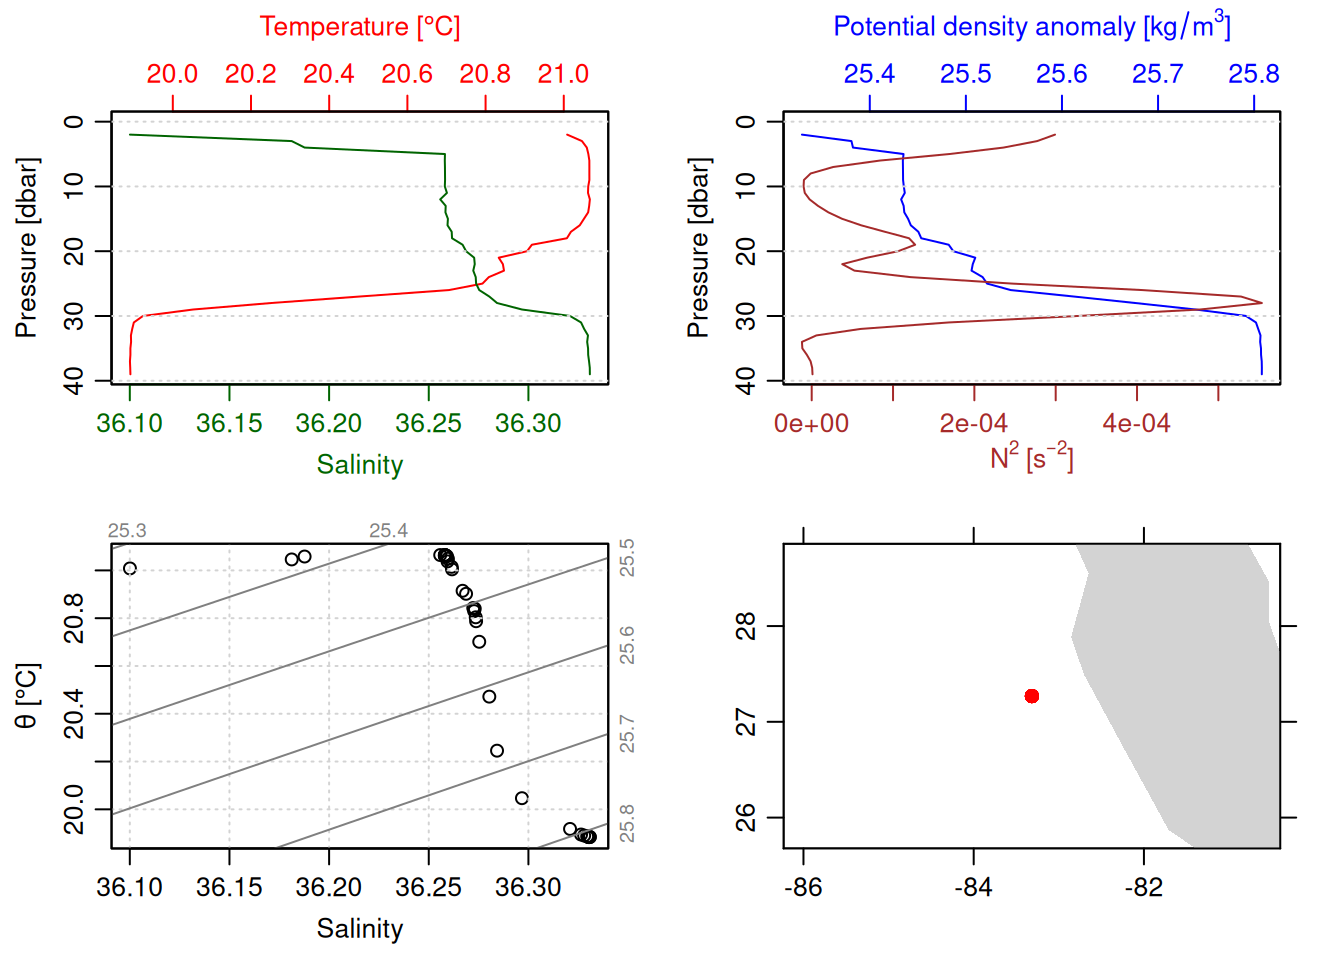
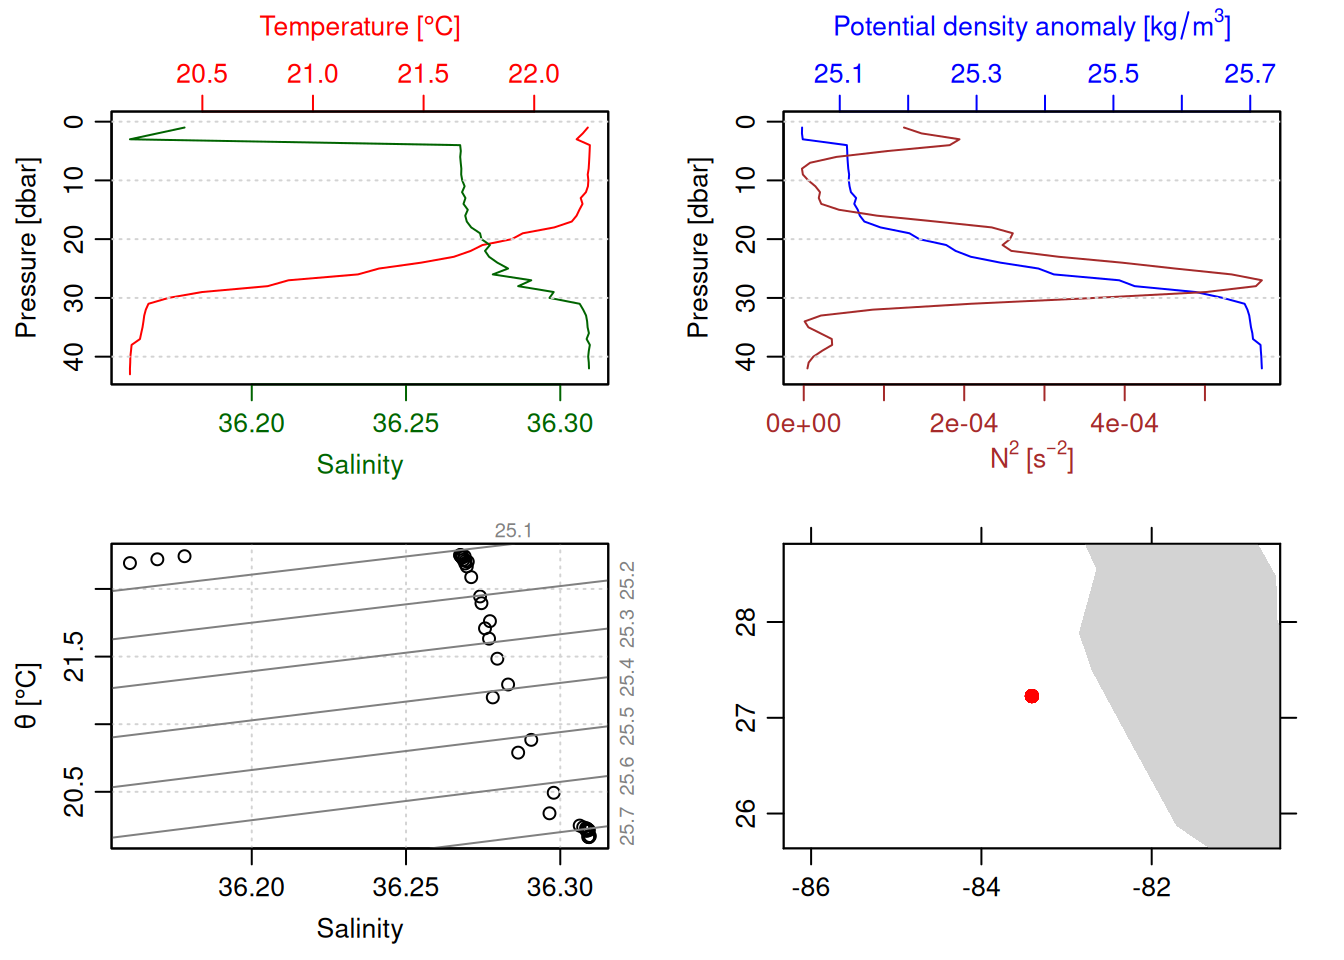
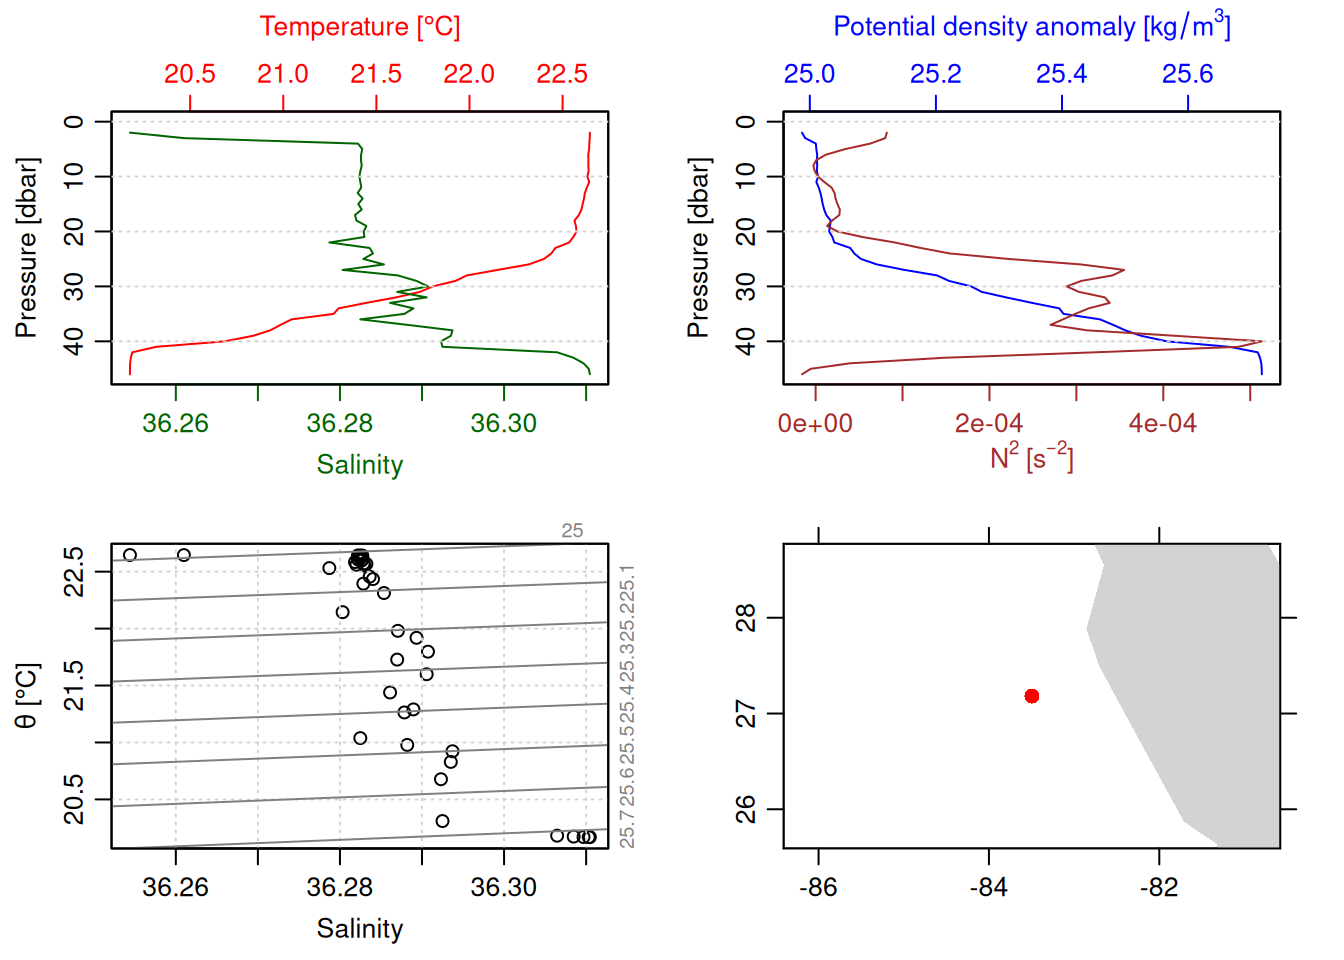
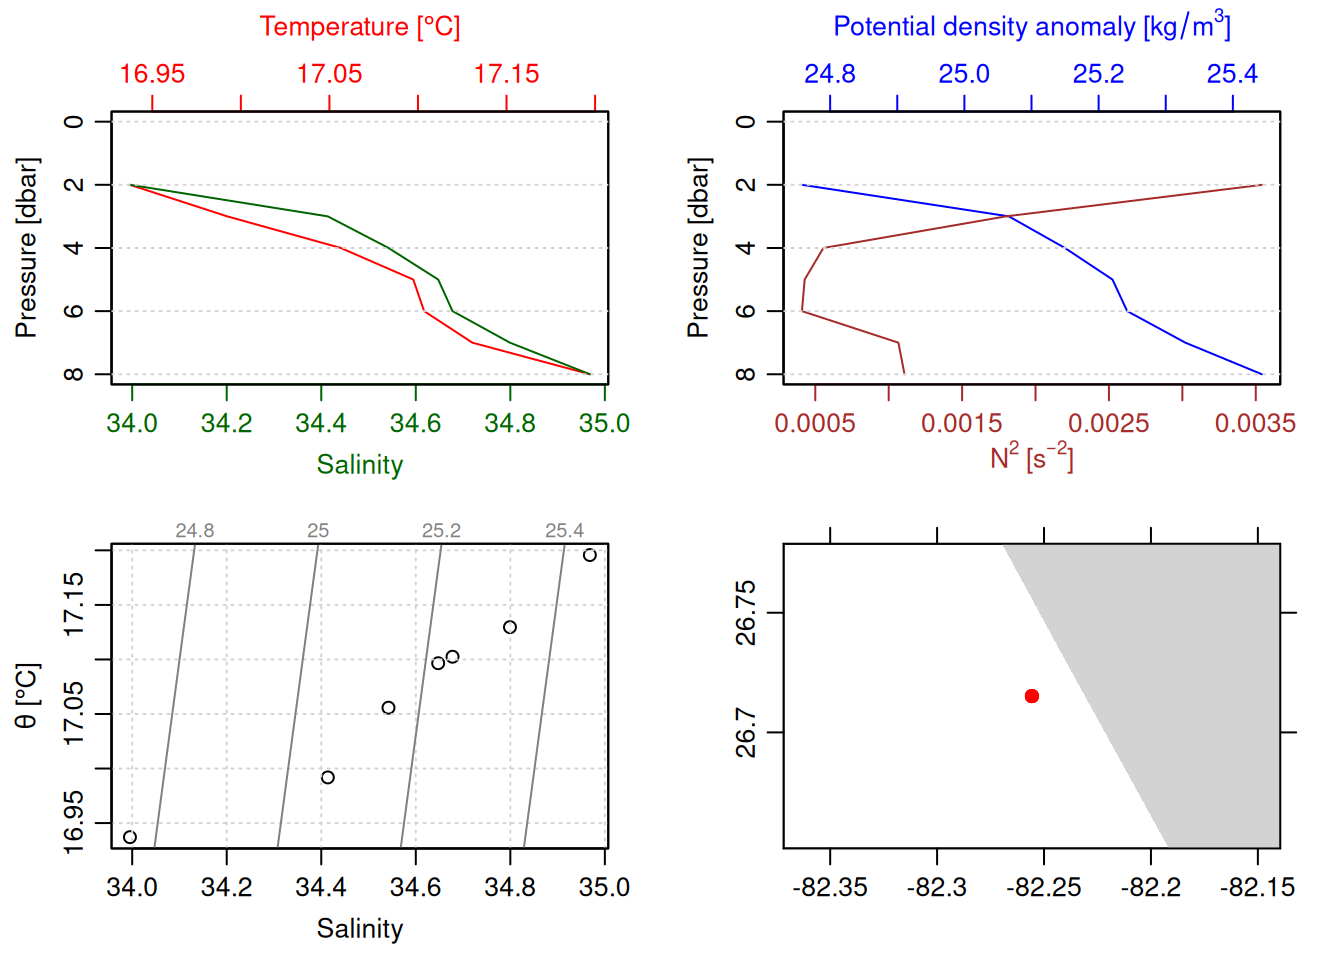
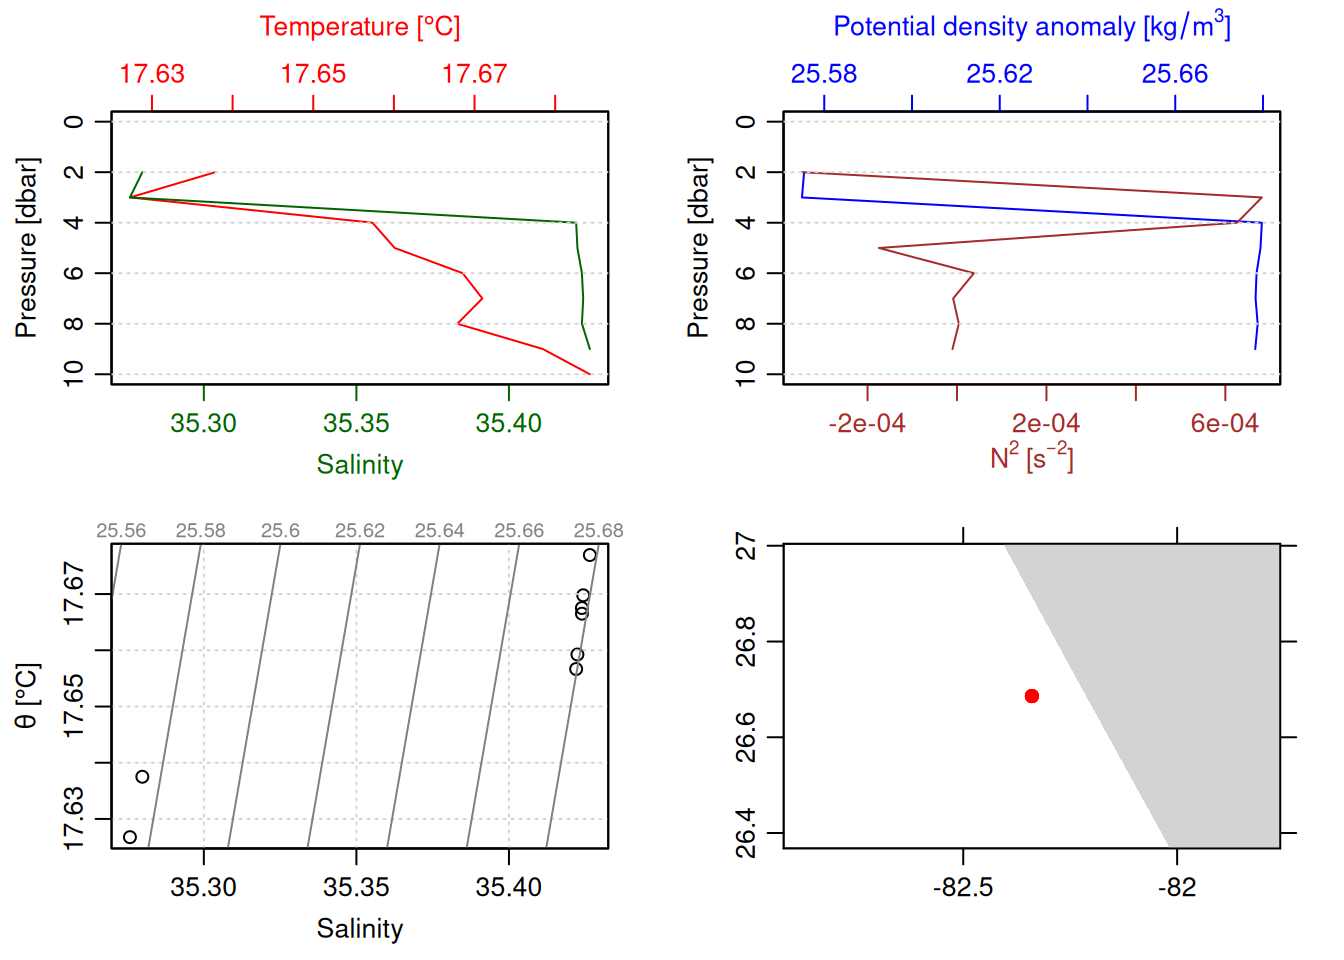
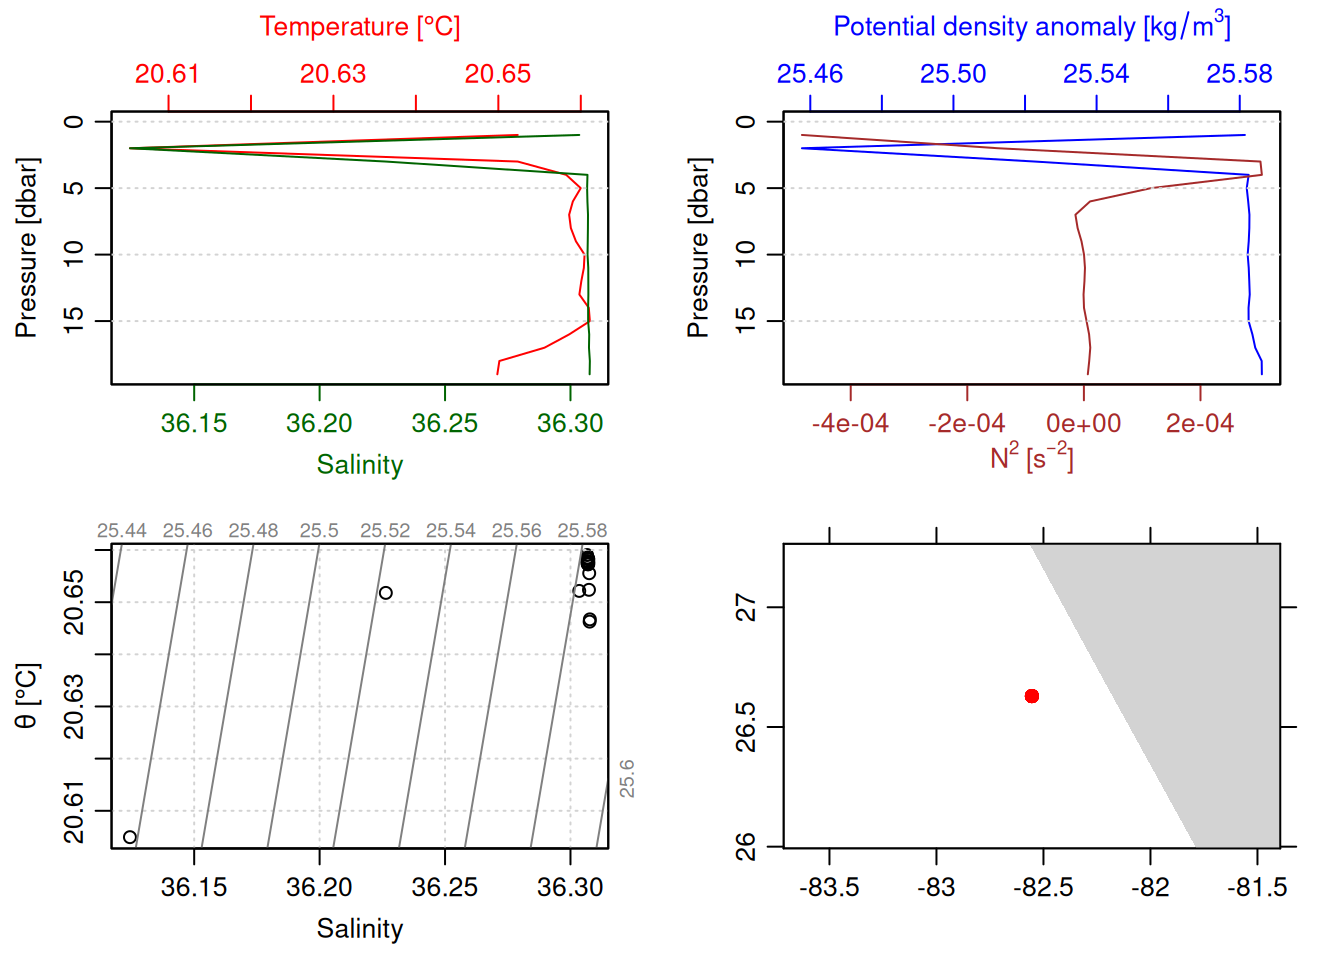
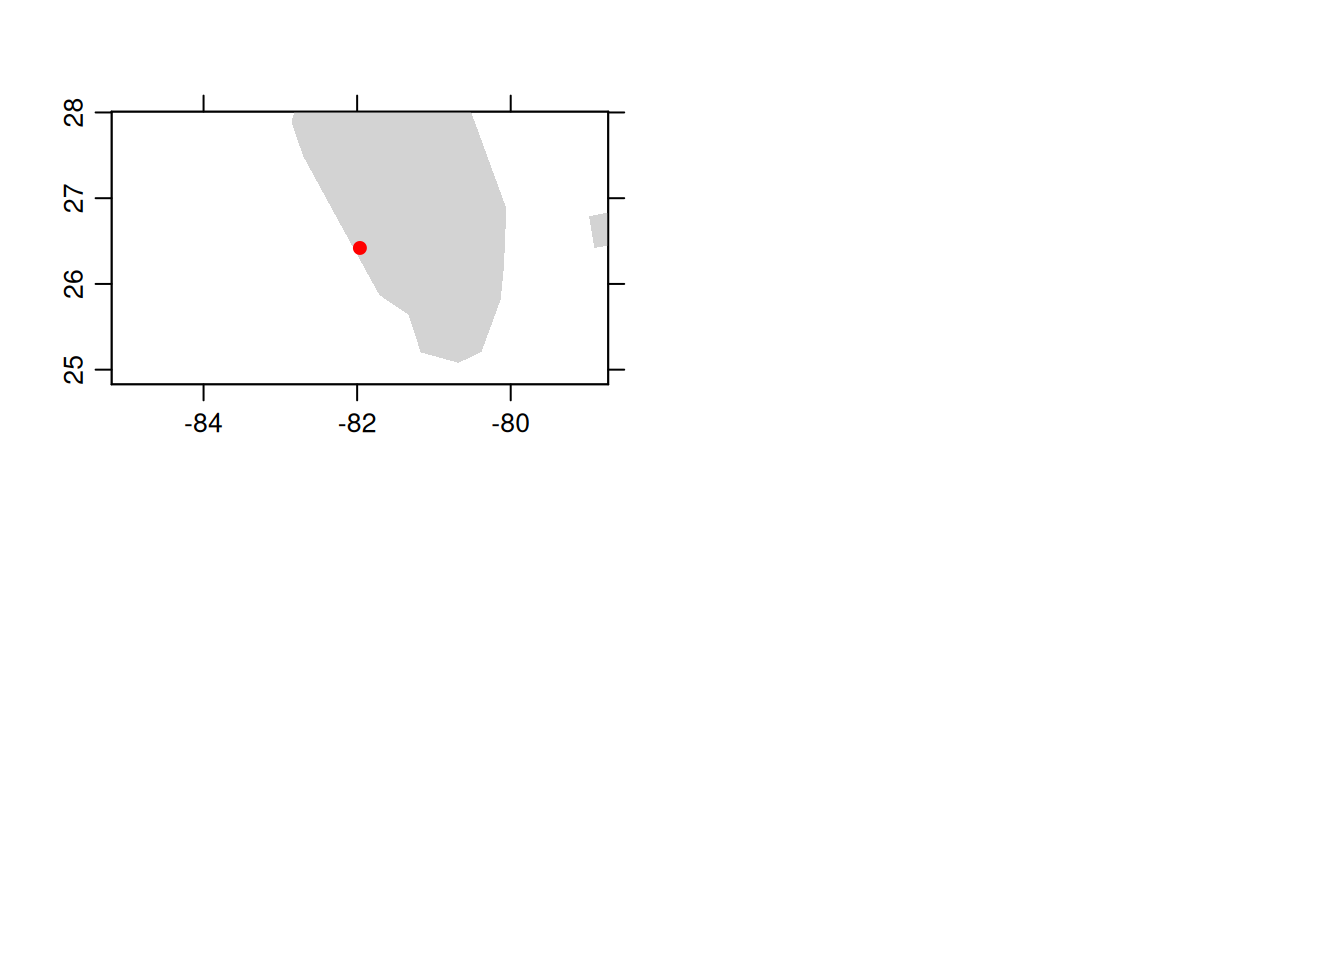
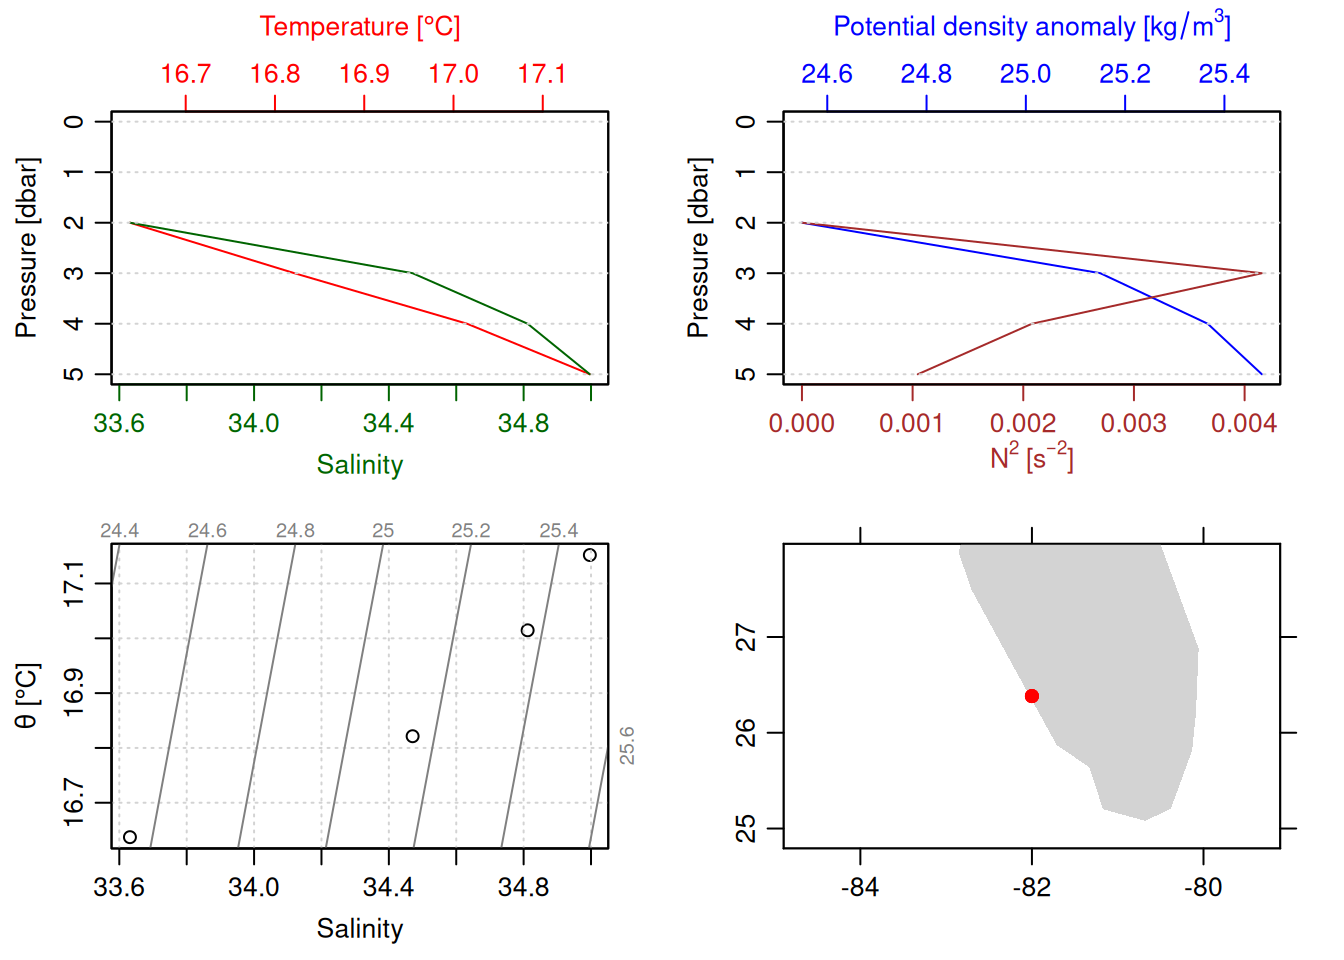
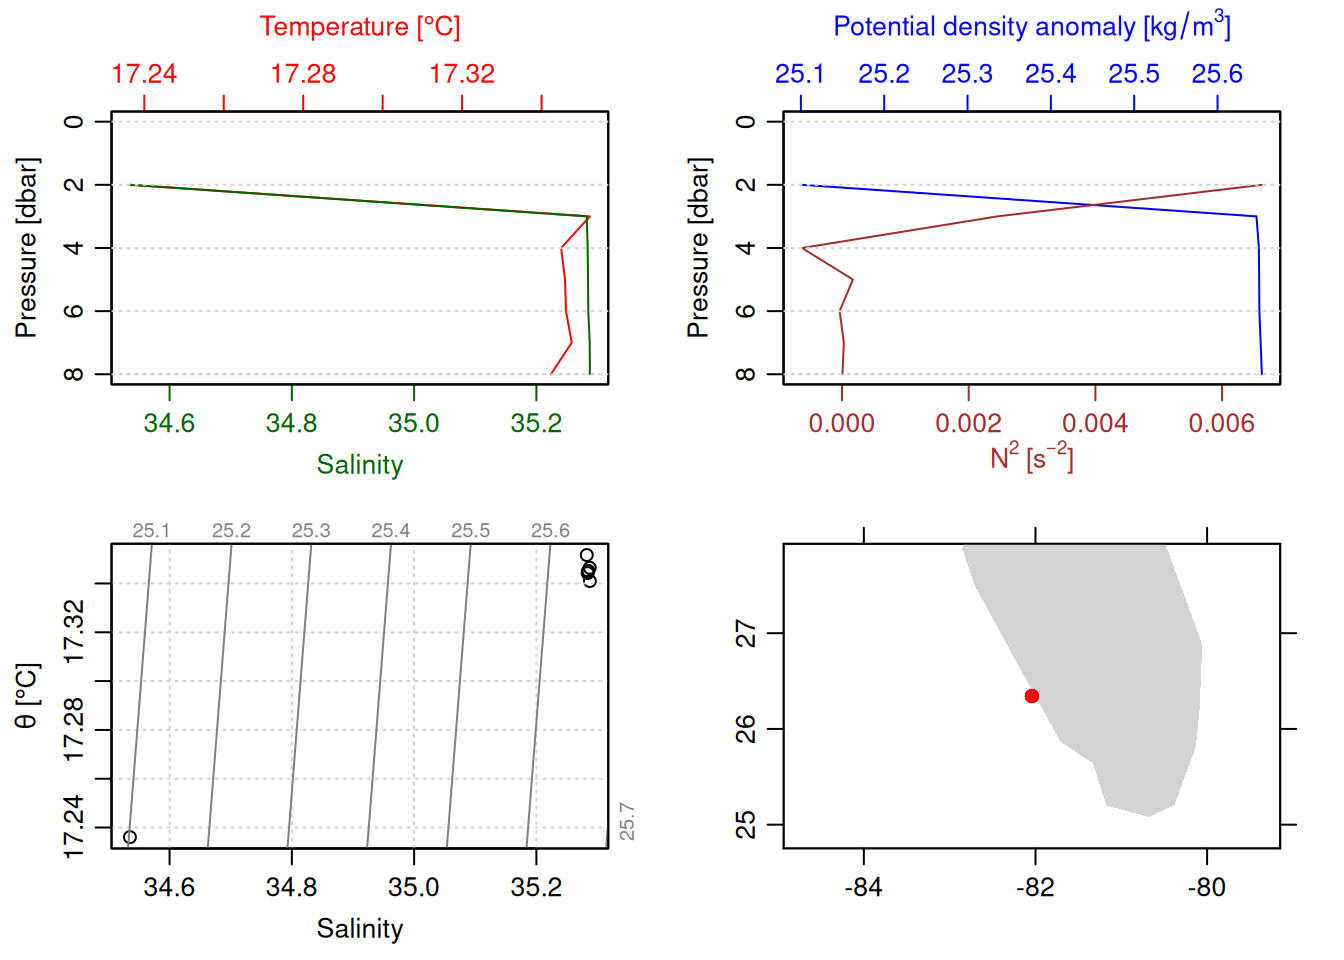
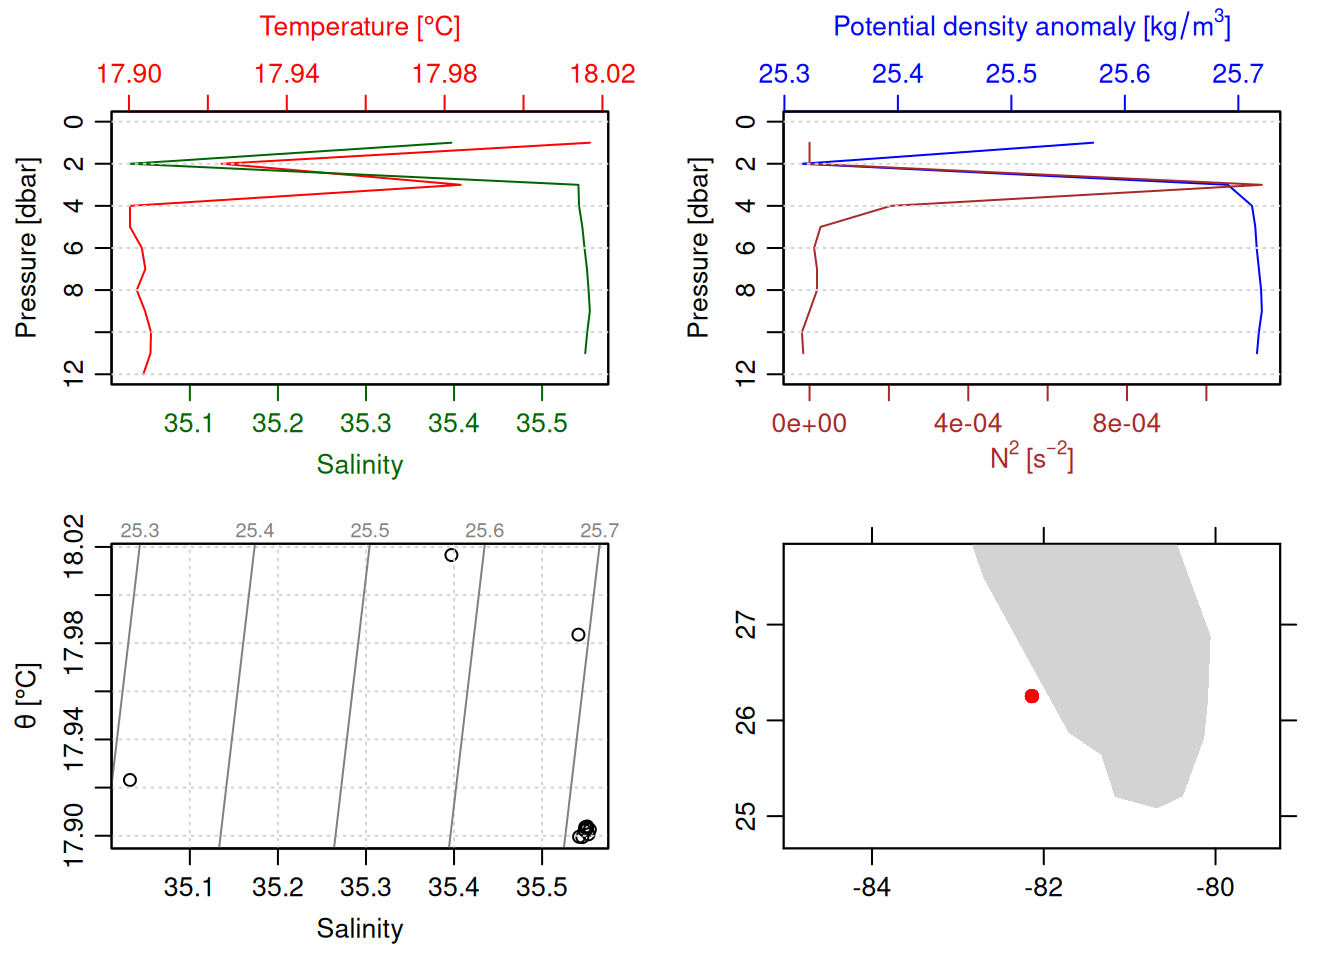
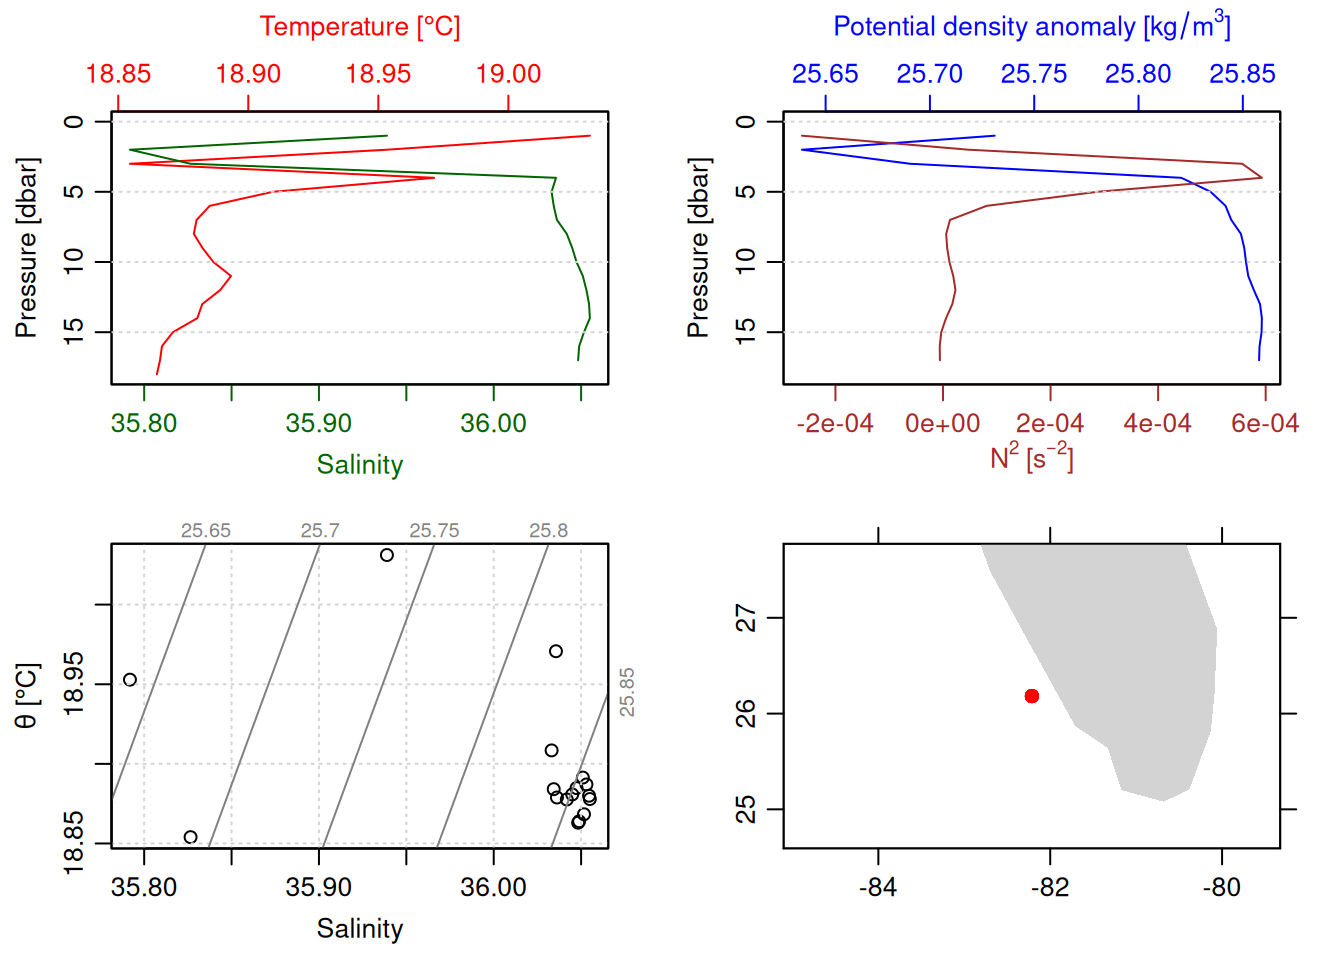
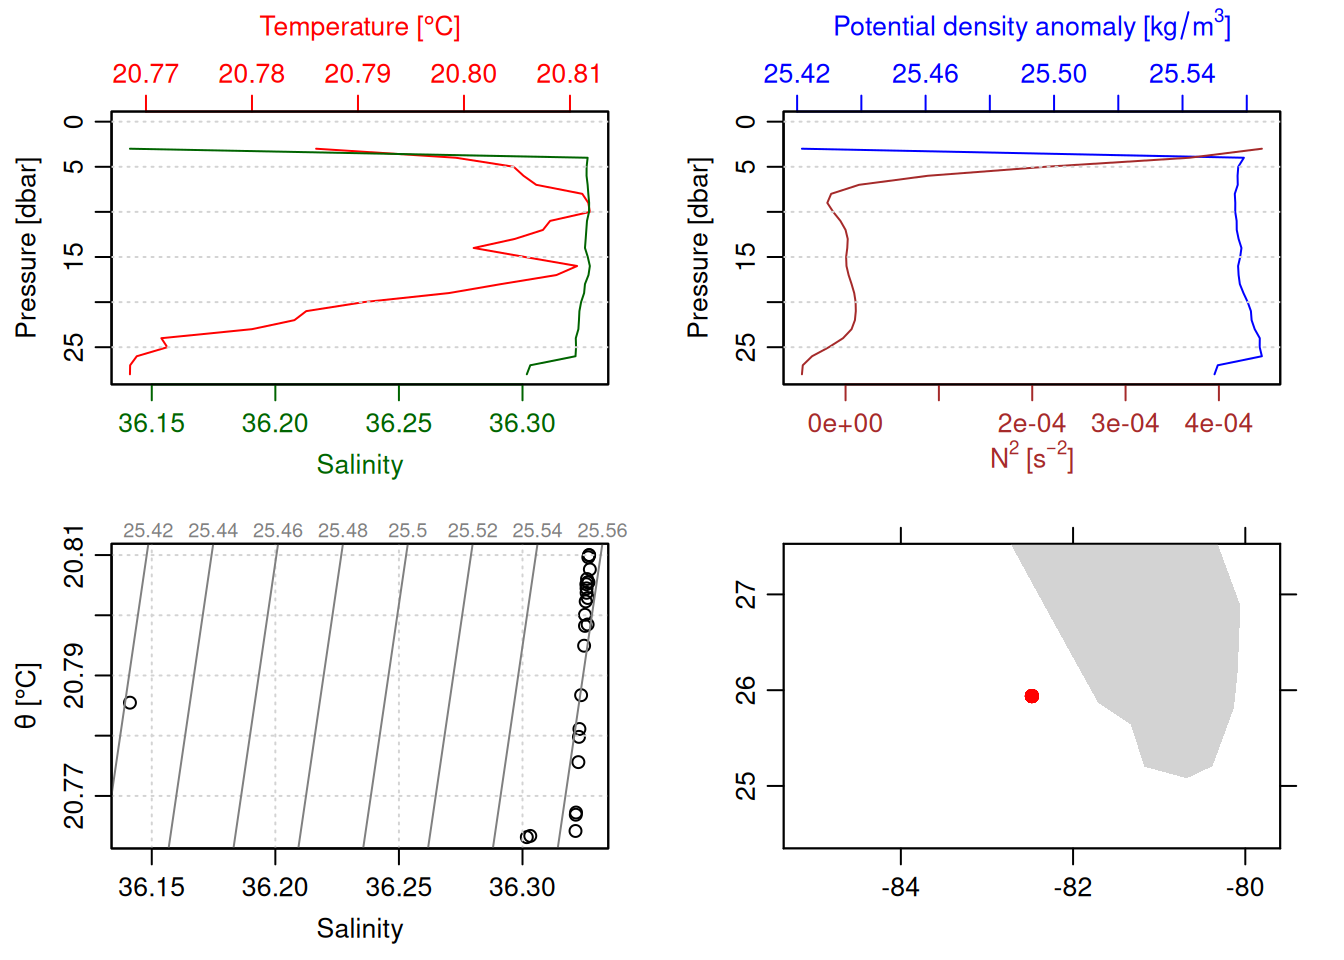
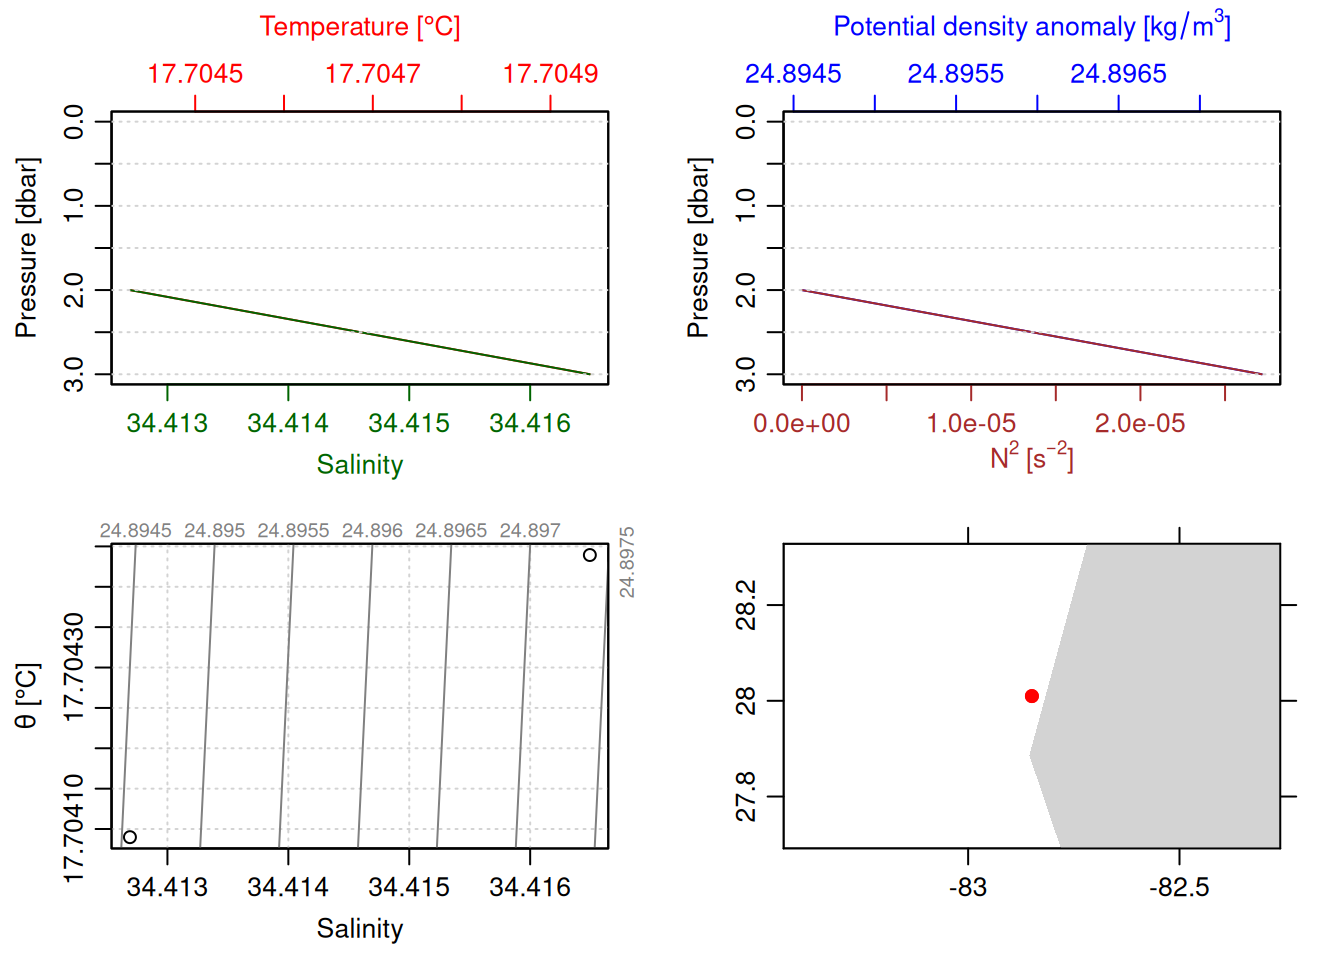
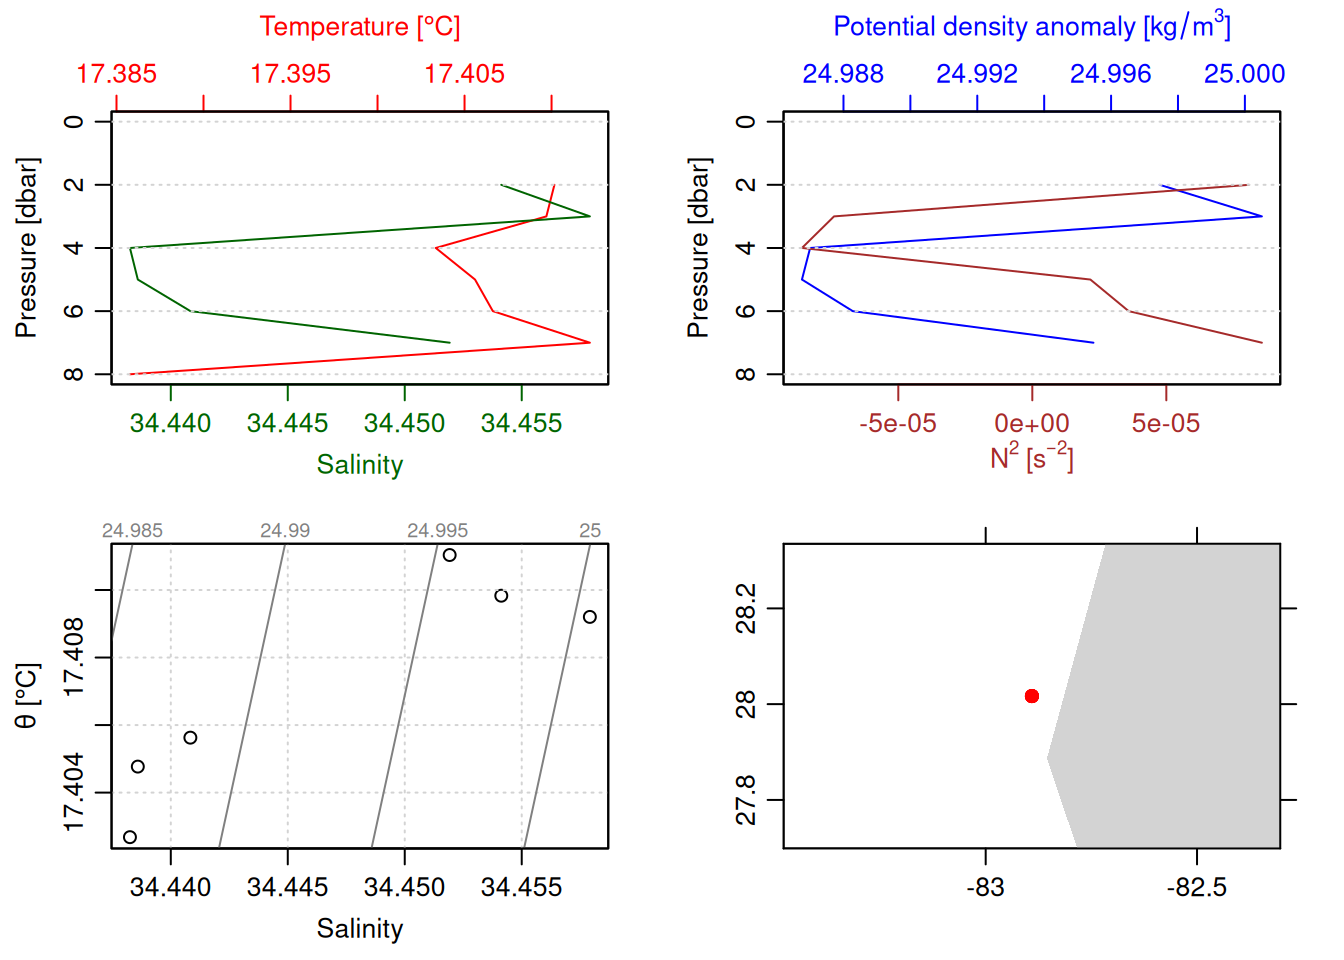
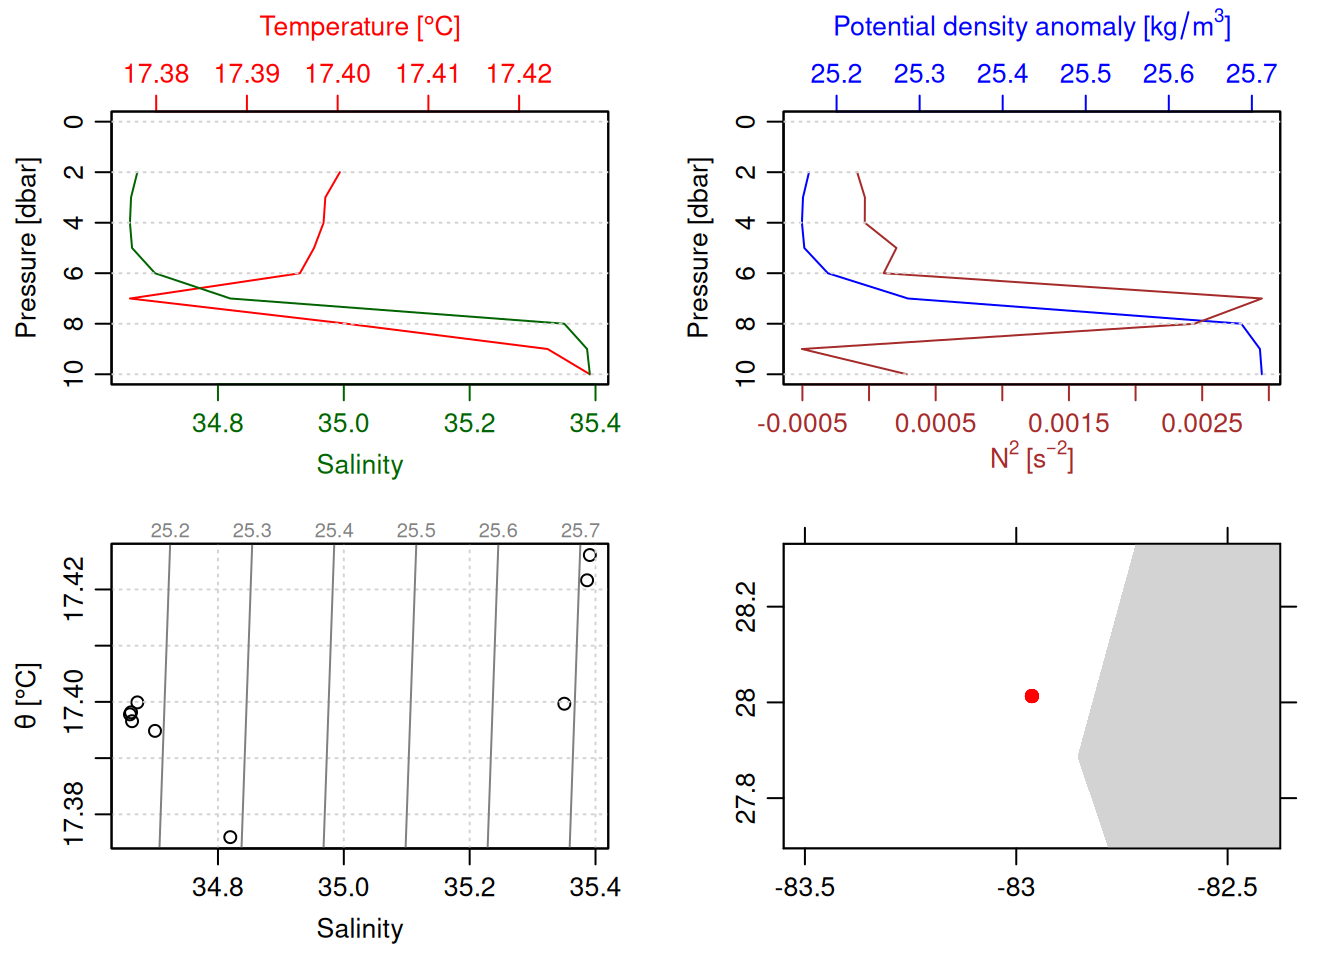
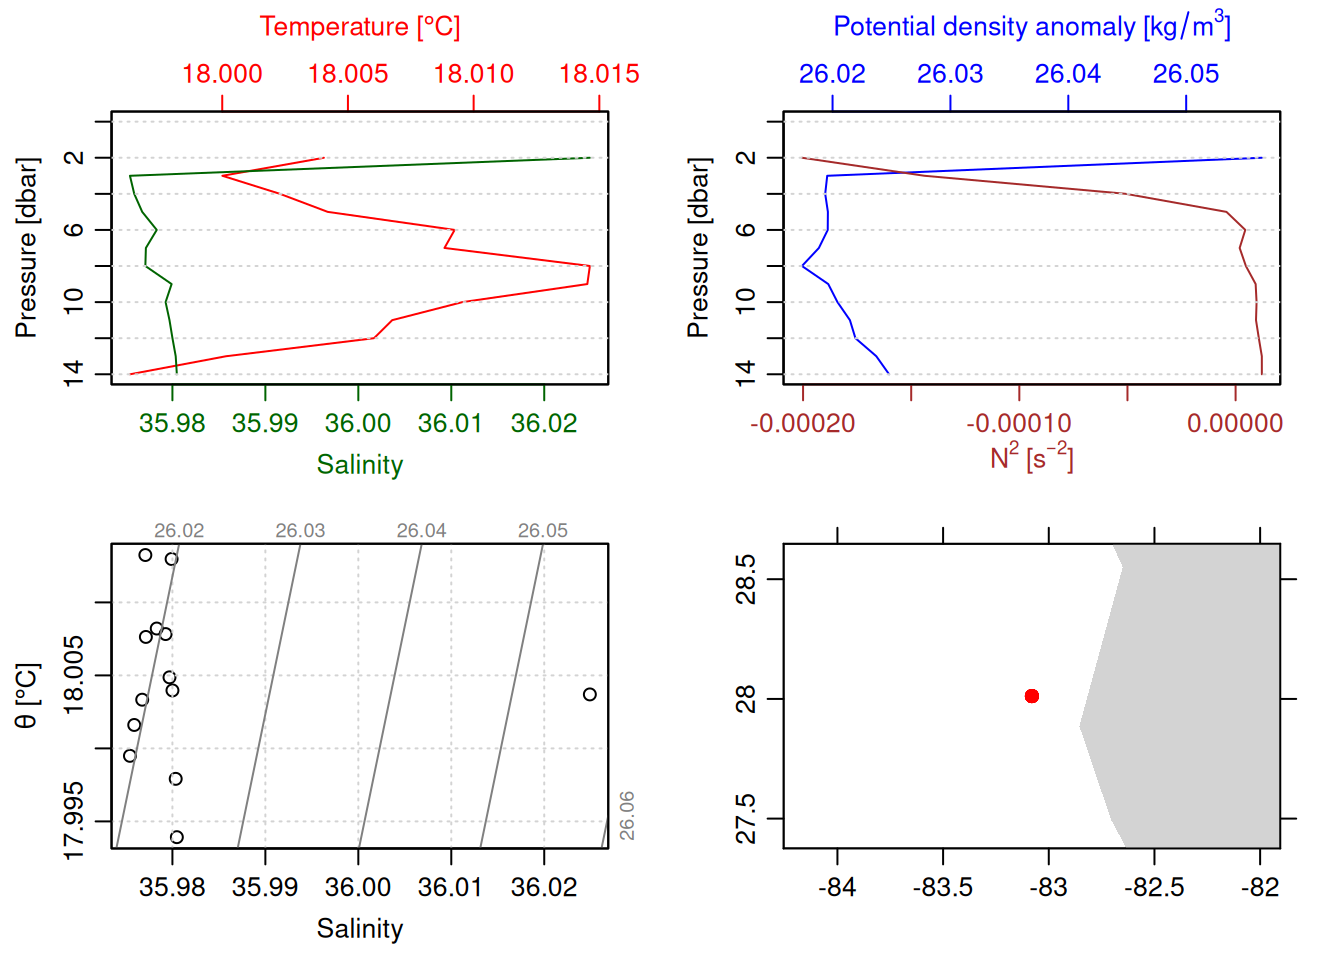
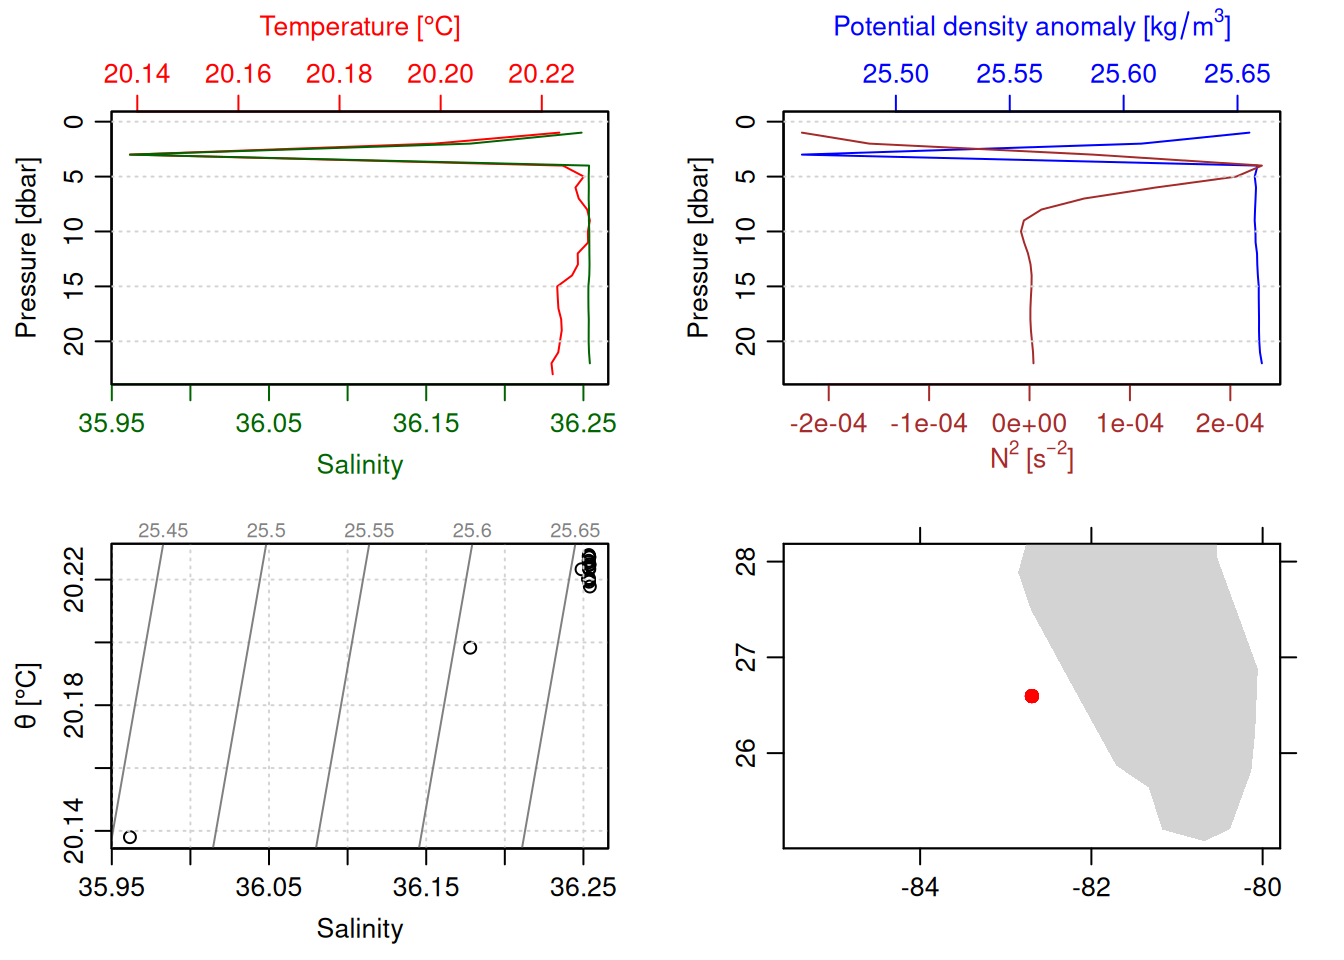
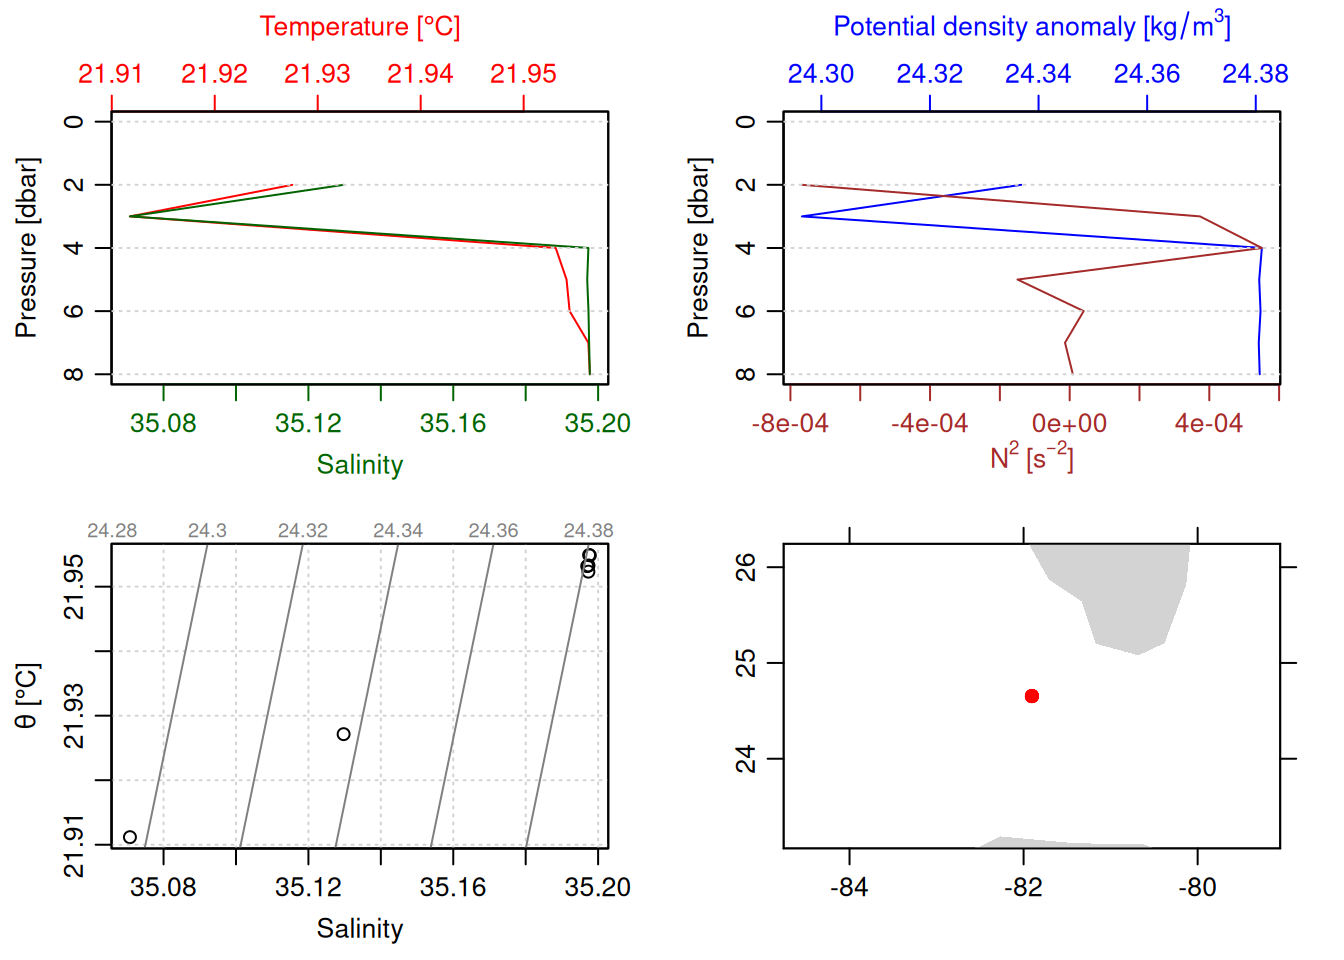
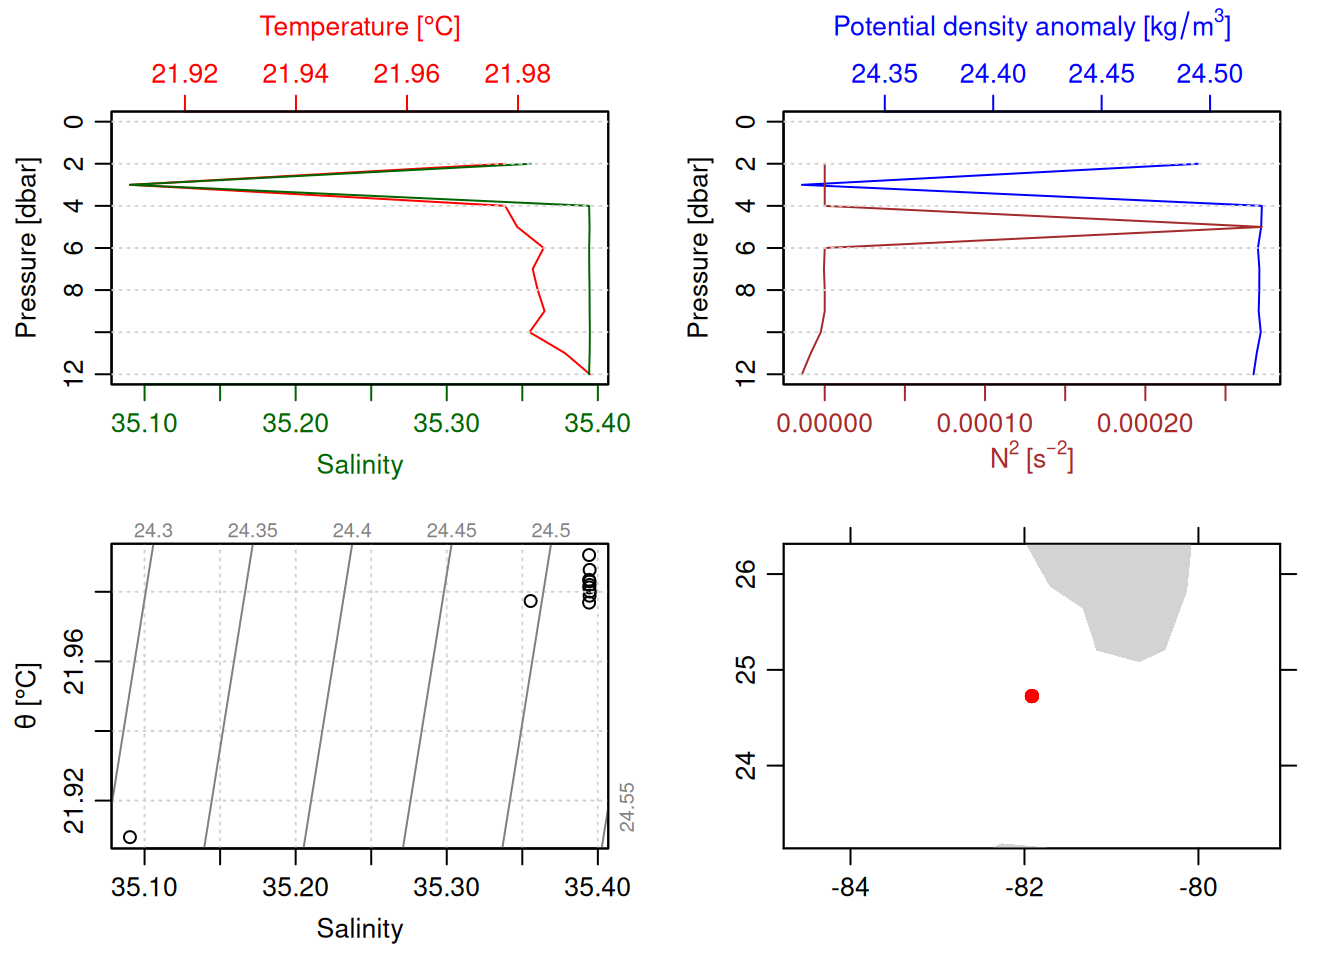
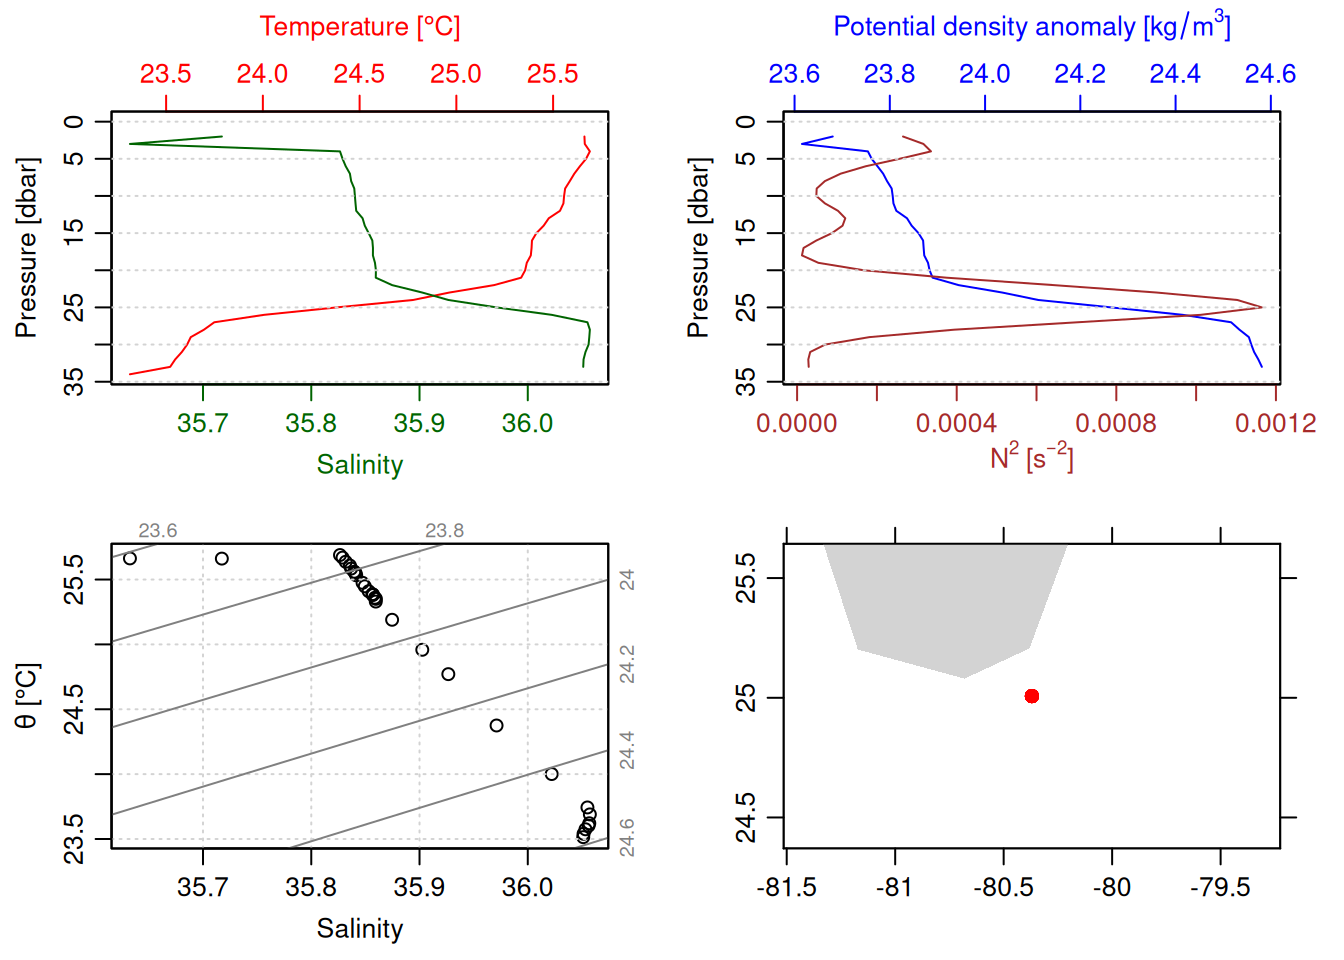
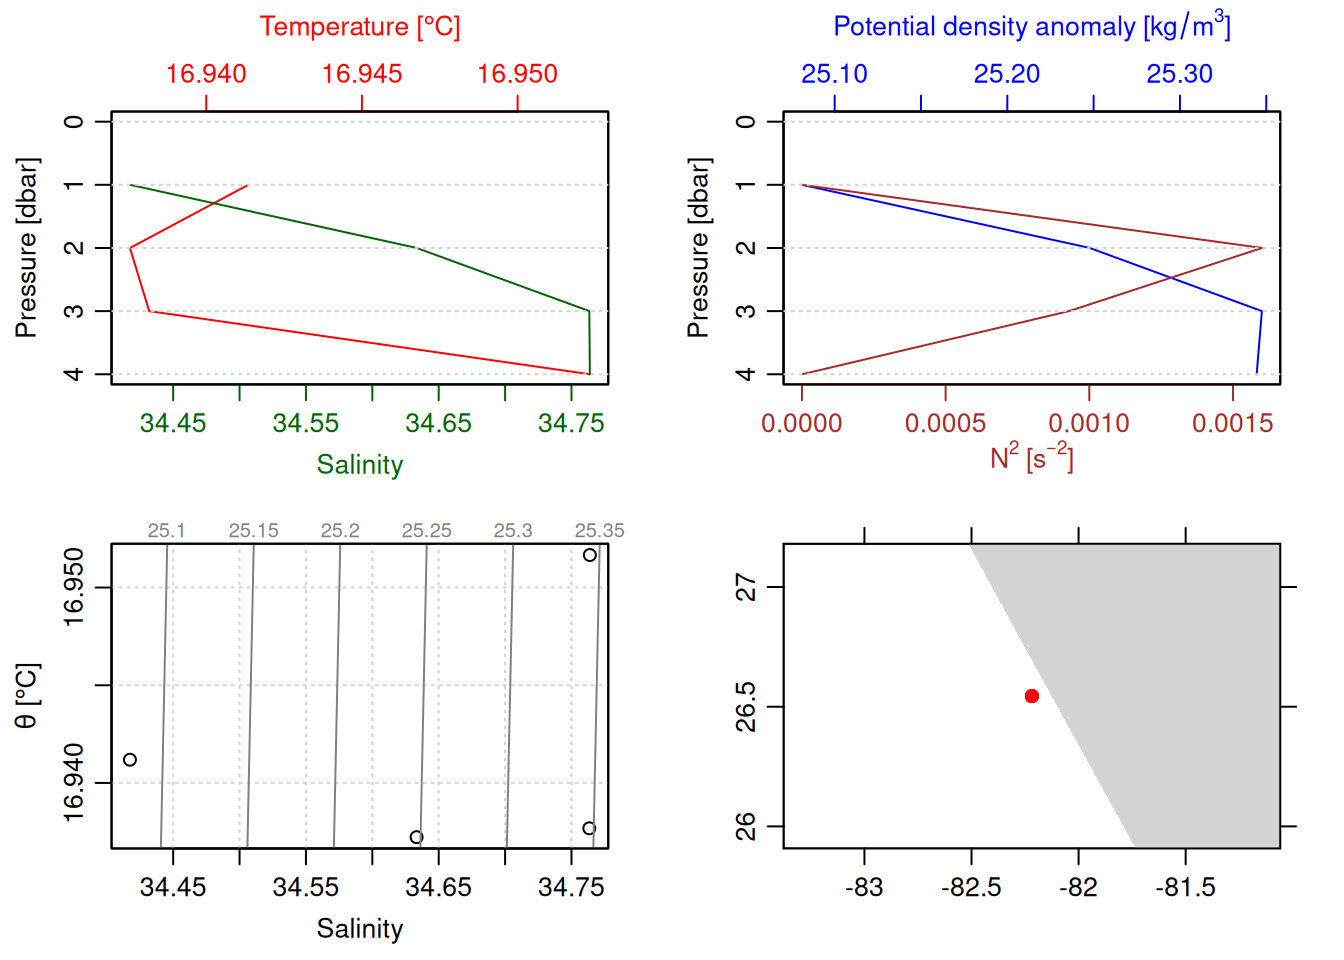
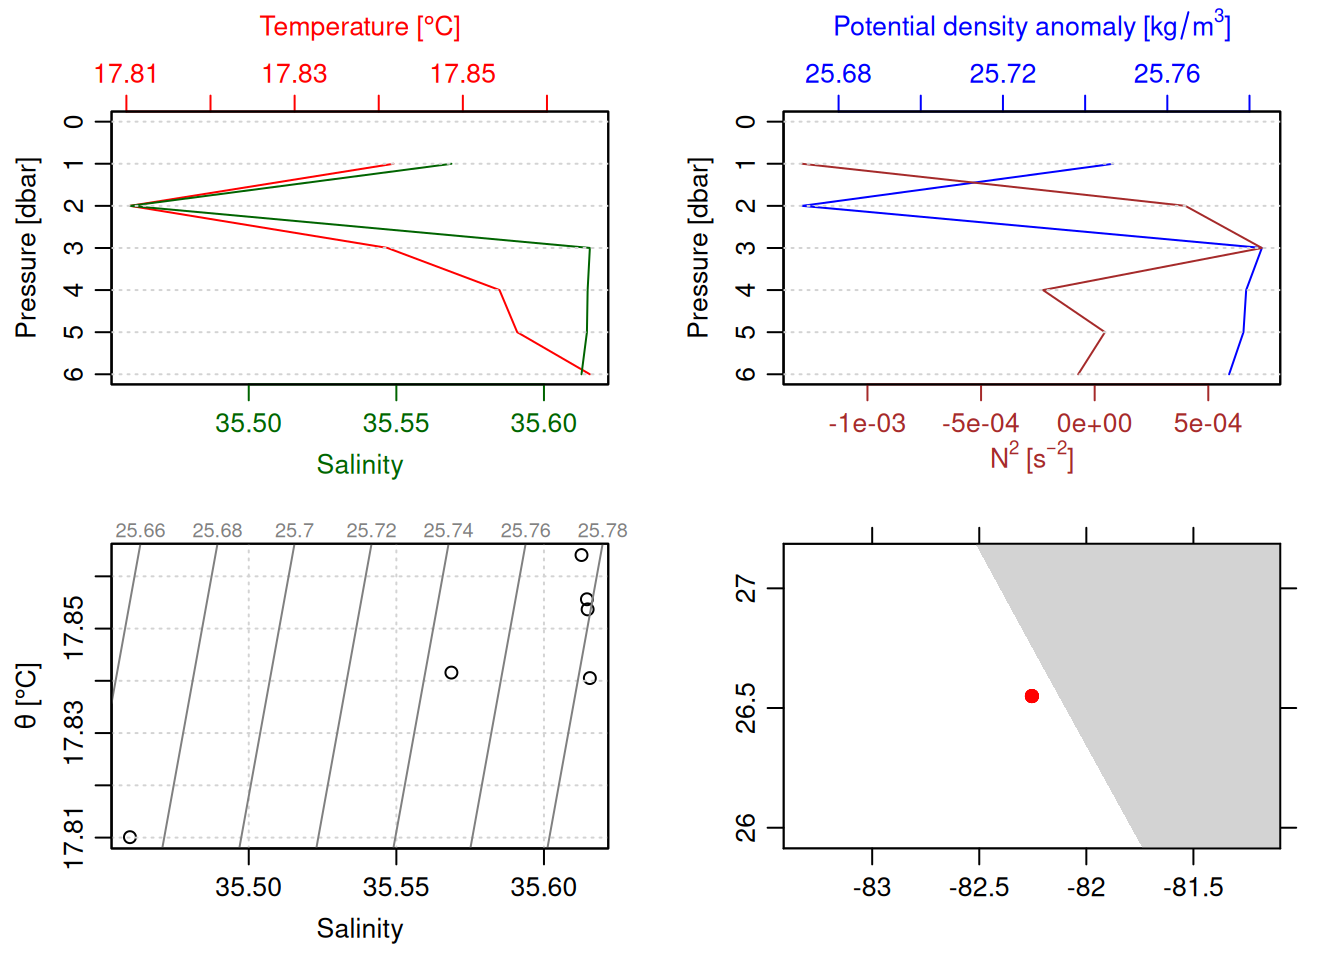
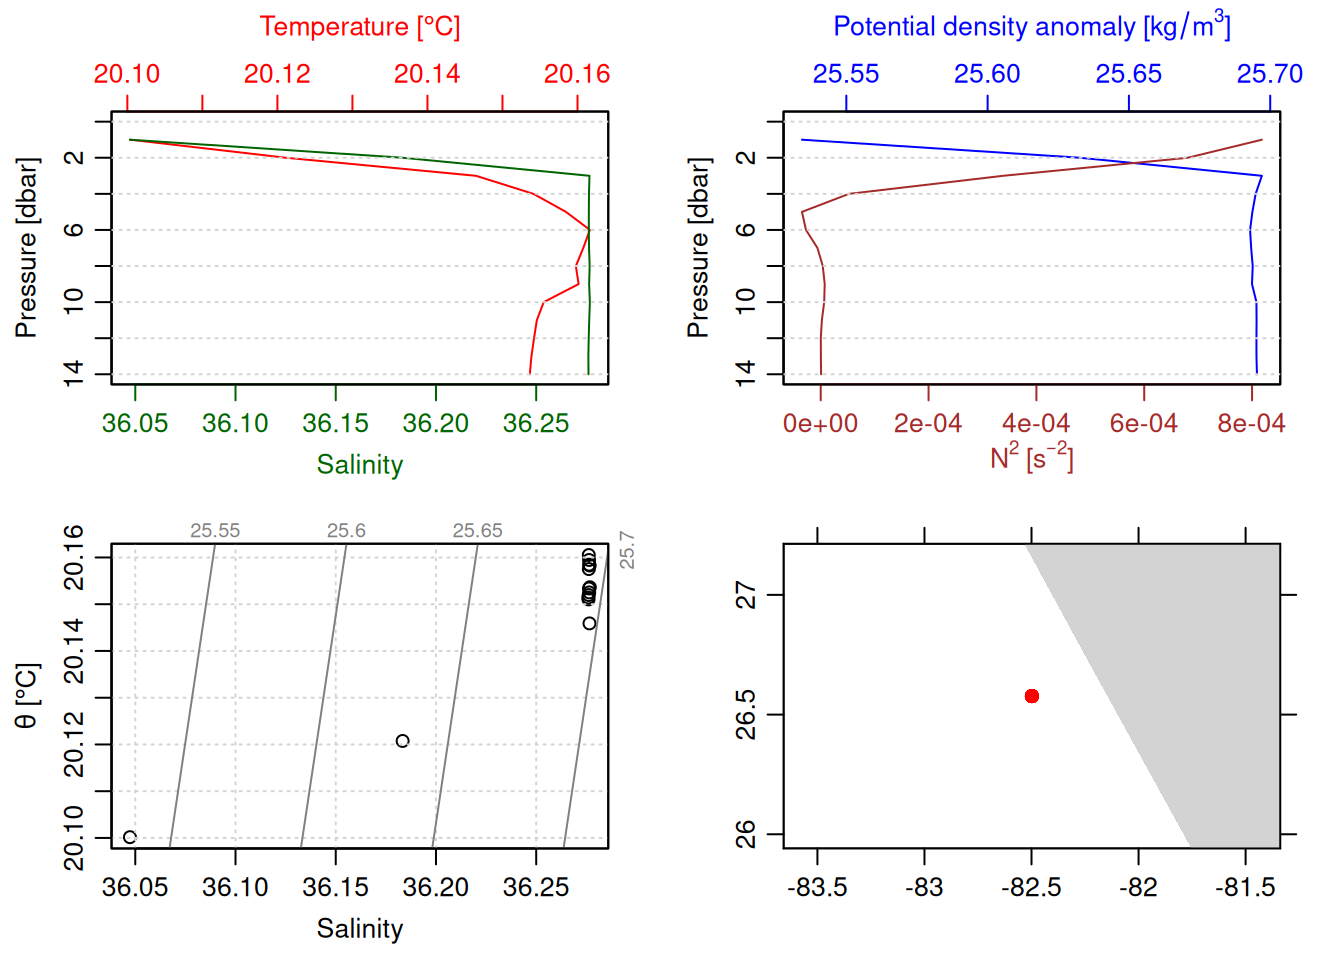
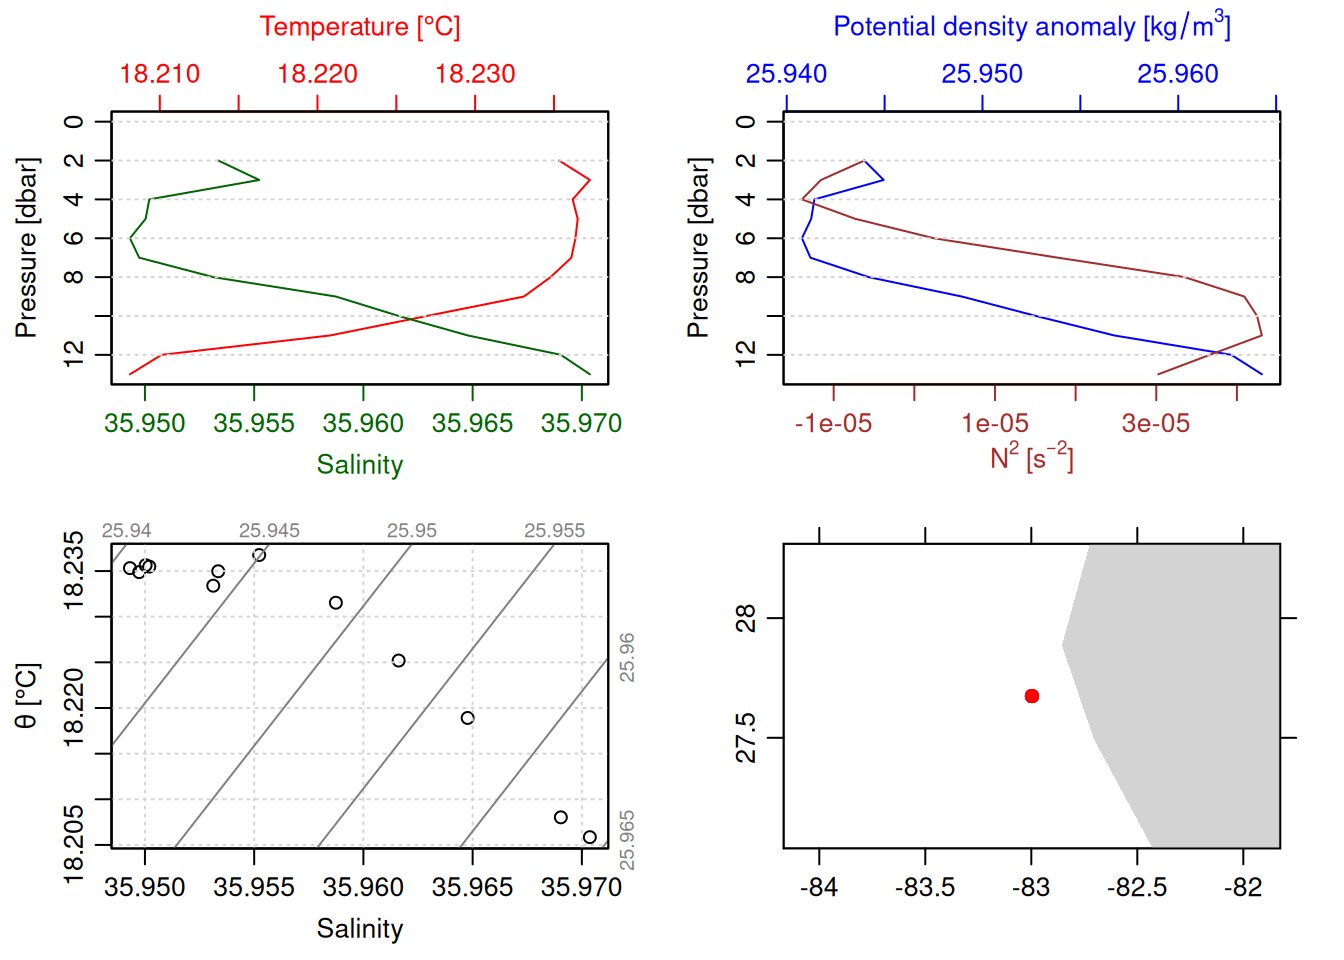
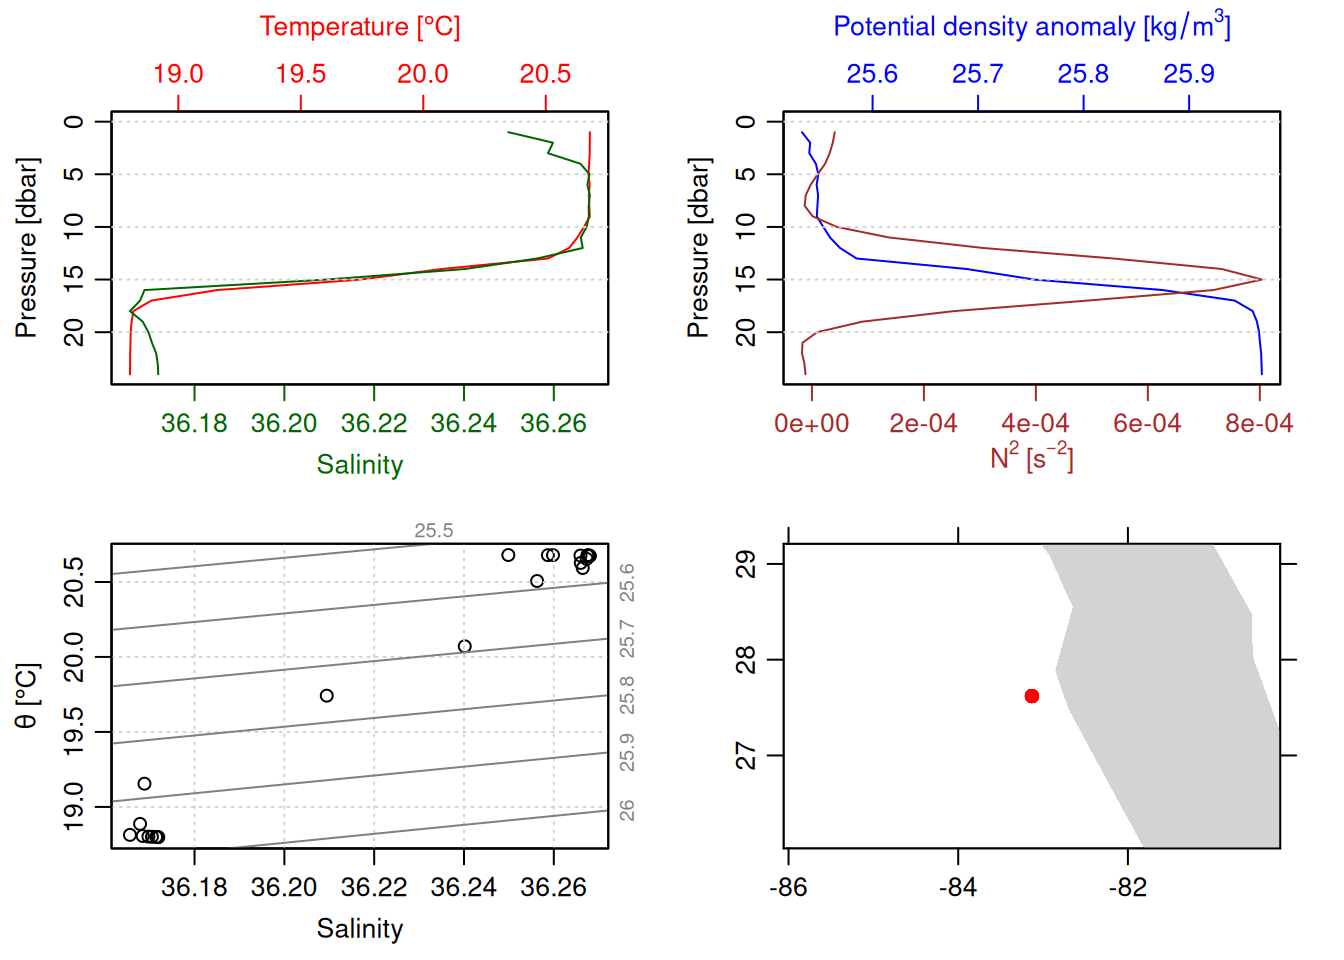
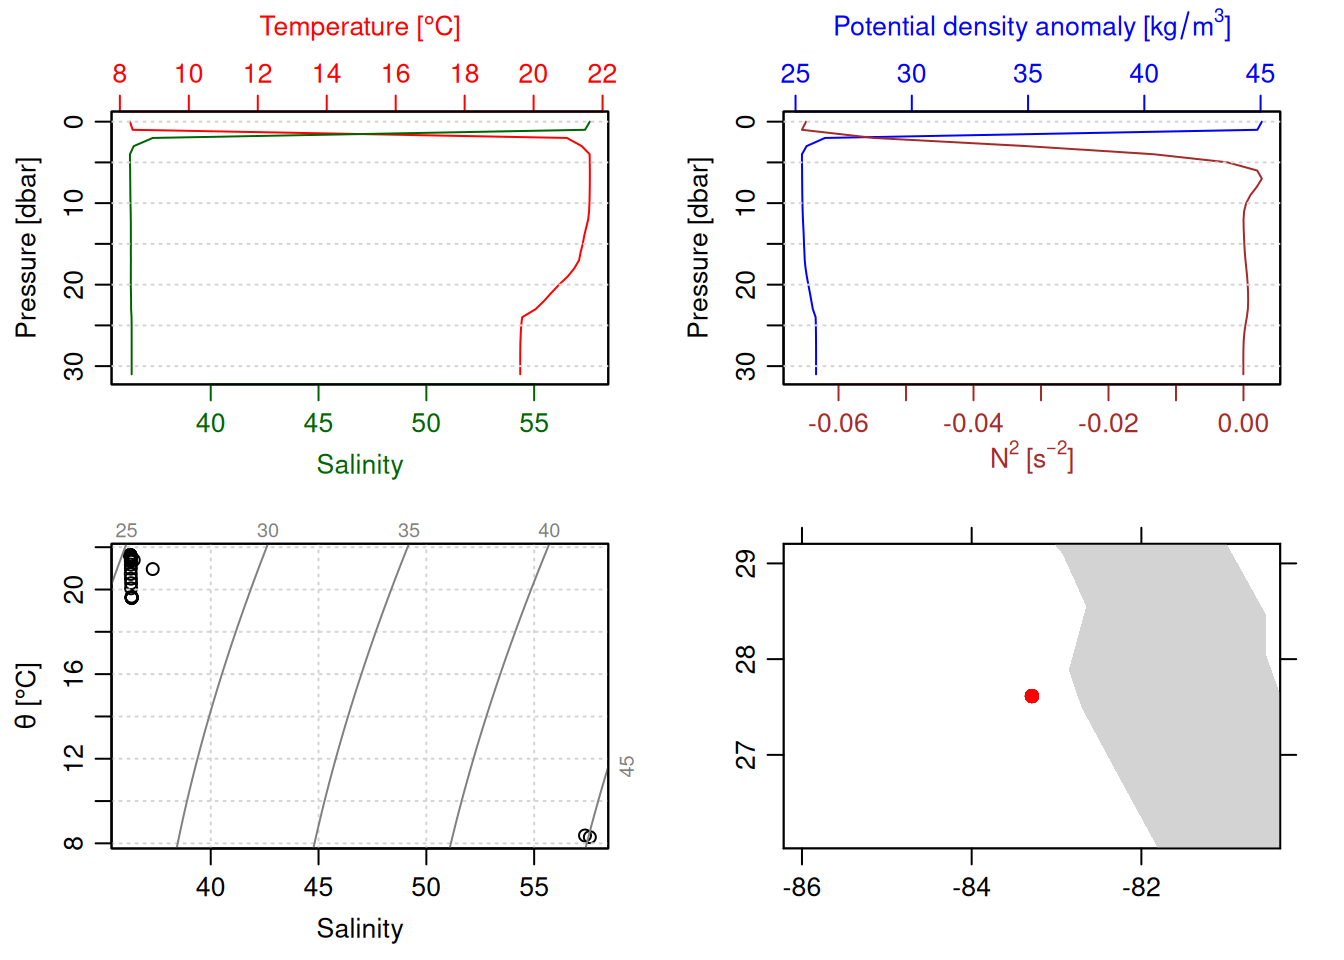
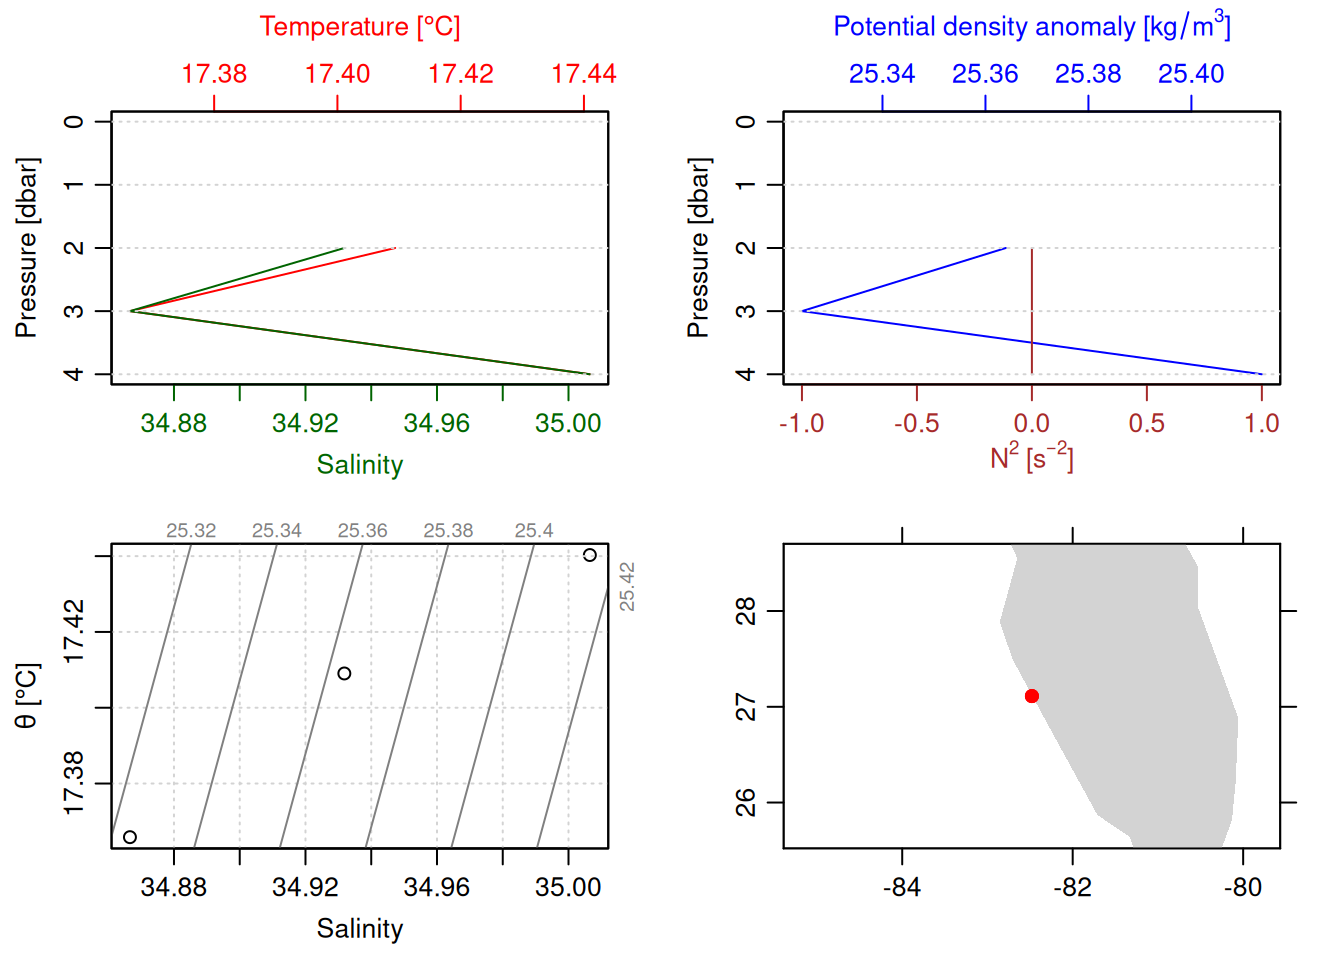
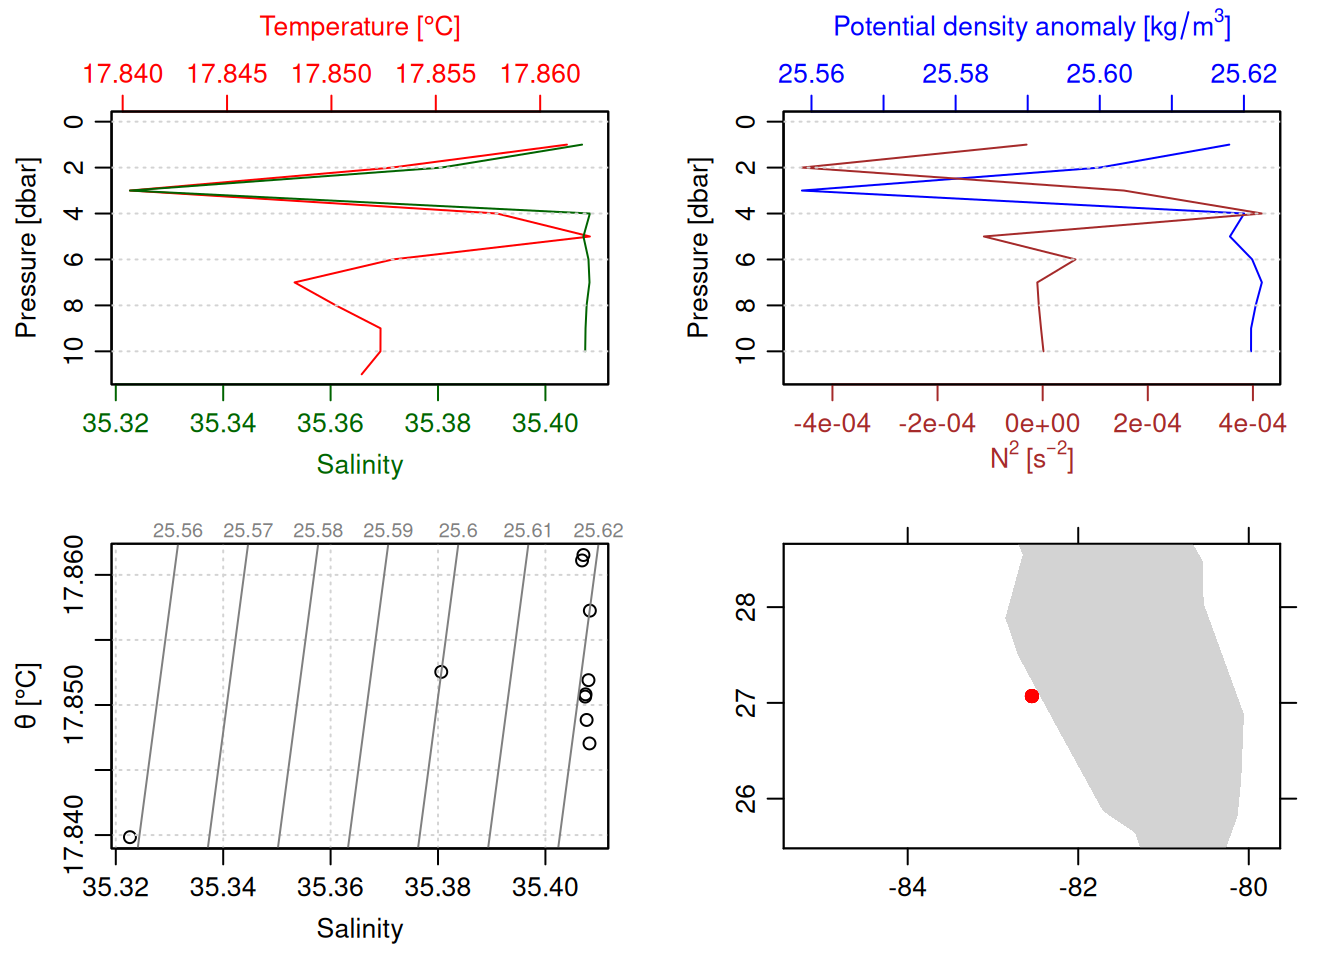
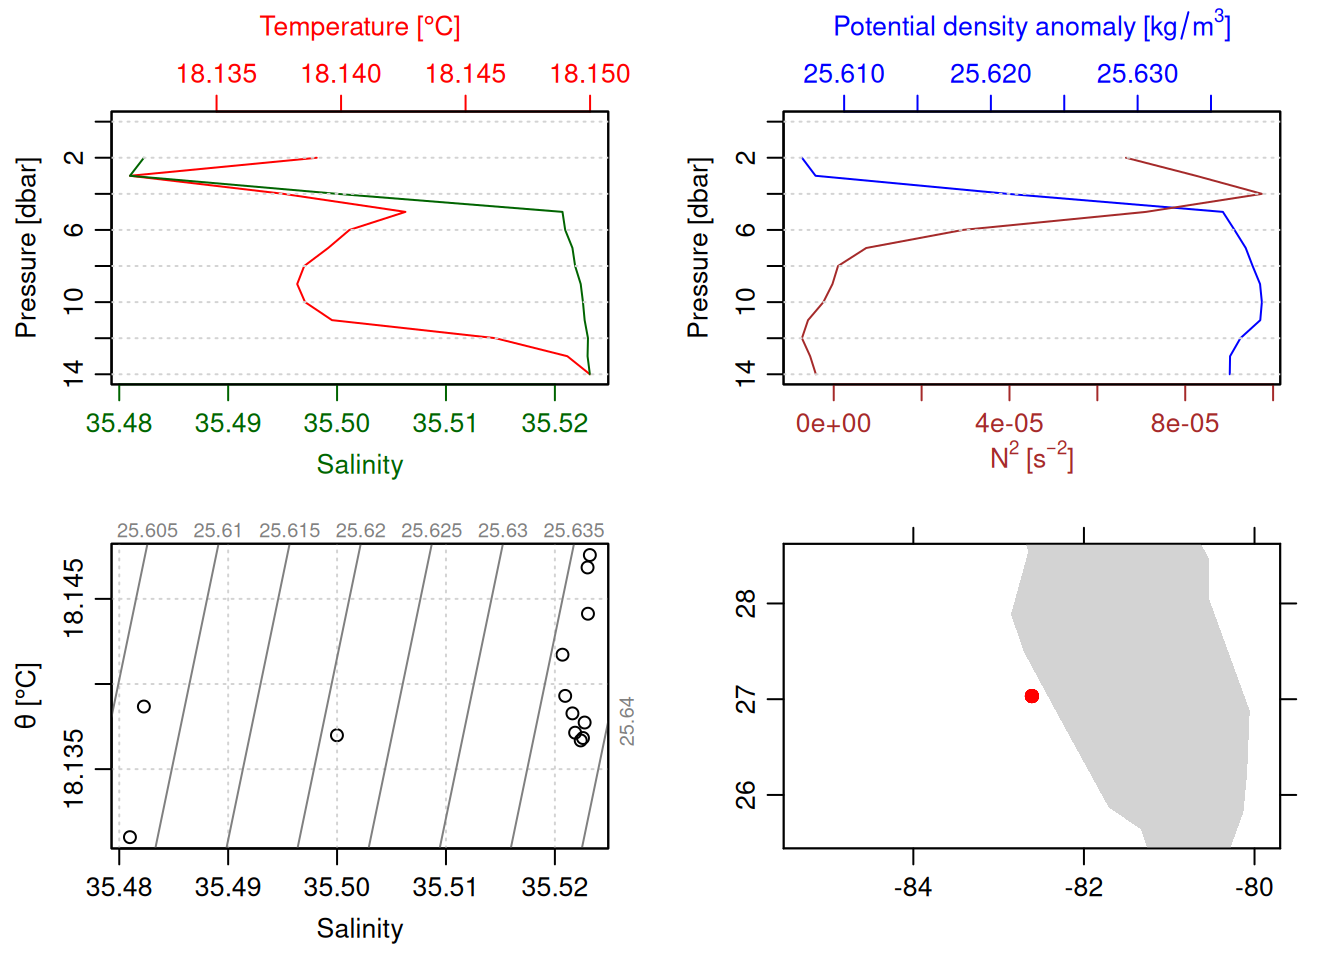
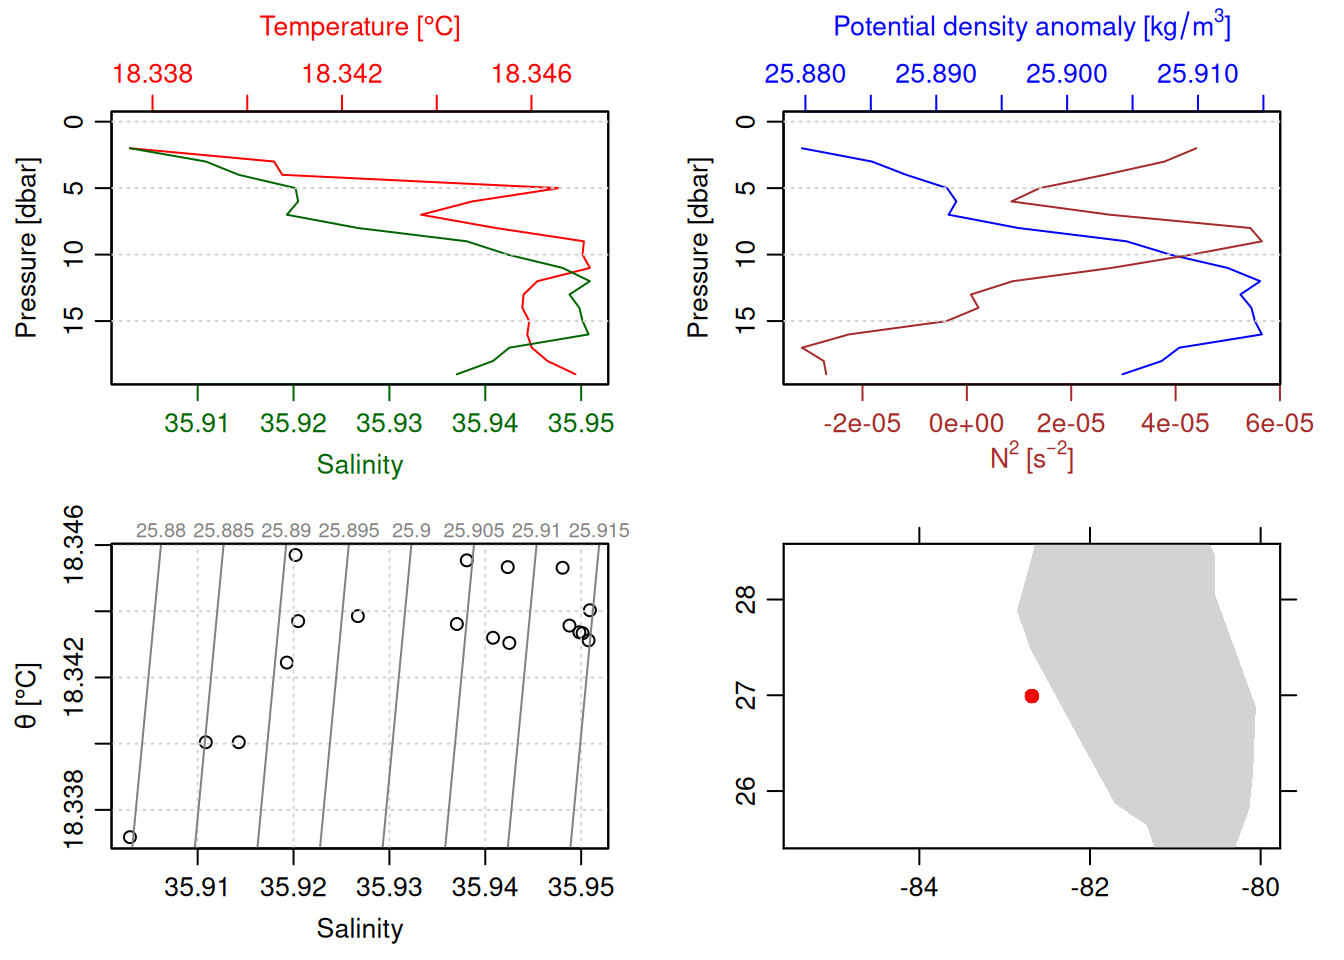
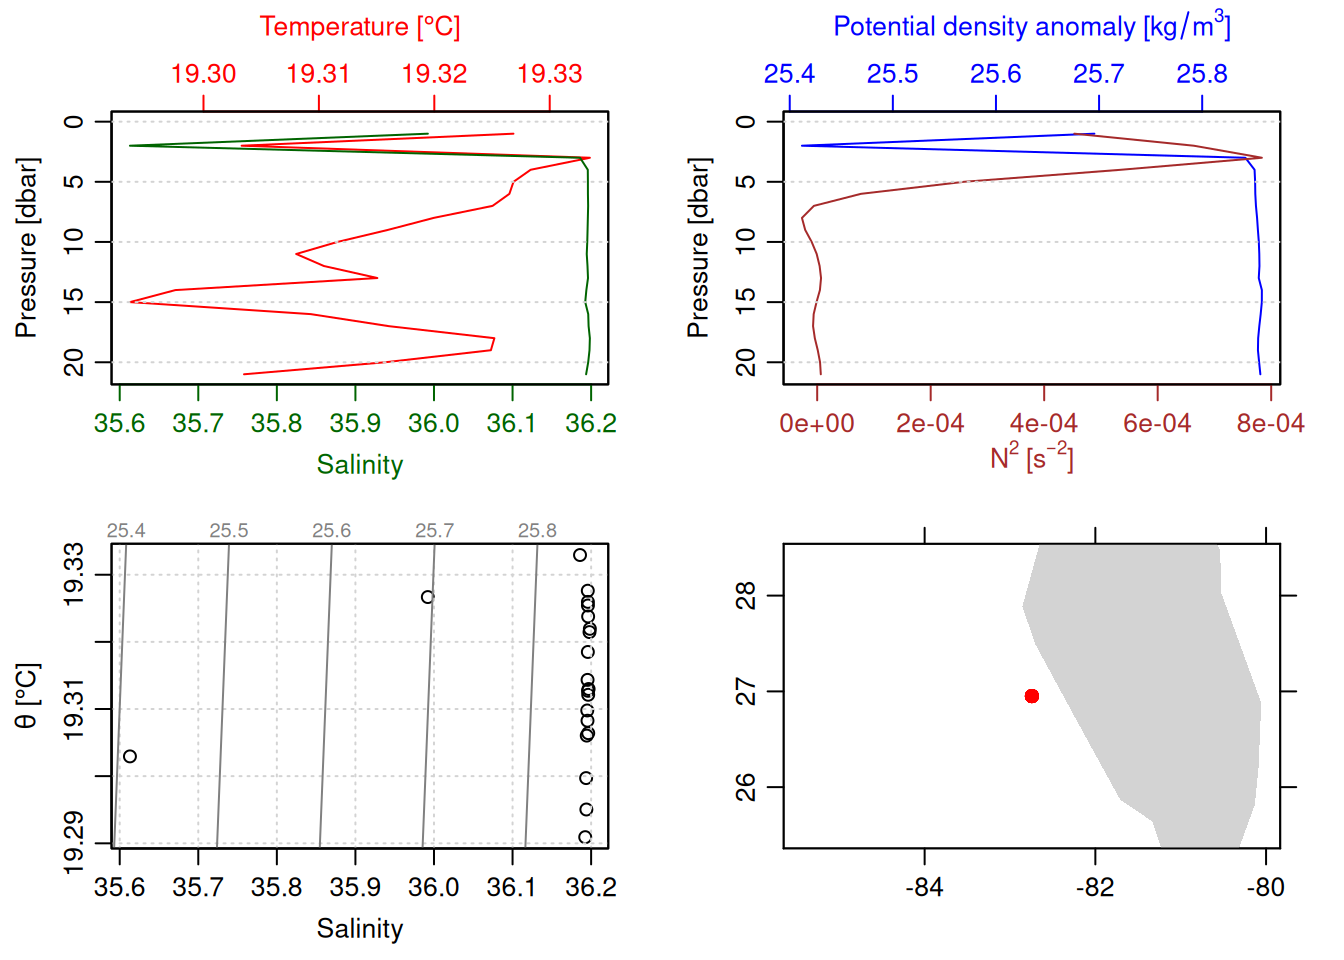
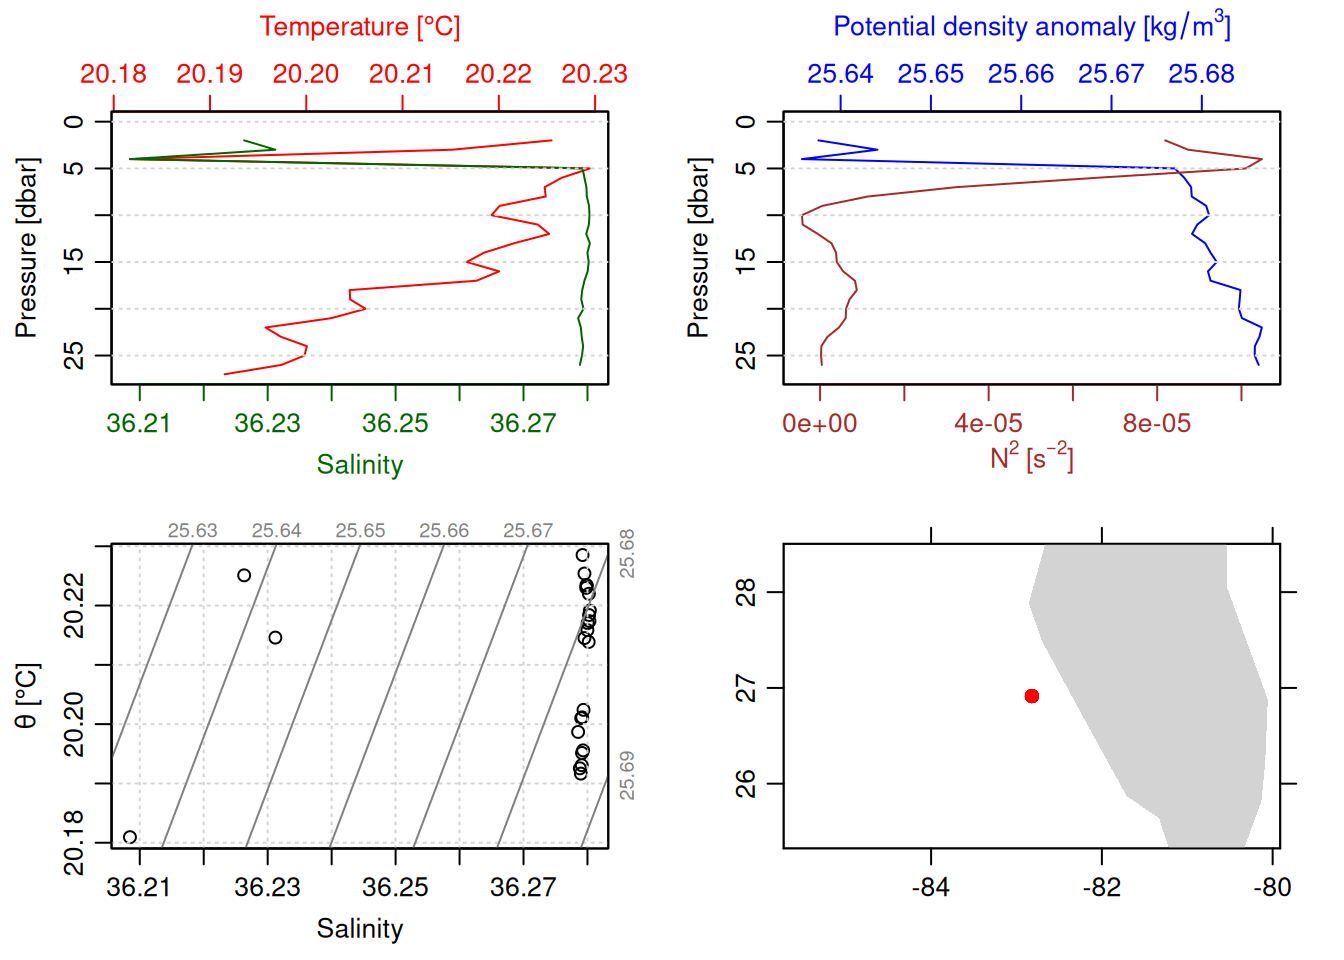
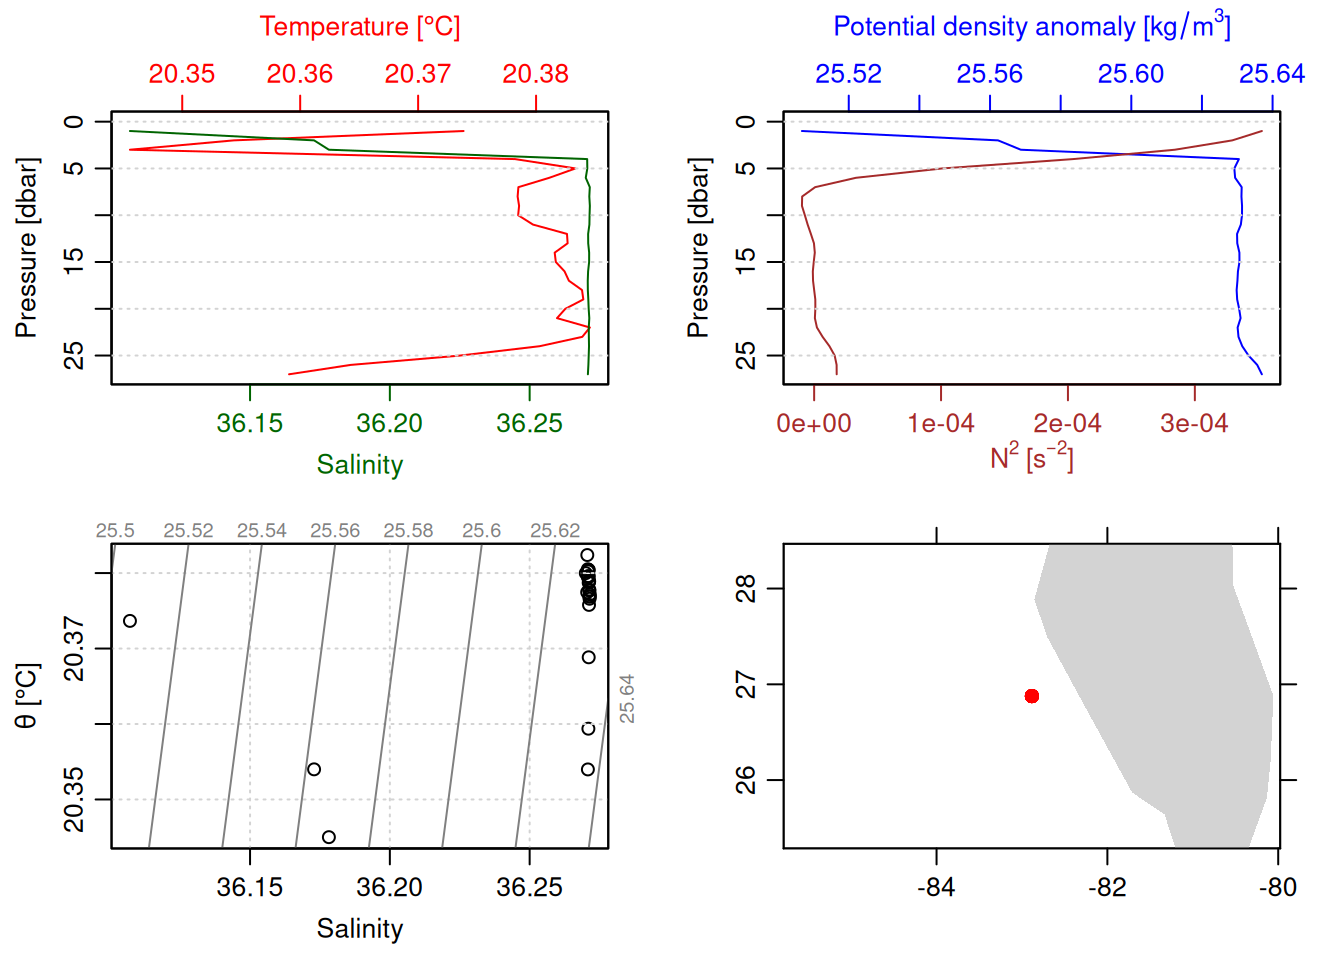
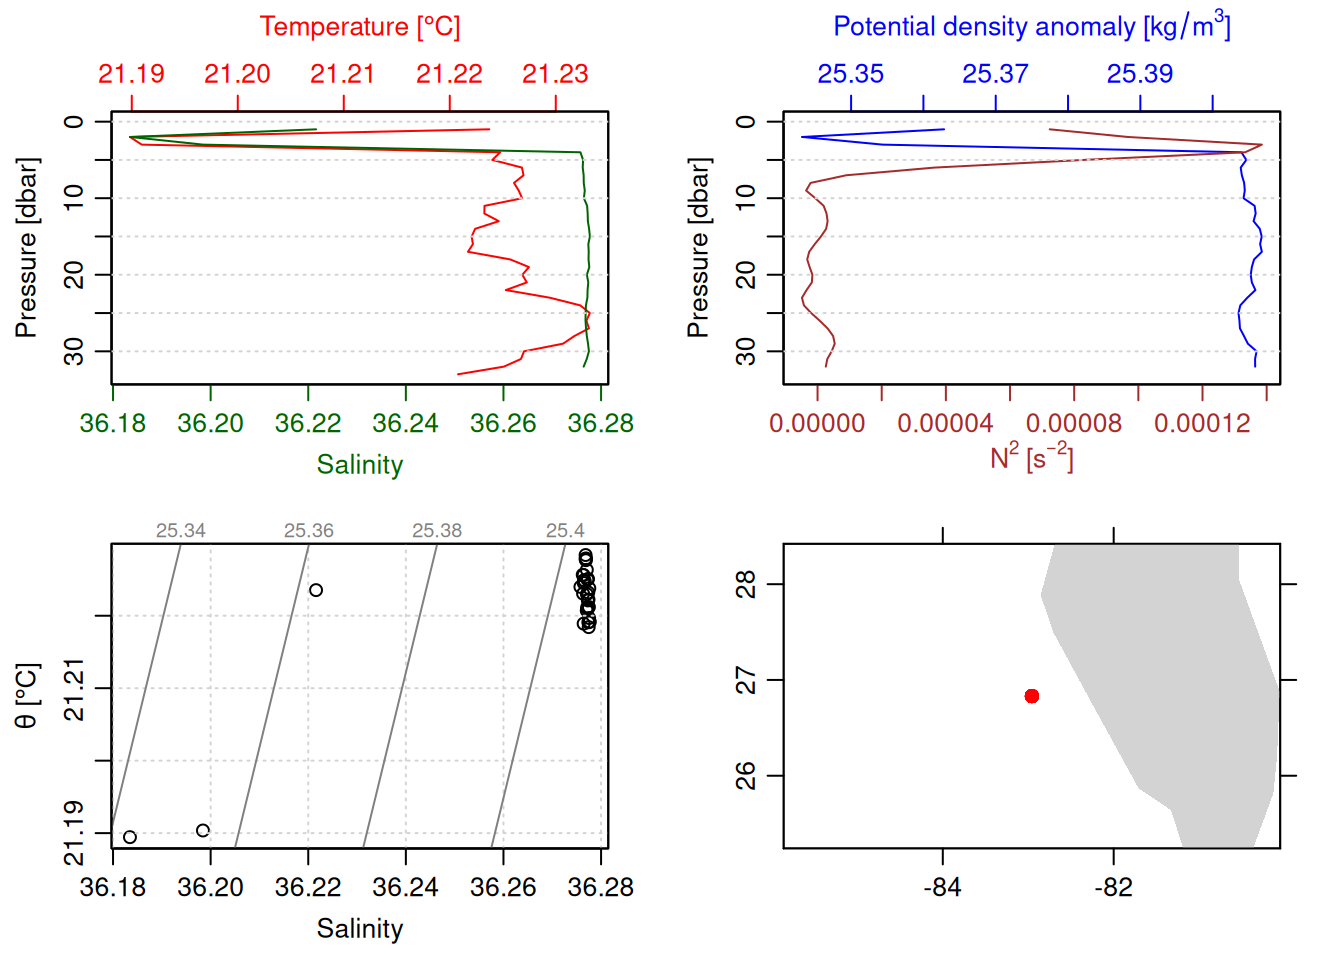
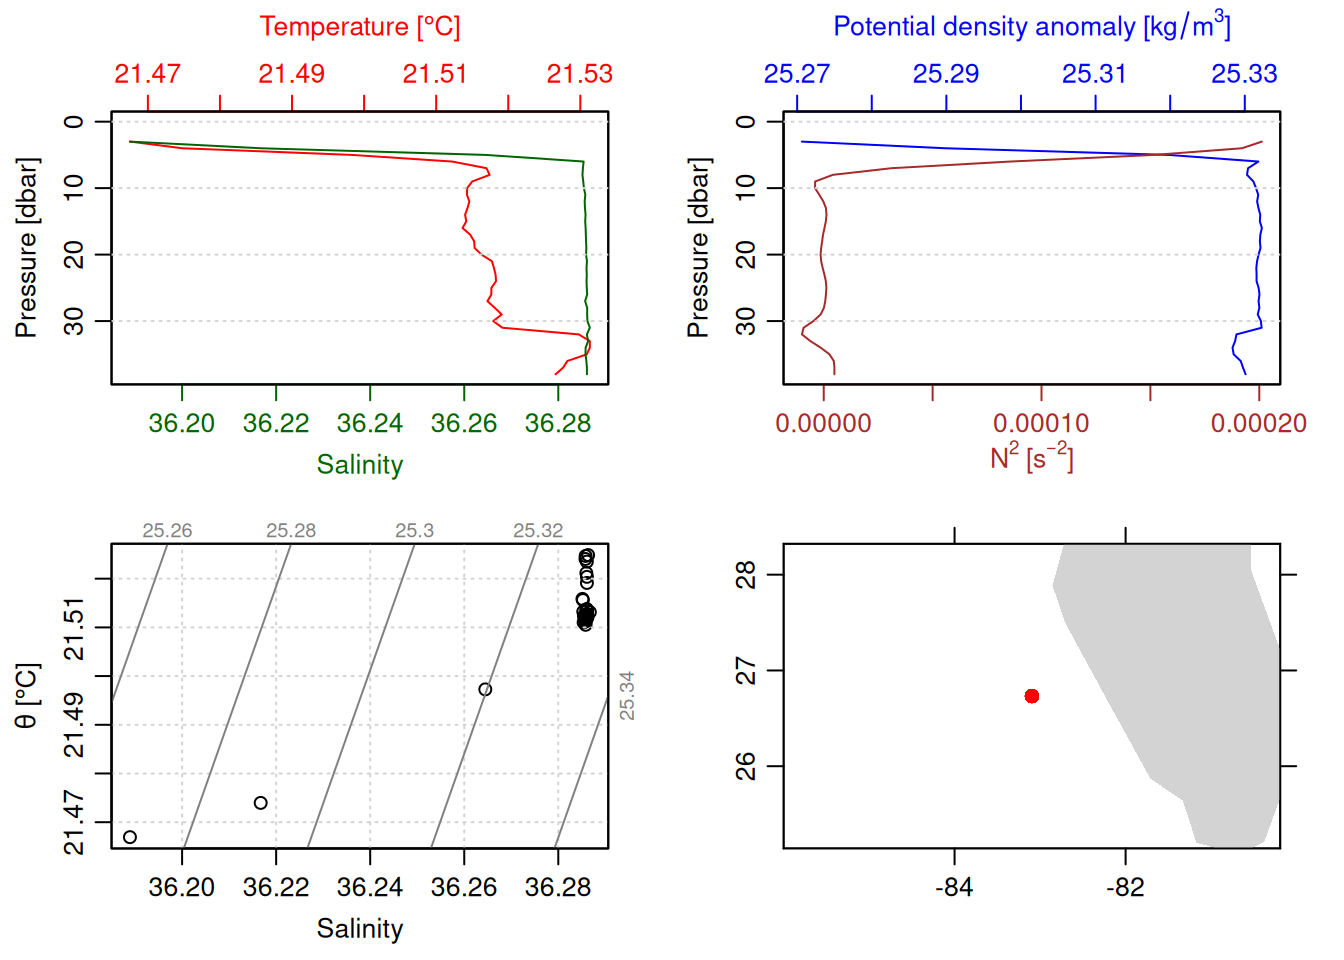
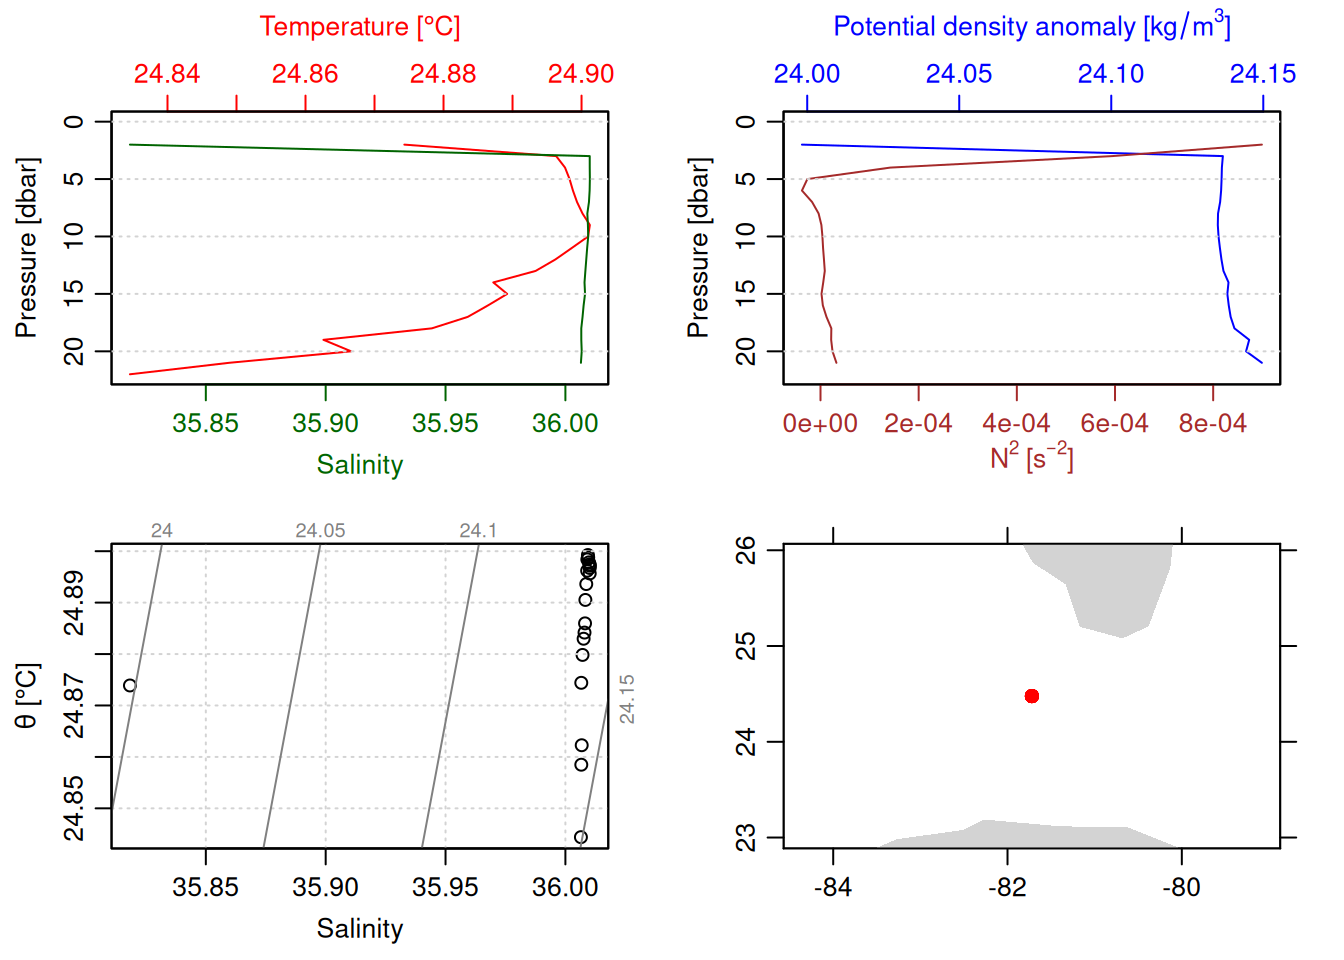
for (i inseq(ctd_FK)){ cast <- ctd_FK[[i]] # 1 is selecting only the first sublisttryCatch({plot(ctdDecimate(ctdTrim(cast))) }, error =function(e){print(e) })}
<simpleError in !is.null(x@metadata$station) && !is.na(x@metadata$station): 'length = 2410' in coercion to 'logical(1)'>
<simpleError in !is.null(x@metadata$station) && !is.na(x@metadata$station): 'length = 2635' in coercion to 'logical(1)'>
<simpleError in !is.null(x@metadata$station) && !is.na(x@metadata$station): 'length = 4250' in coercion to 'logical(1)'>
<simpleError in !is.null(x@metadata$station) && !is.na(x@metadata$station): 'length = 10157' in coercion to 'logical(1)'>
<simpleError in !is.null(x@metadata$station) && !is.na(x@metadata$station): 'length = 3213' in coercion to 'logical(1)'>
<simpleError in !is.null(x@metadata$station) && !is.na(x@metadata$station): 'length = 5044' in coercion to 'logical(1)'>
<simpleError in !is.null(x@metadata$station) && !is.na(x@metadata$station): 'length = 3332' in coercion to 'logical(1)'>
<simpleError in !is.null(x@metadata$station) && !is.na(x@metadata$station): 'length = 6207' in coercion to 'logical(1)'>
<simpleError in !is.null(x@metadata$station) && !is.na(x@metadata$station): 'length = 4497' in coercion to 'logical(1)'>
<simpleError in !is.null(x@metadata$station) && !is.na(x@metadata$station): 'length = 3782' in coercion to 'logical(1)'>
<simpleError in !is.null(x@metadata$station) && !is.na(x@metadata$station): 'length = 2894' in coercion to 'logical(1)'>
<simpleError in !is.null(x@metadata$station) && !is.na(x@metadata$station): 'length = 2952' in coercion to 'logical(1)'>
<simpleError in !is.null(x@metadata$station) && !is.na(x@metadata$station): 'length = 3062' in coercion to 'logical(1)'>
<simpleError in !is.null(x@metadata$station) && !is.na(x@metadata$station): 'length = 2812' in coercion to 'logical(1)'>
<simpleError in !is.null(x@metadata$station) && !is.na(x@metadata$station): 'length = 144' in coercion to 'logical(1)'>
<simpleError in !is.null(x@metadata$station) && !is.na(x@metadata$station): 'length = 2810' in coercion to 'logical(1)'>
<simpleError in !is.null(x@metadata$station) && !is.na(x@metadata$station): 'length = 138' in coercion to 'logical(1)'>
<simpleError in !is.null(x@metadata$station) && !is.na(x@metadata$station): 'length = 775' in coercion to 'logical(1)'>
<simpleError in !is.null(x@metadata$station) && !is.na(x@metadata$station): 'length = 13' in coercion to 'logical(1)'>
<simpleError in !is.null(x@metadata$station) && !is.na(x@metadata$station): 'length = 2949' in coercion to 'logical(1)'>
<simpleError in !is.null(x@metadata$station) && !is.na(x@metadata$station): 'length = 4029' in coercion to 'logical(1)'>
<simpleError in !is.null(x@metadata$station) && !is.na(x@metadata$station): 'length = 4266' in coercion to 'logical(1)'>
<simpleError in !is.null(x@metadata$station) && !is.na(x@metadata$station): 'length = 4254' in coercion to 'logical(1)'>
<simpleError in !is.null(x@metadata$station) && !is.na(x@metadata$station): 'length = 3216' in coercion to 'logical(1)'>
<simpleError in !is.null(x@metadata$station) && !is.na(x@metadata$station): 'length = 2678' in coercion to 'logical(1)'>
<simpleError in !is.null(x@metadata$station) && !is.na(x@metadata$station): 'length = 6110' in coercion to 'logical(1)'>
<simpleError in !is.null(x@metadata$station) && !is.na(x@metadata$station): 'length = 3459' in coercion to 'logical(1)'>
<simpleError in !is.null(x@metadata$station) && !is.na(x@metadata$station): 'length = 2845' in coercion to 'logical(1)'>
<simpleError in !is.null(x@metadata$station) && !is.na(x@metadata$station): 'length = 4106' in coercion to 'logical(1)'>
<simpleError in !is.null(x@metadata$station) && !is.na(x@metadata$station): 'length = 4335' in coercion to 'logical(1)'>
<simpleError in !is.null(x@metadata$station) && !is.na(x@metadata$station): 'length = 4708' in coercion to 'logical(1)'>
<simpleError in !is.null(x@metadata$station) && !is.na(x@metadata$station): 'length = 5013' in coercion to 'logical(1)'>
<simpleError in !is.null(x@metadata$station) && !is.na(x@metadata$station): 'length = 5509' in coercion to 'logical(1)'>
<simpleError in !is.null(x@metadata$station) && !is.na(x@metadata$station): 'length = 5573' in coercion to 'logical(1)'>
<simpleError in !is.null(x@metadata$station) && !is.na(x@metadata$station): 'length = 6866' in coercion to 'logical(1)'>
<simpleError in !is.null(x@metadata$station) && !is.na(x@metadata$station): 'length = 3502' in coercion to 'logical(1)'>
<simpleError in !is.null(x@metadata$station) && !is.na(x@metadata$station): 'length = 4069' in coercion to 'logical(1)'>
<simpleError in !is.null(x@metadata$station) && !is.na(x@metadata$station): 'length = 3768' in coercion to 'logical(1)'>
<simpleError in !is.null(x@metadata$station) && !is.na(x@metadata$station): 'length = 4155' in coercion to 'logical(1)'>
<simpleError in !is.null(x@metadata$station) && !is.na(x@metadata$station): 'length = 275' in coercion to 'logical(1)'>
<simpleError in !is.null(x@metadata$station) && !is.na(x@metadata$station): 'length = 3212' in coercion to 'logical(1)'>
<simpleError in !is.null(x@metadata$station) && !is.na(x@metadata$station): 'length = 3500' in coercion to 'logical(1)'>
<simpleError in !is.null(x@metadata$station) && !is.na(x@metadata$station): 'length = 3810' in coercion to 'logical(1)'>
<simpleError in !is.null(x@metadata$station) && !is.na(x@metadata$station): 'length = 4241' in coercion to 'logical(1)'>
<simpleError in !is.null(x@metadata$station) && !is.na(x@metadata$station): 'length = 5124' in coercion to 'logical(1)'>
<simpleError in !is.null(x@metadata$station) && !is.na(x@metadata$station): 'length = 3244' in coercion to 'logical(1)'>
<simpleError in !is.null(x@metadata$station) && !is.na(x@metadata$station): 'length = 3476' in coercion to 'logical(1)'>
<simpleError in !is.null(x@metadata$station) && !is.na(x@metadata$station): 'length = 3757' in coercion to 'logical(1)'>
<simpleError in !is.null(x@metadata$station) && !is.na(x@metadata$station): 'length = 5006' in coercion to 'logical(1)'>
<simpleError in !is.null(x@metadata$station) && !is.na(x@metadata$station): 'length = 4612' in coercion to 'logical(1)'>
<simpleError in !is.null(x@metadata$station) && !is.na(x@metadata$station): 'length = 3146' in coercion to 'logical(1)'>
<simpleError in !is.null(x@metadata$station) && !is.na(x@metadata$station): 'length = 3512' in coercion to 'logical(1)'>
<simpleError in !is.null(x@metadata$station) && !is.na(x@metadata$station): 'length = 4962' in coercion to 'logical(1)'>
<simpleError in !is.null(x@metadata$station) && !is.na(x@metadata$station): 'length = 4702' in coercion to 'logical(1)'>
<simpleError in !is.null(x@metadata$station) && !is.na(x@metadata$station): 'length = 2899' in coercion to 'logical(1)'>
<simpleError in !is.null(x@metadata$station) && !is.na(x@metadata$station): 'length = 3234' in coercion to 'logical(1)'>
<simpleError in !is.null(x@metadata$station) && !is.na(x@metadata$station): 'length = 2977' in coercion to 'logical(1)'>
<simpleError in !is.null(x@metadata$station) && !is.na(x@metadata$station): 'length = 4057' in coercion to 'logical(1)'>
<simpleError in !is.null(x@metadata$station) && !is.na(x@metadata$station): 'length = 2999' in coercion to 'logical(1)'>
<simpleError in !is.null(x@metadata$station) && !is.na(x@metadata$station): 'length = 9390' in coercion to 'logical(1)'>
<simpleError in !is.null(x@metadata$station) && !is.na(x@metadata$station): 'length = 3360' in coercion to 'logical(1)'>
<simpleError in !is.null(x@metadata$station) && !is.na(x@metadata$station): 'length = 3803' in coercion to 'logical(1)'>
<simpleError in !is.null(x@metadata$station) && !is.na(x@metadata$station): 'length = 3603' in coercion to 'logical(1)'>
<simpleError in !is.null(x@metadata$station) && !is.na(x@metadata$station): 'length = 5371' in coercion to 'logical(1)'>
<simpleError in !is.null(x@metadata$station) && !is.na(x@metadata$station): 'length = 2817' in coercion to 'logical(1)'>
<simpleError in !is.null(x@metadata$station) && !is.na(x@metadata$station): 'length = 4168' in coercion to 'logical(1)'>
<simpleError in !is.null(x@metadata$station) && !is.na(x@metadata$station): 'length = 5294' in coercion to 'logical(1)'>
<simpleError in !is.null(x@metadata$station) && !is.na(x@metadata$station): 'length = 4775' in coercion to 'logical(1)'>
<simpleError in !is.null(x@metadata$station) && !is.na(x@metadata$station): 'length = 4238' in coercion to 'logical(1)'>
<simpleError in !is.null(x@metadata$station) && !is.na(x@metadata$station): 'length = 4426' in coercion to 'logical(1)'>
<simpleError in !is.null(x@metadata$station) && !is.na(x@metadata$station): 'length = 5896' in coercion to 'logical(1)'>
<simpleError in !is.null(x@metadata$station) && !is.na(x@metadata$station): 'length = 5761' in coercion to 'logical(1)'>
<simpleError in !is.null(x@metadata$station) && !is.na(x@metadata$station): 'length = 4927' in coercion to 'logical(1)'>
<simpleError in !is.null(x@metadata$station) && !is.na(x@metadata$station): 'length = 3826' in coercion to 'logical(1)'>
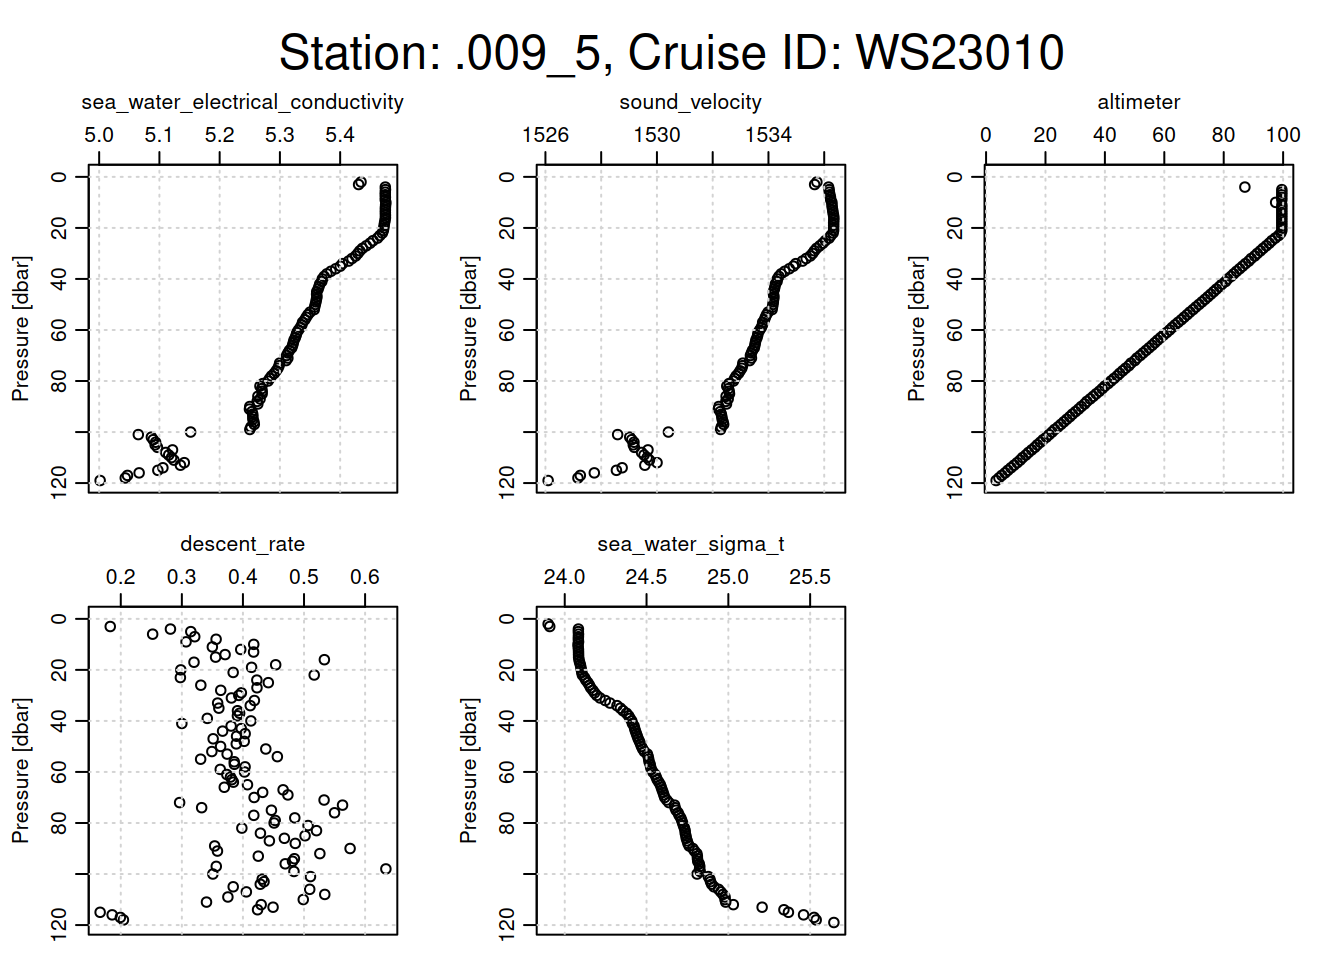
plotting other physical parameters for each cast
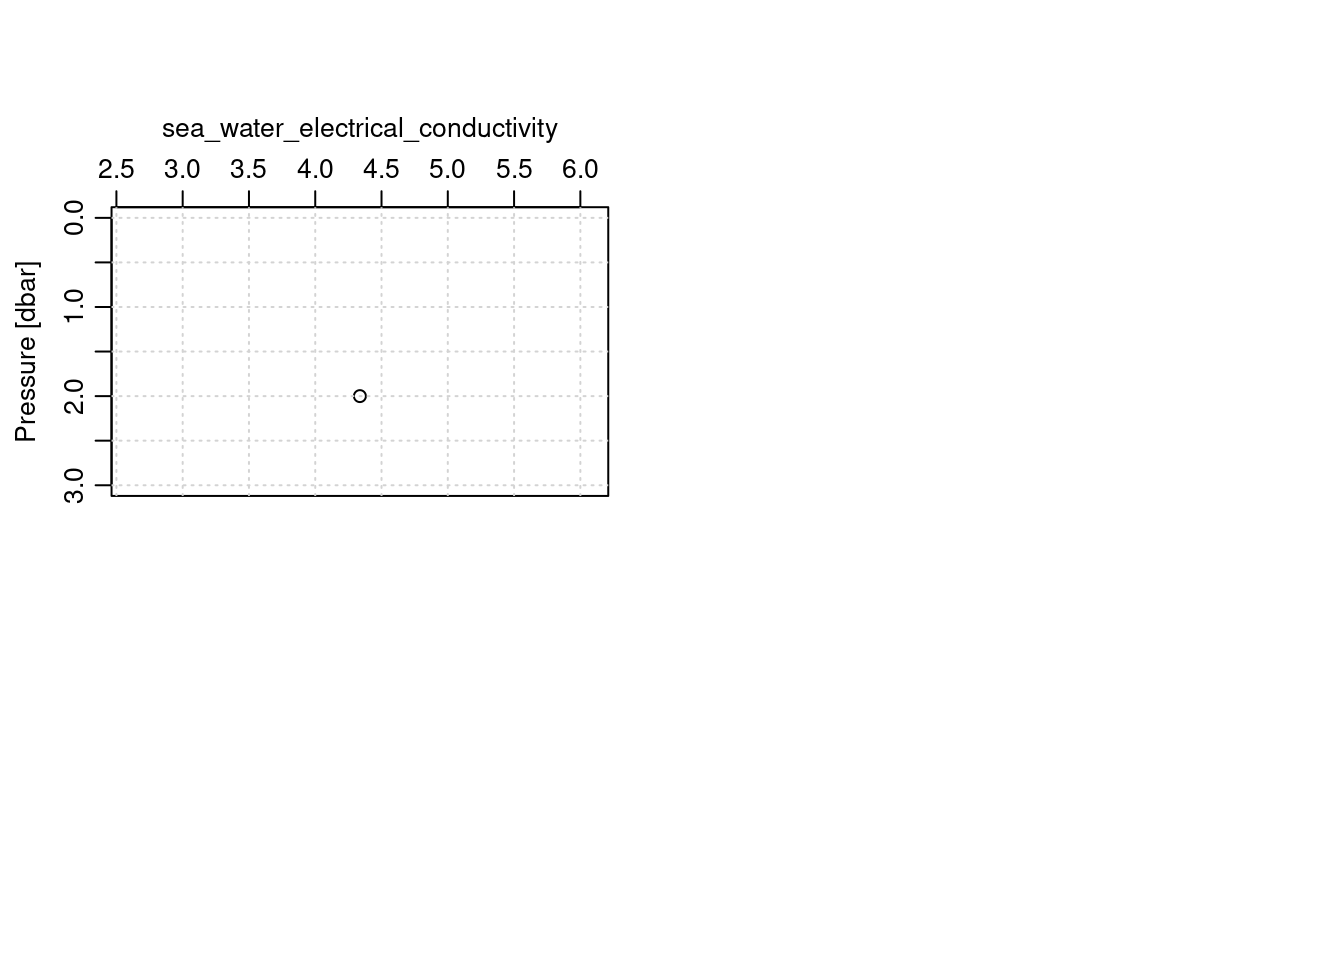
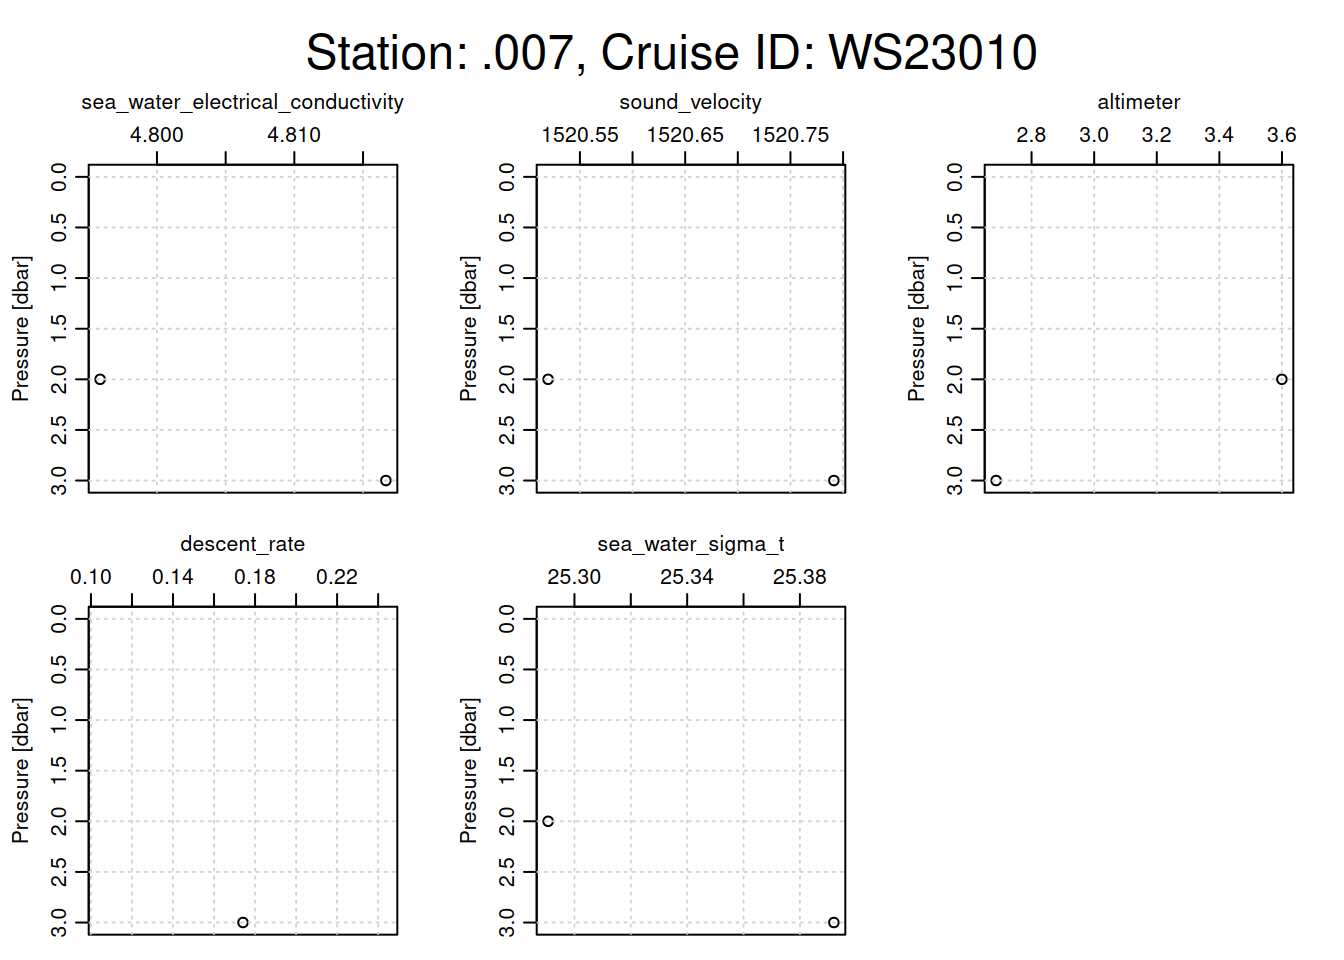
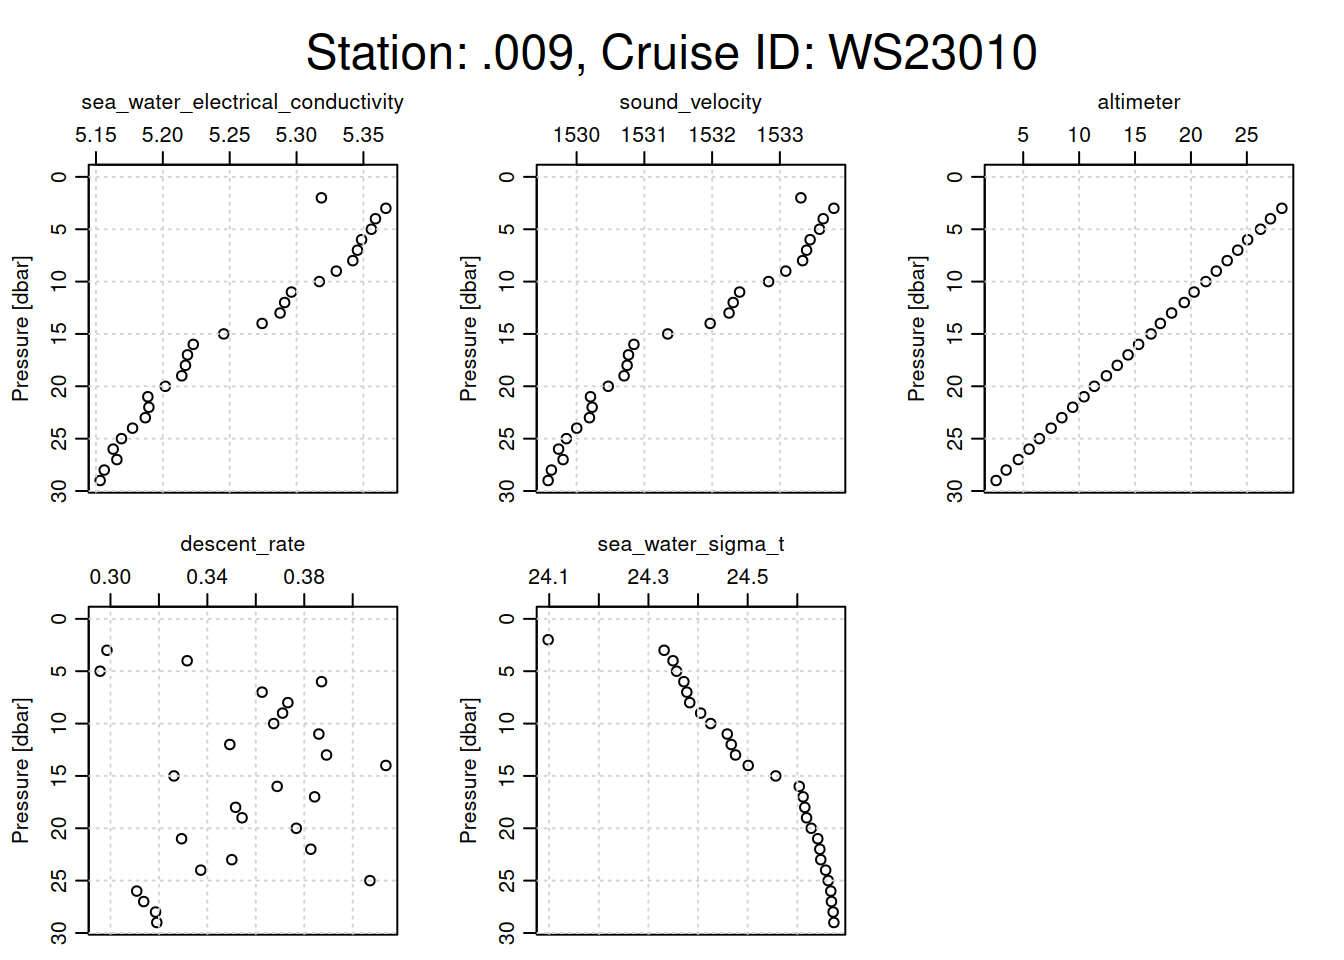
# Loop through each CTD castfor (i inseq(ctd_FK)){ cast <- ctd_FK[[i]] # Assuming each sublist contains only one relevant CTD objecttryCatch({# Extract metadata for station name and cruise ID station_name <- cast@metadata$station[1] cruise_id <- cast@data$cruise_id[1]# Generate a title with station name and cruise ID overall_title <- glue::glue("Station: {station_name}, Cruise ID: {cruise_id}")# Set margins: increase the outer margin for the titlepar(oma =c(0, 0, 3, 0)) # Top outer margin increased for title# Plotting function with specific parameters oce::plot(x =ctdDecimate(ctdTrim(cast)),which =c("sea_water_electrical_conductivity","descent_rate", "sound_velocity","sea_water_sigma_t","altimeter" ),main =""# No main title for individual subplots )# Place a single overall title at the top of the plot framemtext(overall_title, side =3, line =1, outer =TRUE, cex =1.5)# Reset outer margins to defaultpar(oma =c(0, 0, 0, 0)) }, error =function(e) {print(e$message) # Print any errors that occur during plotting })}
[1] "need finite 'xlim' values"
[1] "need finite 'xlim' values"
[1] "need finite 'xlim' values"
[1] "need finite 'xlim' values"
[1] "need finite 'xlim' values"
[1] "need finite 'xlim' values"
[1] "need finite 'xlim' values"
[1] "need finite 'xlim' values"
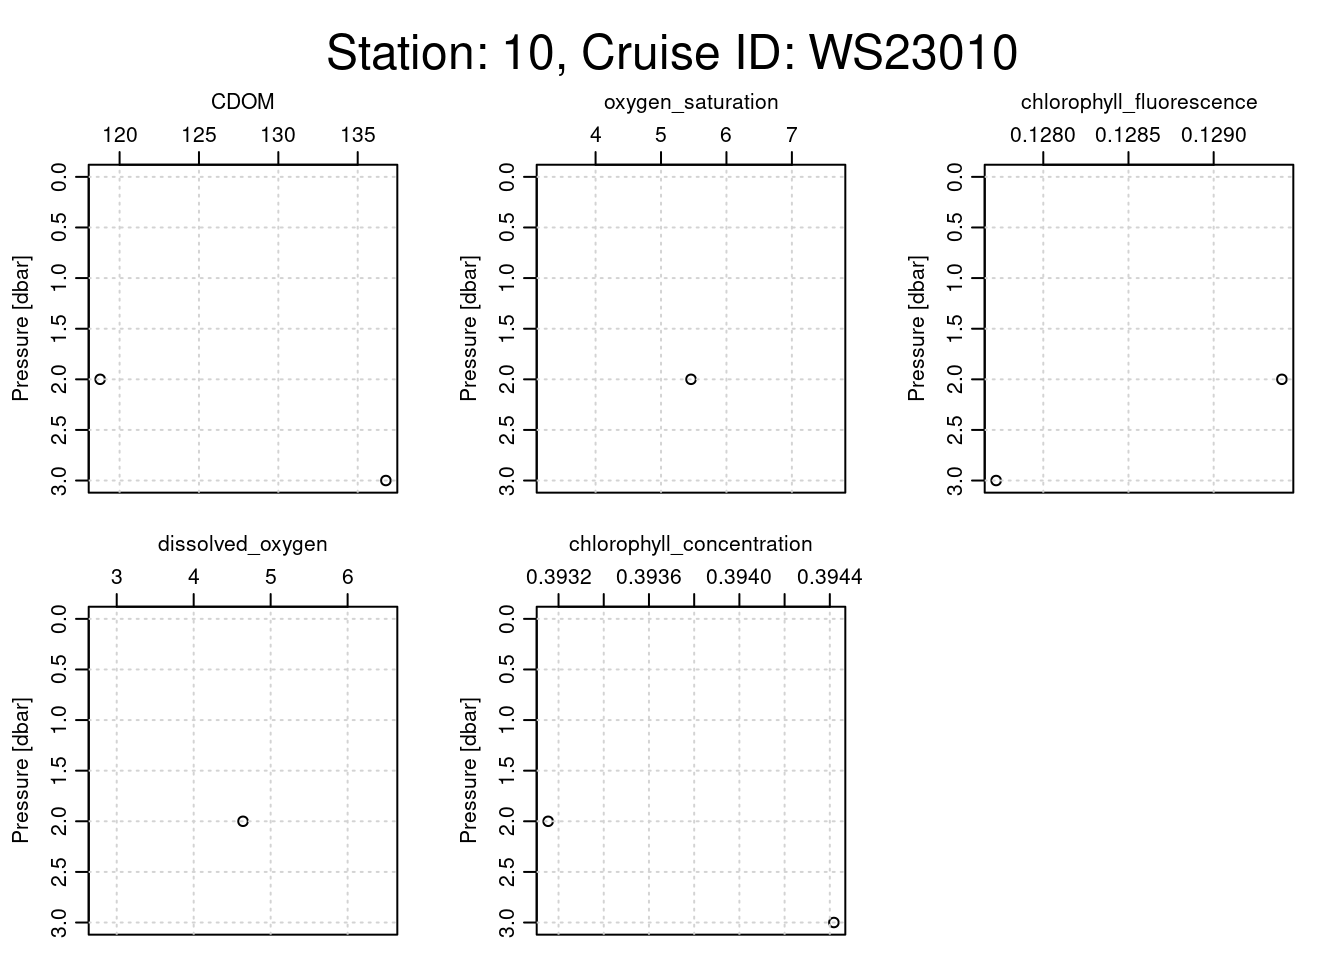
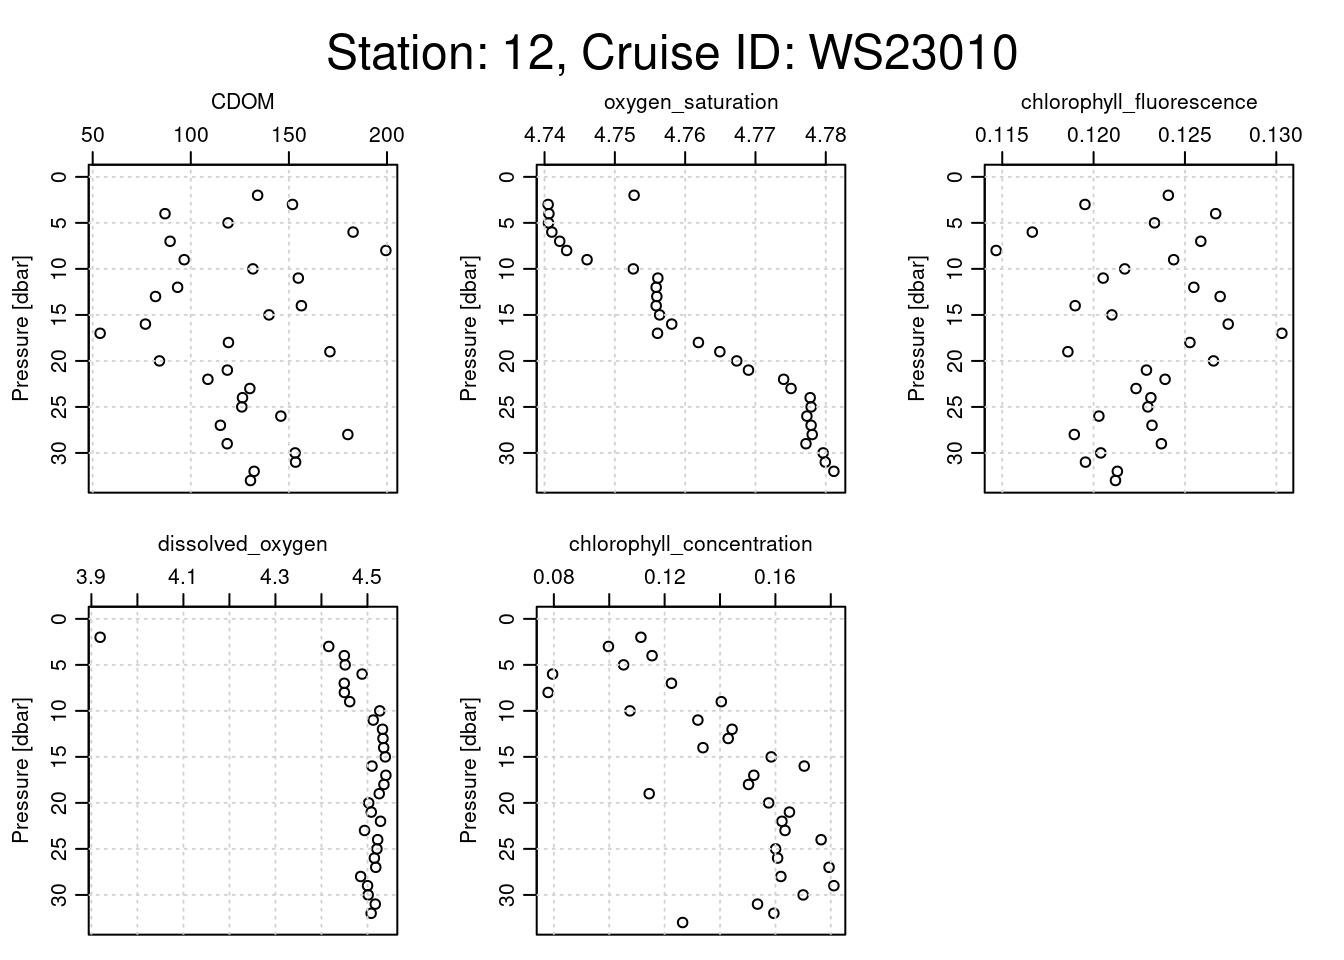
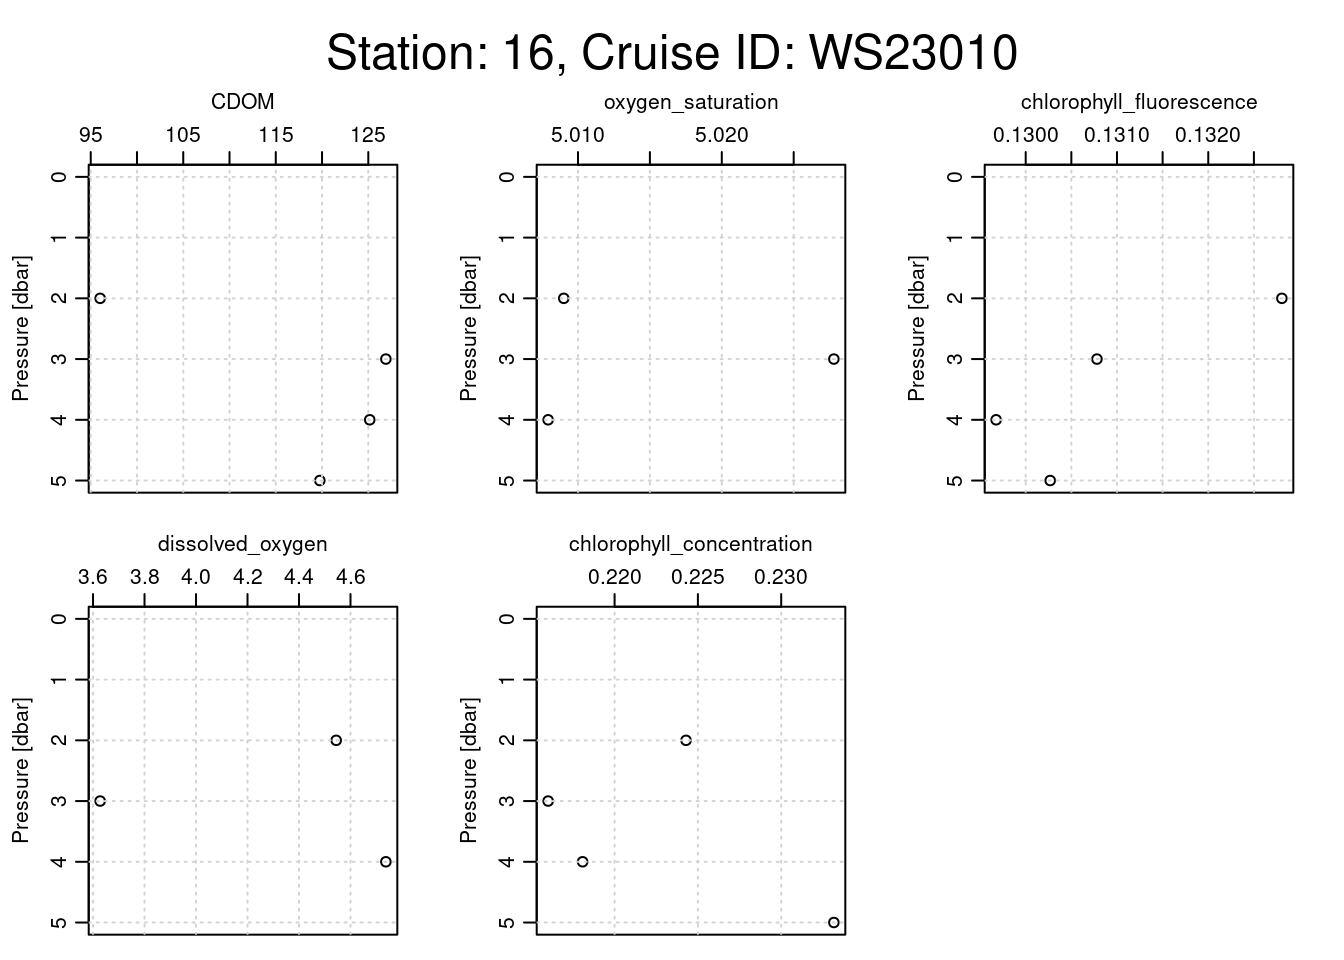
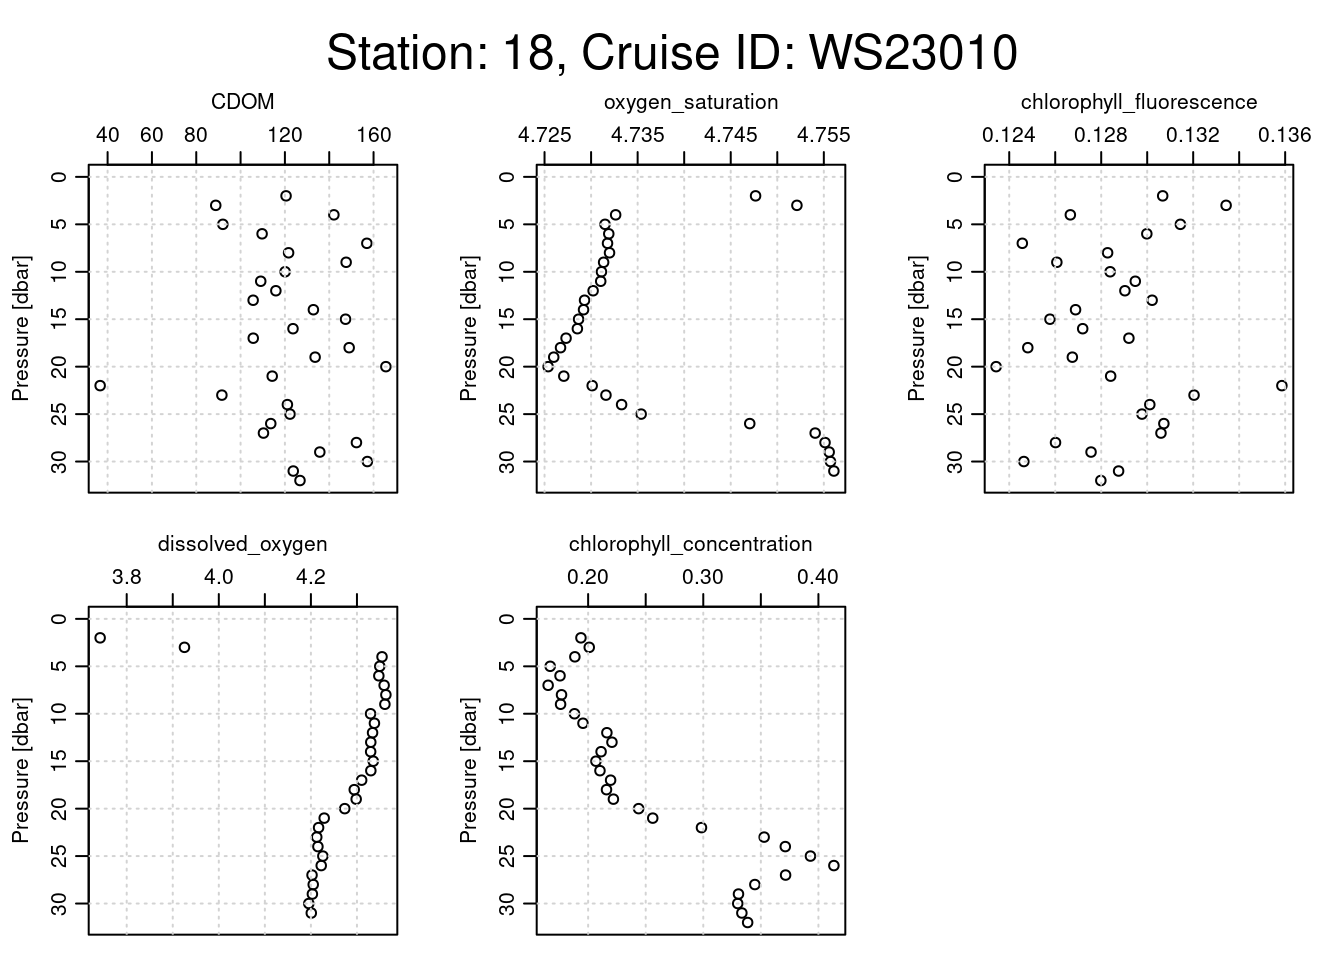
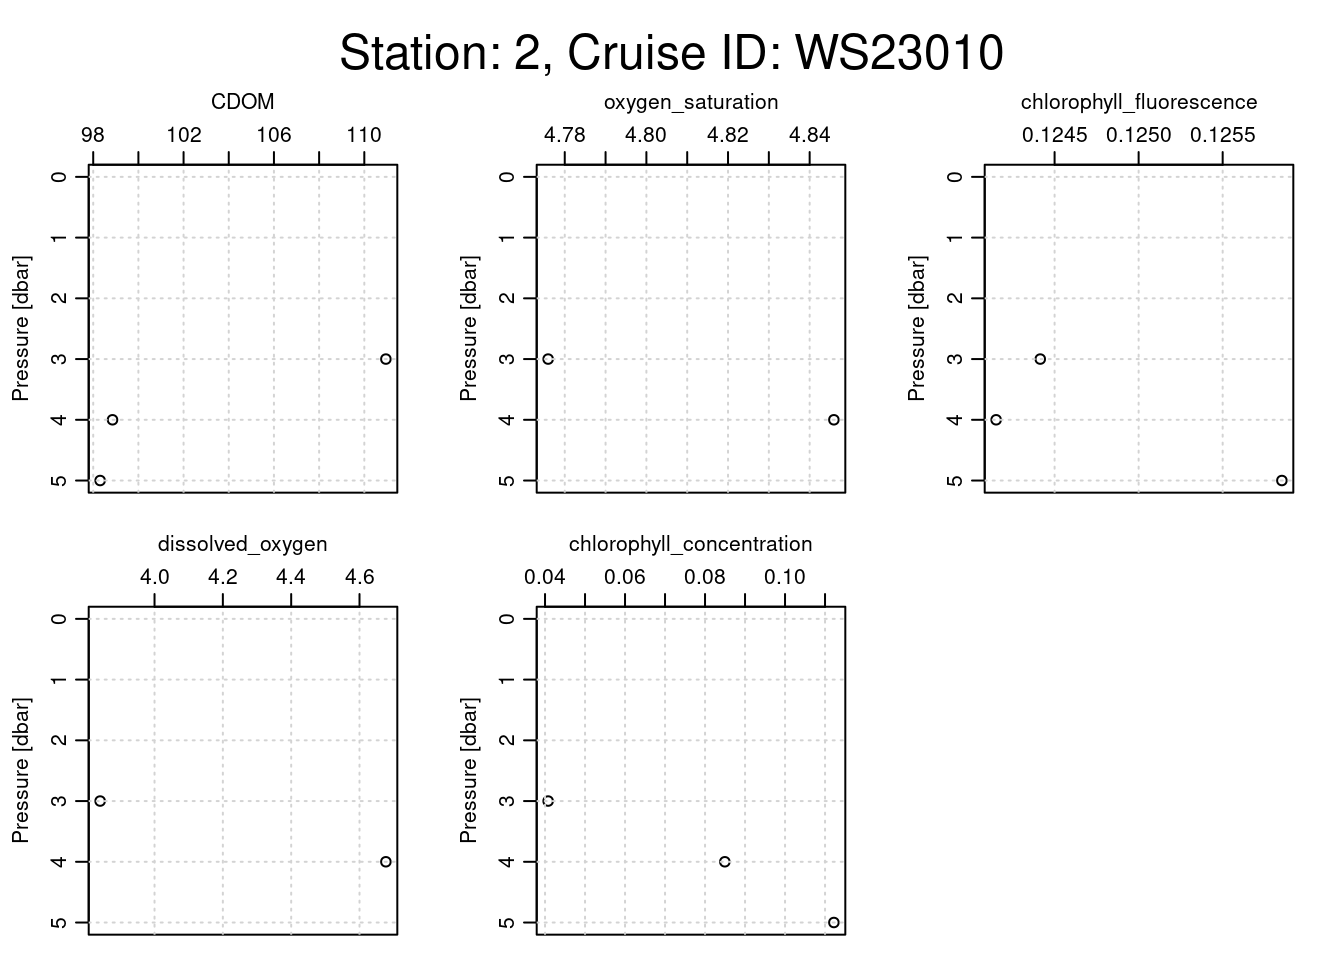
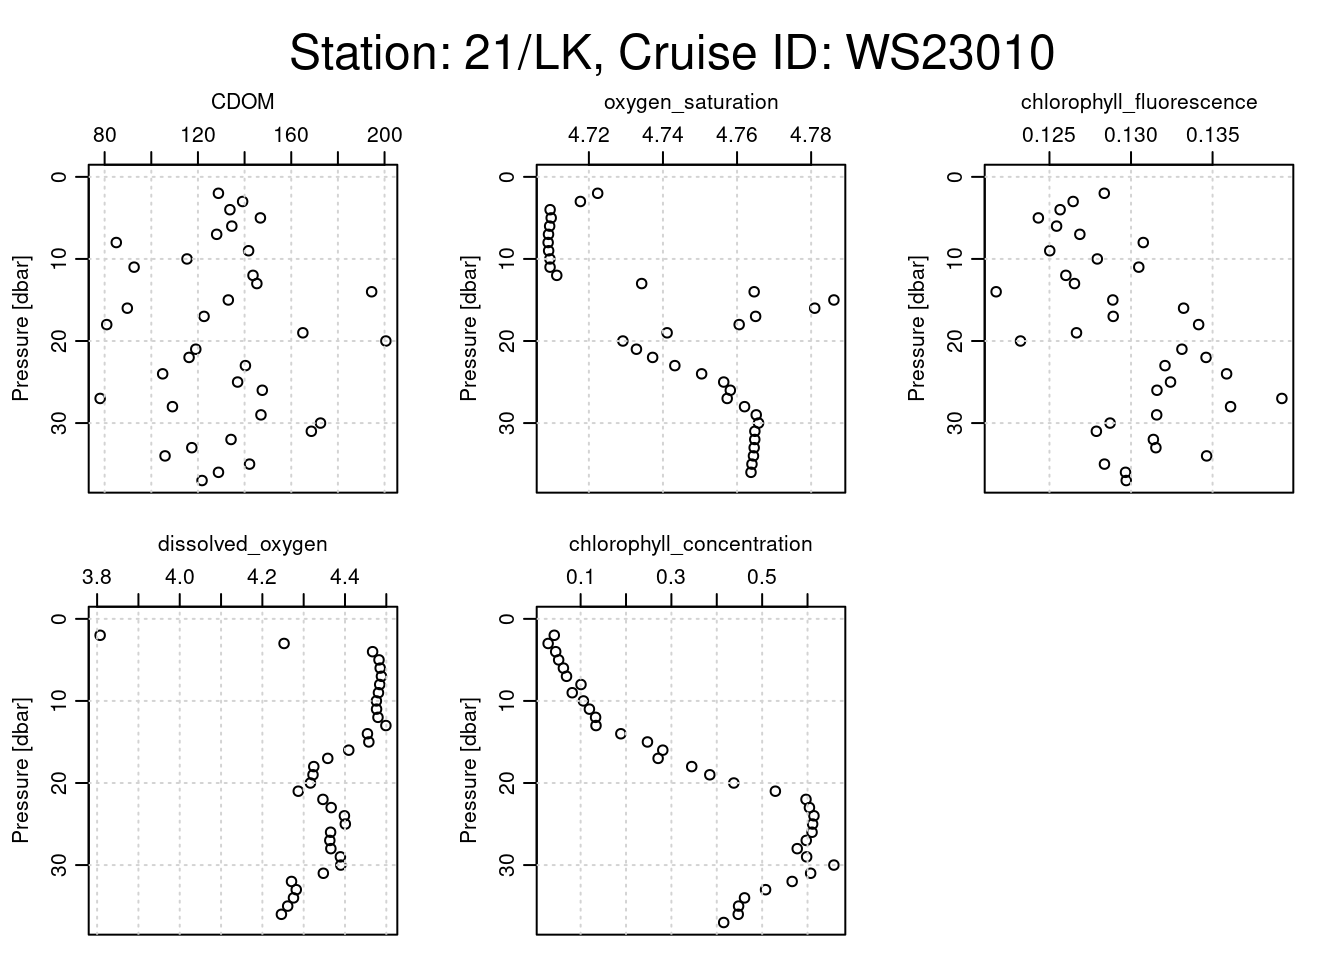
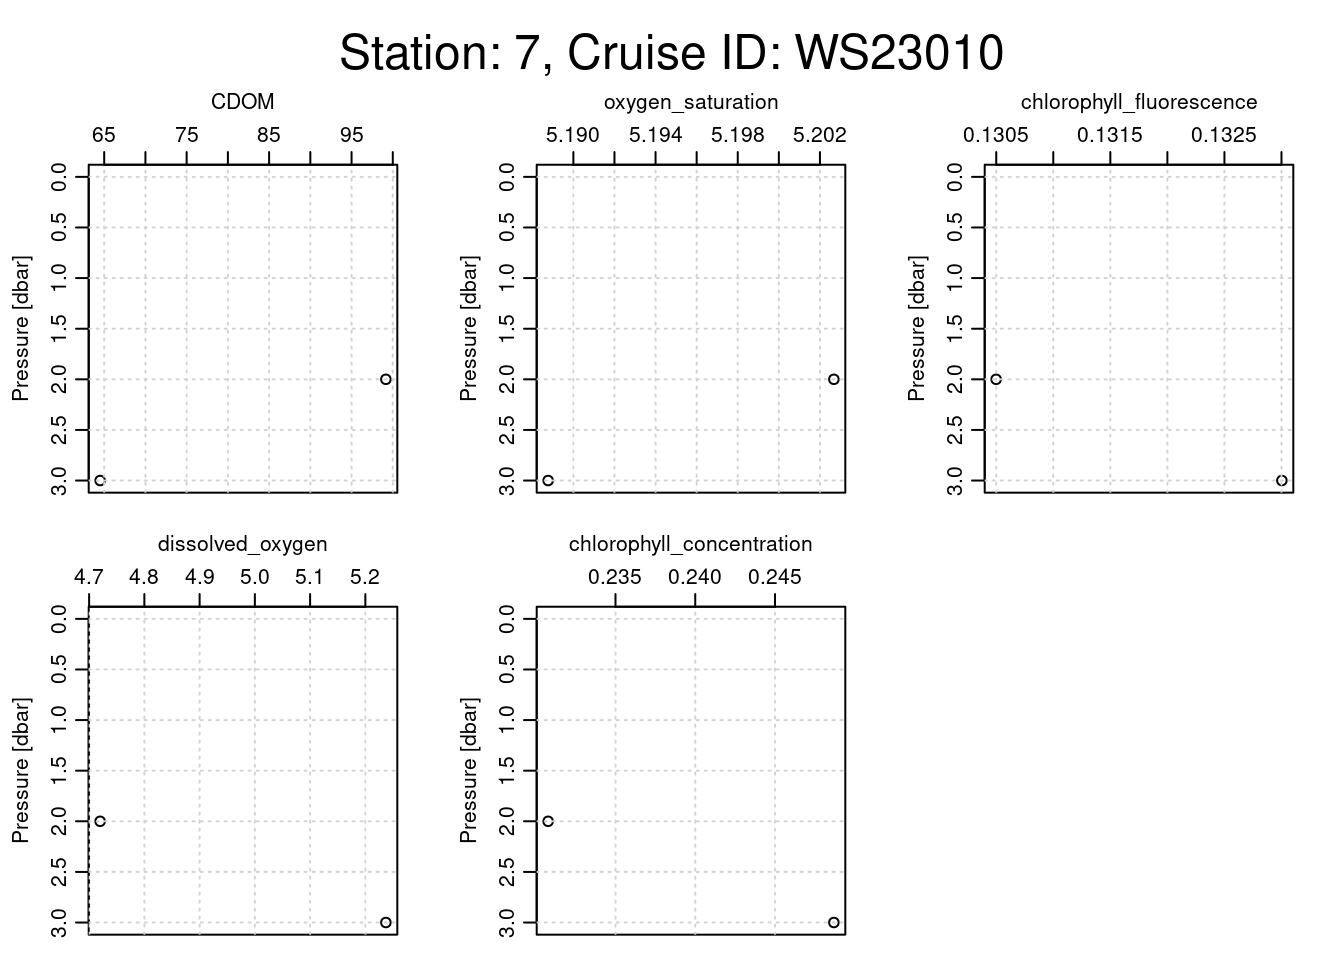
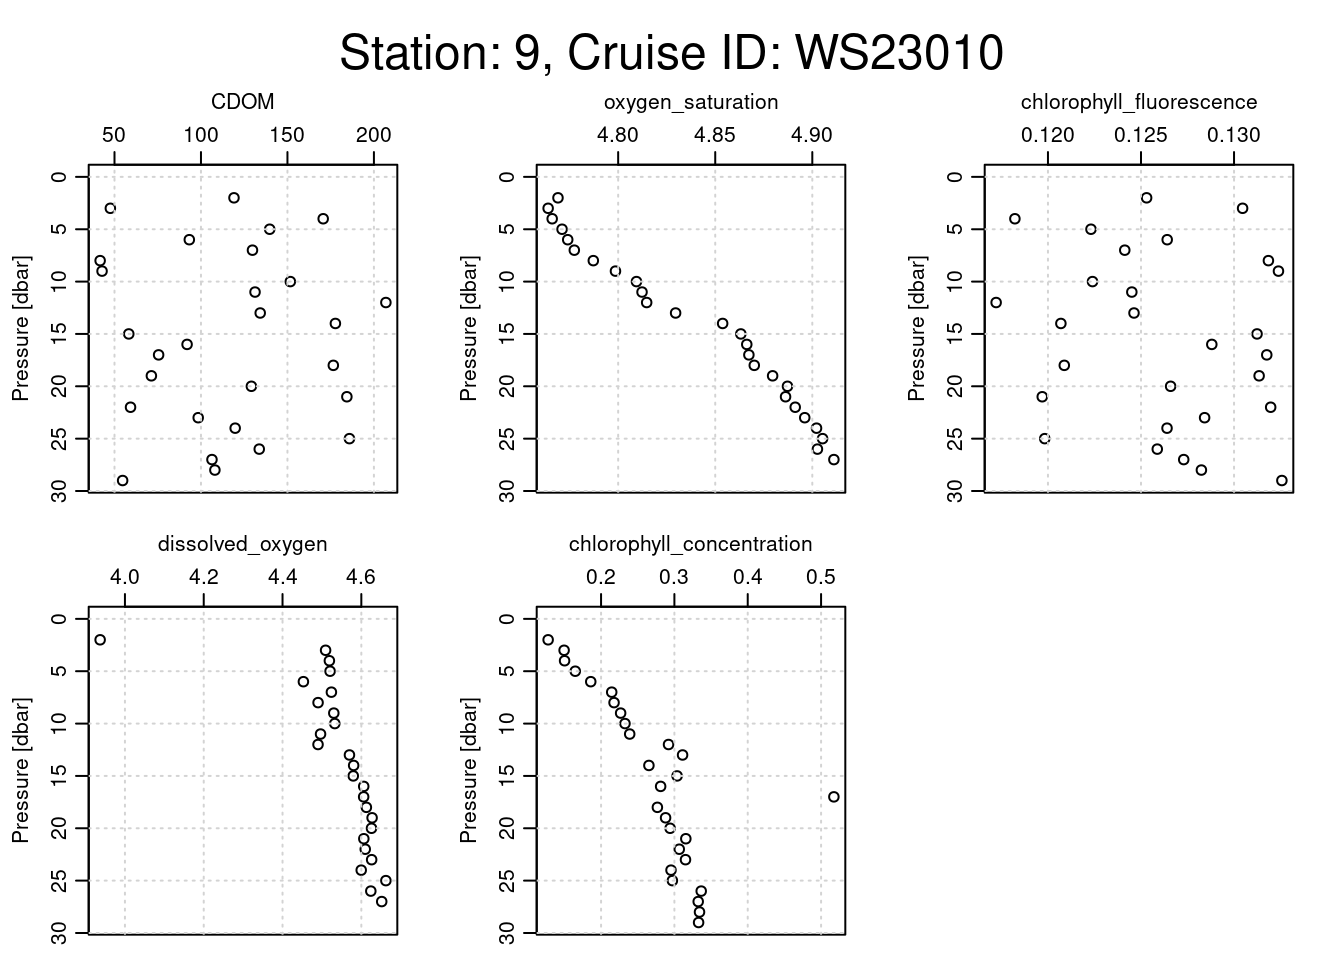
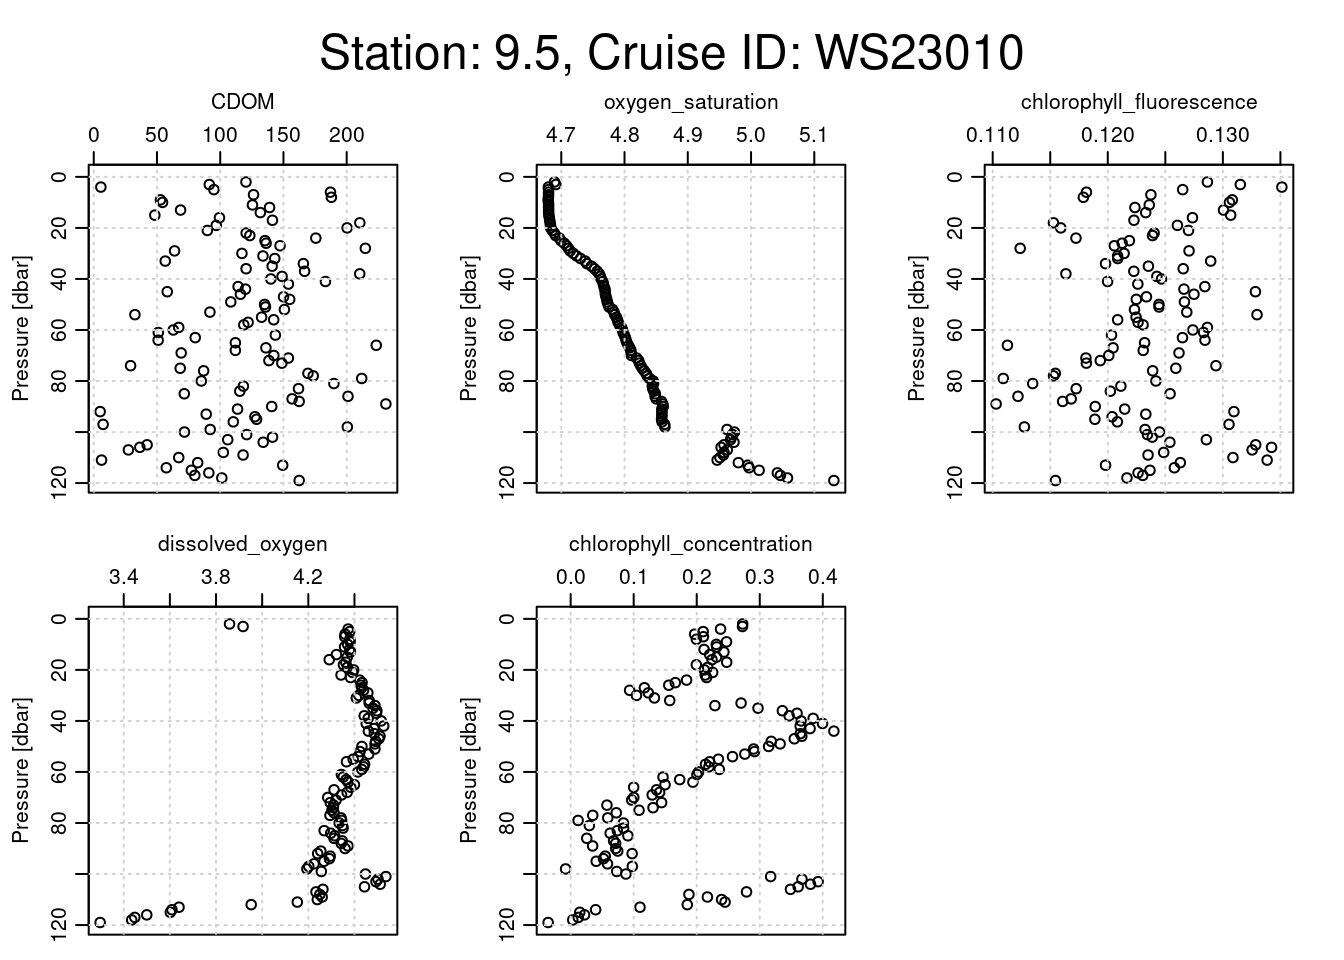
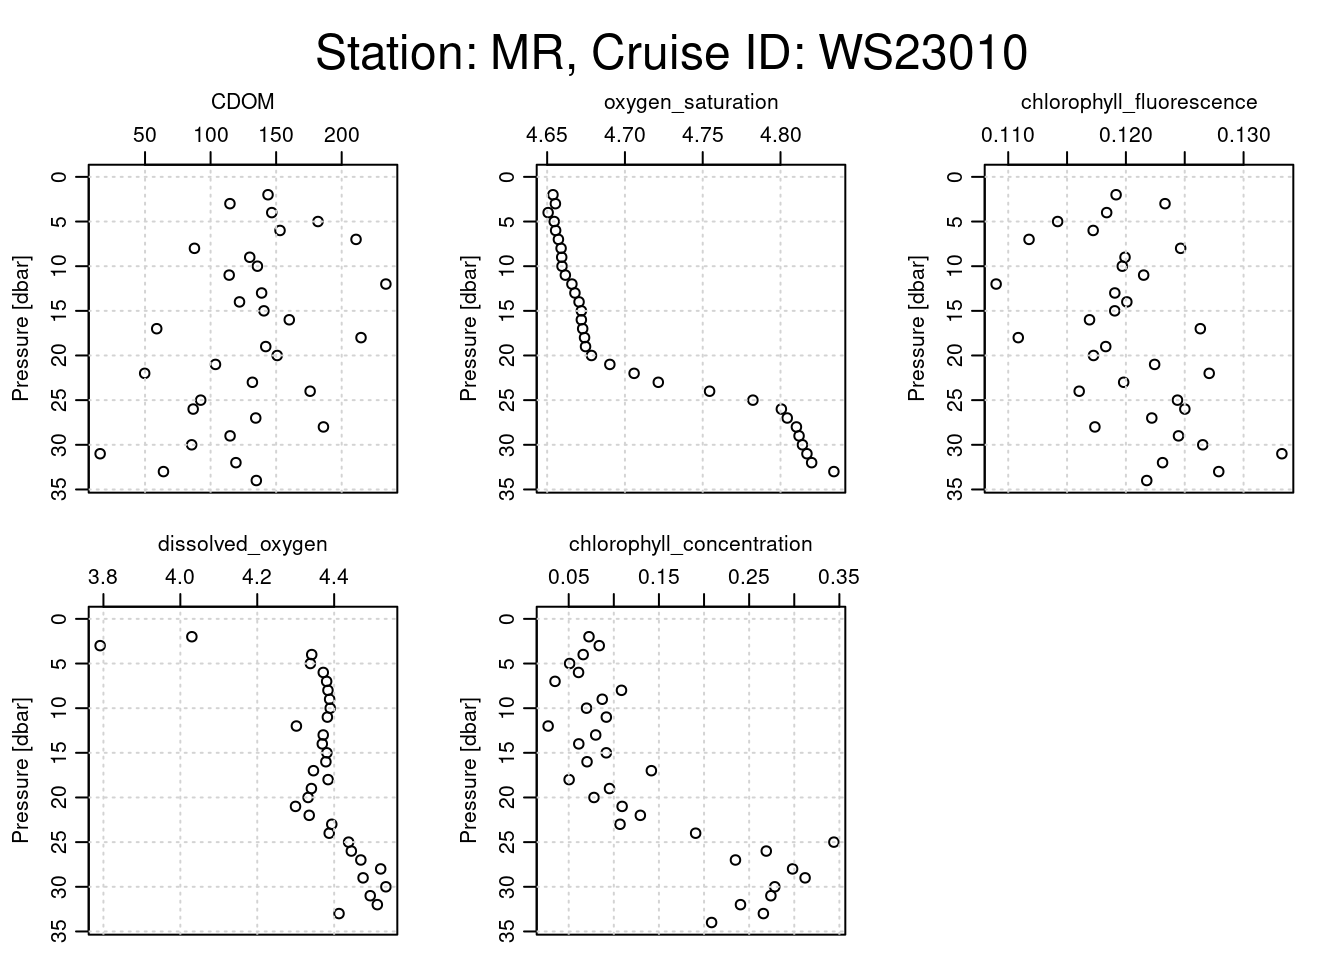
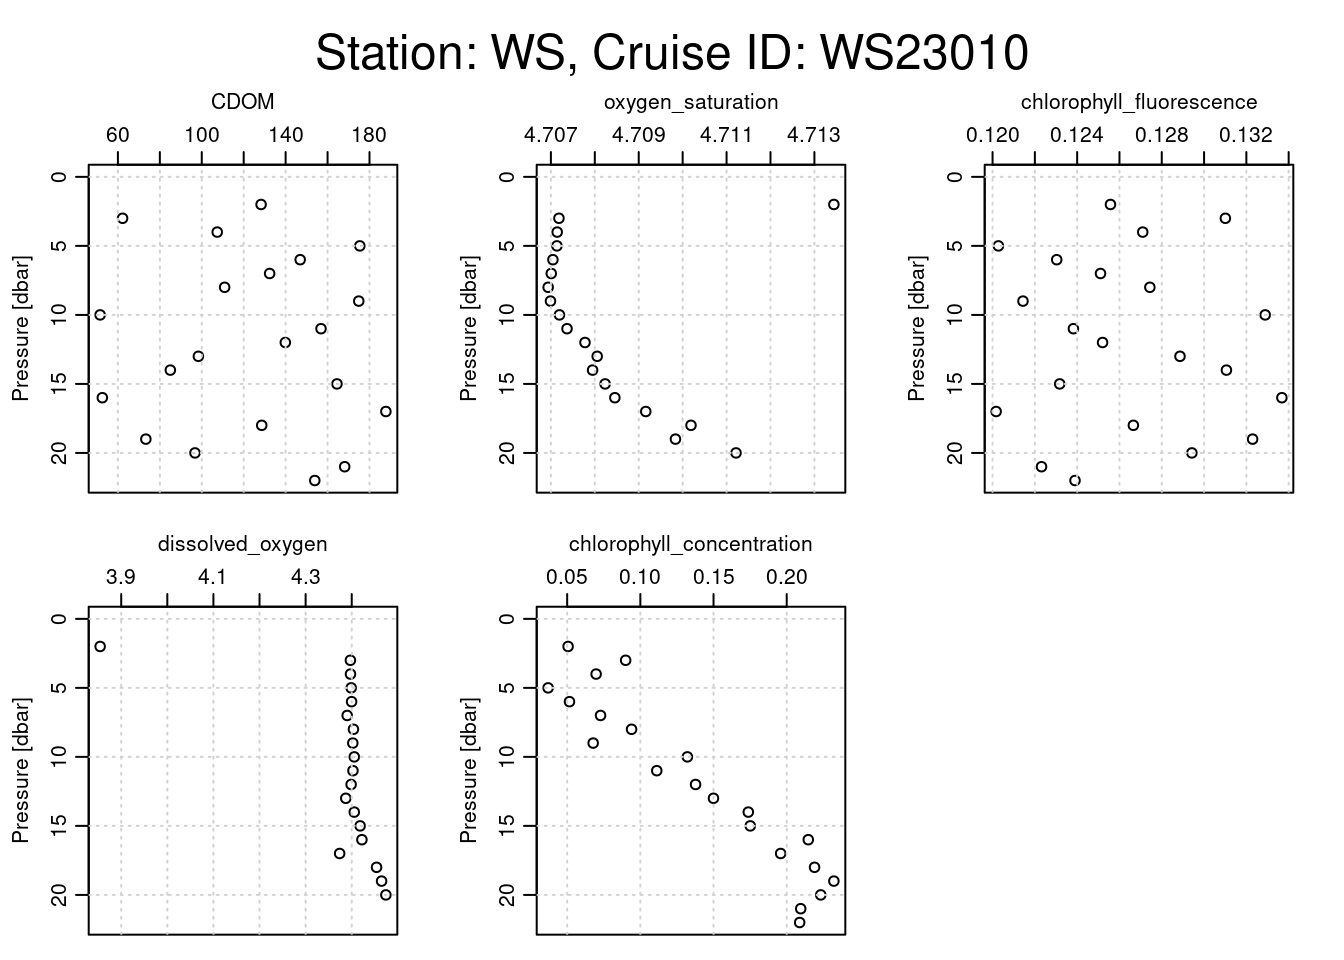
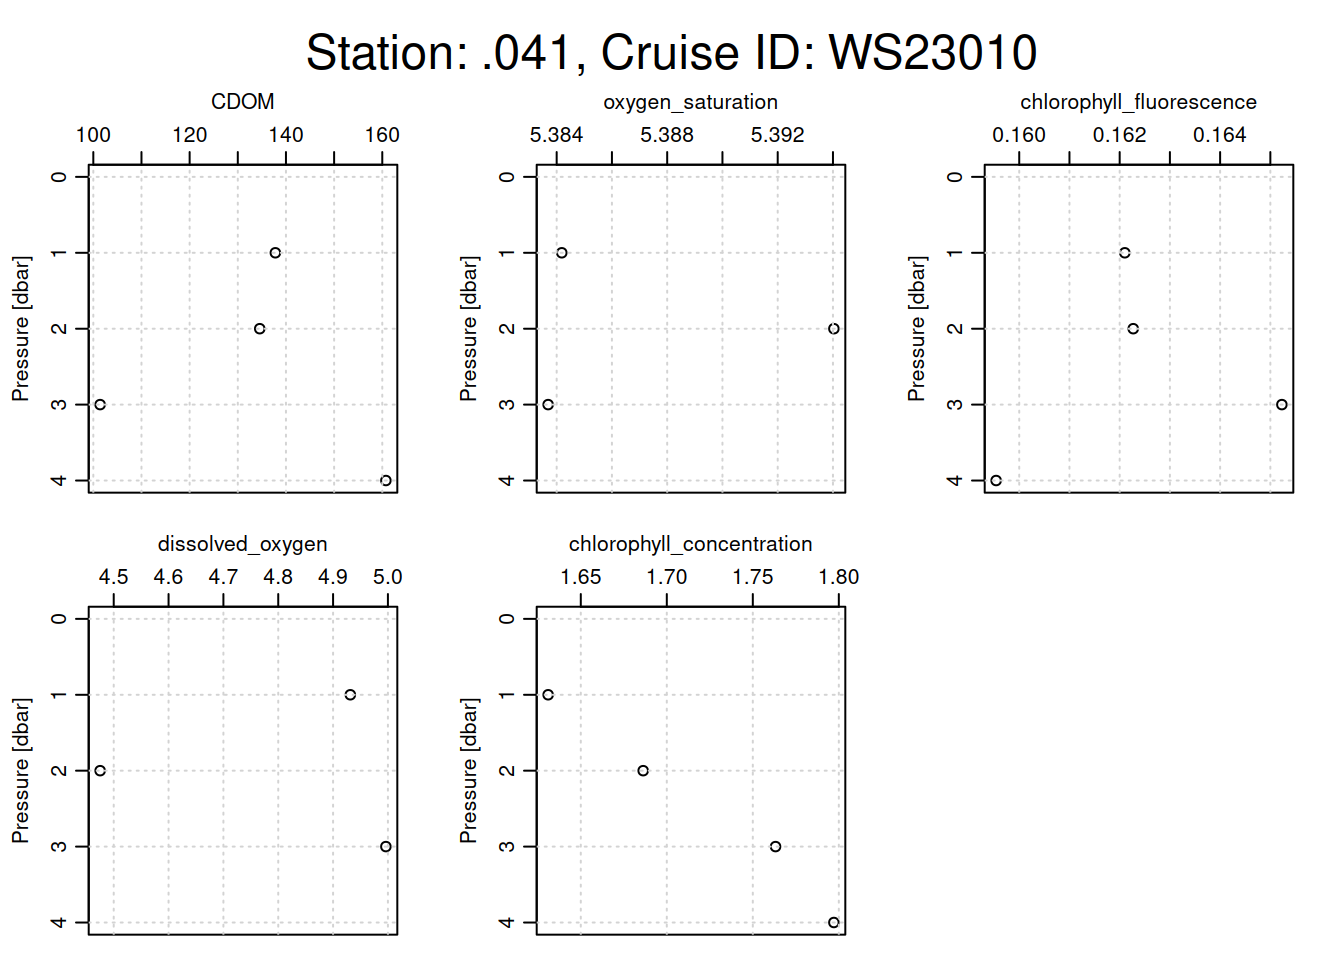
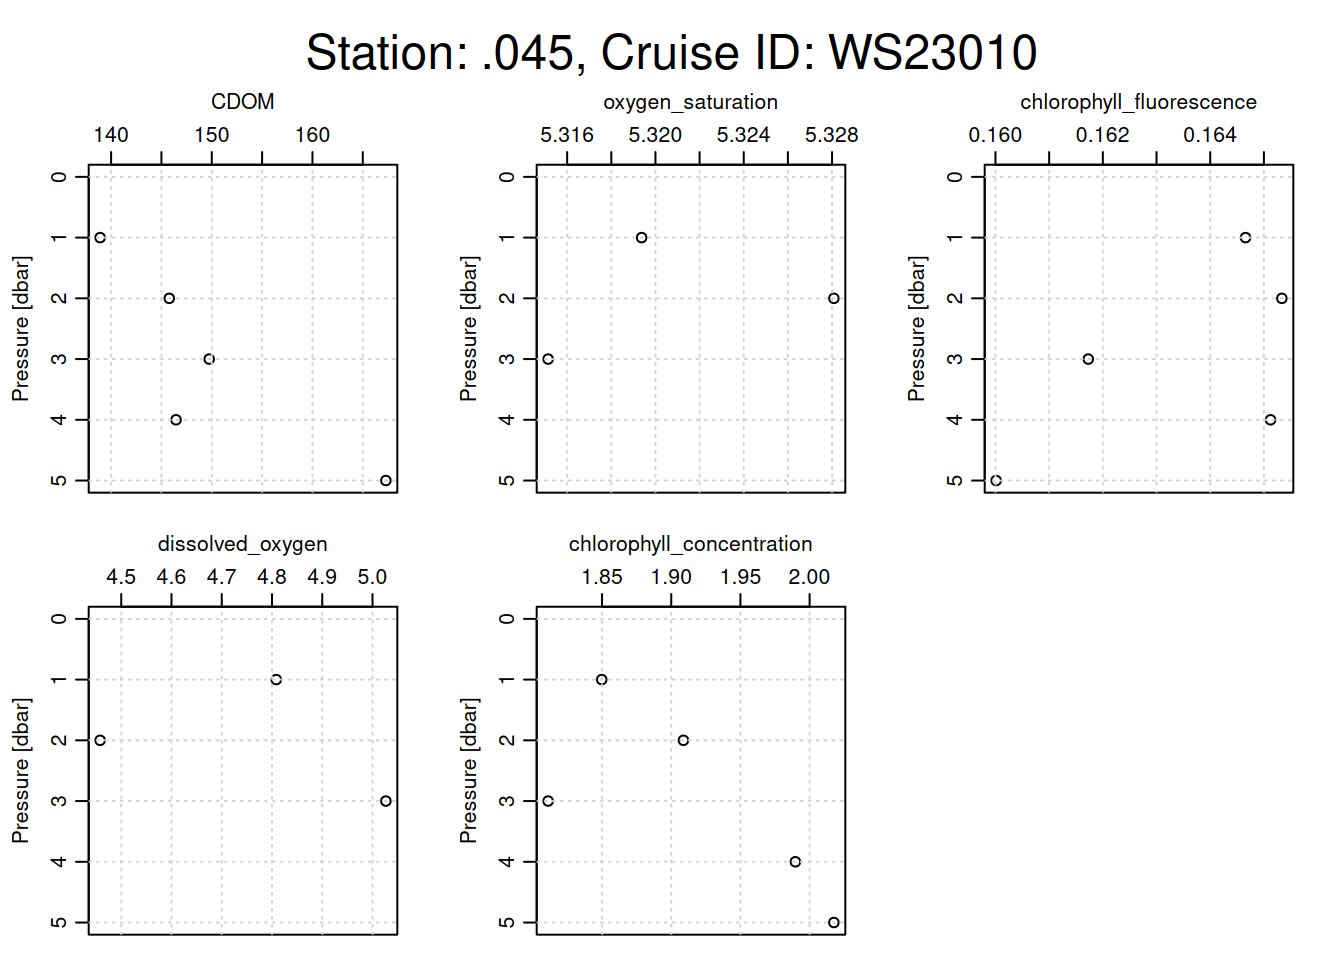
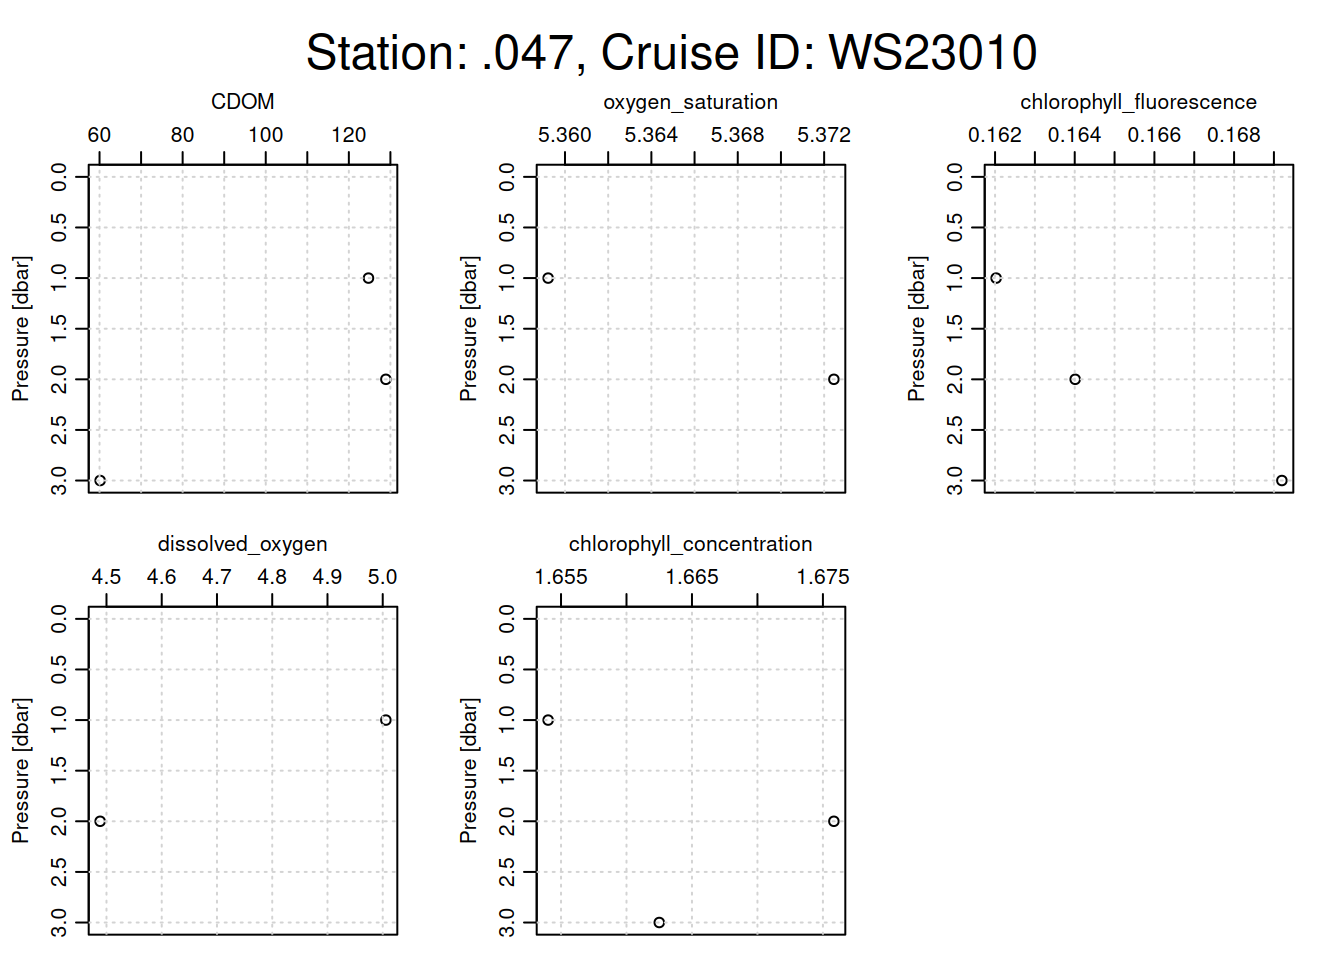
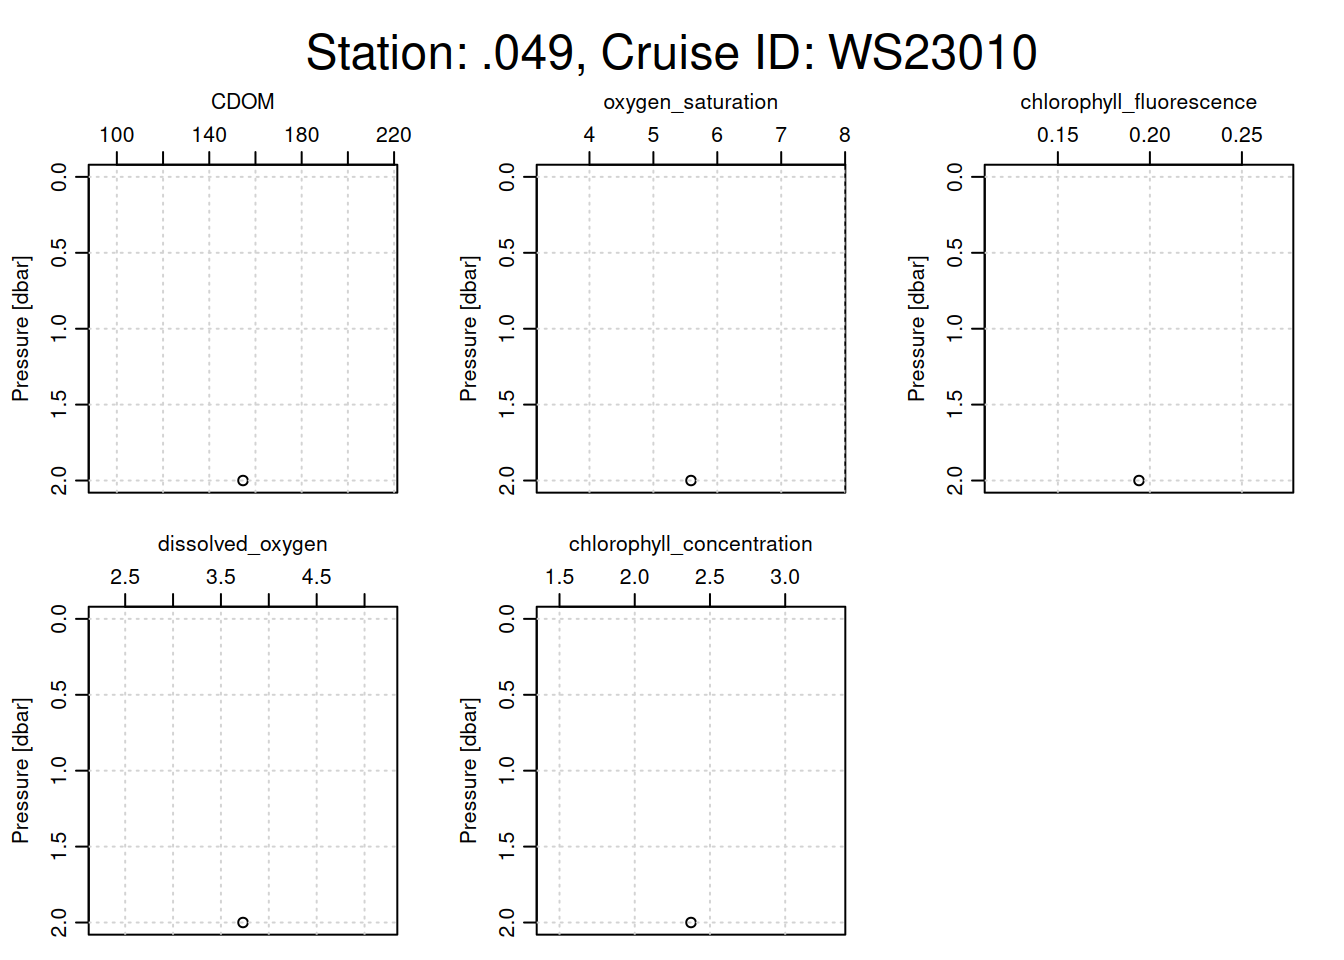
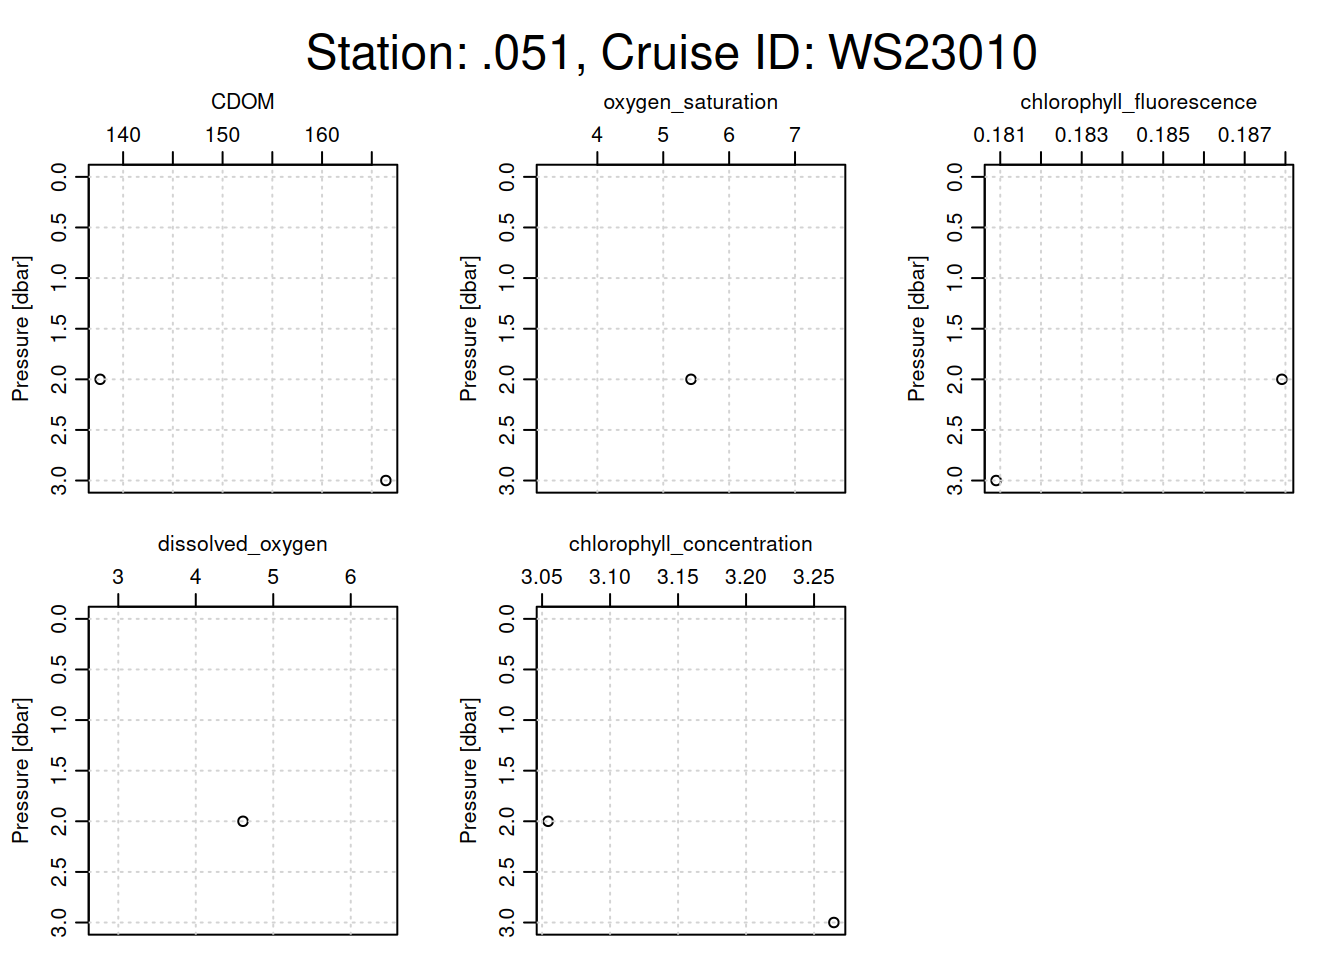
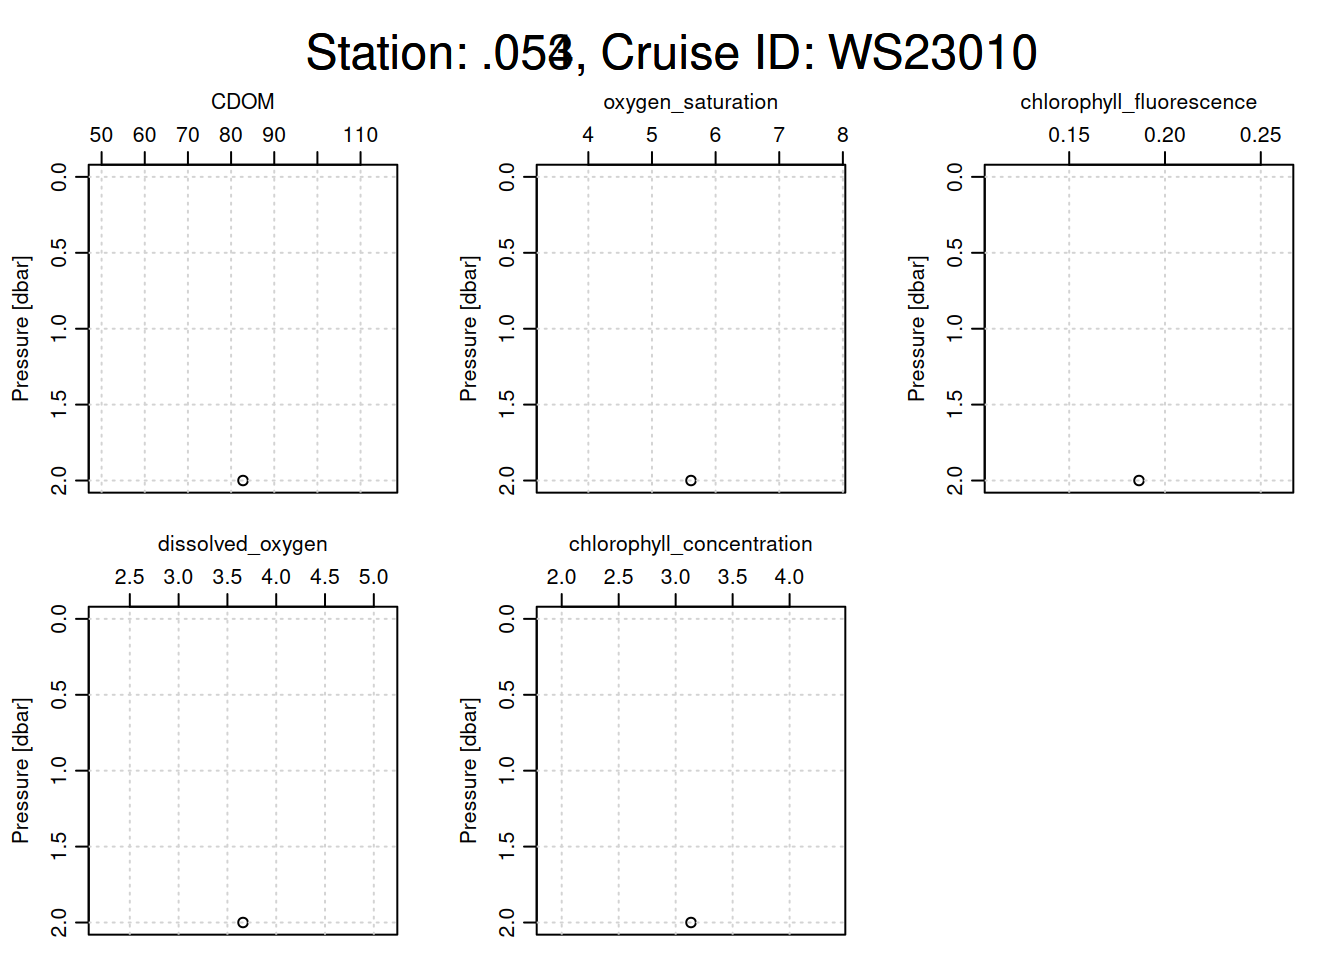
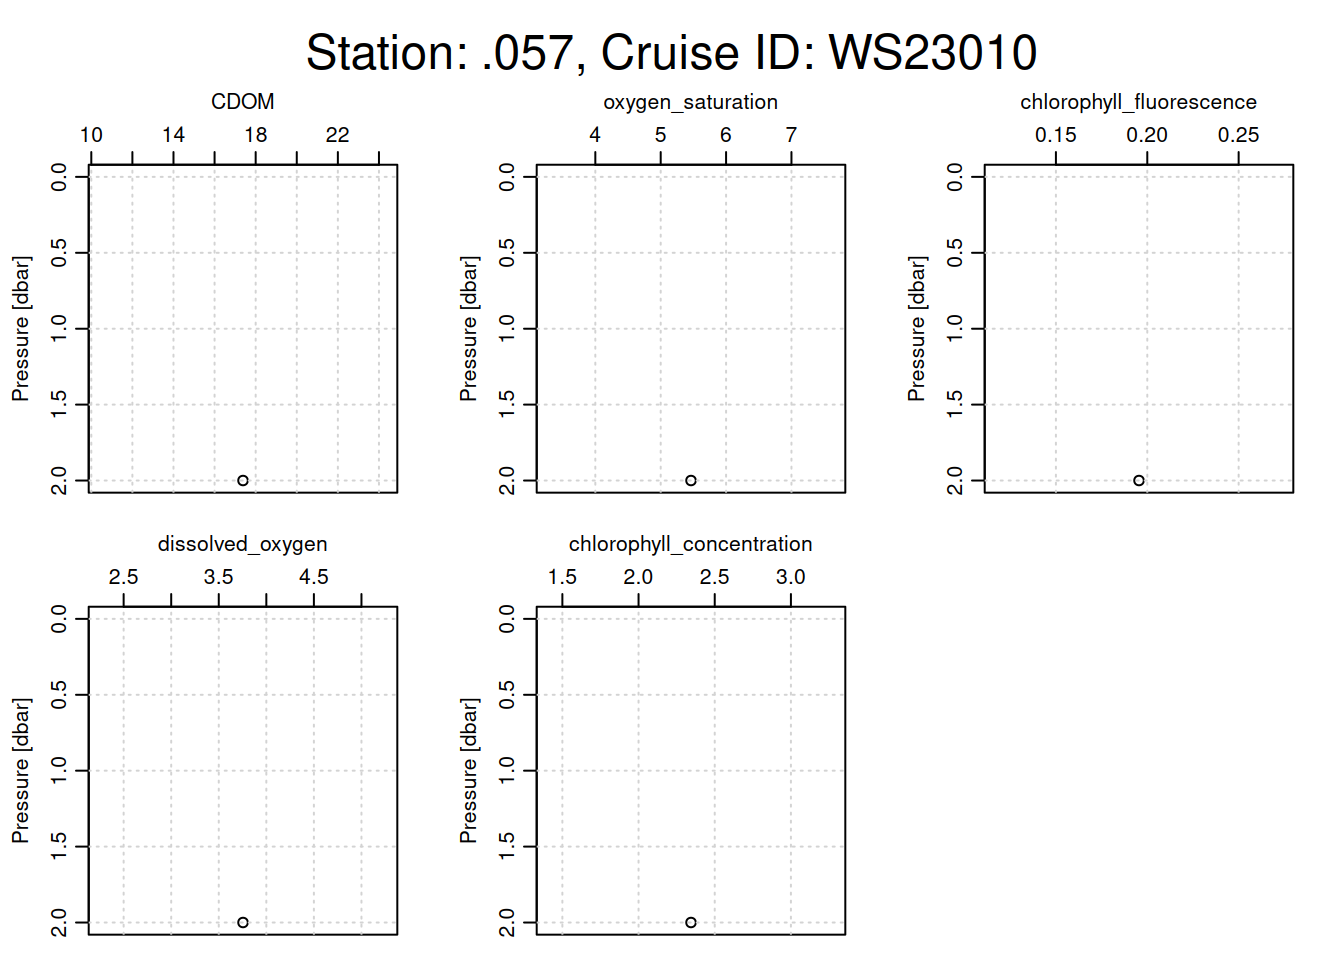
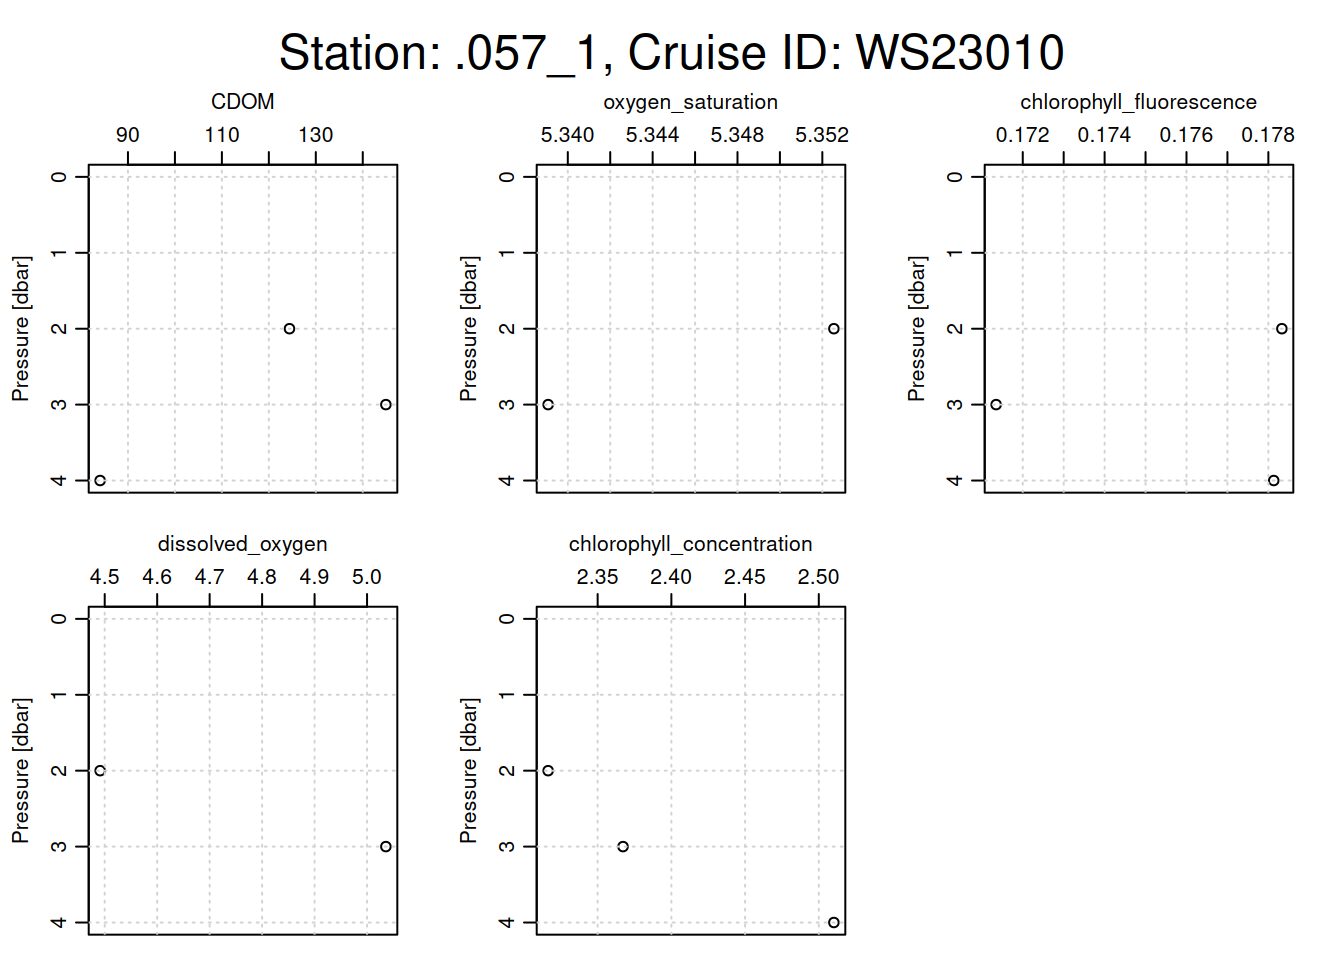
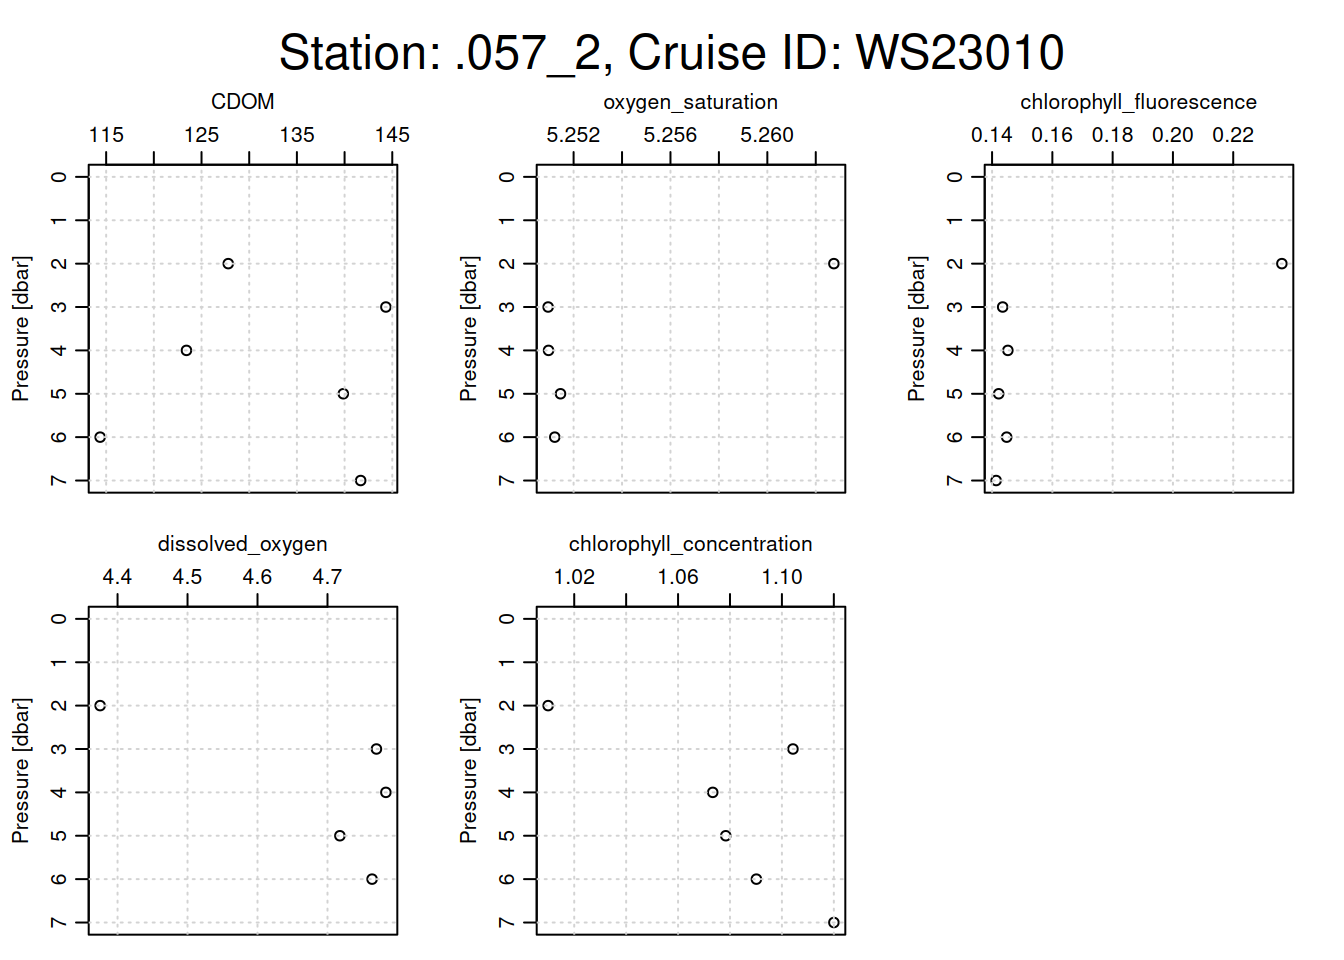
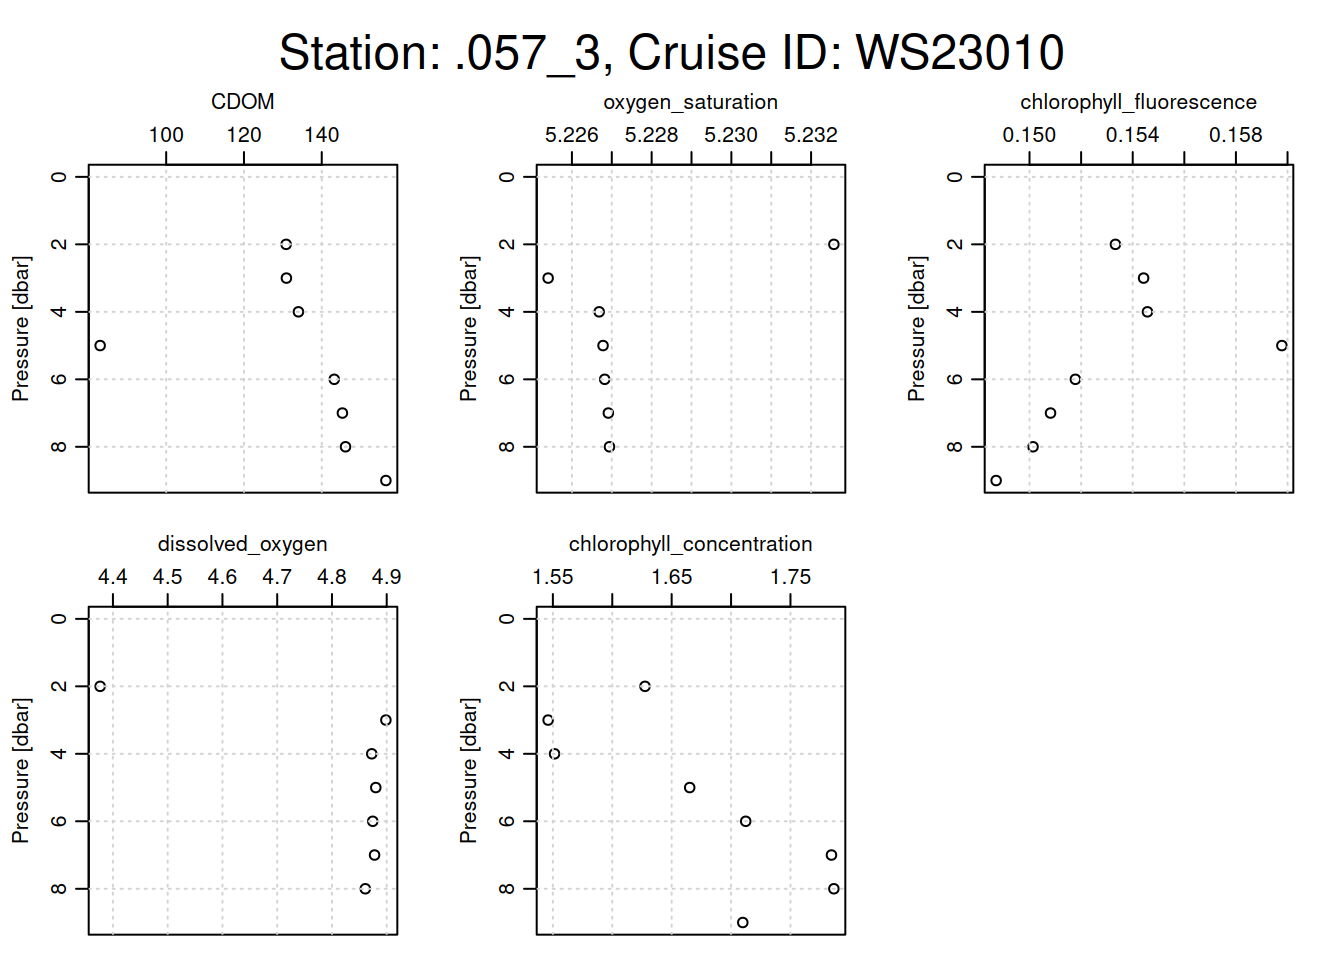
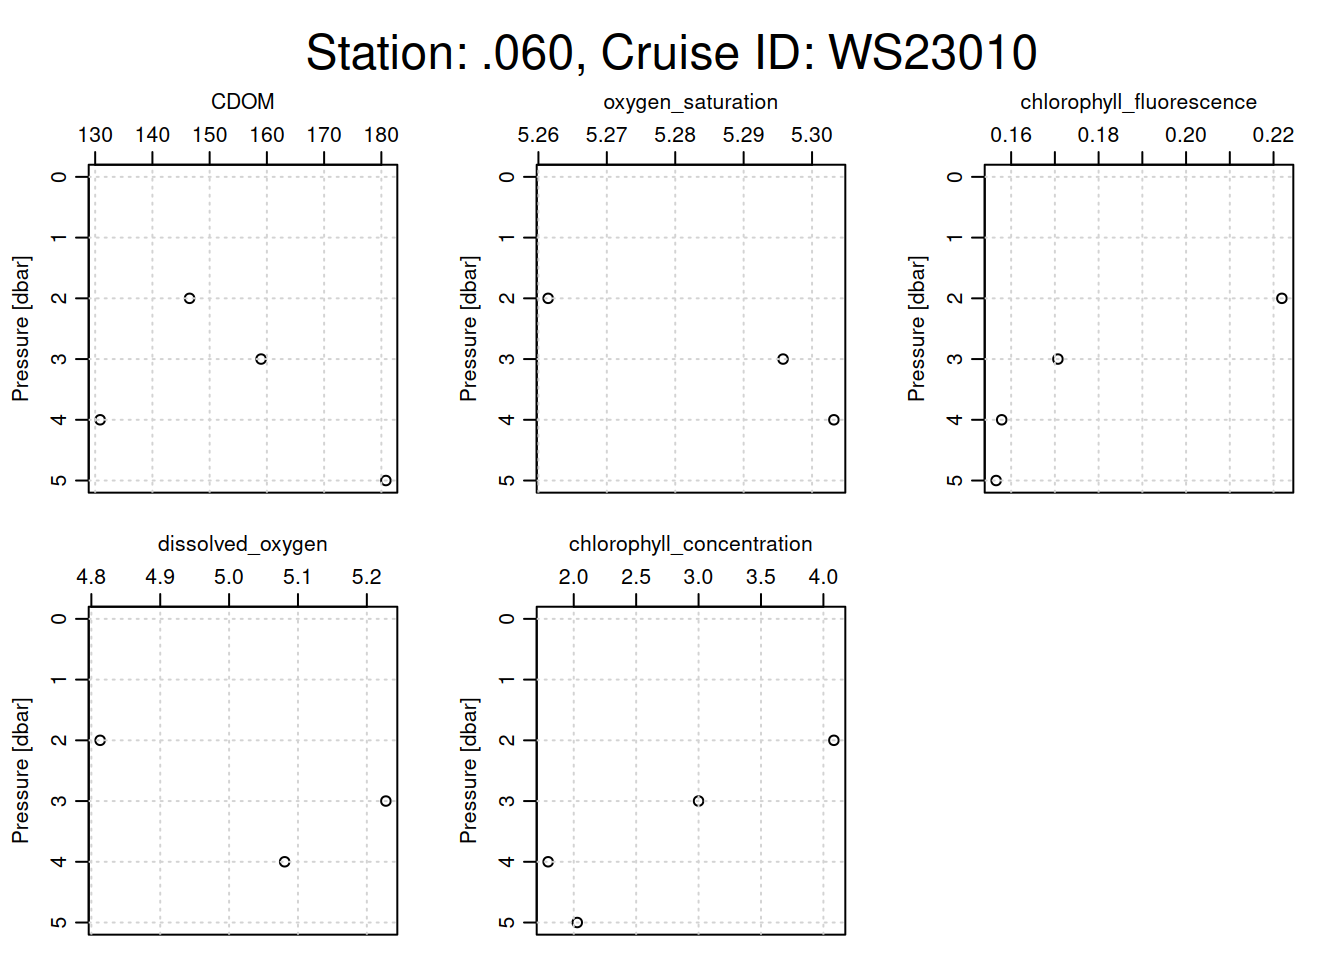
plotting other nutrient parameters for each cast
# Loop through each CTD castfor (i inseq(ctd_FK)){ cast <- ctd_FK[[i]] # Assuming each sublist contains only one relevant CTD objecttryCatch({# Extract metadata for station name and cruise ID station_name <- cast@metadata$station[1] cruise_id <- cast@data$cruise_id[1]# Generate a title with station name and cruise ID overall_title <- glue::glue("Station: {station_name}, Cruise ID: {cruise_id}")# Set margins: increase the outer margin for the titlepar(oma =c(0, 0, 3, 0)) # Top outer margin increased for title# Plotting function with specific parameters oce::plot(x =ctdDecimate(ctdTrim(cast)),which =c("CDOM", "dissolved_oxygen","oxygen_saturation","chlorophyll_concentration", "chlorophyll_fluorescence" ),main =""# No main title for individual subplots )# Place a single overall title at the top of the plot framemtext(overall_title, side =3, line =1, outer =TRUE, cex =1.5)# Reset outer margins to defaultpar(oma =c(0, 0, 0, 0)) }, error =function(e) {print(e$message) # Print any errors that occur during plotting })}
[1] "need finite 'xlim' values"
[1] "need finite 'xlim' values"
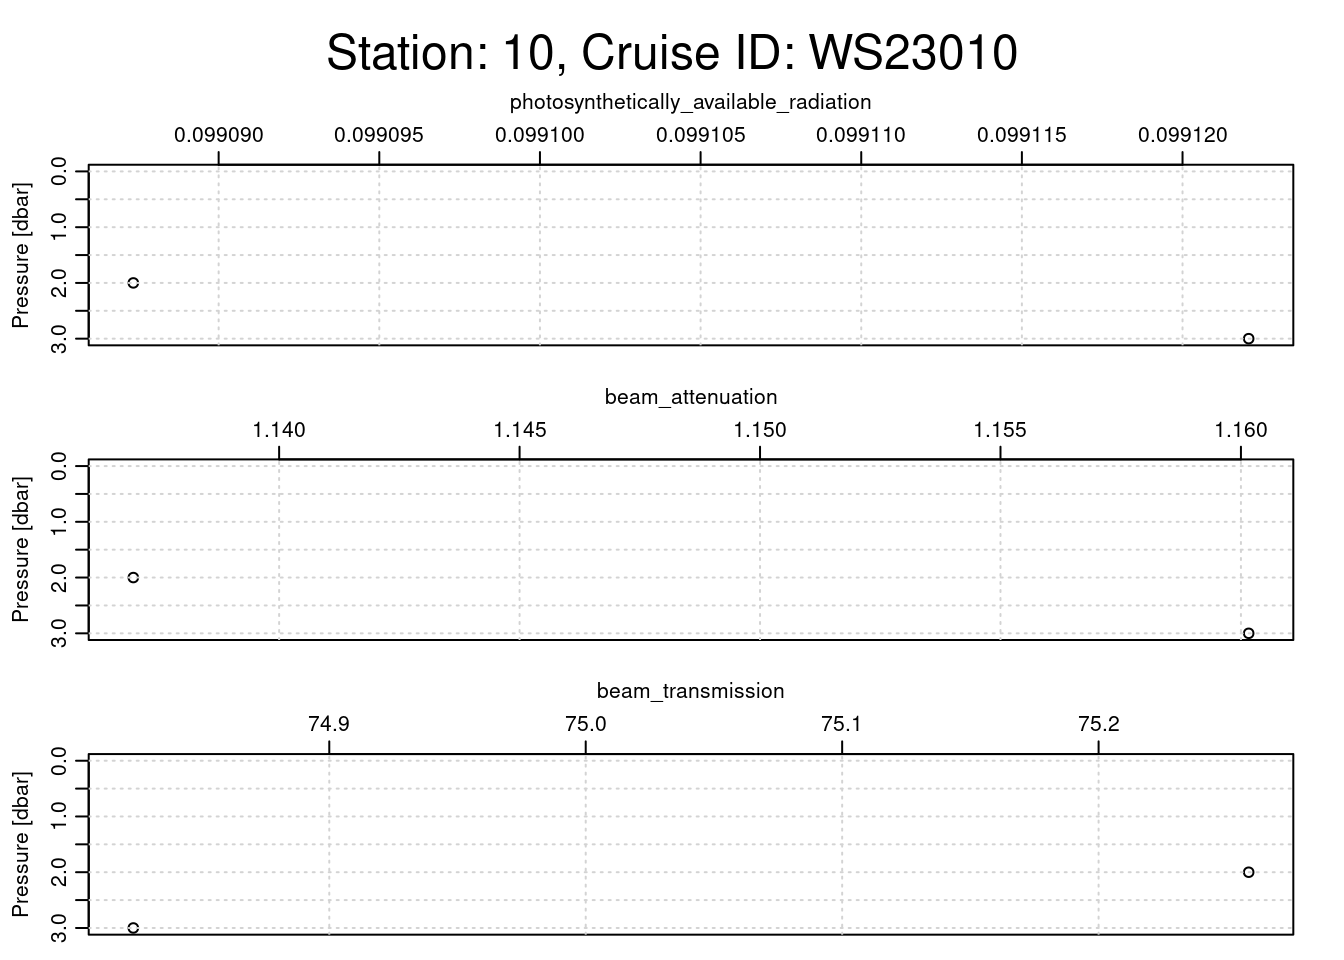
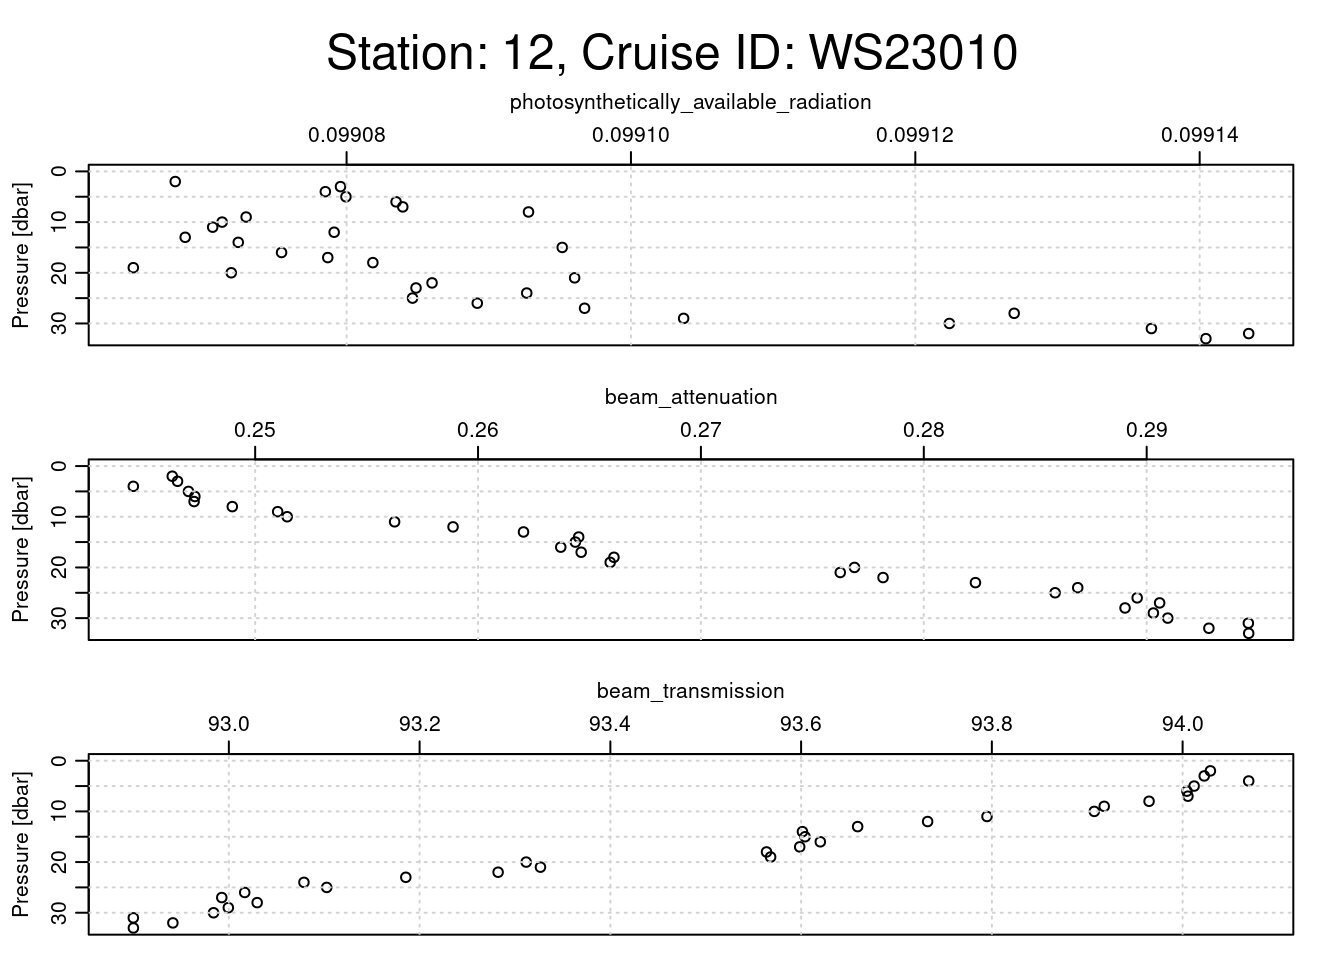
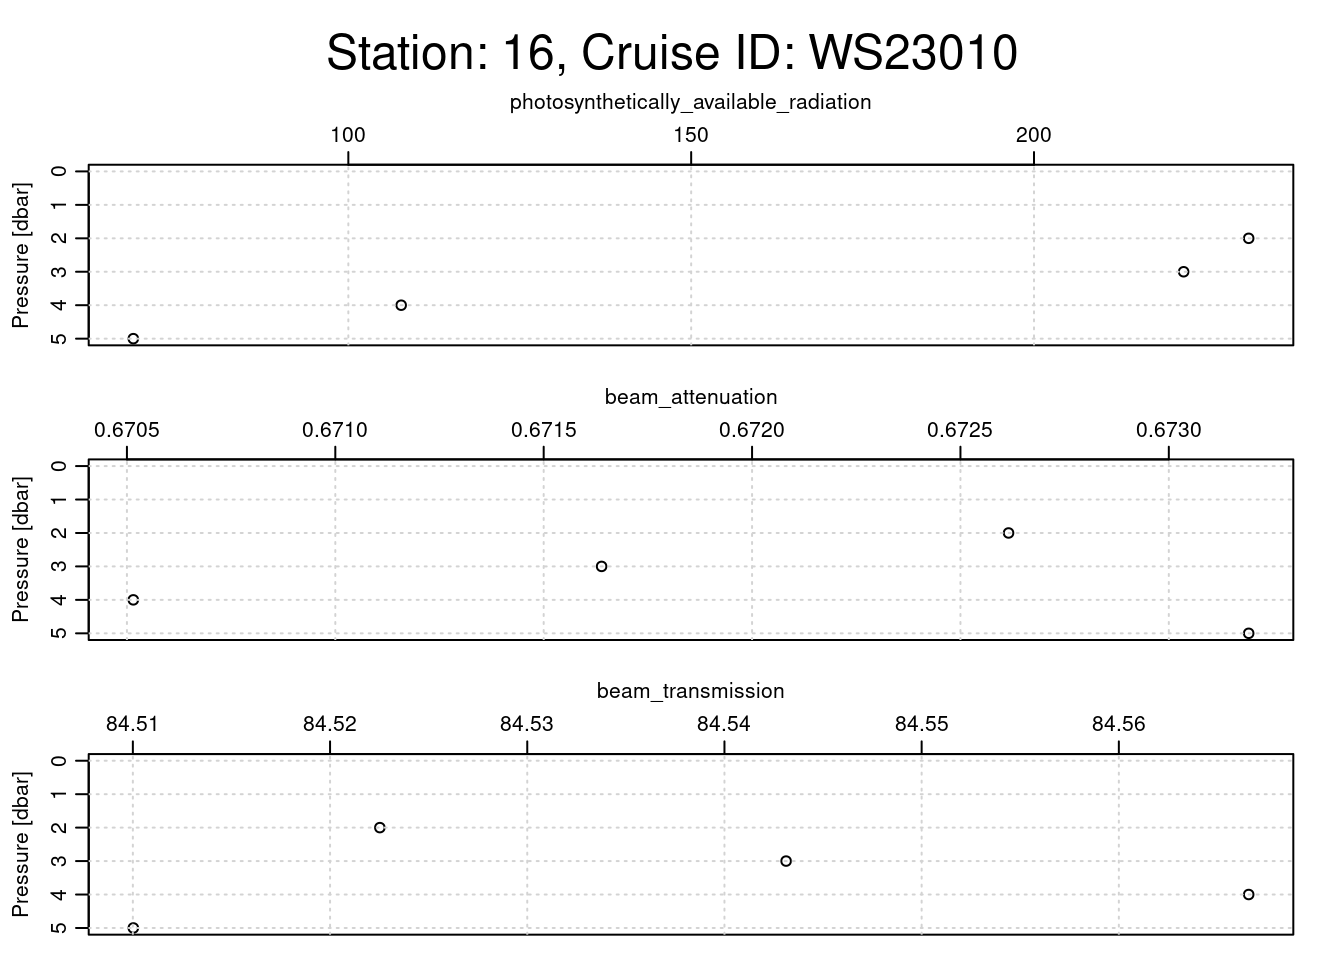
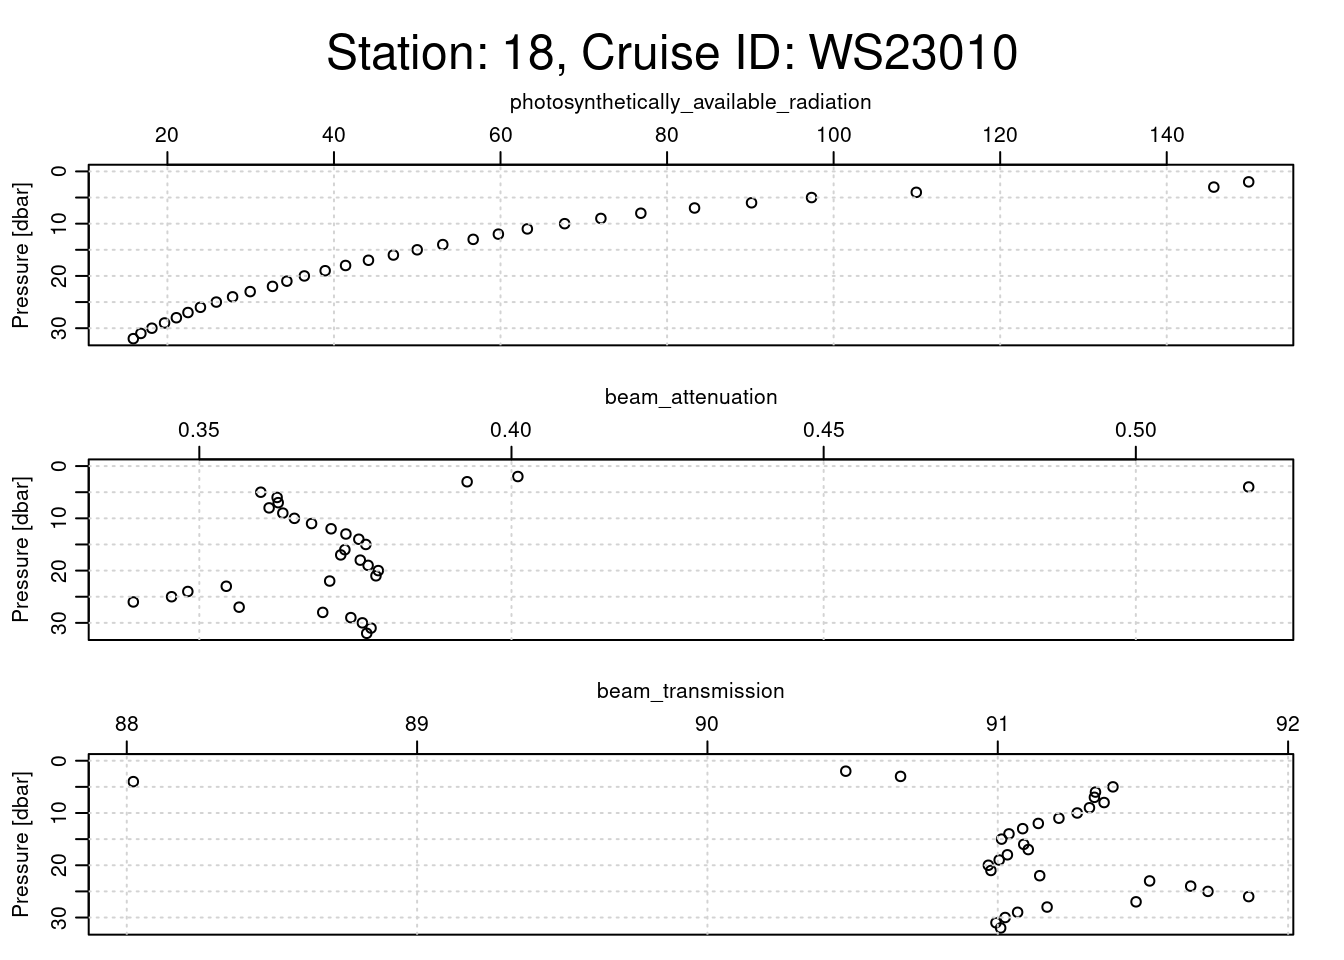
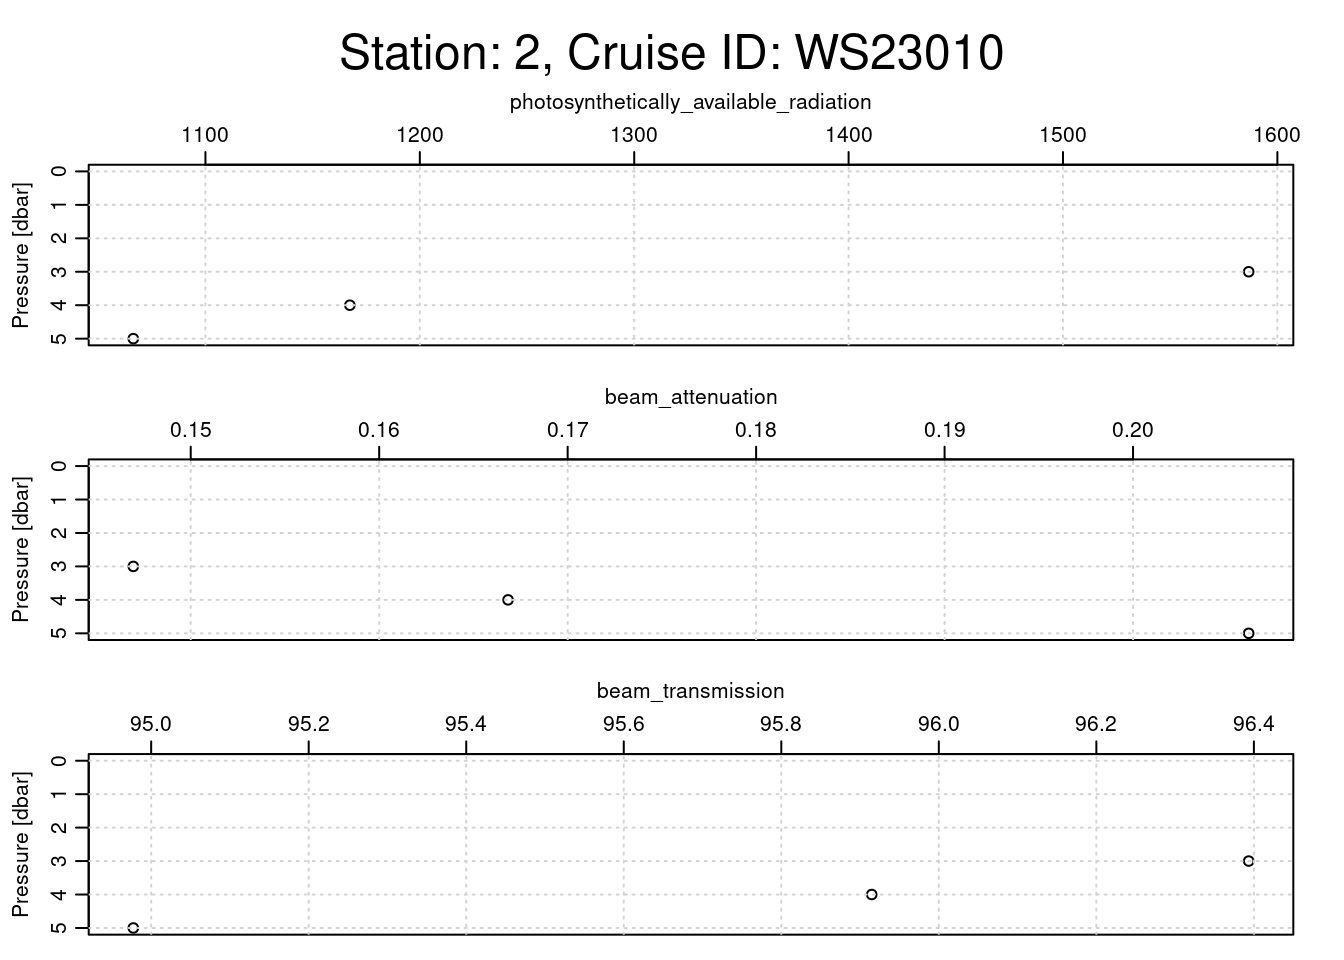
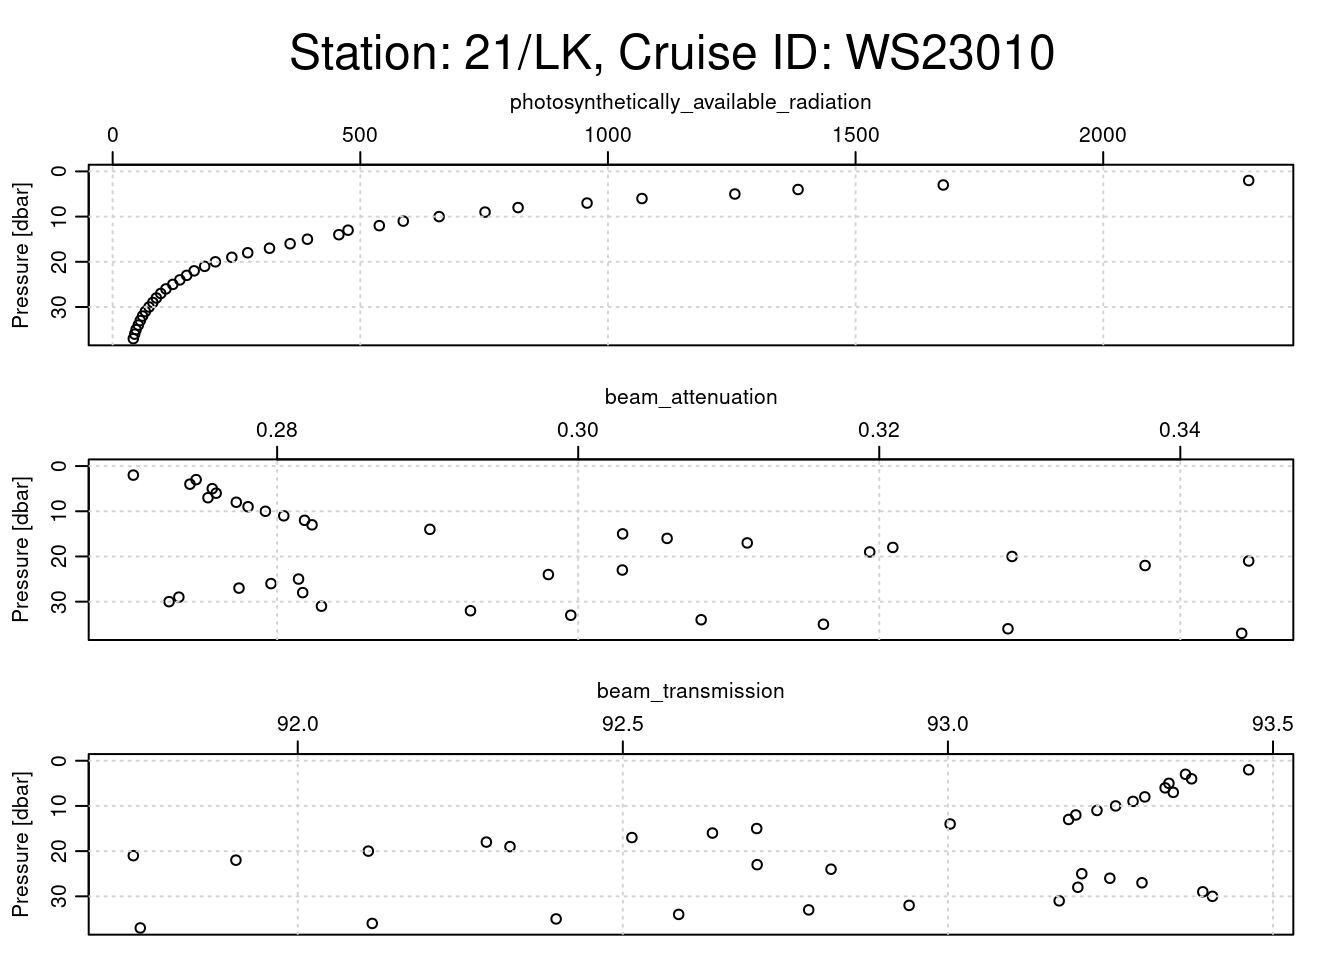
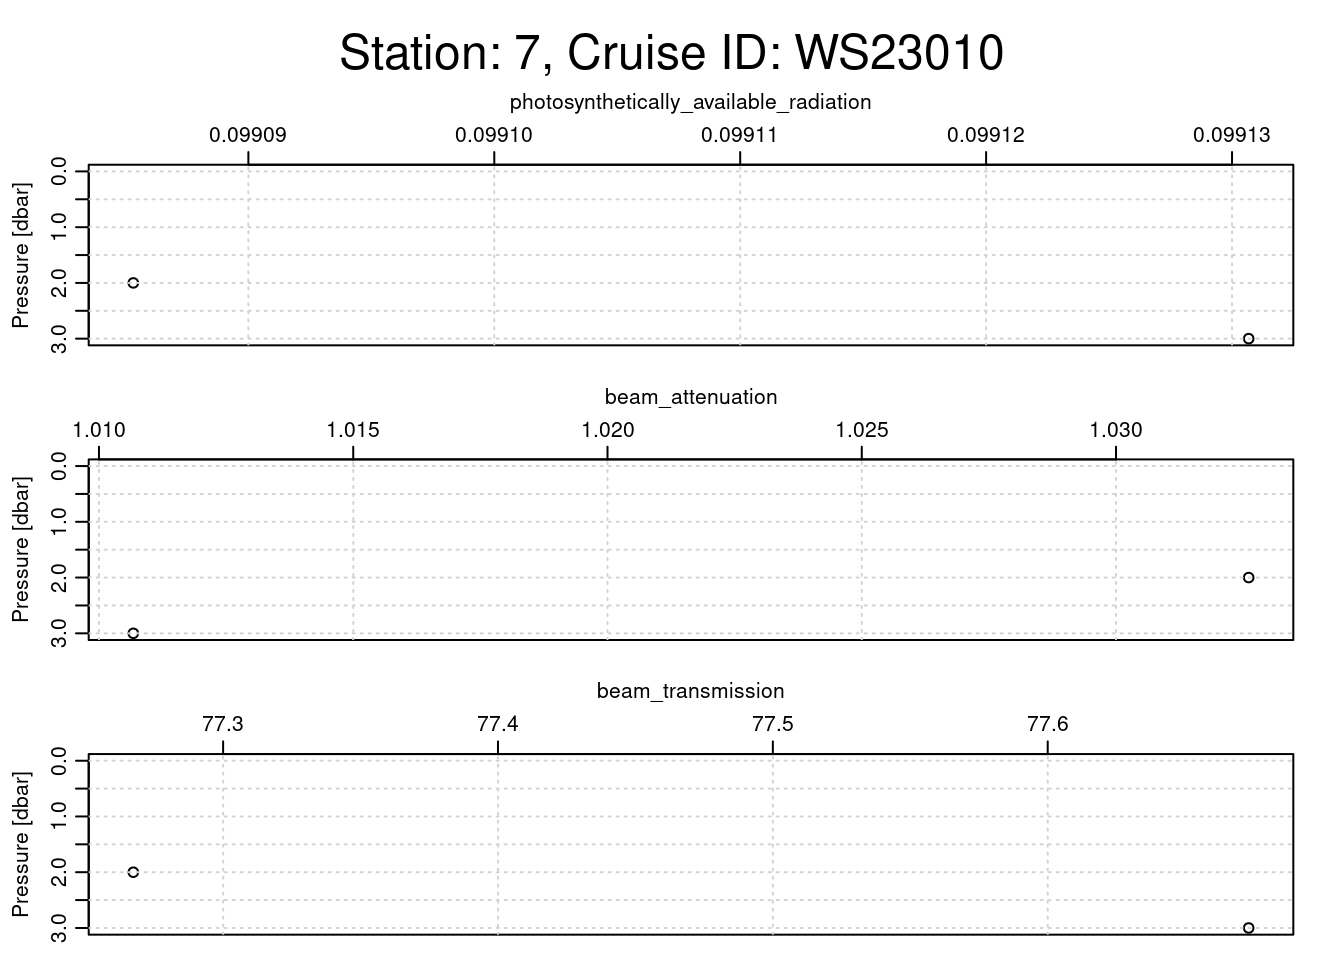
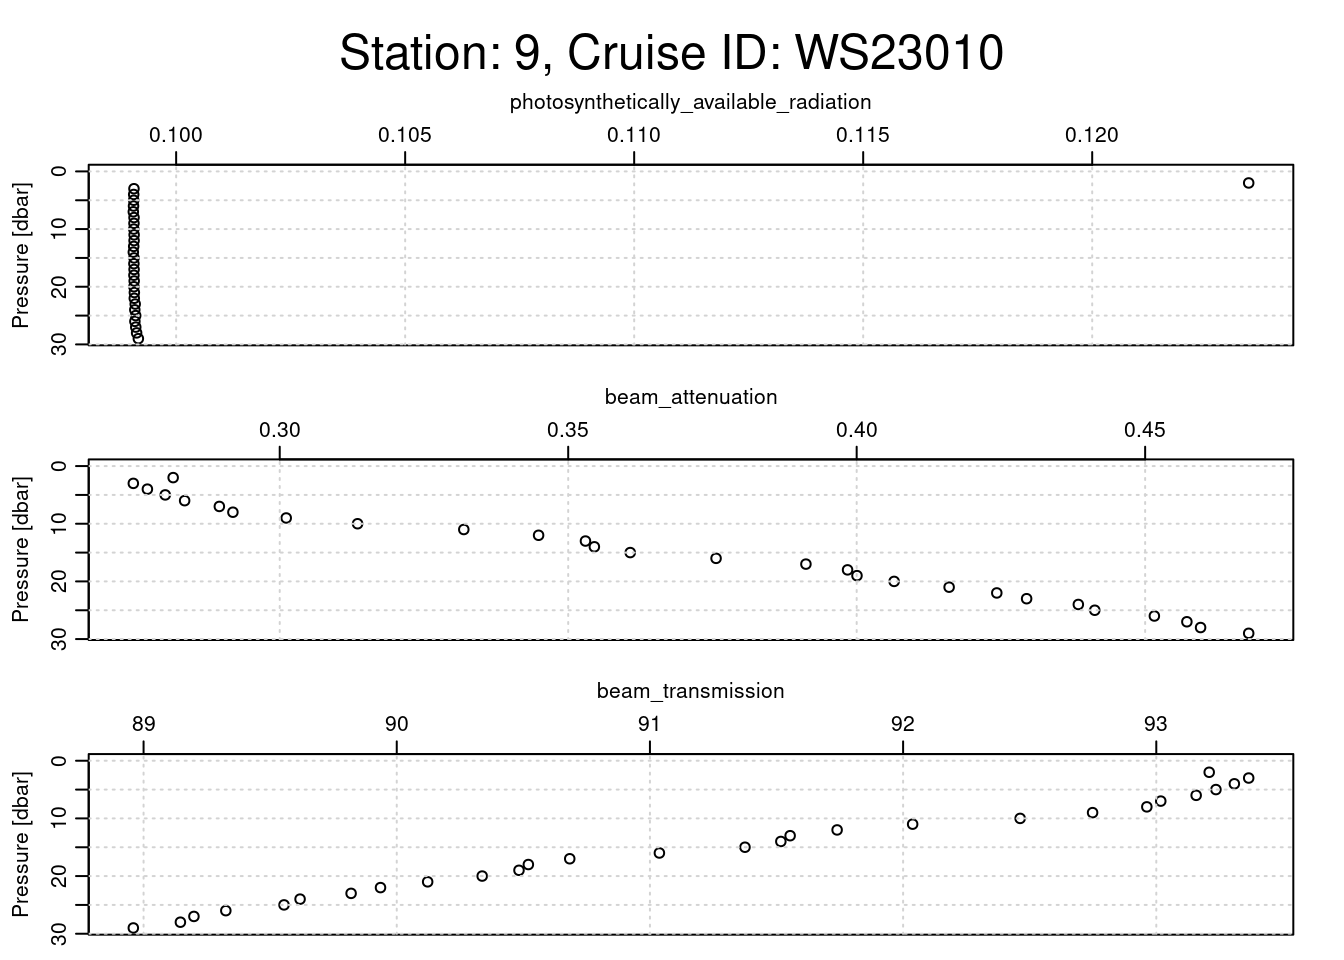
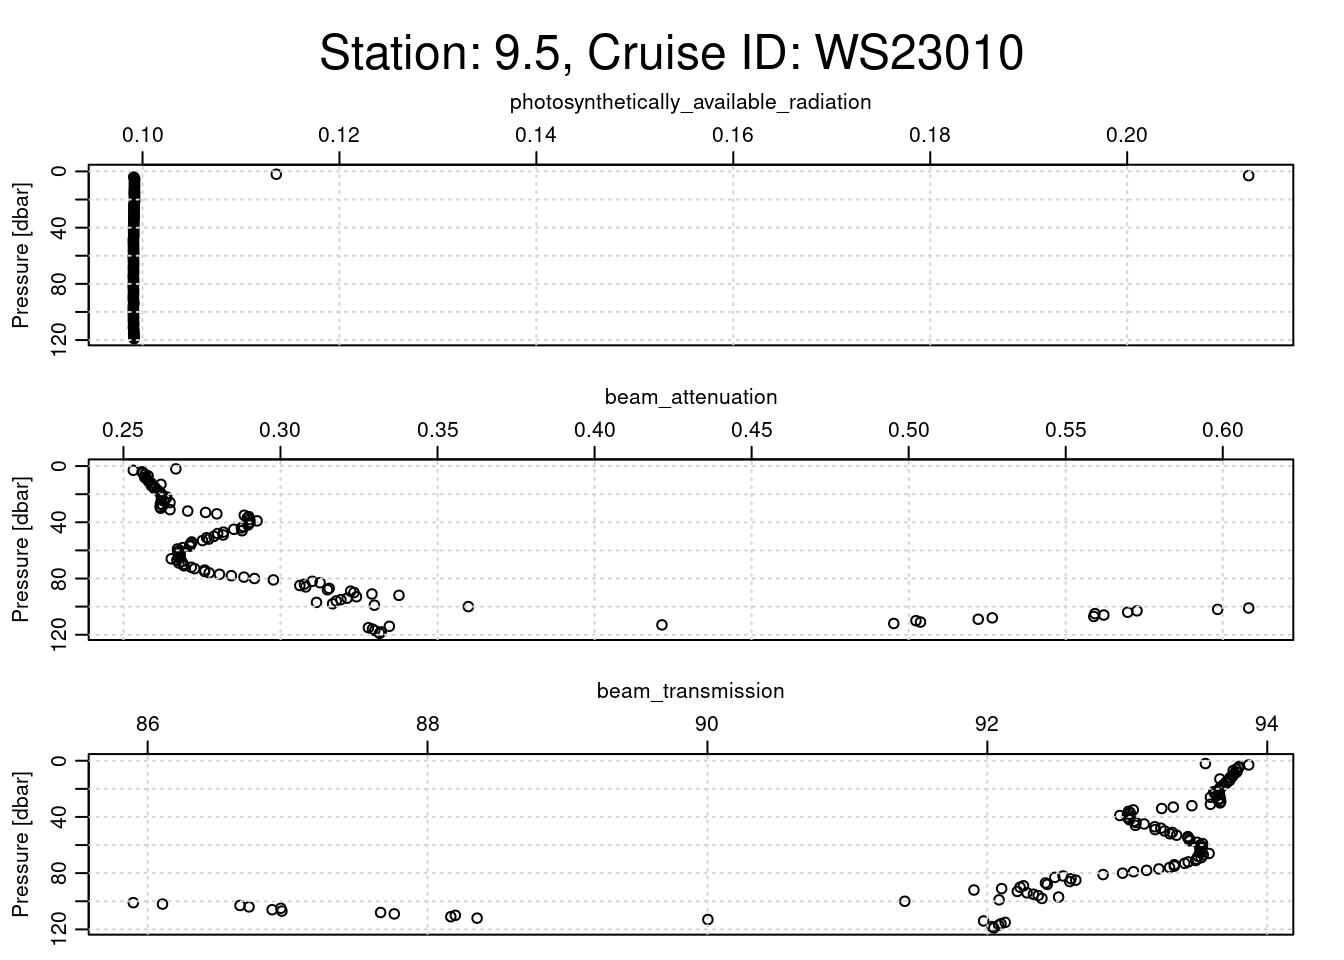
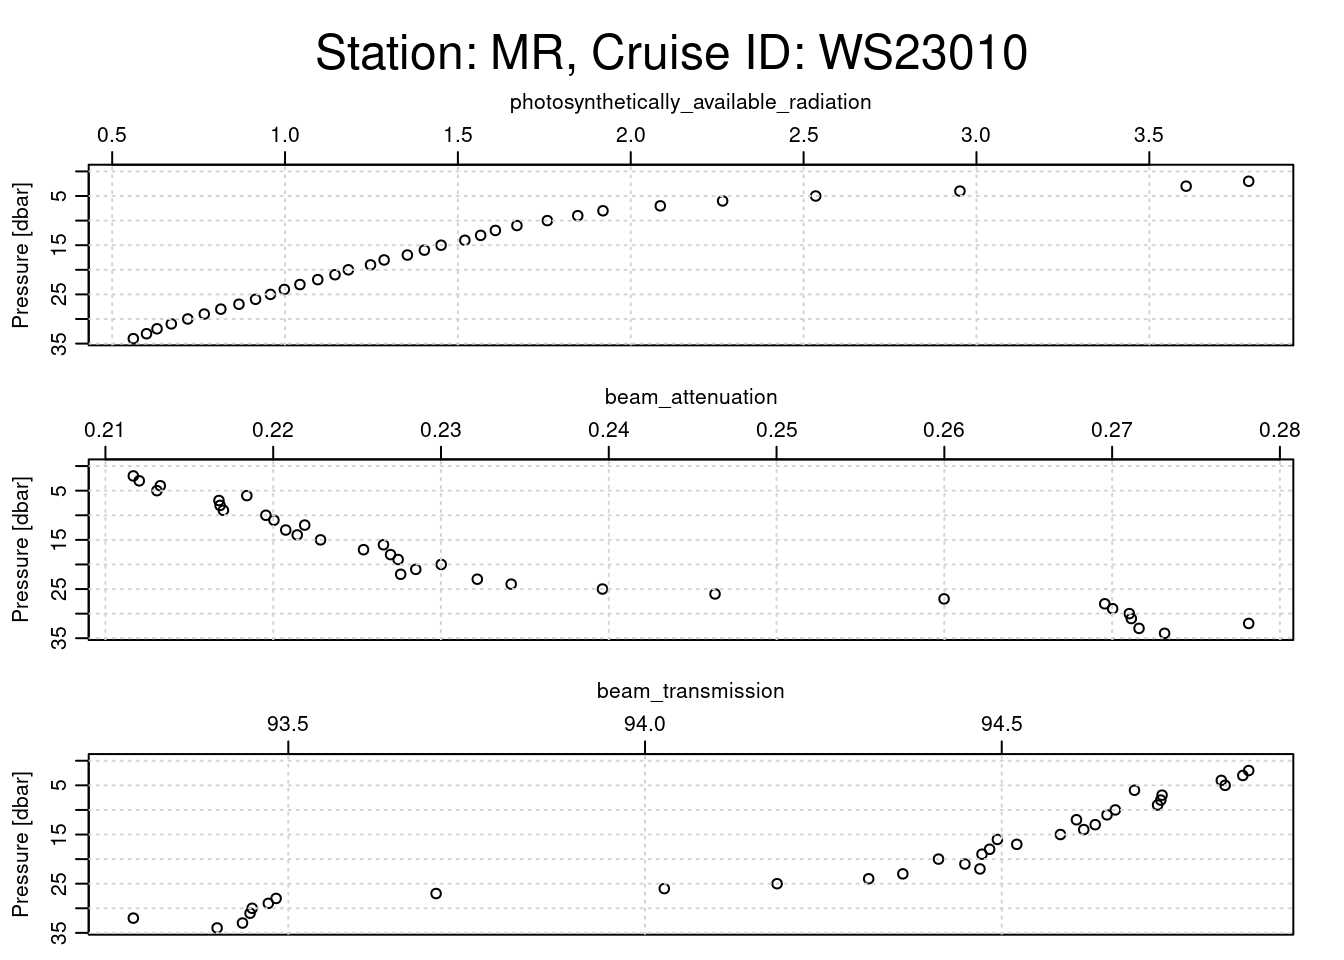
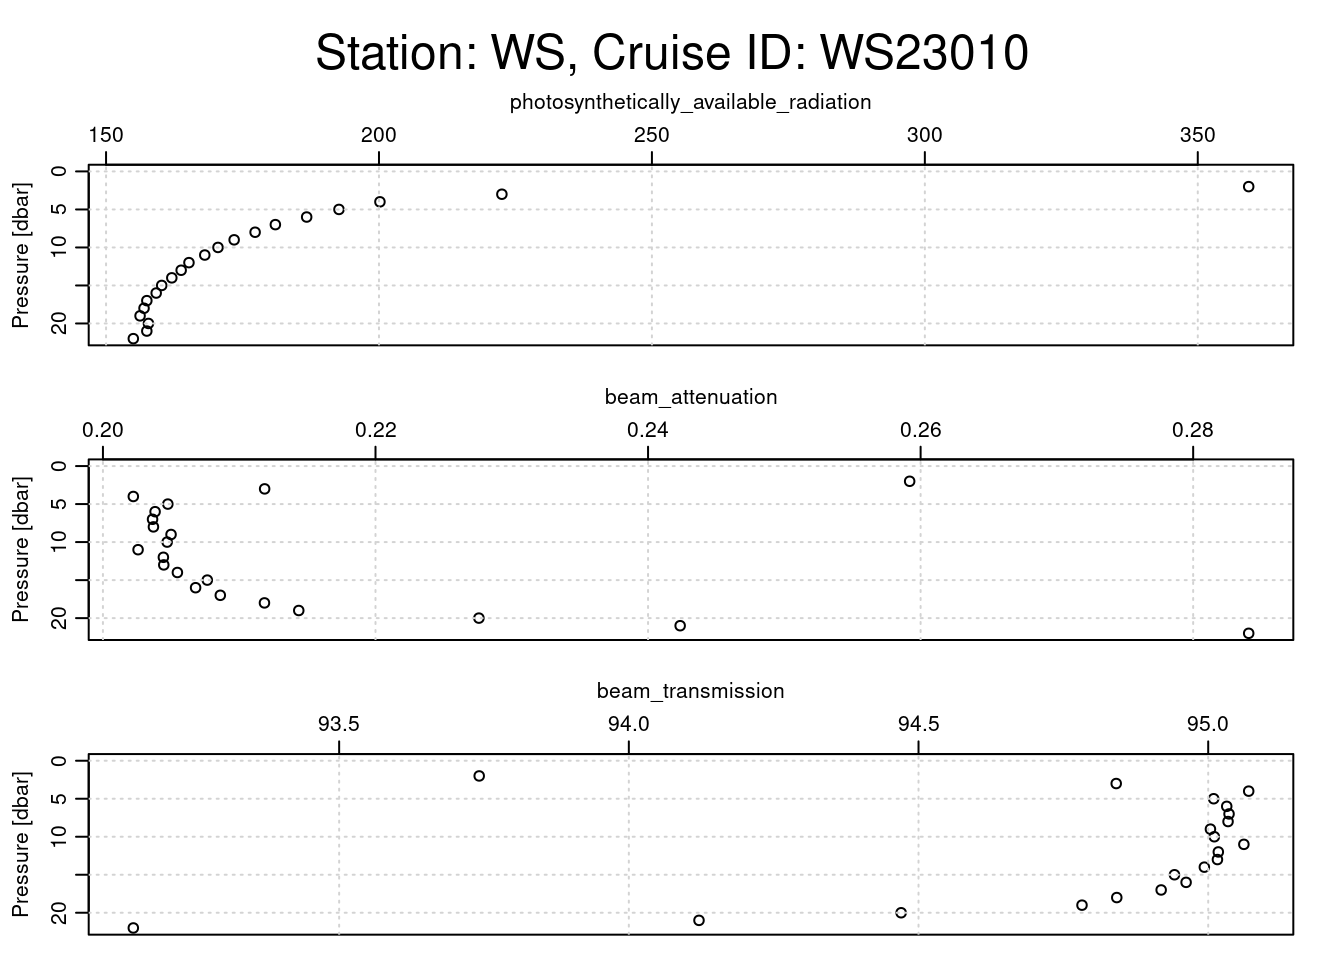
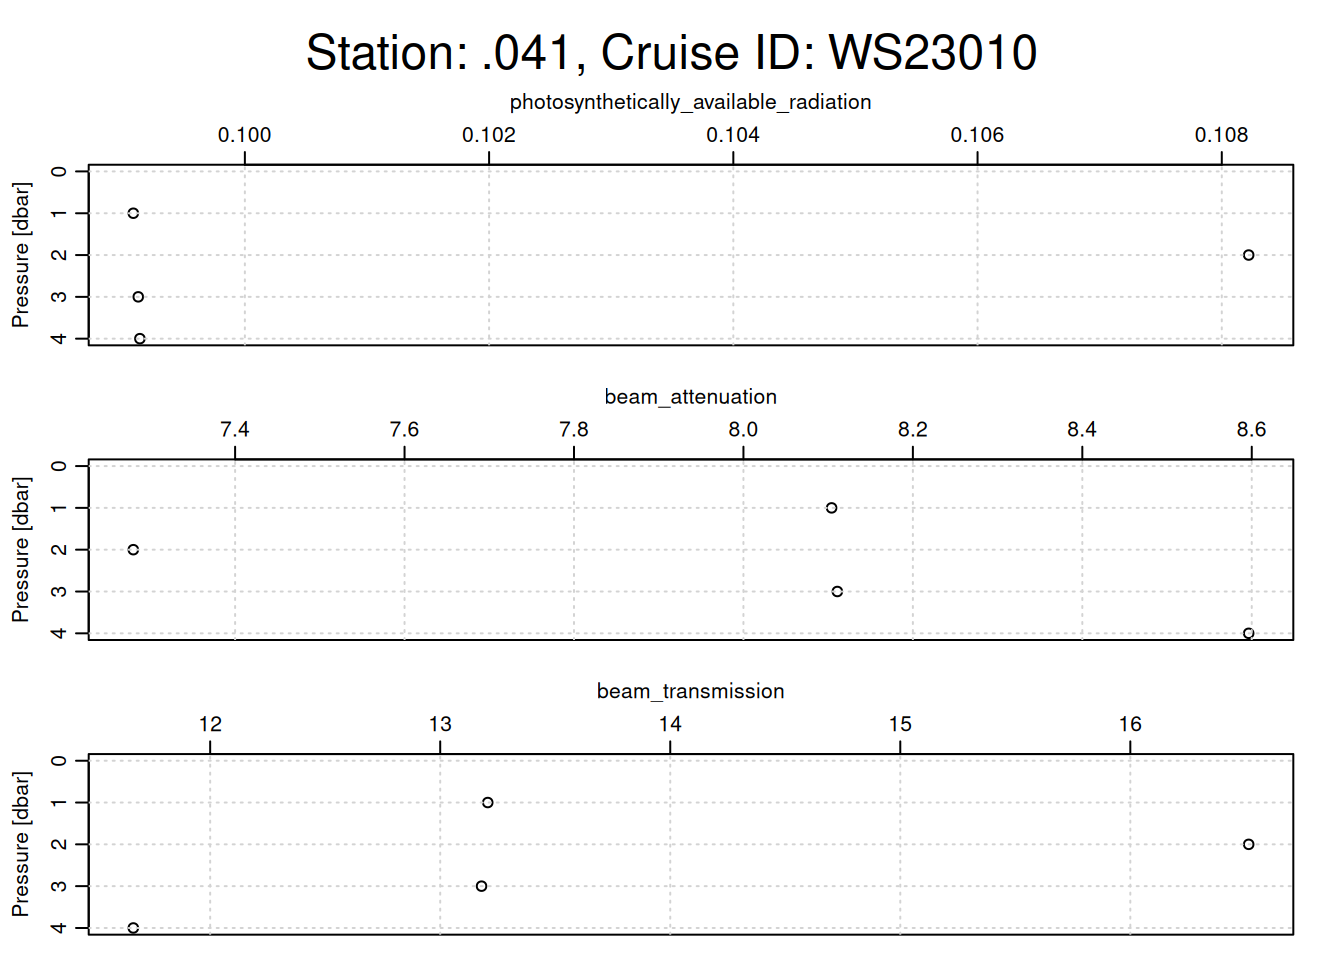
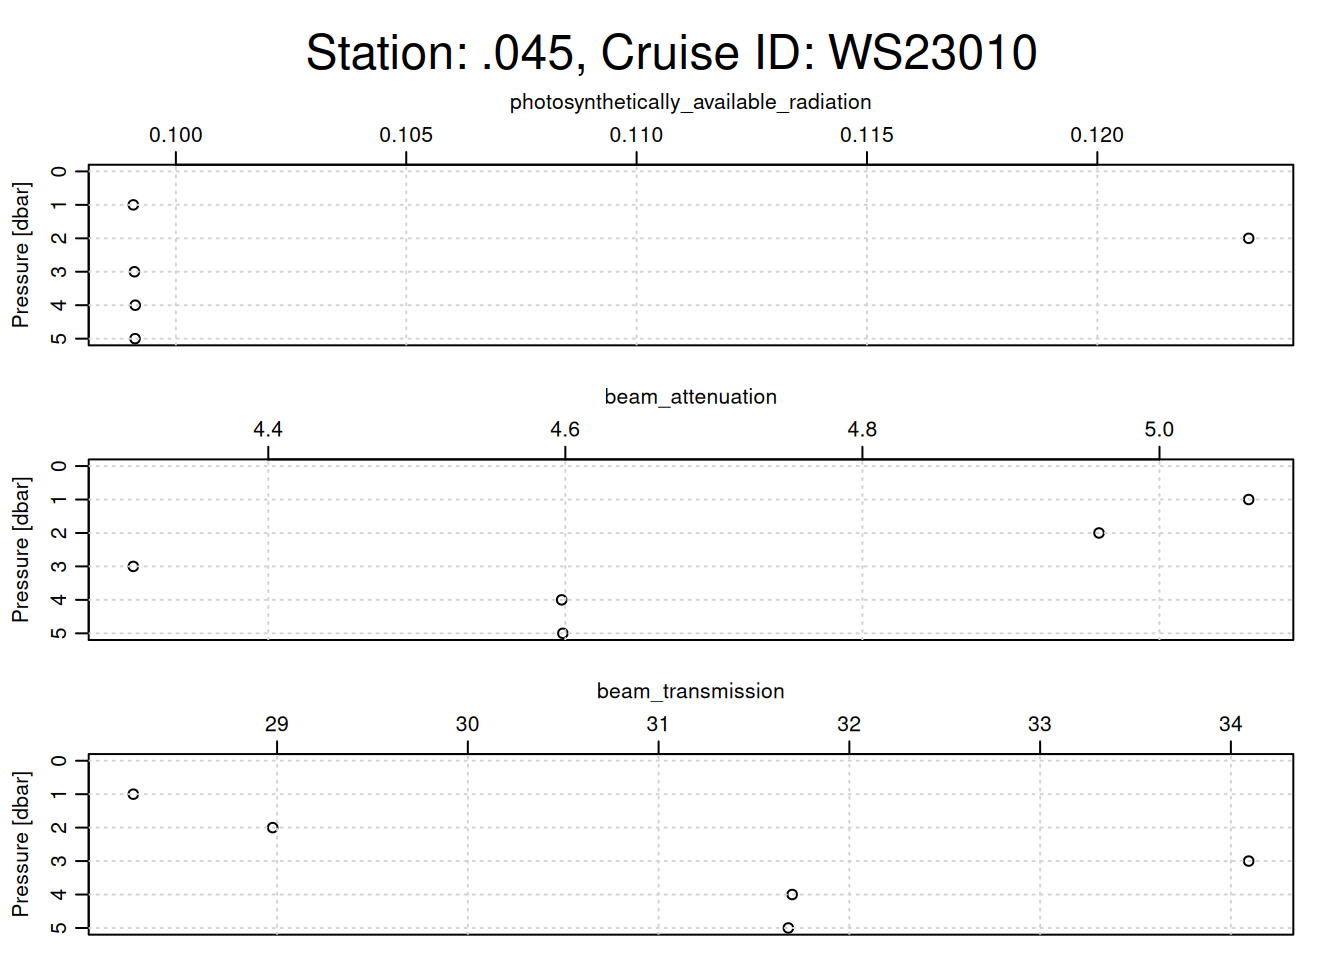
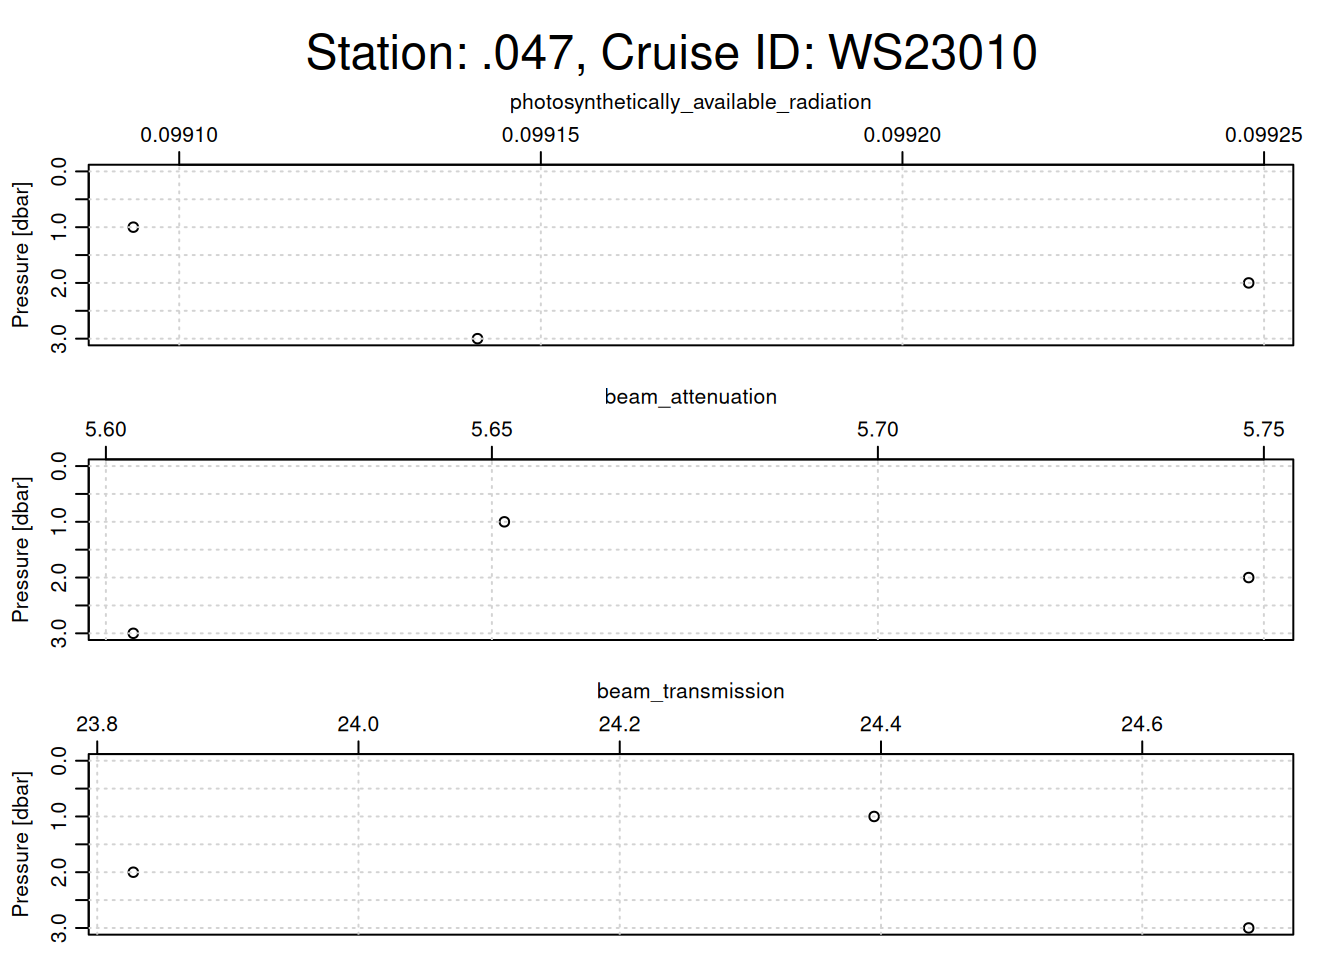
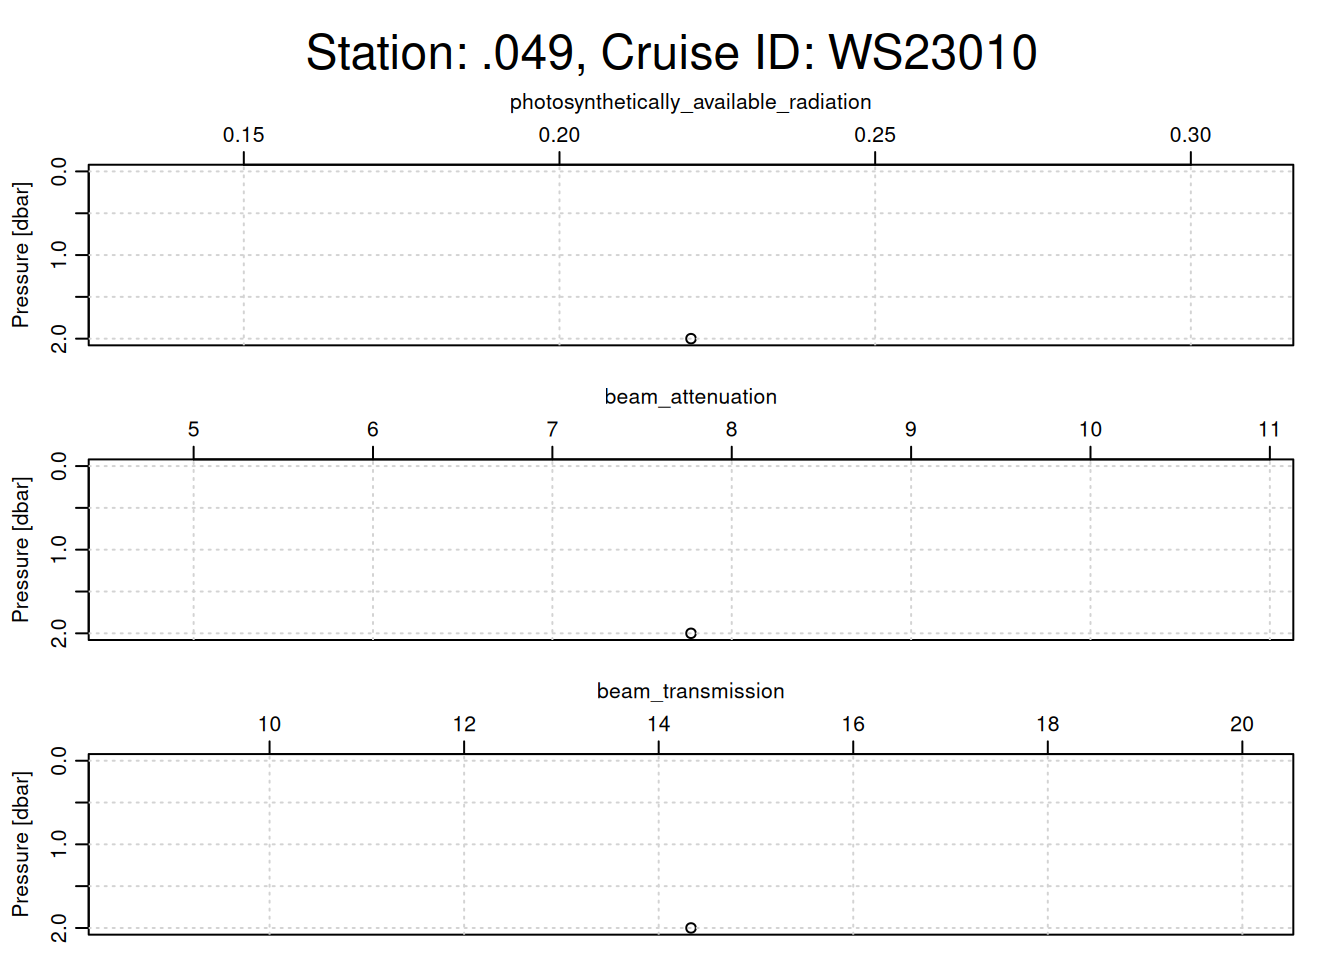
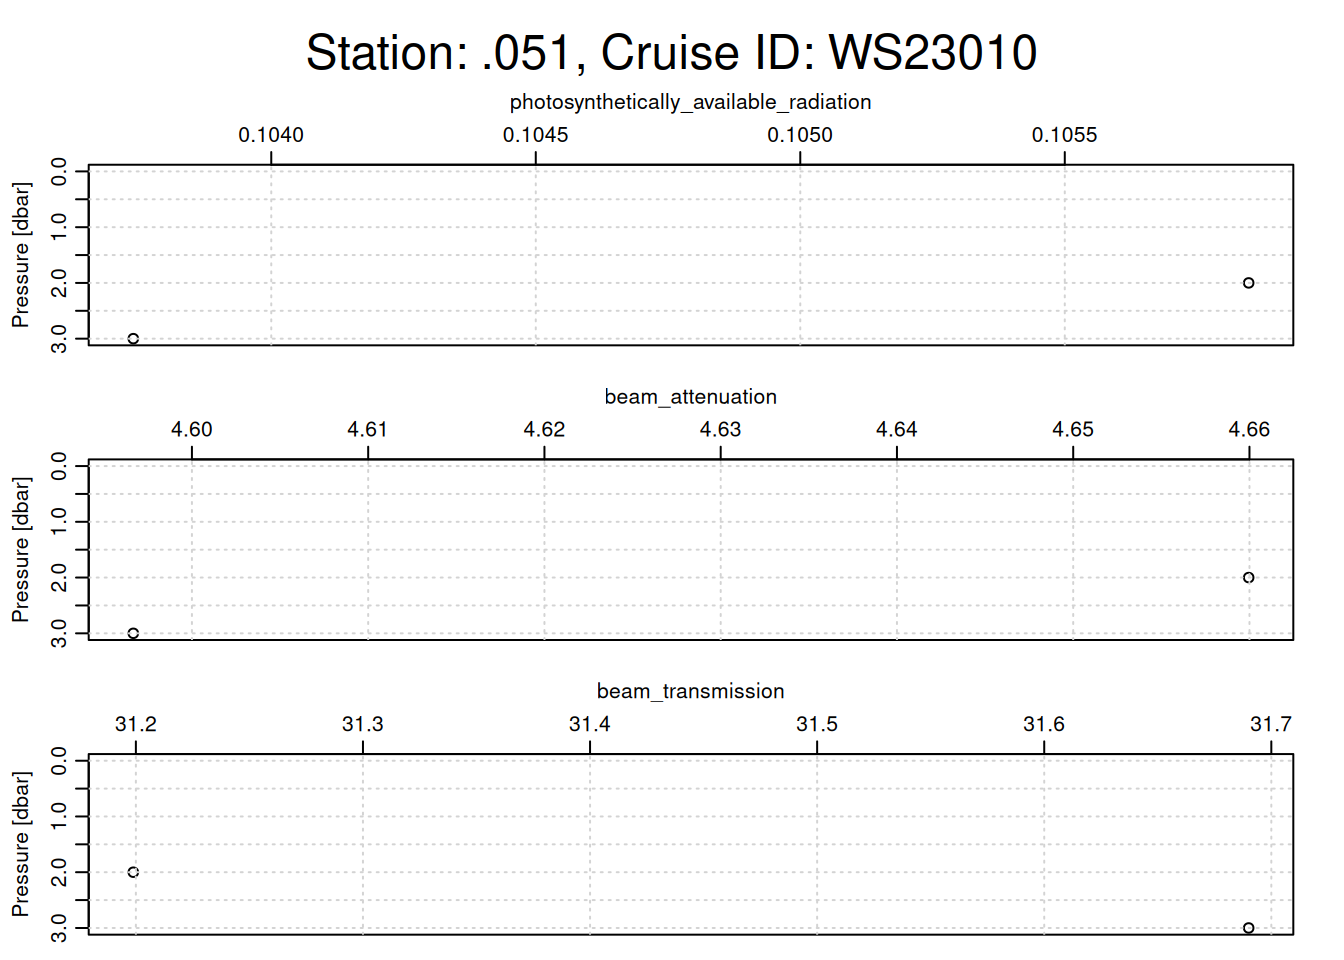
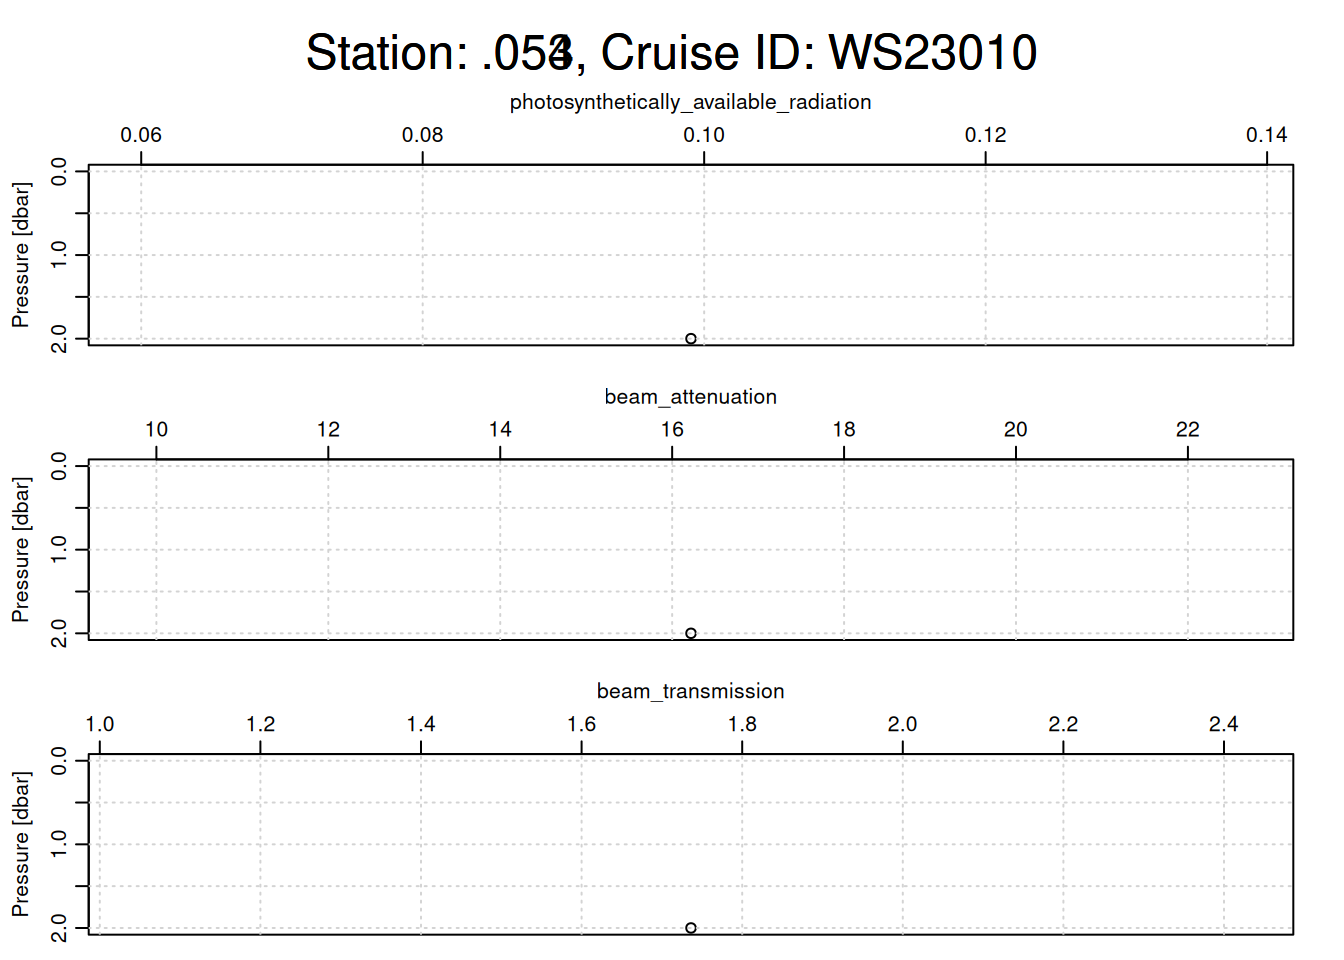
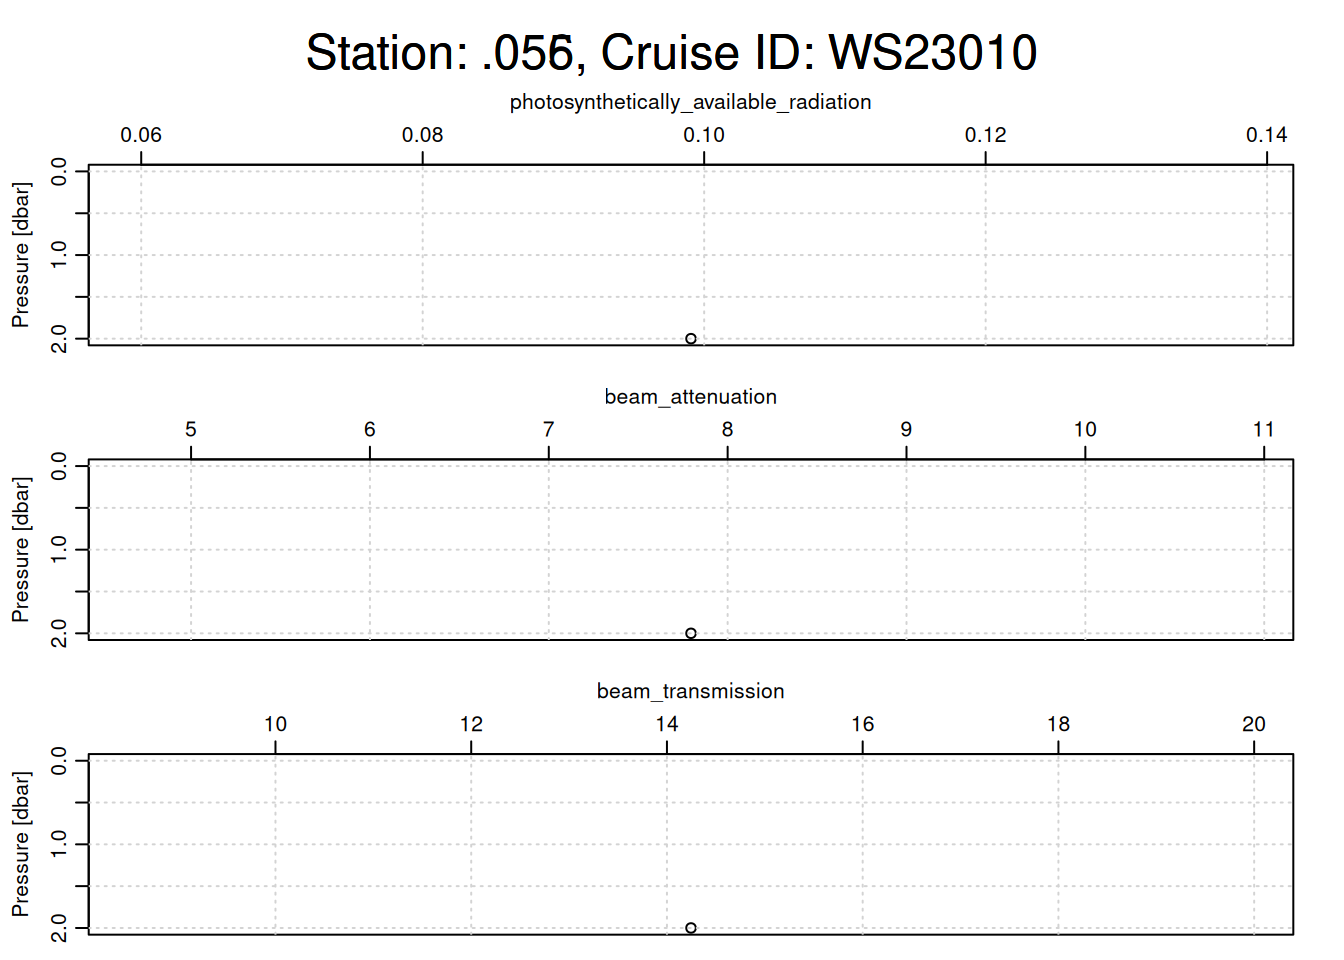
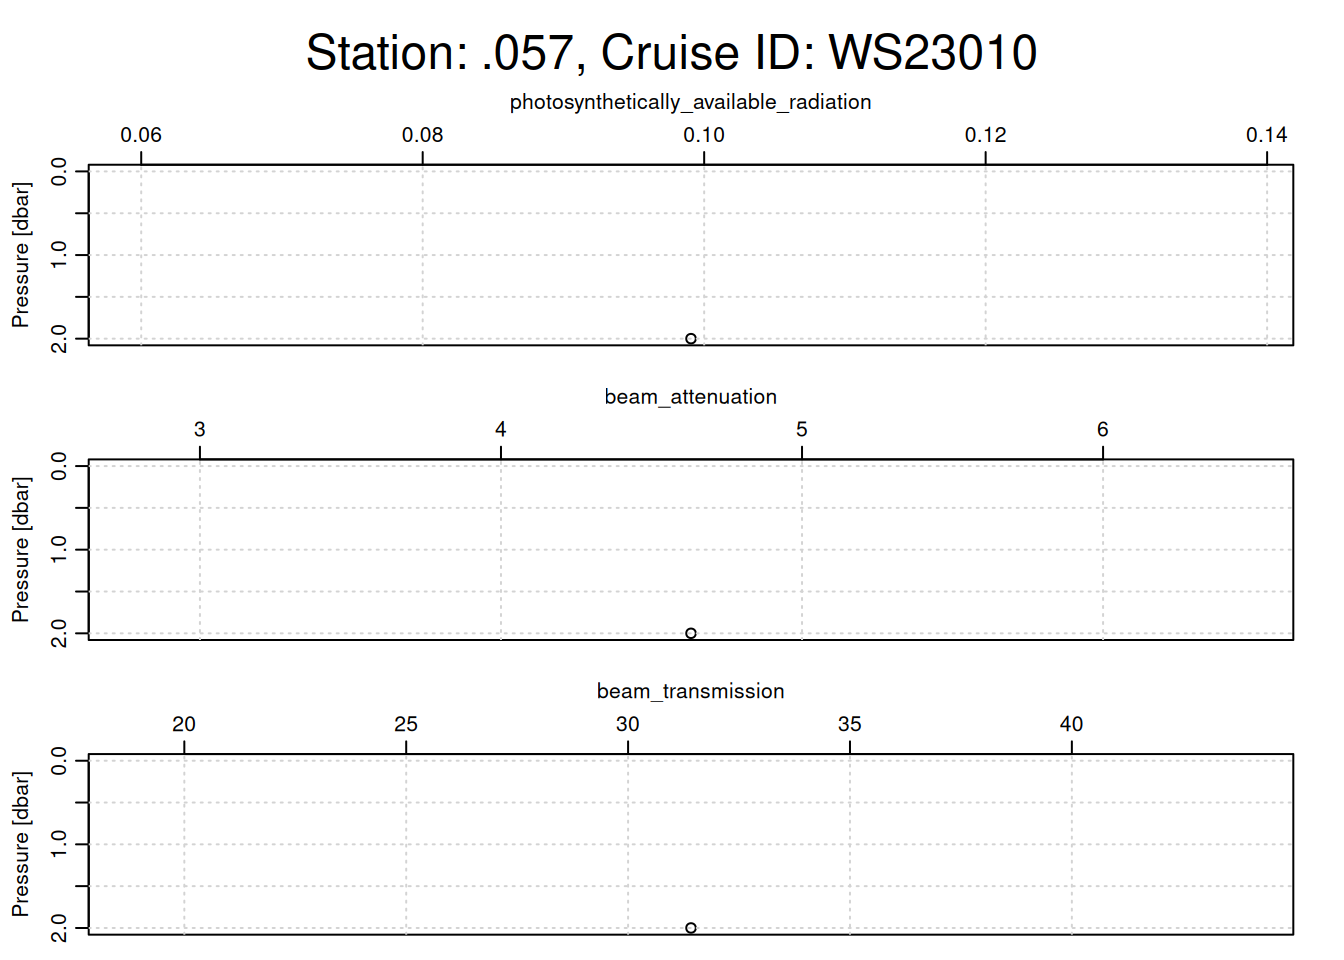
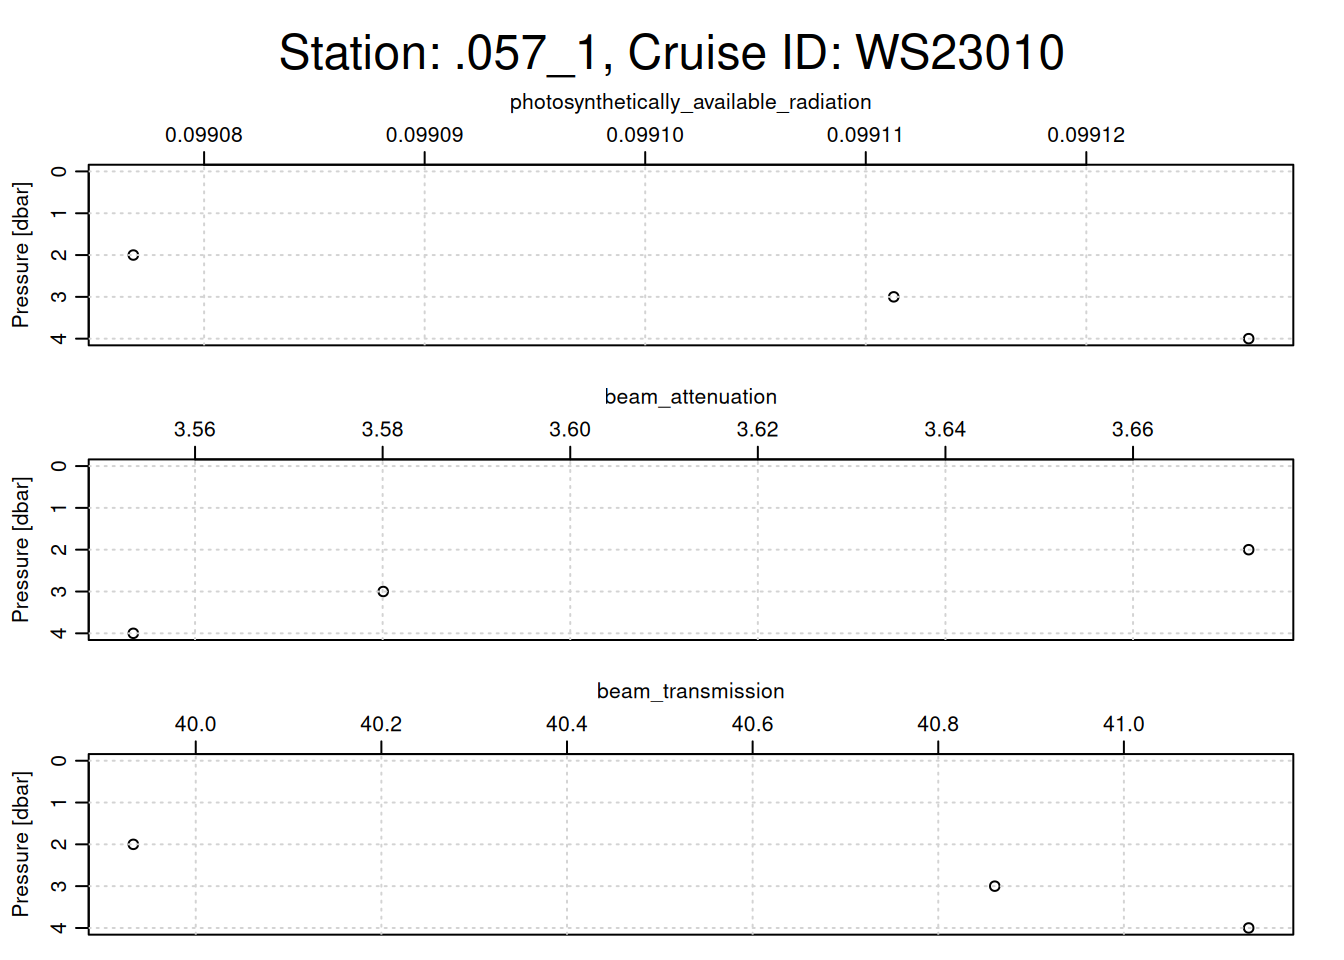
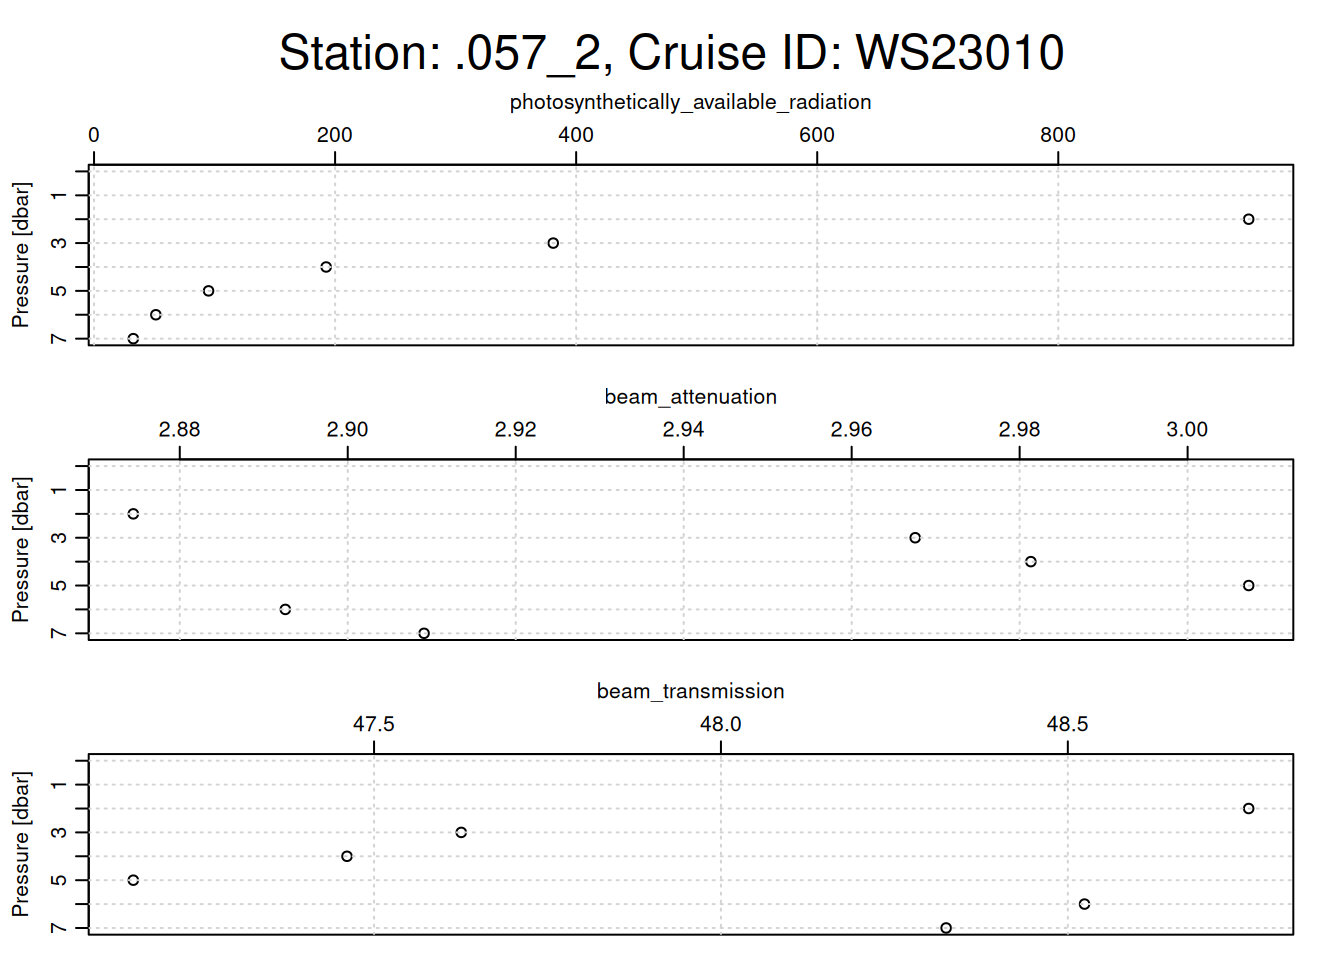
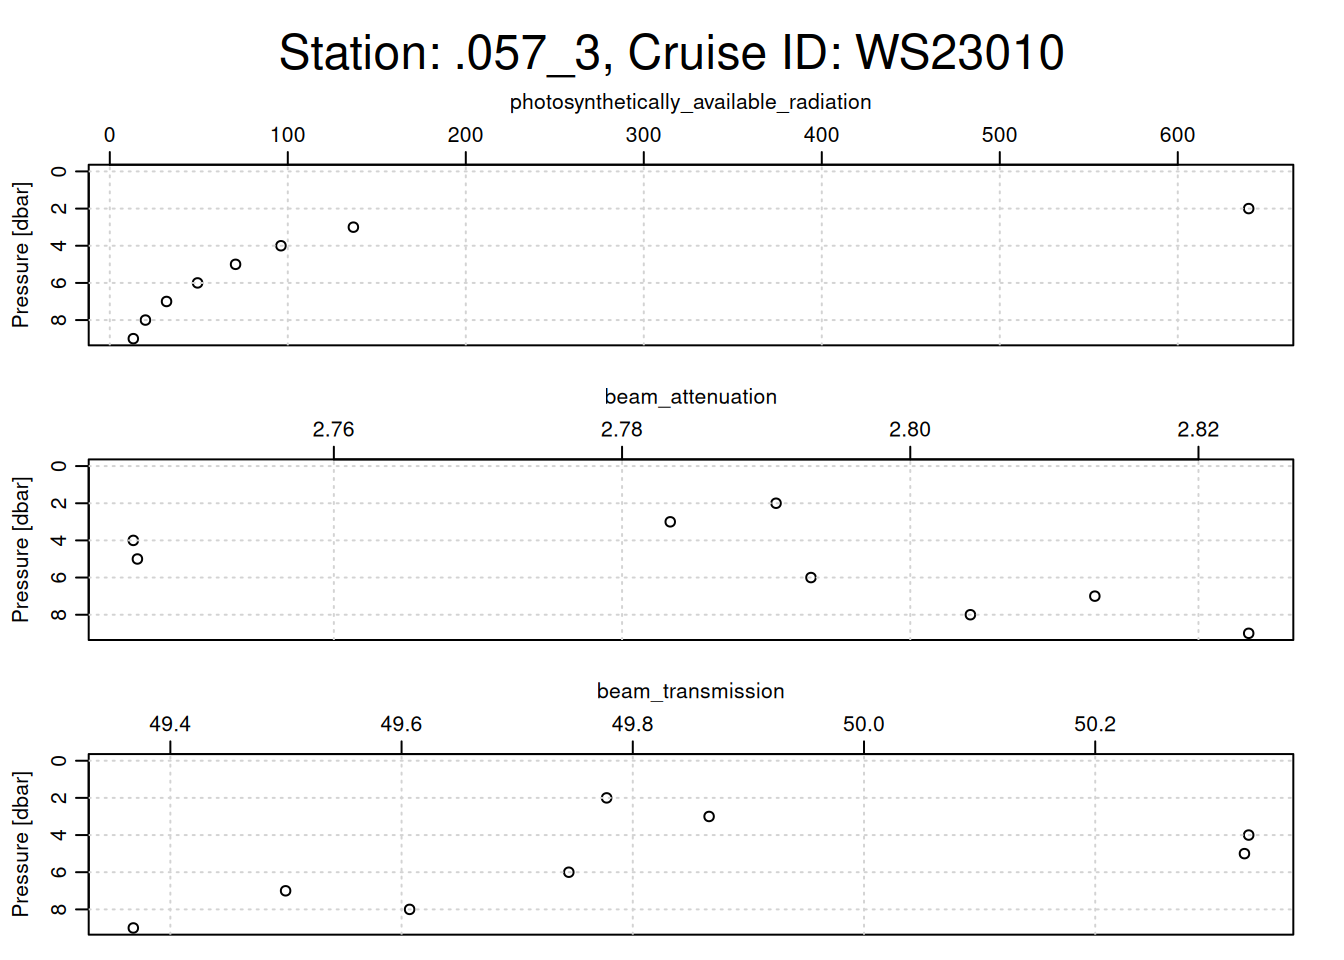
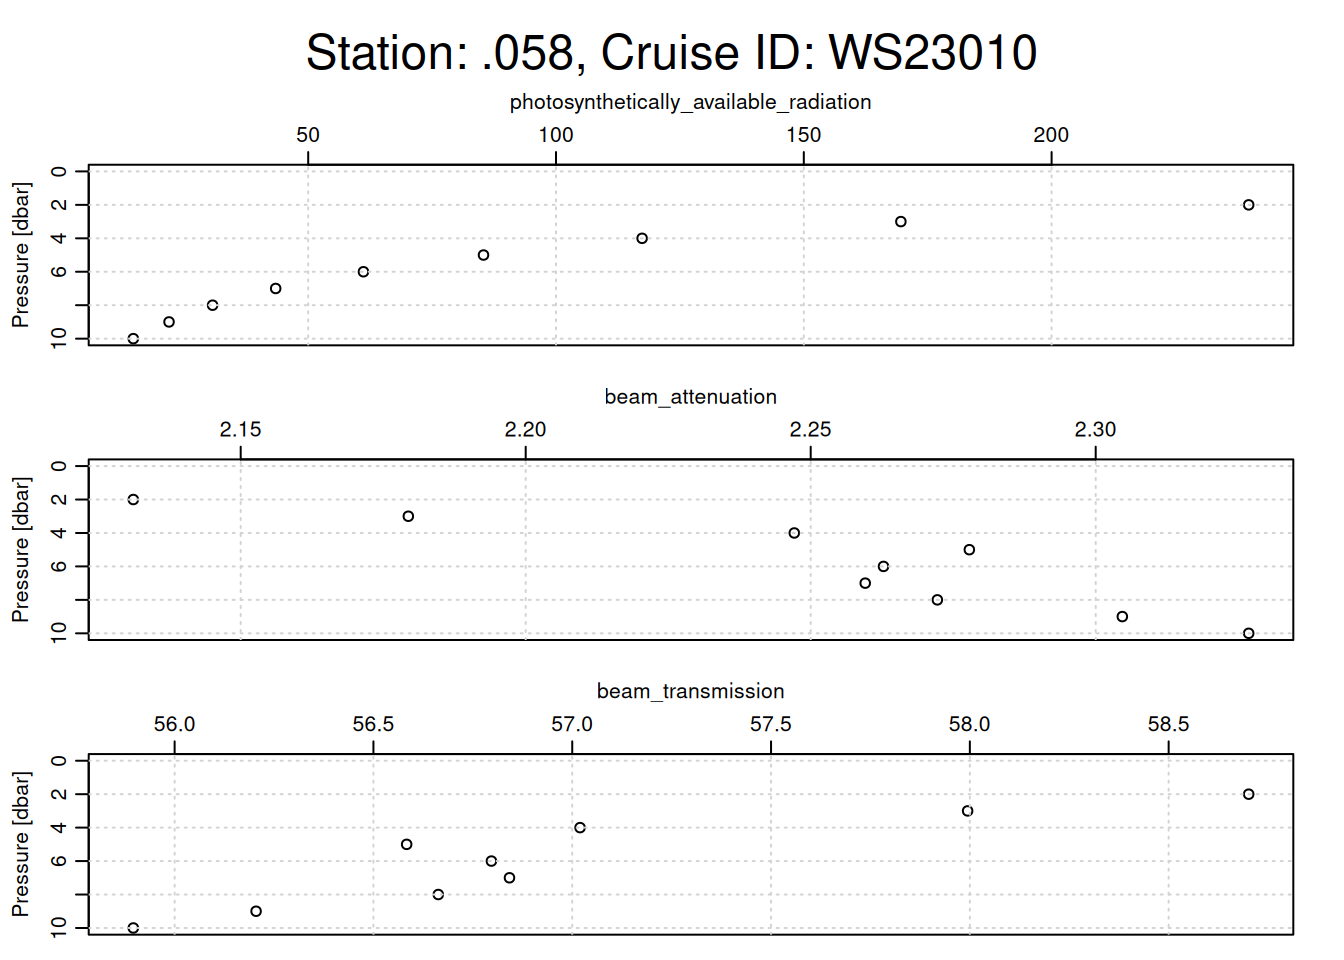
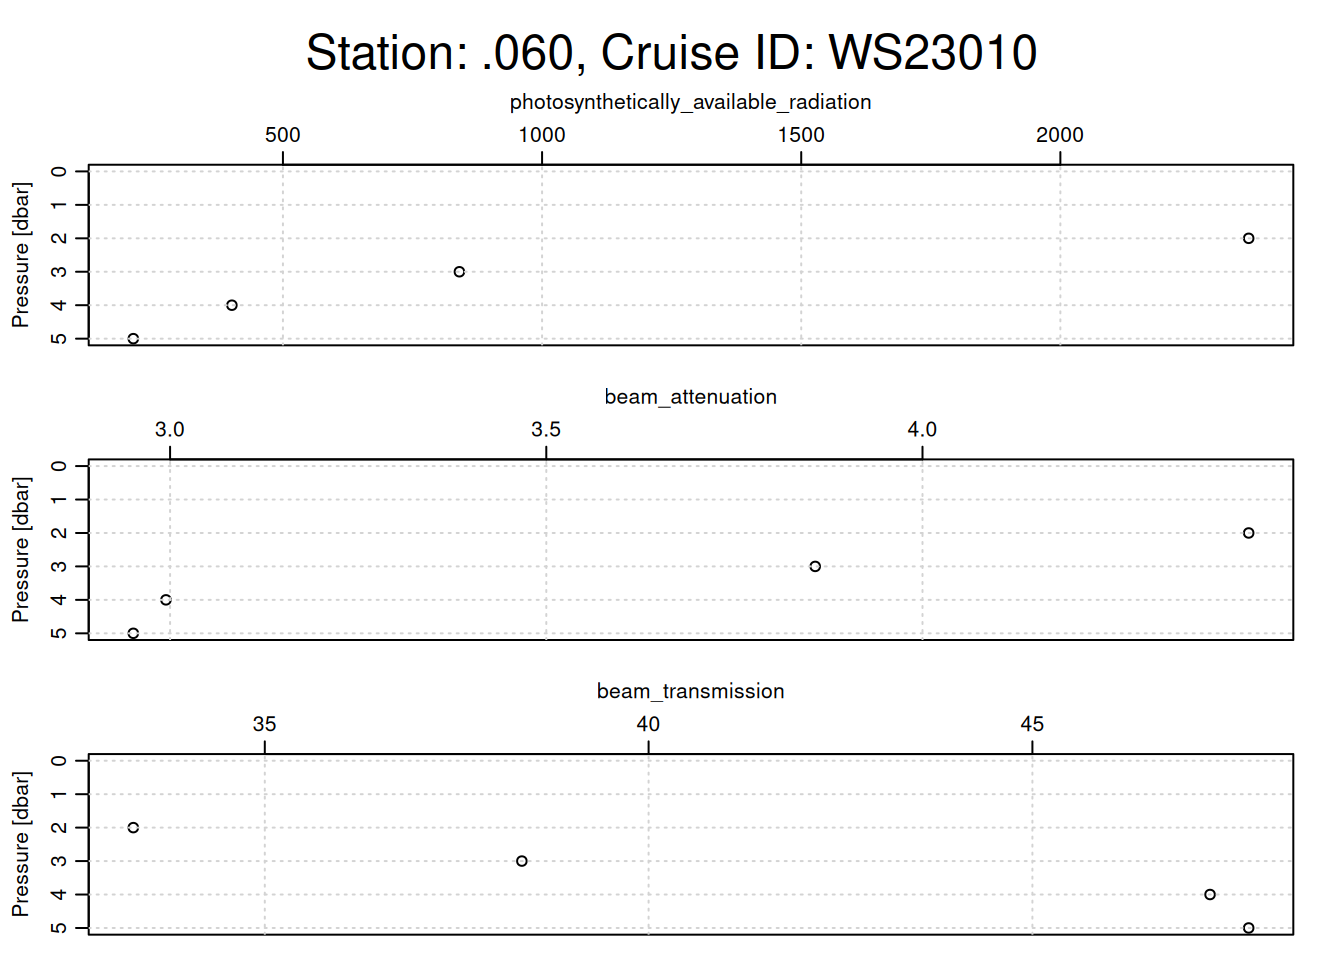
plotting other optical parameters for each cast
# Loop through each CTD castfor (i inseq(ctd_FK)){ cast <- ctd_FK[[i]] # Assuming each sublist contains only one relevant CTD objecttryCatch({# Extract metadata for station name and cruise ID station_name <- cast@metadata$station[1] cruise_id <- cast@data$cruise_id[1]# Generate a title with station name and cruise ID overall_title <- glue::glue("Station: {station_name}, Cruise ID: {cruise_id}")# Set margins: increase the outer margin for the titlepar(oma =c(0, 0, 3, 0)) # Top outer margin increased for title# Plotting function with specific parameters oce::plot(x =ctdDecimate(ctdTrim(cast)),which =c("photosynthetically_available_radiation","beam_attenuation","beam_transmission" ),main =""# No main title for individual subplots )# Place a single overall title at the top of the plot framemtext(overall_title, side =3, line =1, outer =TRUE, cex =1.5)# Reset outer margins to defaultpar(oma =c(0, 0, 0, 0)) }, error =function(e) {print(e$message) # Print any errors that occur during plotting })}
[1] "need finite 'xlim' values"
loop through every cast, clean, & save
combined_df <-data.frame()for (i inseq(ctd_FK)){tryCatch({ cast <- ctd_FK[[i]] # 1 is selecting only the first sublist# print(class(cast))# clean cast trimmed_cast <-ctdTrim(cast) decimated_cast <-ctdDecimate(trimmed_cast, p =0.5) # binned to 0.5 m# convert to df cast_df <-as.data.frame(decimated_cast@data)# Add metadata# assumes station ID and cruise ID the same for all & just uses 1st one cast_df <-mutate( cast_df,station = cast@data$station[1],cruise_id = cast@data$cruise_id[1] )# drop NA rows left by cleaning cast_df <-subset(cast_df, !is.na(scan))# Append the data to the combined dataframe combined_df <-rbind(combined_df, cast_df) }, error =function(e){print(glue("error in cast {cast@metadata$station[1]}"))print(e) })}# Save to CSVfile_path <-here(glue("data/cleaned/{cruise_id}.csv"))write.csv(combined_df, file_path, row.names =FALSE)