source(here::here("R/ctd_load_from_csv.R"))cast <-ctd_load_from_csv(here::here(glue::glue("data/01_raw/ctd/{cruise_id}/{params$cast_id}.csv"# TODO: include other_params (use the 1s from `use (from CTD data)` column and do not include 0s from that column in spreadsheet https://docs.google.com/spreadsheets/d/1uCxEmJRqErU-HCQiRQ1FpyiIqtNaGgMSBI0WvrtwBRU/edit?gid=137286311#gid=137286311 ))))
WS16263_WS16263_WS16263stn16.csv
[1] "No additional parameters to add"
create an oce CTD object
# TODO: Include param here that specifies to handle QC flags. This should be done before converting to a OCE object. QC flag columns are listed in [this spreadsheet](https://docs.google.com/spreadsheets/d/1uCxEmJRqErU-HCQiRQ1FpyiIqtNaGgMSBI0WvrtwBRU/edit?gid=137286311#gid=137286311) and are not supposed to be included in the oce object. QC param values are : # 1 good# 2 +/- 3*std_dev# 4 +/- 5*std_dev# 9 missing# Data column should be set to NA if corresponding QC column has value greater than threshold (recommended threshold is 5*std_dev).# Will need to loop through *_qc columns.# TODO: drop spikes (how? low-pass?).# TODO: combine replicate sensors (eg temp1 temp2).
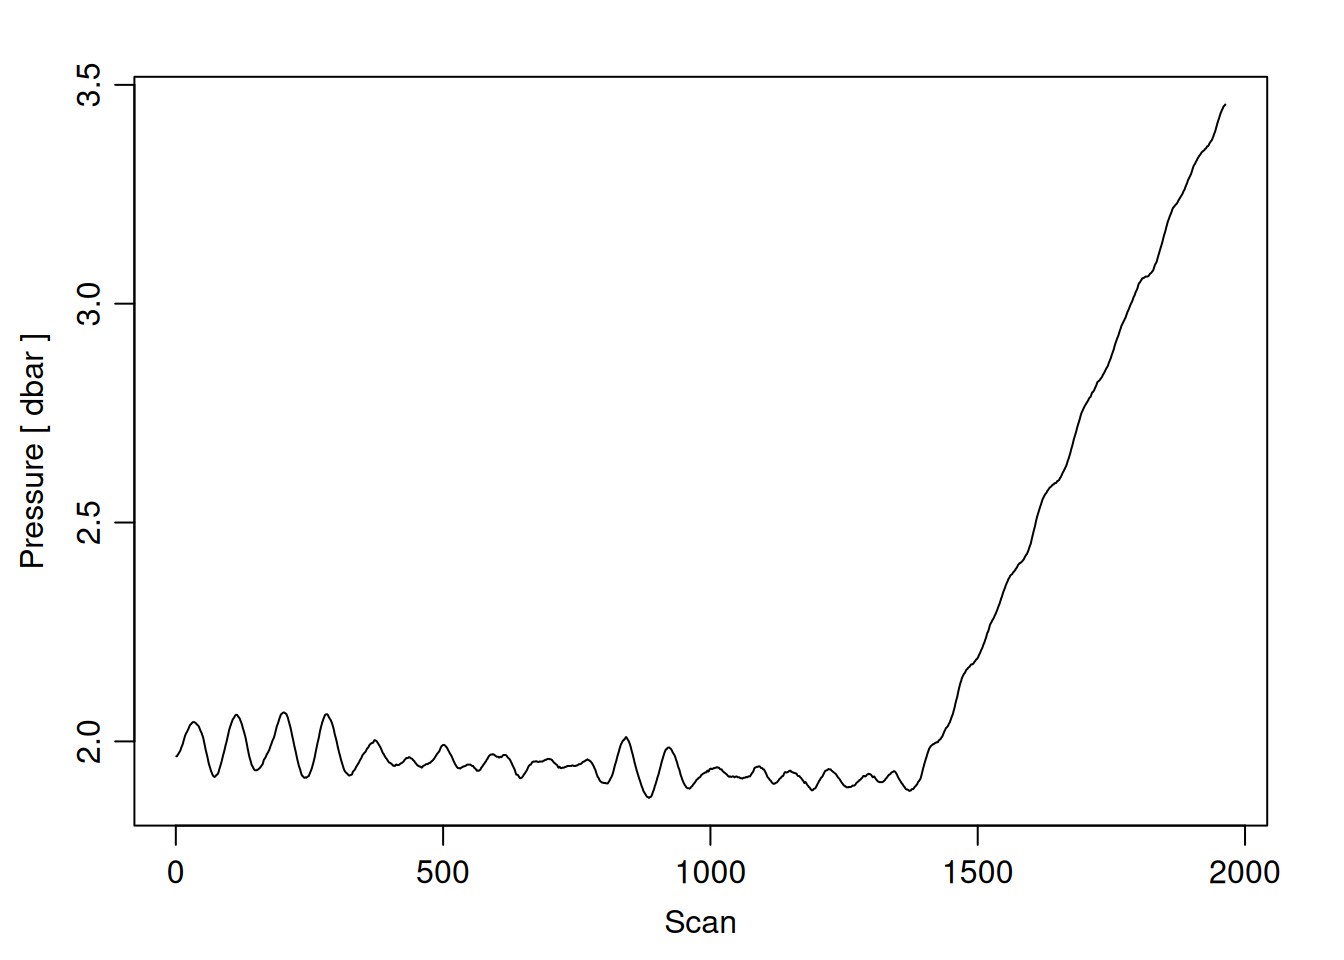
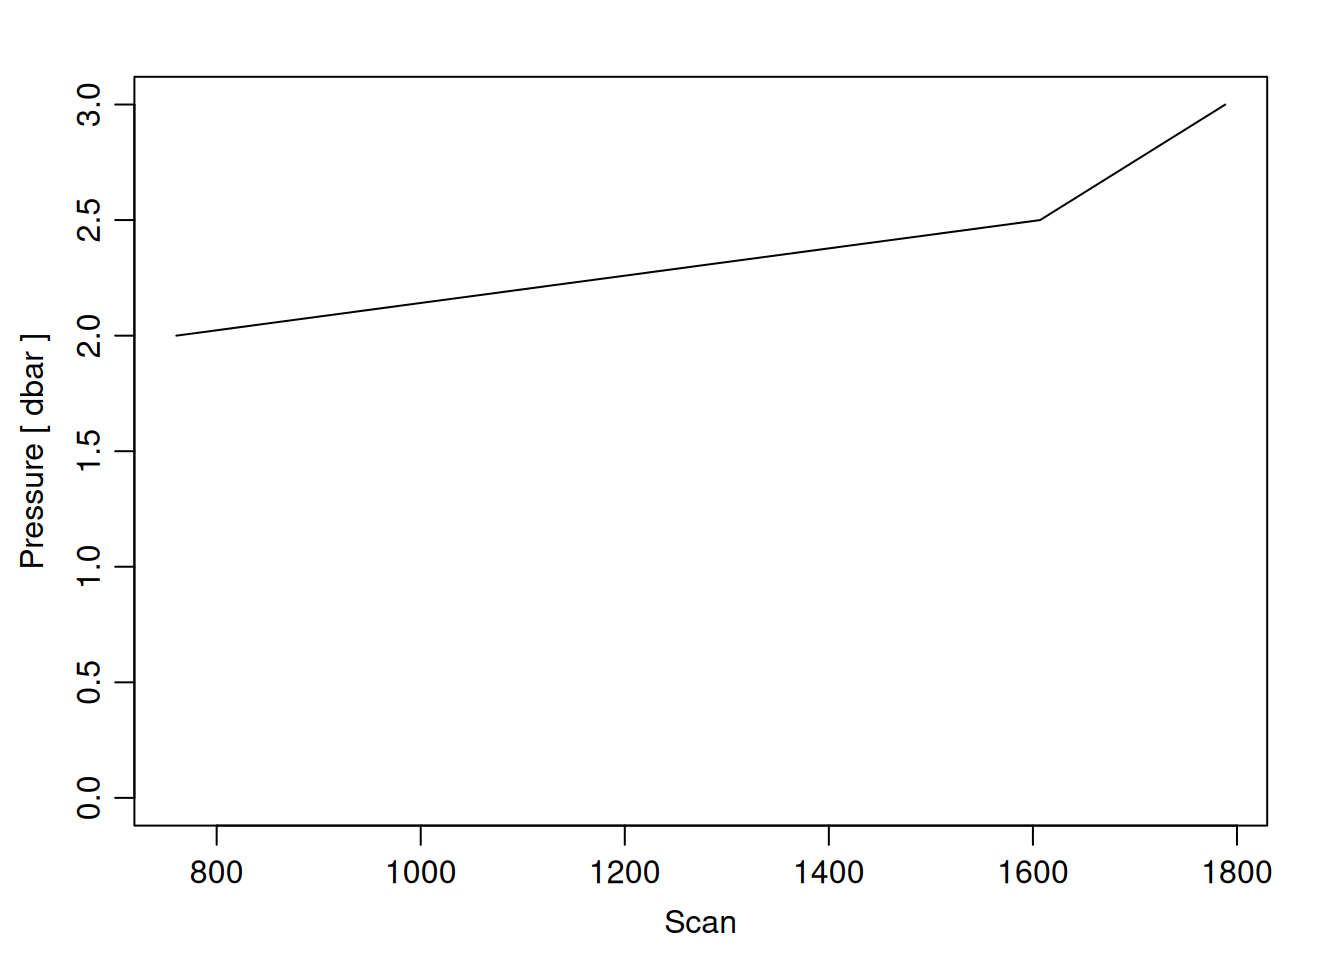
tryCatch({ trimmed_cast <-ctdTrim(cast) decimated_cast <-ctdDecimate(trimmed_cast, p =0.5)# plotting can cause the xlim failureplotScan(decimated_cast)# === export === cast_df <-as.data.frame(decimated_cast@data)# Add metadata cast_df <-mutate( cast_df,station = station_id,cruise_id = cruise_id )# drop NA rows left by cleaning cast_df <-subset(cast_df, !is.na(scan))# create folder if doesn't exist clean_data_loc <- here::here("data/02_clean")try(fs::dir_create(clean_data_loc))# save ctd to .csvwrite.csv(cast_df, glue("{clean_data_loc}/{params$cast_id}.csv"))}, error =function(e) {cat("\n=== CTD PROCESSING ERROR ===\n")cat("Cast ID:", params$cast_id, "\n")cat("Error message:\n", conditionMessage(e), "\n\n")# Safely inspect objects that might or might not exist when the error happenedif (exists("decimated_cast")) { df <-try(as.data.frame(decimated_cast@data), silent =TRUE)if (!inherits(df, "try-error")) {cat("Dataframe columns:\n")print(names(df))cat("\nSummary of key columns (scan, pressure, temperature, salinity if present):\n") known_cols <-intersect(c("scan", "pressure", "temp", "temperature", "salinity", "conductivity"), names(df))print(summary(df[known_cols], digits =3))cat("\nHead of dataframe:\n")print(head(df)) } else {cat("Could not extract dataframe from decimated_cast.\n") } } else {cat("decimated_cast was never created before the error.\n") }cat("\n=== END ERROR DEBUG INFO ===\n\n")})
Plot Final Profile
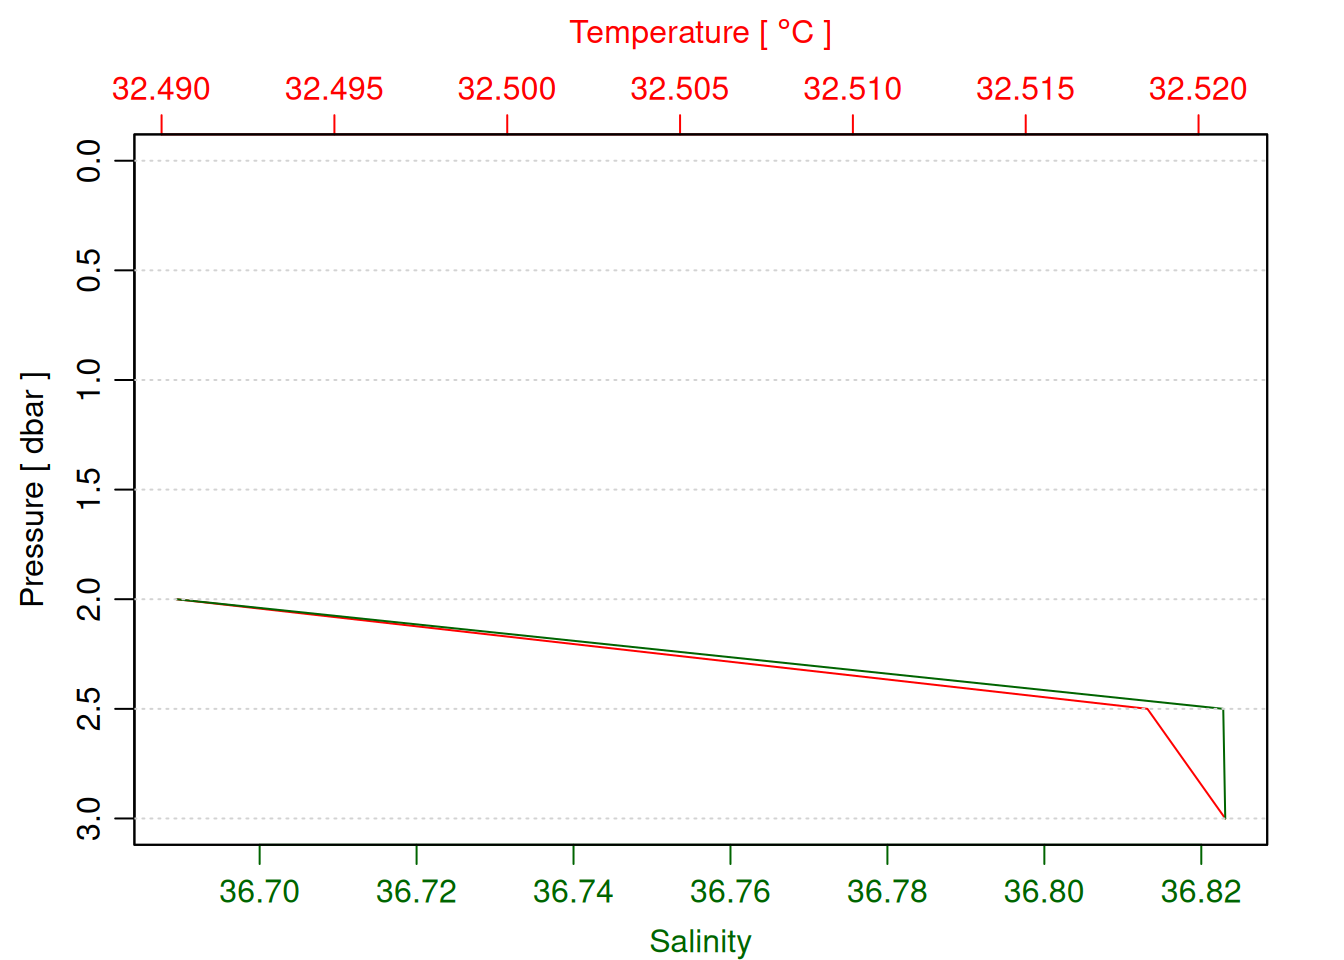
tryCatch({ oce::plotProfile(decimated_cast)# TODO: plot chl & do (prereq handle other_params in ctd_load_from_csv call above)}, error =function(e) {print("decimated cast not found")})