get data across all programs
library("here")
df_all <- read.csv(here("data/exports/allDataRaw.csv"))This website is a collection of research notebooks including data ingestion, quality control, and initial analysis of water quality data ingested from multiple providers in Florida. Section of source code for reproducing these analyses can be expanded, and the full source code (including code for making this website) has been published on GitHub.
For information on specific analytes and data providers, see the analyte reports and provider reports.
Files of unified data produced by these research notebooks can be downloaded here
This work is a product of the University of South Florida Institute for Marine Remote Sensing (IMaRS), funded by the Florida Department of Environmental Protection.
library("here")
df_all <- read.csv(here("data/exports/allDataRaw.csv"))# select subset of reported analytes
source(here("R/dropNonStandardAnalytes.R"))
df <- dropNonStandardAnalytes(df_all)
# drop rows with depth > 1m, keep any with depth==NA or depth==NULL
df <- filter(
df,
is.na(Activity.Depth) | Activity.Depth <= 1)
source(here("R/mutateWINTo2025.R"))
# reduce to only cols we need & save to csv
write.csv(mutateWINTo2025(df), here("data", "exports", "dashboardData.csv"))library(ggplot2)
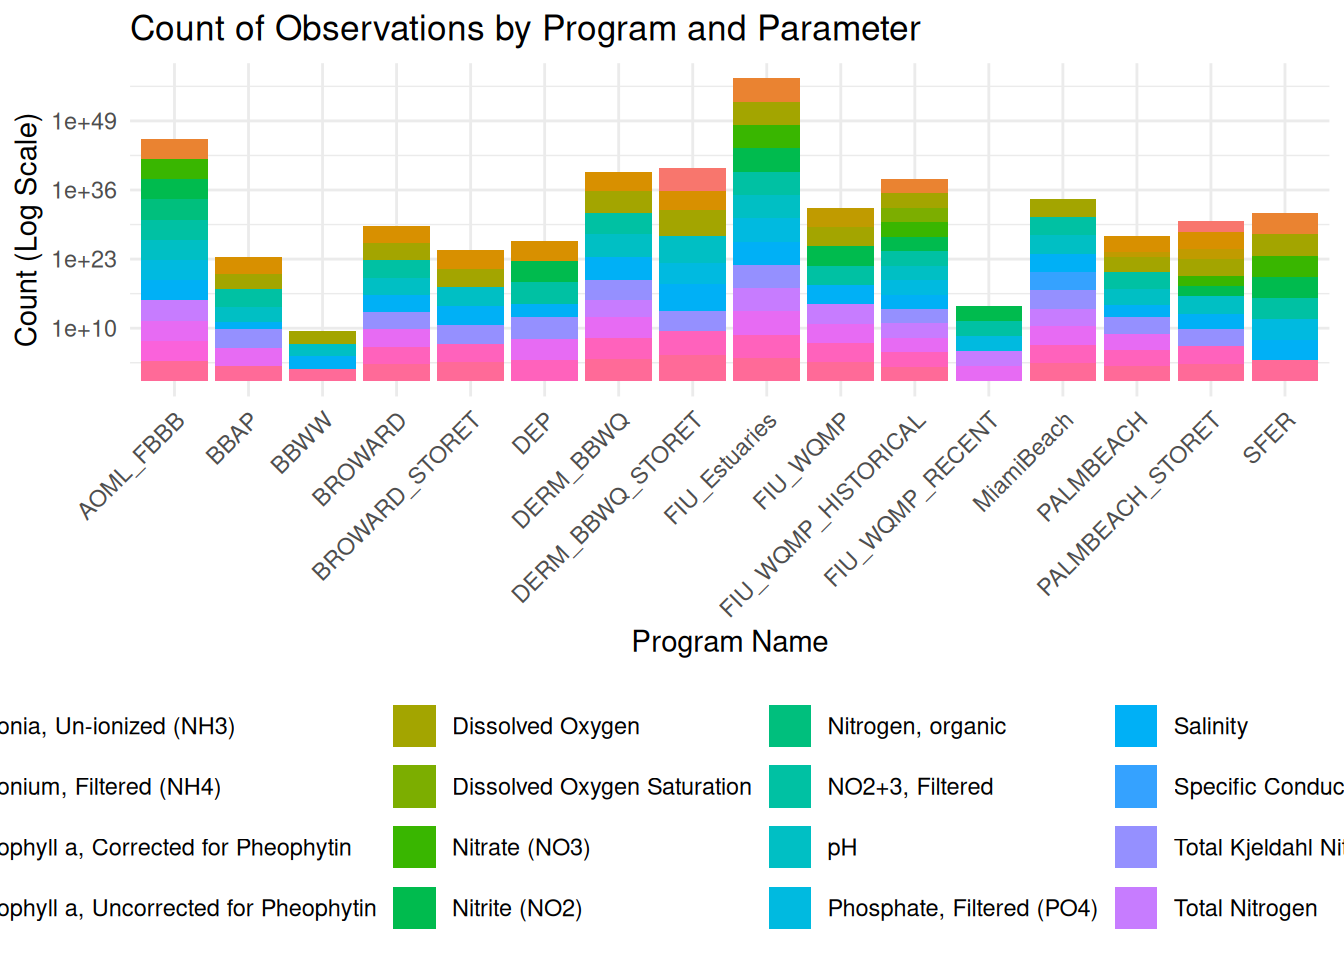
ggplot(df, aes(x = program, fill = DEP.Analyte.Name)) +
geom_bar() +
scale_y_log10() +
labs(
title = "Count of Observations by Program and Parameter",
x = "Program Name",
y = "Count (Log Scale)",
fill = "Parameter"
) +
theme_minimal() +
theme(
legend.position = "bottom",
axis.text.x = element_text(angle = 45, hjust = 1)
)
library(dplyr)
library(knitr)

df %>%
  count(DEP.Analyte.Name, sort = TRUE) %>%
  rename(Count = n) %>%
kable()| DEP.Analyte.Name | Count |
|---|---|
| Water Temperature | 191360 |
| Salinity | 188313 |
| Dissolved Oxygen | 185109 |
| pH | 150832 |
| Turbidity | 84437 |
| NO2+3, Filtered | 66093 |
| Total Phosphorus | 55277 |
| Nitrite (NO2) | 48842 |
| Phosphate, Filtered (PO4) | 48475 |
| Ammonium, Filtered (NH4) | 36157 |
| Total Kjeldahl Nitrogen | 35122 |
| Chlorophyll a, Corrected for Pheophytin | 35108 |
| Nitrate (NO3) | 35019 |
| Total Nitrogen | 33805 |
| Chlorophyll a, Uncorrected for Pheophytin | 29851 |
| Nitrogen, organic | 25554 |
| Ammonia, Un-ionized (NH3) | 20555 |
| Total Suspended Solids | 4300 |
| Specific Conductivity | 2856 |
| Dissolved Oxygen Saturation | 528 |
The following analytes are reported by some programs but not included in the output csv files or other analyses. These may be analytes that are not included in the SEACAR vocabulary or they may not have been properly mapped to the SEACAR vocabulary.
library(dplyr)

# 1. Get the list of analyte names that are in df_all but not in df
diff_analytes <- setdiff(unique(df_all$DEP.Analyte.Name), unique(df$DEP.Analyte.Name))

# 2. Filter df_all for those analytes and create a summary
analyte_programs_summary <- df_all %>%
  filter(DEP.Analyte.Name %in% diff_analytes) %>%
  group_by(DEP.Analyte.Name) %>%
  summarise(Associated.Programs = paste(unique(program), collapse = ", "))

# 3. Print the resulting summary table
DT::datatable(analyte_programs_summary)library(skimr)
skim(df)| Name | df |
| Number of rows | 1277593 |
| Number of columns | 133 |
| _______________________ | |
| Column type frequency: | |
| character | 63 |
| complex | 1 |
| logical | 16 |
| numeric | 53 |
| ________________________ | |
| Group variables | None |
Variable type: character
| skim_variable | n_missing | complete_rate | min | max | empty | n_unique | whitespace |
|---|---|---|---|---|---|---|---|
| keyfield | 1219353 | 0.05 | 24 | 43 | 0 | 5823 | 0 |
| Activity.ID | 996631 | 0.22 | 5 | 36 | 0 | 66138 | 0 |
| time | 1219353 | 0.05 | 5 | 5 | 0 | 1422 | 0 |
| Activity.Start.Date.Time | 20 | 1.00 | 10 | 10 | 0 | 4123 | 0 |
| Monitoring.Location.ID | 20 | 1.00 | 1 | 25 | 0 | 2011 | 0 |
| station_type | 1219373 | 0.05 | 1 | 1 | 0 | 2 | 0 |
| depth_class | 1219373 | 0.05 | 6 | 7 | 0 | 2 | 0 |
| depth_order | 1219373 | 0.05 | 4 | 4 | 0 | 2 | 0 |
| notes | 1277543 | 0.00 | 17 | 75 | 0 | 5 | 0 |
| DEP.Analyte.Name | 0 | 1.00 | 2 | 41 | 0 | 20 | 0 |
| Habitat | 1023193 | 0.20 | 12 | 21 | 0 | 3 | 0 |
| IndicatorName | 1253642 | 0.02 | 9 | 13 | 0 | 3 | 0 |
| ManagedAreaName | 1253642 | 0.02 | 29 | 38 | 0 | 2 | 0 |
| Activity.Type | 1046234 | 0.18 | 5 | 15 | 0 | 4 | 0 |
| RelativeDepth | 1181166 | 0.08 | 0 | 7 | 528 | 3 | 0 |
| DetectionUnit | 1275427 | 0.00 | 4 | 4 | 0 | 1 | 0 |
| Value.Qualifier | 848035 | 0.34 | 0 | 4 | 156863 | 90 | 0 |
| Result.Comments | 1047094 | 0.18 | 0 | 874 | 207346 | 689 | 0 |
| SEACAR_QAQCFlagCode | 1253642 | 0.02 | 2 | 13 | 0 | 26 | 0 |
| SEACAR_QAQC_Description | 1253642 | 0.02 | 31 | 195 | 0 | 26 | 0 |
| ExportVersion | 1253642 | 0.02 | 23 | 23 | 0 | 3 | 0 |
| Region | 1204069 | 0.06 | 2 | 19 | 0 | 22 | 0 |
| DEP.Result.Unit | 62260 | 0.95 | 0 | 10 | 14858 | 21 | 0 |
| program | 0 | 1.00 | 3 | 19 | 0 | 16 | 0 |
| ProgramName | 1253642 | 0.02 | 25 | 36 | 0 | 2 | 0 |
| ParameterName | 1254552 | 0.02 | 2 | 23 | 0 | 10 | 0 |
| ParameterUnits | 1254552 | 0.02 | 3 | 9 | 0 | 6 | 0 |
| ProgramLocationID | 1254552 | 0.02 | 1 | 2 | 0 | 55 | 0 |
| ActivityType | 1254552 | 0.02 | 5 | 6 | 0 | 2 | 0 |
| SampleDate | 1254552 | 0.02 | 23 | 23 | 0 | 2134 | 0 |
| ResultComments | 1275427 | 0.00 | 21 | 21 | 0 | 1 | 0 |
| SEACAR_EventID | 1254552 | 0.02 | 36 | 36 | 0 | 2394 | 0 |
| data_source | 1250109 | 0.02 | 5 | 10 | 0 | 2 | 0 |
| CLIENT.SAMPLE.ID | 1273150 | 0.00 | 1 | 3 | 0 | 70 | 0 |
| MATRIX | 1273150 | 0.00 | 5 | 5 | 0 | 1 | 0 |
| COLLECTED | 1273150 | 0.00 | 10 | 10 | 0 | 23 | 0 |
| ANALYTE | 1273150 | 0.00 | 8 | 27 | 0 | 9 | 0 |
| SAMPLE.RESULT | 1273496 | 0.00 | 3 | 6 | 0 | 1385 | 0 |
| UNITS | 1273150 | 0.00 | 3 | 10 | 0 | 6 | 0 |
| METHOD | 1273150 | 0.00 | 10 | 29 | 0 | 5 | 0 |
| ANALYZED | 1273150 | 0.00 | 10 | 10 | 0 | 104 | 0 |
| PREPARED | 1273150 | 0.00 | 10 | 10 | 0 | 95 | 0 |
| source_file | 1273150 | 0.00 | 19 | 22 | 0 | 23 | 0 |
| SAMPLE.COLLECTION.DATE | 1273150 | 0.00 | 9 | 10 | 0 | 23 | 0 |
| BASIN | 850951 | 0.33 | 2 | 5 | 0 | 7 | 0 |
| CLUSTER | 865207 | 0.32 | 2 | 4 | 0 | 37 | 0 |
| ZSI | 866516 | 0.32 | 2 | 5 | 0 | 25 | 0 |
| ZONE | 1159926 | 0.09 | 3 | 7 | 0 | 10 | 0 |
| Date | 1273573 | 0.00 | 11 | 14 | 0 | 663 | 0 |
| Organization.ID | 562879 | 0.56 | 7 | 16 | 0 | 10 | 0 |
| SEGMENT | 1263337 | 0.01 | 2 | 5 | 0 | 8 | 0 |
| DATE | 1263337 | 0.01 | 10 | 19 | 0 | 260 | 0 |
| SITE | 1263337 | 0.01 | 8 | 28 | 0 | 52 | 0 |
| Sampling.Agency.Name | 566899 | 0.56 | 14 | 58 | 0 | 9 | 0 |
| Org.Latitude..DD.MM.SS.SSSS. | 1047144 | 0.18 | 0 | 11 | 222785 | 22 | 0 |
| Org.Longitude..DD.MM.SS.SSSS. | 1047144 | 0.18 | 0 | 12 | 222785 | 22 | 0 |
| WBID | 1047144 | 0.18 | 0 | 6 | 10428 | 115 | 0 |
| Sample.Collection.Type | 1047144 | 0.18 | 0 | 22 | 42 | 4 | 0 |
| Activity.Depth.Unit | 1047144 | 0.18 | 0 | 2 | 42 | 3 | 0 |
| DEP.Result.Value.Text | 1047144 | 0.18 | 0 | 12 | 230297 | 2 | 0 |
| Sample.Fraction | 1047144 | 0.18 | 0 | 9 | 129643 | 3 | 0 |
| Lab.ID | 1047144 | 0.18 | 0 | 6 | 102313 | 10 | 0 |
| source | 1047144 | 0.18 | 3 | 9 | 0 | 6 | 0 |
Variable type: complex
| skim_variable | n_missing | complete_rate | mean |
|---|---|---|---|
| STATION | 1263337 | 0.01 | 313.52+0.46i |
Variable type: logical
| skim_variable | n_missing | complete_rate | mean | count |
|---|---|---|---|---|
| nisk_start | 1277593 | 0 | NaN | : |
| nisk_end | 1277593 | 0 | NaN | : |
| ValueQualifierSource | 1277593 | 0 | NaN | : |
| ActivityDepth_m | 1277593 | 0 | NaN | : |
| ValueQualifier | 1277593 | 0 | NaN | : |
| SampleFraction | 1277593 | 0 | NaN | : |
| TIME | 1277593 | 0 | NaN | : |
| DETECTION.LIMITS | 1277593 | 0 | NaN | : |
| NO3.DL | 1277593 | 0 | NaN | : |
| DIN.DL | 1277593 | 0 | NaN | : |
| TON.DL | 1277593 | 0 | NaN | : |
| APA.DL | 1277593 | 0 | NaN | : |
| Activity.Top.Depth | 1277593 | 0 | NaN | : |
| Activity.Bottom.Depth | 1277593 | 0 | NaN | : |
| Activity.Depth.Top.Bottom.Unit | 1277593 | 0 | NaN | : |
| Audit.Censored.Decisions | 1277593 | 0 | NaN | : |
Variable type: numeric
| skim_variable | n_missing | complete_rate | mean | sd | p0 | p25 | p50 | p75 | p100 | hist |
|---|---|---|---|---|---|---|---|---|---|---|
| X | 0 | 1.00 | 1.300088e+06 | 816360.41 | 1.000000e+00 | 4.327410e+05 | 1.629405e+06 | 1.965588e+06 | 2.513255e+06 | ▆▂▁▇▅ |
| year | 1219373 | 0.05 | 2.020090e+03 | 2.97 | 2.014000e+03 | 2.018000e+03 | 2.021000e+03 | 2.023000e+03 | 2.024000e+03 | ▅▅▅▇▇ |
| month | 1219353 | 0.05 | 6.610000e+00 | 3.54 | 0.000000e+00 | 3.000000e+00 | 7.000000e+00 | 1.000000e+01 | 1.200000e+01 | ▅▅▇▅▇ |
| day | 1219373 | 0.05 | 1.445000e+01 | 8.62 | 1.000000e+00 | 7.000000e+00 | 1.400000e+01 | 2.200000e+01 | 3.100000e+01 | ▇▆▆▆▃ |
| lat_deg | 1219373 | 0.05 | 2.509000e+01 | 0.99 | 2.400000e+01 | 2.400000e+01 | 2.500000e+01 | 2.500000e+01 | 2.800000e+01 | ▅▇▂▂▁ |
| lat_min | 1219373 | 0.05 | 3.033000e+01 | 15.94 | 3.000000e-02 | 2.041000e+01 | 3.309000e+01 | 4.261000e+01 | 5.983000e+01 | ▆▅▇▇▅ |
| Org.Decimal.Latitude | 488728 | 0.62 | 2.557000e+01 | 0.54 | 2.440000e+01 | 2.518000e+01 | 2.555000e+01 | 2.587000e+01 | 2.878000e+01 | ▅▇▂▁▁ |
| lon_deg | 1219373 | 0.05 | -8.113000e+01 | 0.82 | -8.500000e+01 | -8.200000e+01 | -8.100000e+01 | -8.100000e+01 | -8.000000e+01 | ▁▁▃▇▃ |
| lon_min | 1219373 | 0.05 | 2.643000e+01 | 17.03 | 0.000000e+00 | 1.214000e+01 | 2.253000e+01 | 4.296000e+01 | 6.000000e+01 | ▇▇▅▃▅ |
| Org.Decimal.Longitude | 488728 | 0.62 | -8.082000e+01 | 0.65 | -8.502000e+01 | -8.130000e+01 | -8.072000e+01 | -8.024000e+01 | -8.002000e+01 | ▁▁▁▅▇ |
| Activity.Depth | 945466 | 0.26 | 4.100000e-01 | 0.27 | 0.000000e+00 | 1.000000e-01 | 5.000000e-01 | 5.000000e-01 | 1.000000e+00 | ▅▁▇▂▁ |
| cast | 1219373 | 0.05 | 5.900000e-01 | 0.50 | 0.000000e+00 | 0.000000e+00 | 1.000000e+00 | 1.000000e+00 | 2.000000e+00 | ▆▁▇▁▁ |
| DEP.Result.Value.Number | 44119 | 0.97 | 1.113000e+01 | 454.36 | -3.000000e-02 | 1.000000e-01 | 1.000000e+00 | 4.800000e+00 | 5.346500e+04 | ▇▁▁▁▁ |
| RowID | 1254552 | 0.02 | 1.009723e+06 | 798651.12 | 4.862170e+05 | 5.143680e+05 | 5.349680e+05 | 1.551534e+06 | 3.870318e+06 | ▇▂▁▁▁ |
| ProgramID | 0 | 1.00 | 2.720790e+03 | 2444.79 | 3.000000e+00 | 5.090000e+02 | 4.018000e+03 | 4.018000e+03 | 1.001300e+04 | ▇▁▇▁▁ |
| IndicatorID | 1253642 | 0.02 | 6.730000e+00 | 0.63 | 6.000000e+00 | 6.000000e+00 | 7.000000e+00 | 7.000000e+00 | 8.000000e+00 | ▆▁▇▁▂ |
| ParameterID | 1253642 | 0.02 | 8.600000e+00 | 6.56 | 1.000000e+00 | 3.000000e+00 | 6.000000e+00 | 1.600000e+01 | 1.900000e+01 | ▇▃▁▂▅ |
| AreaID | 1253642 | 0.02 | 6.090000e+00 | 0.89 | 6.000000e+00 | 6.000000e+00 | 6.000000e+00 | 6.000000e+00 | 1.500000e+01 | ▇▁▁▁▁ |
| Year | 502984 | 0.61 | 2.009100e+03 | 9.68 | 1.989480e+03 | 2.000950e+03 | 2.006640e+03 | 2.020000e+03 | 2.024000e+03 | ▂▆▅▁▇ |
| Month | 502964 | 0.61 | 6.550000e+00 | 3.44 | 0.000000e+00 | 4.000000e+00 | 7.000000e+00 | 1.000000e+01 | 1.200000e+01 | ▅▅▇▅▇ |
| TotalDepth_m | 1277530 | 0.00 | 6.222000e+01 | 105.84 | 1.100000e+00 | 2.100000e+00 | 2.850000e+00 | 8.500000e+00 | 2.500000e+02 | ▇▁▁▁▂ |
| MDL | 1149433 | 0.10 | 7.000000e-02 | 0.60 | 0.000000e+00 | 0.000000e+00 | 3.000000e-02 | 8.000000e-02 | 5.050000e+01 | ▇▁▁▁▁ |
| PQL | 1149433 | 0.10 | 2.100000e-01 | 2.92 | 0.000000e+00 | 1.000000e-02 | 6.000000e-02 | 2.500000e-01 | 2.500000e+02 | ▇▁▁▁▁ |
| Include | 1253642 | 0.02 | 1.000000e+00 | 0.03 | 0.000000e+00 | 1.000000e+00 | 1.000000e+00 | 1.000000e+00 | 1.000000e+00 | ▁▁▁▁▇ |
| MADup | 1253642 | 0.02 | 1.000000e+00 | 0.00 | 1.000000e+00 | 1.000000e+00 | 1.000000e+00 | 1.000000e+00 | 1.000000e+00 | ▁▁▇▁▁ |
| ResultValue | 1254552 | 0.02 | 1.286000e+01 | 41.22 | 0.000000e+00 | 2.900000e-01 | 4.890000e+00 | 2.447000e+01 | 5.389000e+03 | ▇▁▁▁▁ |
| OriginalLatitude | 1254552 | 0.02 | 2.580000e+01 | 0.02 | 2.577000e+01 | 2.578000e+01 | 2.579000e+01 | 2.581000e+01 | 2.587000e+01 | ▆▇▂▁▂ |
| OriginalLongitude | 1254552 | 0.02 | -8.015000e+01 | 0.01 | -8.017000e+01 | -8.016000e+01 | -8.015000e+01 | -8.013000e+01 | -8.012000e+01 | ▇▆▅▅▇ |
| LAB.SAMPLE.ID | 1273150 | 0.00 | 3.588884e+10 | 22277401.92 | 3.585419e+10 | 3.586685e+10 | 3.588708e+10 | 3.590707e+10 | 3.592746e+10 | ▇▆▆▆▇ |
| REPORTING.LIMIT | 1275618 | 0.00 | 1.890000e+00 | 2.96 | 0.000000e+00 | 3.000000e-02 | 5.000000e-02 | 5.000000e-01 | 7.000000e+00 | ▇▁▁▁▂ |
| DILUTION | 1273150 | 0.00 | 1.000000e+00 | 0.00 | 1.000000e+00 | 1.000000e+00 | 1.000000e+00 | 1.000000e+00 | 1.000000e+00 | ▁▁▇▁▁ |
| DEP.Result.ID | 996633 | 0.22 | 8.856591e+06 | 5455584.81 | 1.180000e+02 | 5.815863e+06 | 9.447332e+06 | 1.355247e+07 | 1.787779e+07 | ▆▇▇▆▇ |
| SURV | 850951 | 0.33 | 1.192000e+02 | 54.92 | -8.000000e+00 | 7.600000e+01 | 1.230000e+02 | 1.650000e+02 | 2.110000e+02 | ▂▆▇▇▇ |
| STA | 865207 | 0.32 | 1.423400e+02 | 163.89 | 1.000000e+00 | 2.800000e+01 | 6.200000e+01 | 1.330000e+02 | 4.790000e+02 | ▇▂▁▁▂ |
| YEAR | 865207 | 0.32 | 2.001260e+03 | 4.50 | 1.989480e+03 | 1.997790e+03 | 2.001560e+03 | 2.005030e+03 | 2.008730e+03 | ▁▅▇▇▇ |
| NOX.DL | 865207 | 0.32 | 0.000000e+00 | 0.00 | 0.000000e+00 | 0.000000e+00 | 0.000000e+00 | 0.000000e+00 | 0.000000e+00 | ▇▃▆▁▁ |
| NO2.DL | 865207 | 0.32 | 0.000000e+00 | 0.00 | 0.000000e+00 | 0.000000e+00 | 0.000000e+00 | 0.000000e+00 | 0.000000e+00 | ▆▇▁▁▁ |
| NH4.DL | 865207 | 0.32 | 0.000000e+00 | 0.00 | 0.000000e+00 | 0.000000e+00 | 0.000000e+00 | 0.000000e+00 | 1.000000e-02 | ▇▁▁▁▂ |
| TN.DL | 865207 | 0.32 | 3.000000e-02 | 0.03 | 0.000000e+00 | 0.000000e+00 | 3.000000e-02 | 5.000000e-02 | 8.000000e-02 | ▇▃▁▆▂ |
| TP.DL | 865207 | 0.32 | 0.000000e+00 | 0.00 | 0.000000e+00 | 0.000000e+00 | 0.000000e+00 | 0.000000e+00 | 0.000000e+00 | ▇▁▁▁▁ |
| SRP.DL | 865207 | 0.32 | 0.000000e+00 | 0.00 | 0.000000e+00 | 0.000000e+00 | 0.000000e+00 | 0.000000e+00 | 0.000000e+00 | ▇▂▁▅▅ |
| CHLA.DL | 865207 | 0.32 | 1.000000e-01 | 0.00 | 1.000000e-01 | 1.000000e-01 | 1.000000e-01 | 1.000000e-01 | 1.000000e-01 | ▁▁▇▁▁ |
| TOC.DL | 865207 | 0.32 | 1.200000e-01 | 0.04 | 5.000000e-02 | 1.200000e-01 | 1.200000e-01 | 1.600000e-01 | 1.600000e-01 | ▅▁▁▇▆ |
| SiO2.DL | 865207 | 0.32 | 0.000000e+00 | 0.00 | 0.000000e+00 | 0.000000e+00 | 0.000000e+00 | 0.000000e+00 | 1.000000e-02 | ▇▁▁▁▁ |
| Station | 1273573 | 0.00 | 2.894200e+02 | 80.47 | 2.000000e+02 | 2.310000e+02 | 2.700000e+02 | 3.140000e+02 | 5.090000e+02 | ▇▇▁▁▂ |
| LATDEC | 1263337 | 0.01 | 2.470000e+01 | 0.14 | 2.455000e+01 | 2.462000e+01 | 2.466000e+01 | 2.477000e+01 | 2.548000e+01 | ▇▃▁▁▁ |
| LONDEC | 1263337 | 0.01 | -8.147000e+01 | 0.39 | -8.259000e+01 | -8.172000e+01 | -8.163000e+01 | -8.134000e+01 | -8.012000e+01 | ▁▇▃▂▁ |
| DEPTH | 1264309 | 0.01 | 9.700000e-01 | 0.11 | 0.000000e+00 | 1.000000e+00 | 1.000000e+00 | 1.000000e+00 | 1.000000e+00 | ▁▁▁▁▇ |
| Long.Deg | 1227990 | 0.04 | -7.559000e+01 | 26.43 | -8.100000e+01 | -8.000000e+01 | -8.000000e+01 | -8.000000e+01 | 8.000000e+01 | ▇▁▁▁▁ |
| Long.Min | 1227990 | 0.04 | 3.488000e+01 | 16.19 | 0.000000e+00 | 1.956000e+01 | 3.748000e+01 | 4.761000e+01 | 6.575000e+01 | ▃▅▅▇▃ |
| Lat.Deg | 1227990 | 0.04 | 2.479000e+01 | 0.40 | 2.400000e+01 | 2.500000e+01 | 2.500000e+01 | 2.500000e+01 | 2.500000e+01 | ▂▁▁▁▇ |
| Lat.Min | 1227990 | 0.04 | 2.159000e+01 | 21.51 | 0.000000e+00 | 4.030000e+00 | 9.020000e+00 | 3.970000e+01 | 6.000000e+01 | ▇▁▂▁▃ |
| Value.1 | 843173 | 0.34 | 1.250000e+01 | 63.97 | -7.730000e+01 | 3.160000e+00 | 7.810000e+00 | 2.418000e+01 | 4.136100e+04 | ▇▁▁▁▁ |
If you have visualization ideas for this data, please open a github issue here.