A summary of which sites meet quality assessment checks to be included in the final map.
(code) import libraries, functions, & data
if (! requireNamespace ("librarian" , quietly = TRUE )) {# If not installed, install the package install.packages ("librarian" ):: shelf (source ("R/getData.R" )<- getData ()
show unique providers
<- unique (data$ Source)print (unique_sources)
 [1] "AOML"                  "DERM"                  "BROWARD"
 [4] "DEP"                   "FIU"                   "21FLWQA"
 [7] "BBAP"                  "Miami Beach"           "Miami Beach  Outfalls"
[10] "Miami Beach Re-Sample" "BBWW"                  "Palm Beach"
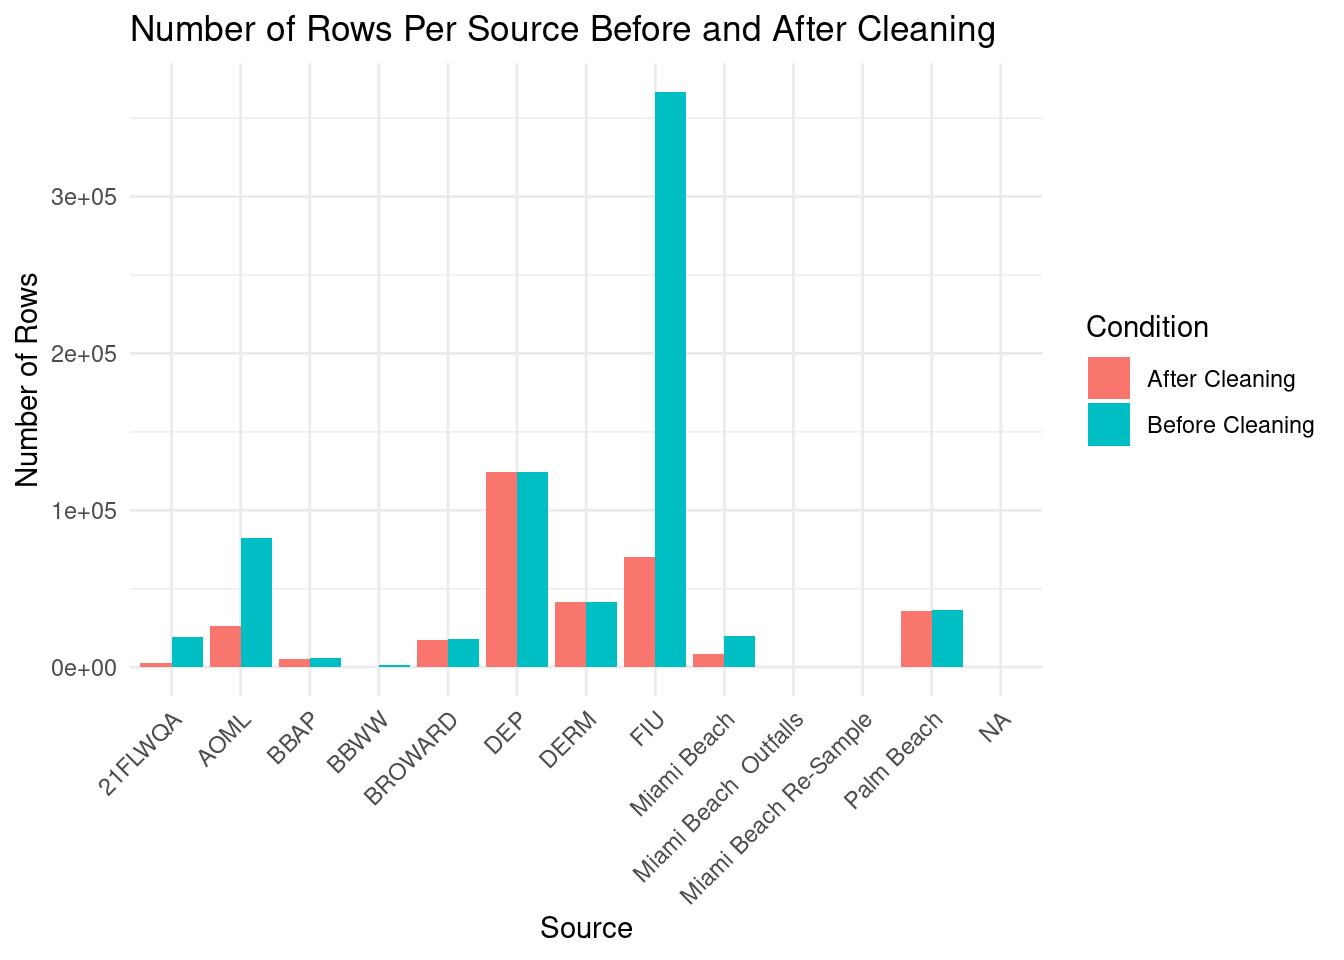
show % of clean data per site
# Count for raw dataframe <- getRawData () %>% group_by (Source) %>% summarise (Count = n (), .groups = 'drop' ) %>% mutate (Condition = "Before Cleaning" )
New names:
• `` -> `...1`
Warning: There was 1 warning in `dplyr::mutate()`.
ℹ In argument: `Value = as.numeric(Value)`.
Caused by warning:
! NAs introduced by coercion
show % of clean data per site
# Count for cleaned dataframe <- getData () %>% group_by (Source) %>% summarise (Count = n (), .groups = 'drop' ) %>% mutate (Condition = "After Cleaning" )<- bind_rows (raw_counts, cleaned_counts)ggplot (combined_counts, aes (x = Source, y = Count, fill = Condition)) + geom_bar (stat = "identity" , position = "dodge" ) + labs (title = "Number of Rows Per Source Before and After Cleaning" ,x = "Source" ,y = "Number of Rows" ,fill = "Condition" ) + theme_minimal () + theme (axis.text.x = element_text (angle = 45 , hjust = 1 )) # Rotate x-axis labels for better readability