Code
if (!requireNamespace("librarian", quietly = TRUE)) {
  # If not installed, install the package
  install.packages("librarian")
}

librarian::shelf(
  dplyr,
  glue,
  ggplot2,
  here,
  skimr,
)

source(here("R/getData.R"))if (!requireNamespace("librarian", quietly = TRUE)) {
# If not installed, install the package
install.packages("librarian")
}
librarian::shelf(
dplyr,
glue,
ggplot2,
here,
skimr,
)
source(here("R/getData.R"))df <- getRawData()New names:
• `` -> `...1`Warning: There was 1 warning in `dplyr::mutate()`.
ℹ In argument: `Value = as.numeric(Value)`.
Caused by warning:
! NAs introduced by coercionprint(skimr::skim(df))── Data Summary ────────────────────────
Values
Name df
Number of rows 715257
Number of columns 16
_______________________
Column type frequency:
character 7
numeric 9
________________________
Group variables None
── Variable type: character ────────────────────────────────────────────────────
skim_variable n_missing complete_rate min max empty n_unique whitespace
1 Source 94 1.00 3 21 0 12 0
2 Site 0 1 1 28 0 2510 0
3 Parameter 0 1 6 24 0 12 0
4 Units 968 0.999 2 9 0 12 0
5 verbatimValue 138417 0.806 0 11 2381 96304 0
6 VerbatimLatitude 19208 0.973 2 11 0 15175 0
7 verbatimLongitude 19248 0.973 3 12 0 10580 0
── Variable type: numeric ──────────────────────────────────────────────────────
skim_variable n_missing complete_rate mean sd p0 p25
1 ...1 0 1 357629 206477. 1 178815
2 Latitude 19208 0.973 25.4 0.827 23.7 24.7
3 Longitude 19248 0.973 -81.0 0.815 -85.7 -81.5
4 Month 114 1.00 6.56 3.42 1 4
5 Day 1614 0.998 14.1 8.23 1 7
6 Year 114 1.00 2012. 8.90 1995 2004
7 Value 322096 0.550 0.660 4.49 -80.5 0.008
8 Sample Depth 22214 0.969 3.57 12.2 0 0.5
9 Total Depth 343781 0.519 9.01 9.49 0 3
p50 p75 p100 hist
1 357629 536443 715257 ▇▇▇▇▇
2 25.2 25.9 30.8 ▇▇▂▁▁
3 -80.9 -80.2 -79.8 ▁▁▁▆▇
4 7 10 12 ▇▅▆▅▇
5 13 20 31 ▇▇▆▅▃
6 2015 2021 2024 ▃▃▃▃▇
7 0.0990 0.382 1626 ▇▁▁▁▁
8 0.5 3.5 2494 ▇▁▁▁▁
9 6 11.2 121. ▇▁▁▁▁site_histogram <- function(df){
number_of_unique_sites <- df %>% summarise(unique_sites = dplyr::n_distinct(Site))
site_counts <- df %>%
group_by(Site) %>%
summarise(Count = n())
ggplot(site_counts, aes(x = Count)) +
geom_histogram(binwidth = 1, fill = "blue", color = "black") +
labs(title = glue("Histogram of Rows Per Site (total sites: {number_of_unique_sites})"),
x = "Number of Rows",
y = "Number of Sites") +
theme_minimal()
}site_histogram(df)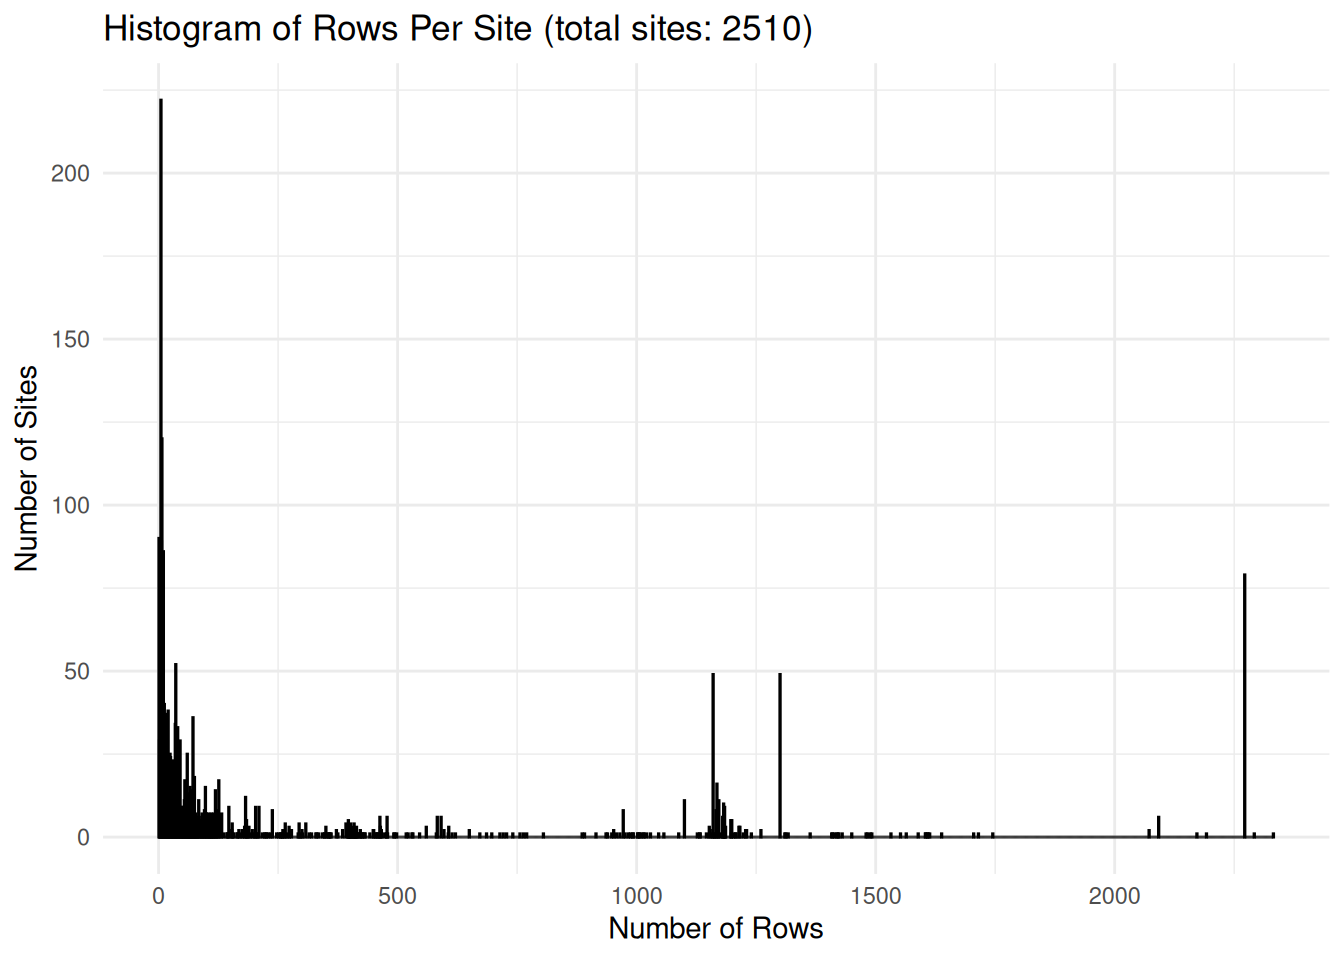
df <- df %>%
  filter(!is.na(Year) & !is.na(Value) & !is.na(Latitude) & !is.na(Longitude))

site_histogram(df)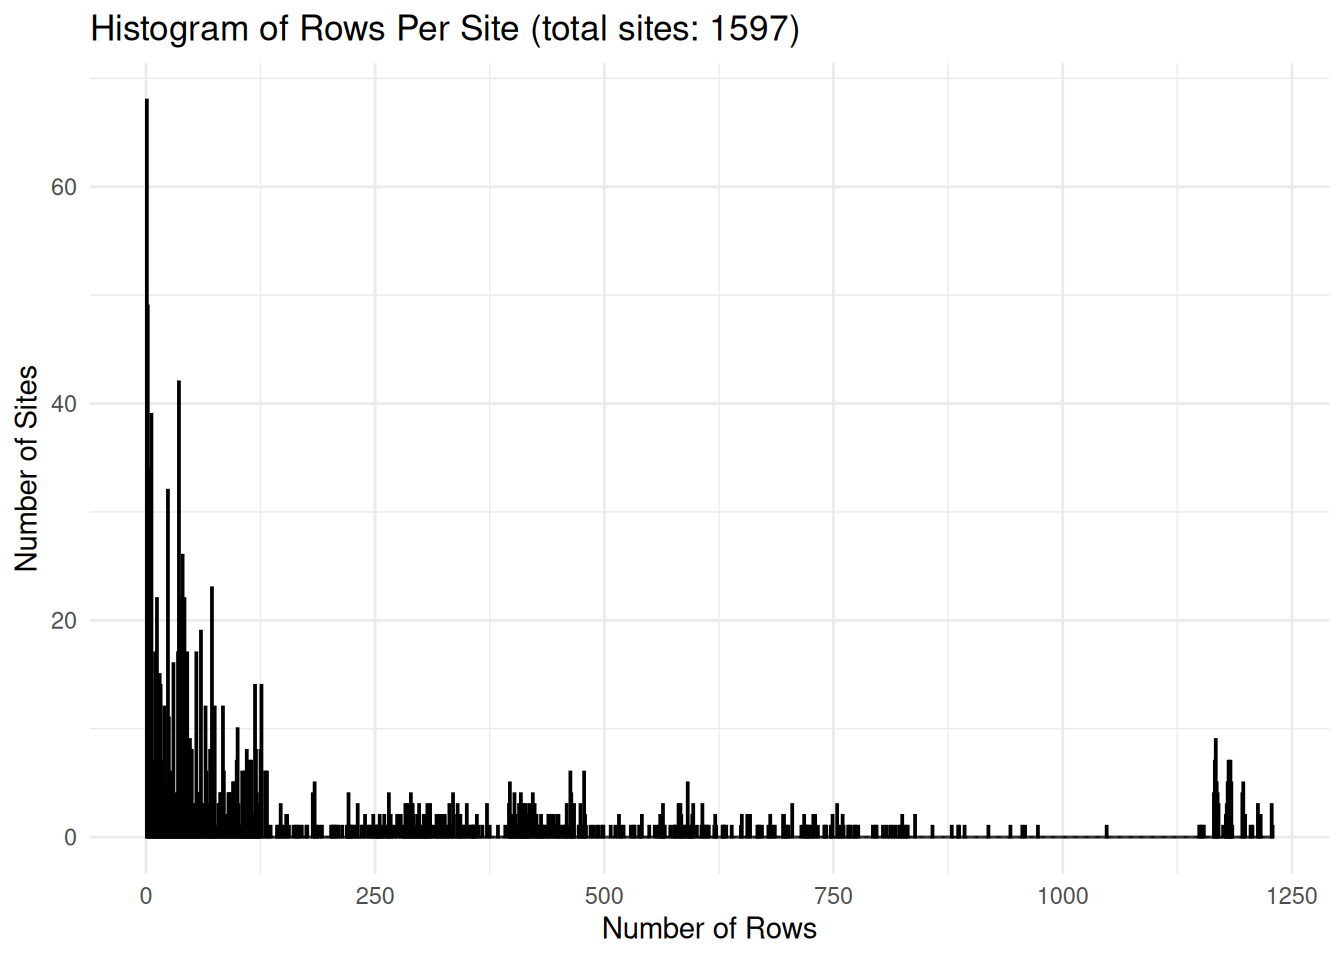
df <- df %>%
  group_by(Site) %>%
  filter(n() >= 20) %>%
  ungroup()  # It's a good practice to ungroup data after operations like this

site_histogram(df)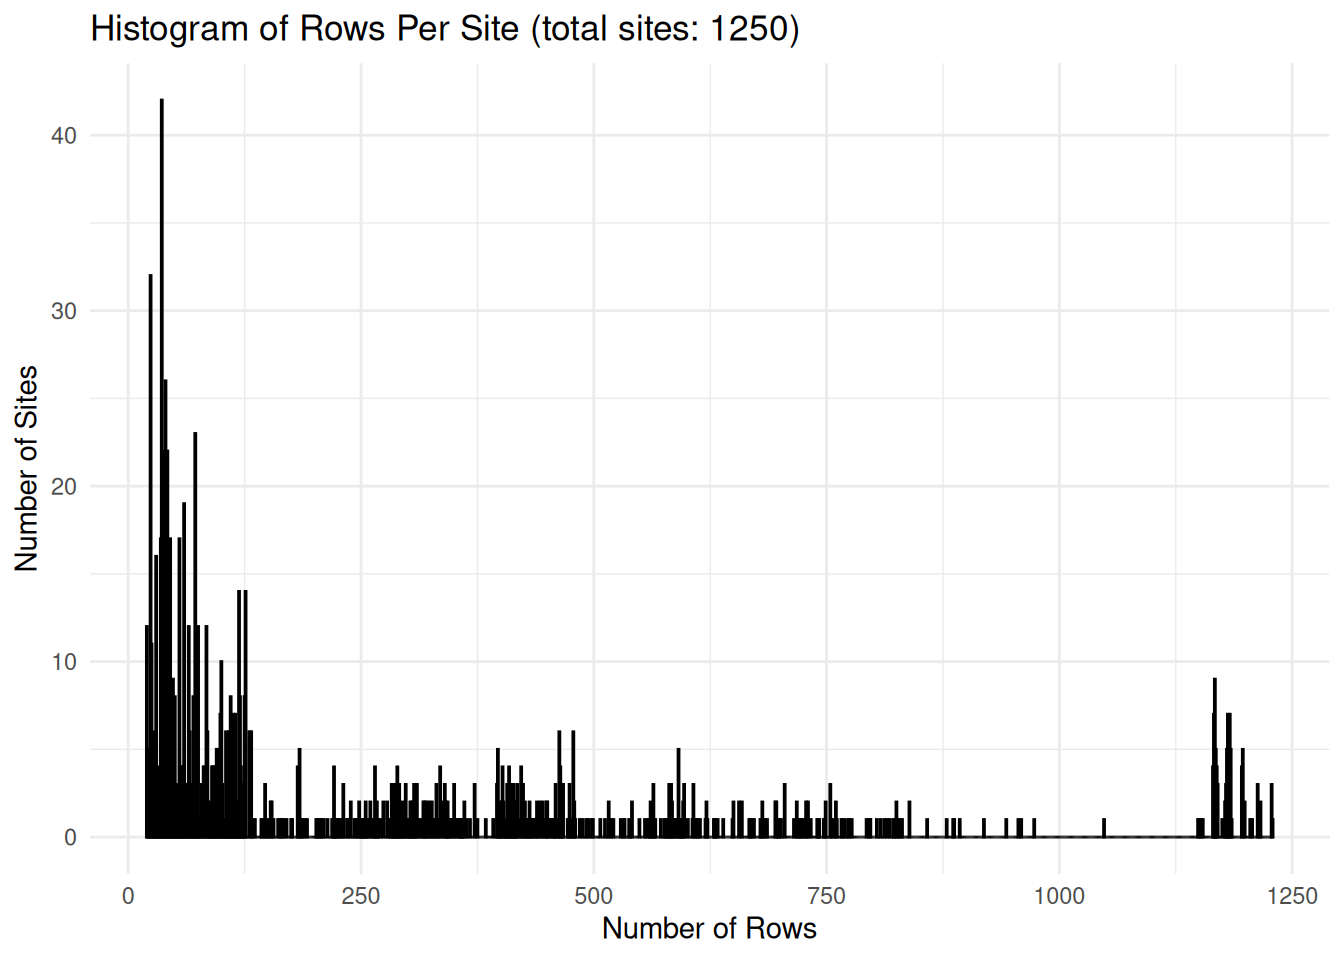
# TODO: should calculate "last two years" from latest date in the data
latest_year <- max(df$Year)

ggplot(df, aes(x = Year)) +
  geom_histogram(binwidth = 1, fill = "blue", color = "black") +
  labs(title = "N Rows per year",
       x = "Year",
       y = "N Rows") +
  theme_minimal()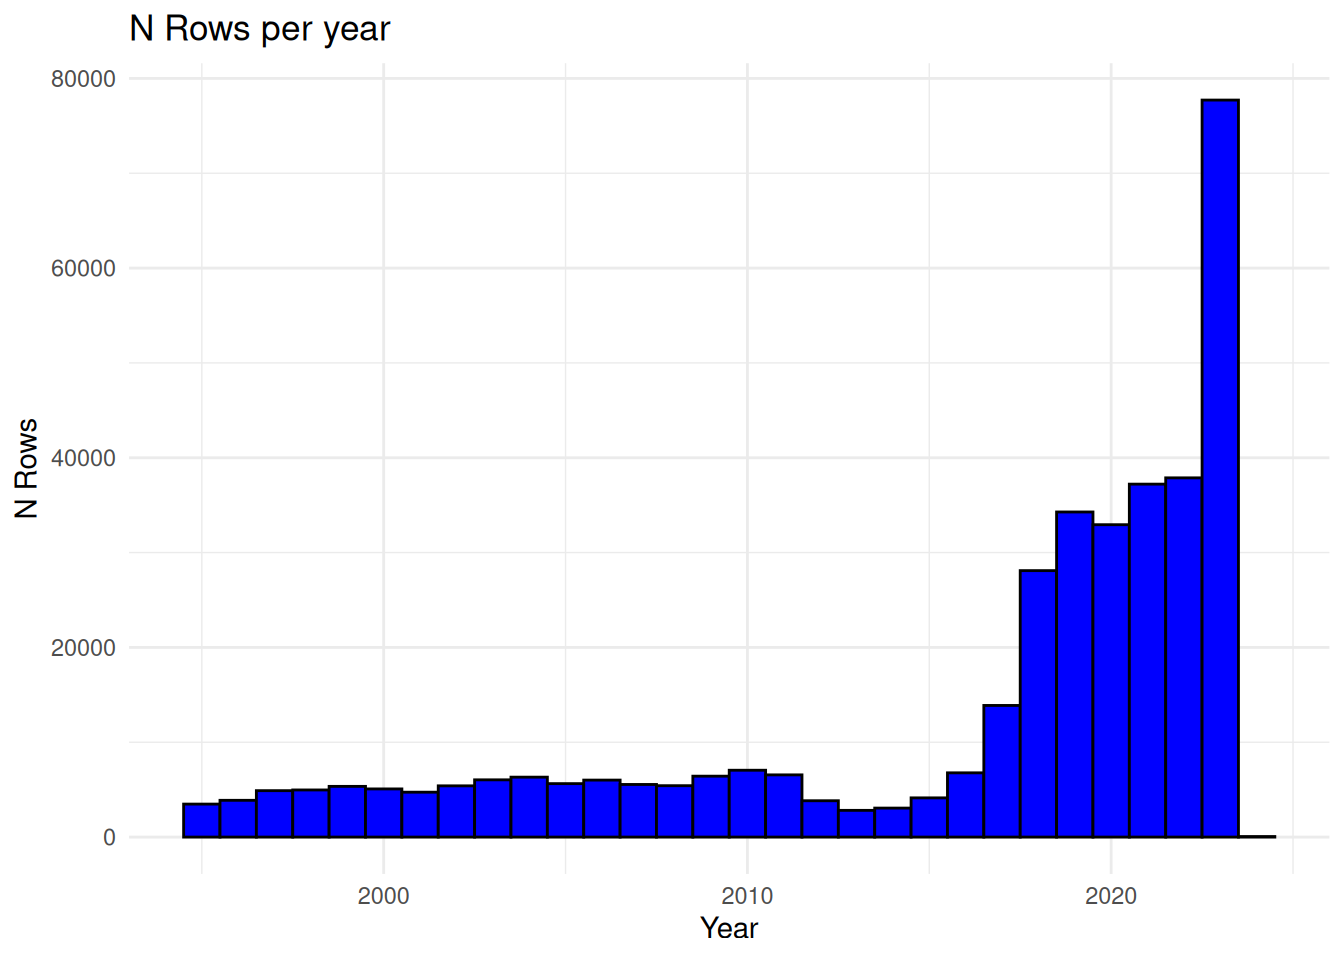
sites_with_recent_data <- df %>%
  filter(Year > latest_year-2) %>%  # Filter for rows with Year greater than 2022
  distinct(Site)           # Get unique sites that meet the criteria

df <- df %>%
  semi_join(sites_with_recent_data, by = "Site")  # Keep rows where 'Site' matches those in the recent data list

site_histogram(df)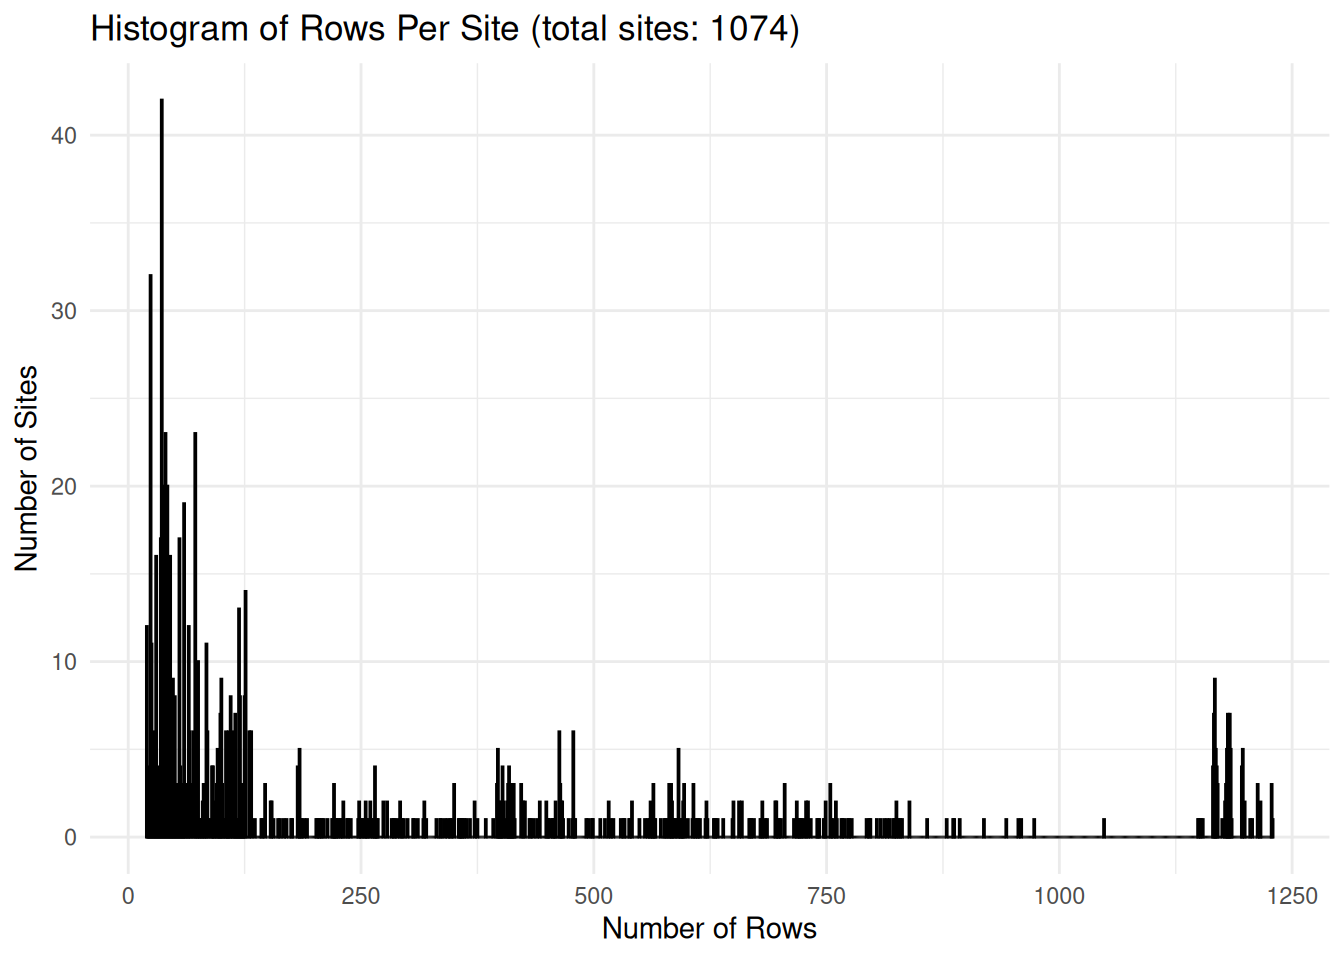
write.csv(df, "data/df_cleaned_01.csv", row.names = FALSE)