(code) import libraries & functions
if (!requireNamespace("librarian", quietly = TRUE)) {
  install.packages("librarian")
}
librarian::shelf(
  ggplot2,
  glue,
  here,
  readxl,
  tidyverse,
  utils
)Comparison of IMaRS QC and SEACAR QC outputs for DEP project
if (!requireNamespace("librarian", quietly = TRUE)) {
install.packages("librarian")
}
librarian::shelf(
ggplot2,
glue,
here,
readxl,
tidyverse,
utils
)# unzip SEACAR files
library(utils)
library(glue)
input_dir <- here("./data/01-SEACAR_raw")
output_dir <- here("./data/02-SEACAR_unzipped")
# Create the output directory if it doesn't exist
if (!dir.exists(output_dir)) {
dir.create(output_dir, recursive = TRUE)
}
# List all .zip files in the input directory
zip_files <- list.files(
input_dir, pattern = "\\.zip$", full.names = TRUE
)
# Loop through each zip file
for (zip_file in zip_files) {
# Get the base name of the zip file
# (without directory and .zip extension)
zip_name <- tools::file_path_sans_ext(basename(zip_file))
cat(glue("unzipping to {output_dir}/{zip_name}/..."))
# Create a subfolder in the output directory
# with the name of the zip file
unzip_dir <- file.path(output_dir, zip_name)
if (!dir.exists(unzip_dir)) {
dir.create(unzip_dir)
}
# Unzip the file into the created subfolder
unzip(zip_file, exdir = unzip_dir)
cat("done.\n")
}unzipping to /home/tylar/repos/dep-wq-data-report/./data/02-SEACAR_unzipped/AOML/...done.# Load SEACAR file
seacar_data <- read_delim(
here("./data/02-SEACAR_unzipped/AOML/Discrete\ WQ\ -\ 3.txt"),
delim="|"
)Rows: 22456 Columns: 36
── Column specification ────────────────────────────────────────────────────────
Delimiter: "|"
chr (22): ProgramName, Habitat, IndicatorName, ParameterName, ParameterUnit...
dbl (12): RowID, ProgramID, IndicatorID, ParameterID, AreaID, ResultValue, ...
dttm (2): SampleDate, ExportVersion
ℹ Use `spec()` to retrieve the full column specification for this data.
ℹ Specify the column types or set `show_col_types = FALSE` to quiet this message.# Load IMaRS-processed data & align to SEACAR columns
imars_data <- read_csv(
"./data/df_cleaned.csv"
) %>%
filter(Source == "AOML") %>%
mutate(
ParameterName = Parameter,
OriginalLatitude = Latitude,
OriginalLongitude = Longitude,
ProgramLocationID = Site,
ResultValue = verbatimValue,
SampleDate = glue(
"{Year}-{sprintf('%02d', Month)}-{sprintf('%02d', Day)}"
)
)Rows: 331523 Columns: 17
── Column specification ────────────────────────────────────────────────────────
Delimiter: ","
chr (4): Source, Site, Parameter, Units
dbl (13): ...1, Latitude, Longitude, Month, Day, Year, Value, Sample Depth, ...
ℹ Use `spec()` to retrieve the full column specification for this data.
ℹ Specify the column types or set `show_col_types = FALSE` to quiet this message.ParameterName values malignmentParameterName columns have different values for same data. Some columns appear to not exist in both.
print("=== IMaRS ==========================")[1] "=== IMaRS =========================="print(unique(imars_data$ParameterName))[1] "Chlorophyll a" "Ammonium (N)" "Nitrate-Nitrite (N)"
[4] "Nitrite (N)" "Nitrate (N)" "Orthophosphate (P)"
[7] "Silica" print("=== SEACAR ==========================")[1] "=== SEACAR =========================="print(unique(seacar_data$ParameterName)) [1] "Water Temperature"
[2] "Light Extinction Coefficient"
[3] "NO2+3, Filtered"
[4] "Colored Dissolved Organic Matter"
[5] "Chlorophyll a, Uncorrected for Pheophytin"
[6] "Phosphate, Filtered (PO4)"
[7] "Total Suspended Solids"
[8] "Ammonium, Filtered (NH4)"
[9] "pH"
[10] "Salinity" A mapping of names manually creating using AOML data is below:
| IMaRS Name | SEACAR name |
|---|---|
| Ammonium (N) | Ammonium, Filtered (NH4) |
| Chlorophyll a | Chlorophyll a, Uncorrected for Pheophytin |
| - | Colored Dissolved Organic Matter |
| - | Light Extinction Coefficient |
| Nitrate (N) | - |
| Nitrate-Nitrite (N) | NO2+3, Filtered |
| Nitrite (N) | - |
| Orthophosphate (P) | |
| - | pH |
| - | Phosphate, Filtered (PO4) |
| - | Salinity |
| Silica | |
| - | Total Suspended Solids |
| - | Water Temperature |
# Count the number of points for each reporting provider in SEACAR and DEP data
seacar_count <- seacar_data %>%
  group_by(ParameterName) %>%
  summarise(count = n())

imars_count <- imars_data %>%
  group_by(ParameterName) %>%
  summarise(count = n())

# Combine and display the results
comparison_count <- full_join(seacar_count, imars_count, by = "ParameterName", suffix = c("_SEACAR", "_IMaRS"))
comparison_count
# A tibble: 17 × 3
ParameterName count_SEACAR count_IMaRS
<chr> <int> <int>
1 Ammonium, Filtered (NH4) 3283 NA
2 Chlorophyll a, Uncorrected for Pheophytin 4311 NA
3 Colored Dissolved Organic Matter 572 NA
4 Light Extinction Coefficient 400 NA
5 NO2+3, Filtered 3025 NA
6 Phosphate, Filtered (PO4) 4519 NA
7 Salinity 4813 NA
8 Total Suspended Solids 711 NA
9 Water Temperature 801 NA
10 pH 21 NA
11 Ammonium (N) NA 2311
12 Chlorophyll a NA 9280
13 Nitrate (N) NA 2303
14 Nitrate-Nitrite (N) NA 1536
15 Nitrite (N) NA 1968
16 Orthophosphate (P) NA 2649
17 Silica NA 6262# Select relevant nutrient columns from SEACAR and DEP datasets
# Plot distributions side by side for SEACAR and IMaRS (DEP)
# Combine the datasets with a new column to identify the source
combined_data <- bind_rows(
seacar_data %>%
select(ParameterName, ResultValue) %>%
filter(ParameterName == "Ammonium, Filtered (NH4)") %>%
mutate(Source = "SEACAR"),
imars_data %>%
select(ParameterName, ResultValue) %>%
filter(ParameterName == "Ammonium (N)") %>%
mutate(Source = "IMaRS")
)
# Plot side-by-side distributions with log-scaled x-axis
ggplot(combined_data, aes(x = ResultValue, fill = Source)) +
geom_density(alpha = 0.5) +
labs(title = "Ammonium Distributions: SEACAR vs IMaRS (Log Scale)",
x = "Nutrient Value (Log Scale)",
y = "Density",
fill = "Source") +
scale_x_log10() + # Log scale on the x-axis
theme_minimal()Warning in scale_x_log10(): log-10 transformation introduced infinite values.Warning: Removed 1663 rows containing non-finite outside the scale range
(`stat_density()`).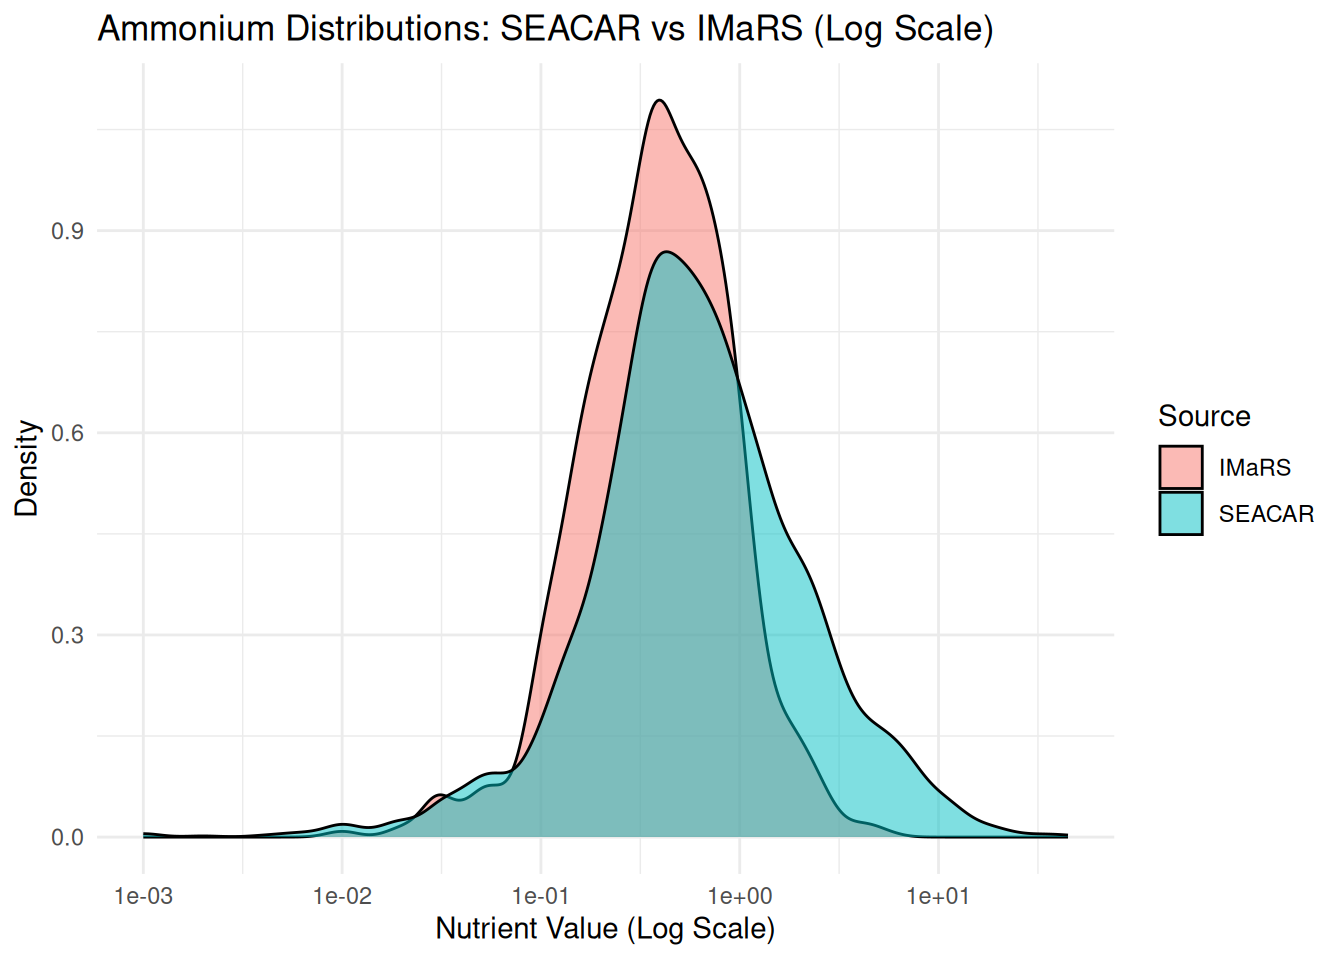
Site IDs in each are radically different:
imars_sites <- sort(unique(imars_data$ProgramLocationID))
seacar_sites <- sort(unique(seacar_data$ProgramLocationID))

print("=== IMaRS ==========================")
[1] "=== IMaRS =========================="print(imars_sites[1:5])[1] "1" "10" "11" "12" "13"print("=== SEACAR ==========================")[1] "=== SEACAR =========================="print(seacar_sites[1:5])[1] "1000B" "1001B" "1002B" "1003B" "1004B"SEACAR data has many more site names
print("=== IMaRS ==========================")[1] "=== IMaRS =========================="print(length(imars_sites))[1] 149print("=== SEACAR ==========================")[1] "=== SEACAR =========================="print(length(seacar_sites))[1] 4519Cannot compare within stations until station number mapping is completed (see above section about station id malignment).