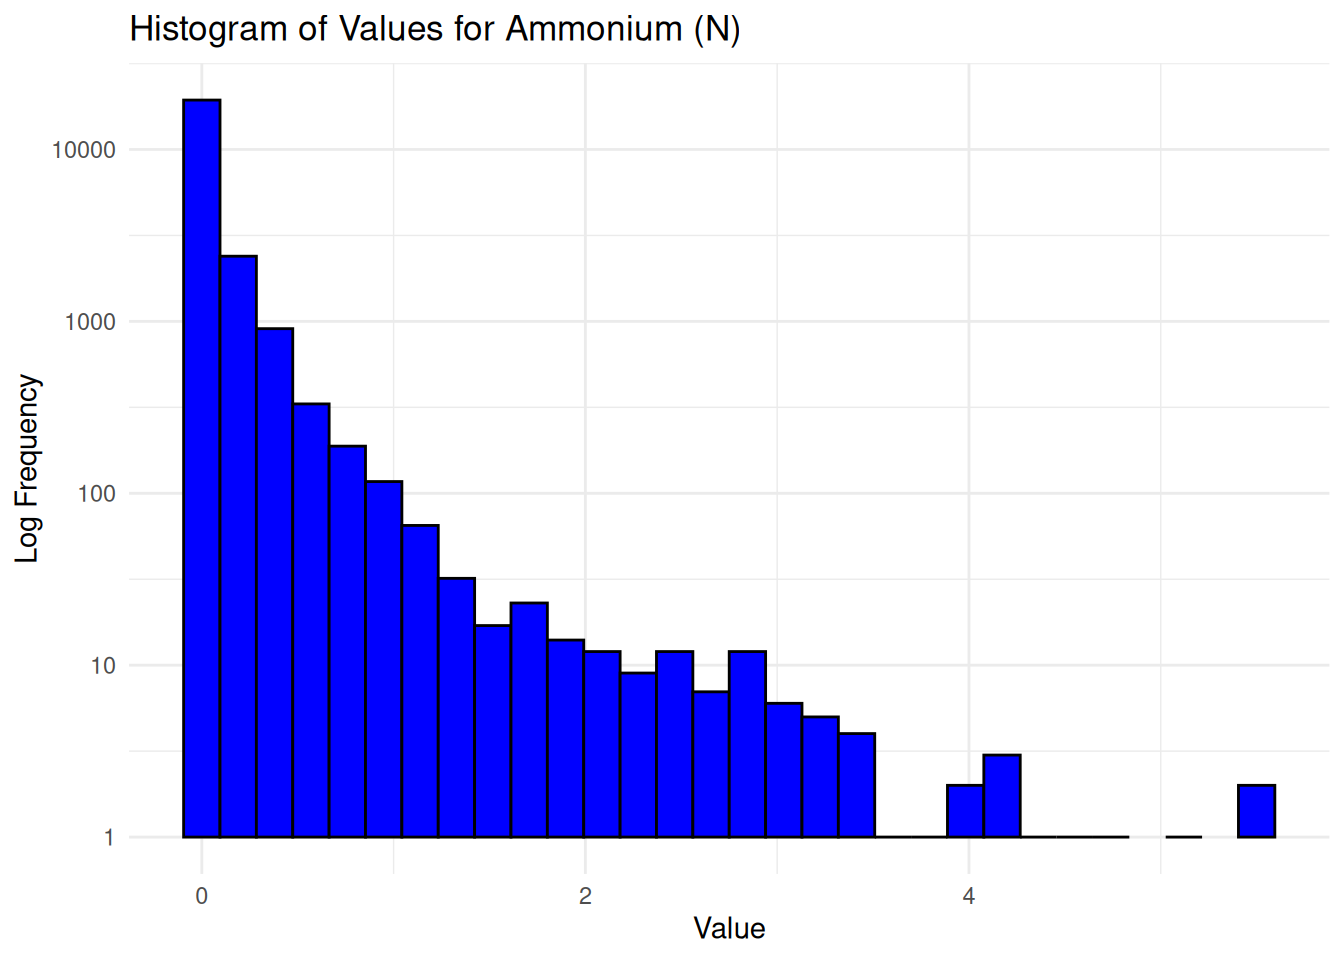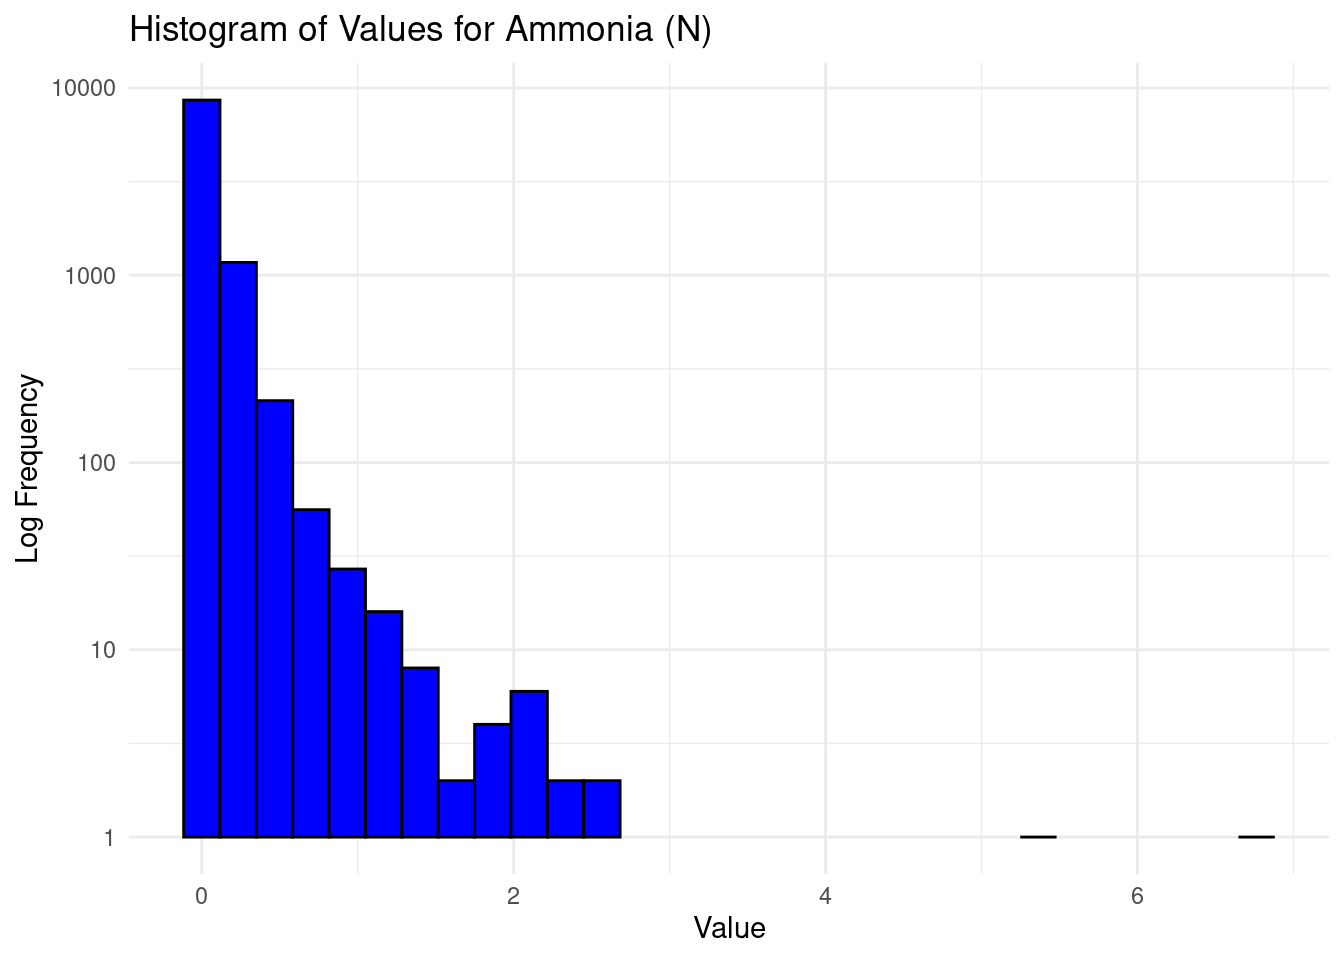
Ammonia (N)
Code
if (!requireNamespace("librarian", quietly = TRUE)) {
# If not installed, install the package
install.packages("librarian")
}
librarian::shelf(
glue,
here,
…if (!requireNamespace("librarian", quietly = TRUE)) {
# If not installed, install the package
install.packages("librarian")
}
librarian::shelf(
glue,
quarto
)
source("R/getData.R")
data <- getData()Using the clean data after completing Sites QC.
Available parameters:
# print unique values in `Parameter` column
unique_parameters <- unique(data$Parameter)
print(unique_parameters)
[1] "Chlorophyll a" "Ammonium (N)"
[3] "Nitrate-Nitrite (N)" "Nitrite (N)"
[5] "Nitrate (N)" "Orthophosphate (P)"
[7] "Silica" "Nitrogen- Total"
[9] "Nitrogen- Total Kjeldahl" "Phosphorus- Total"
[11] "Turbidity" "Ammonia (N)" # # create a violin plot of `Value` grouped by each `Parameter`
# NOTE: this ran for 20min and never finished
# ggplot2::ggplot(df, aes(x=Parameter, y=Value)) +
# geom_violin(trim=FALSE) +
# theme(axis.text.x = element_text(angle = 90, hjust = 1)) +
# labs(title="Violin Plot of Values by Parameter",
# x="Parameter",
# y="Value")
# TODO: print n observations per parameterEach parameter is filtered using the following min+max bounds.
# NOTE: each row should *exactly* match the unique_parameters above
csvPath <- "parameter_bounds.csv"

# Read the CSV data
data <- read.csv(csvPath, stringsAsFactors = FALSE)

# Print the data frame
print(data)
param min max
1 Ammonium (N) 0 6.0
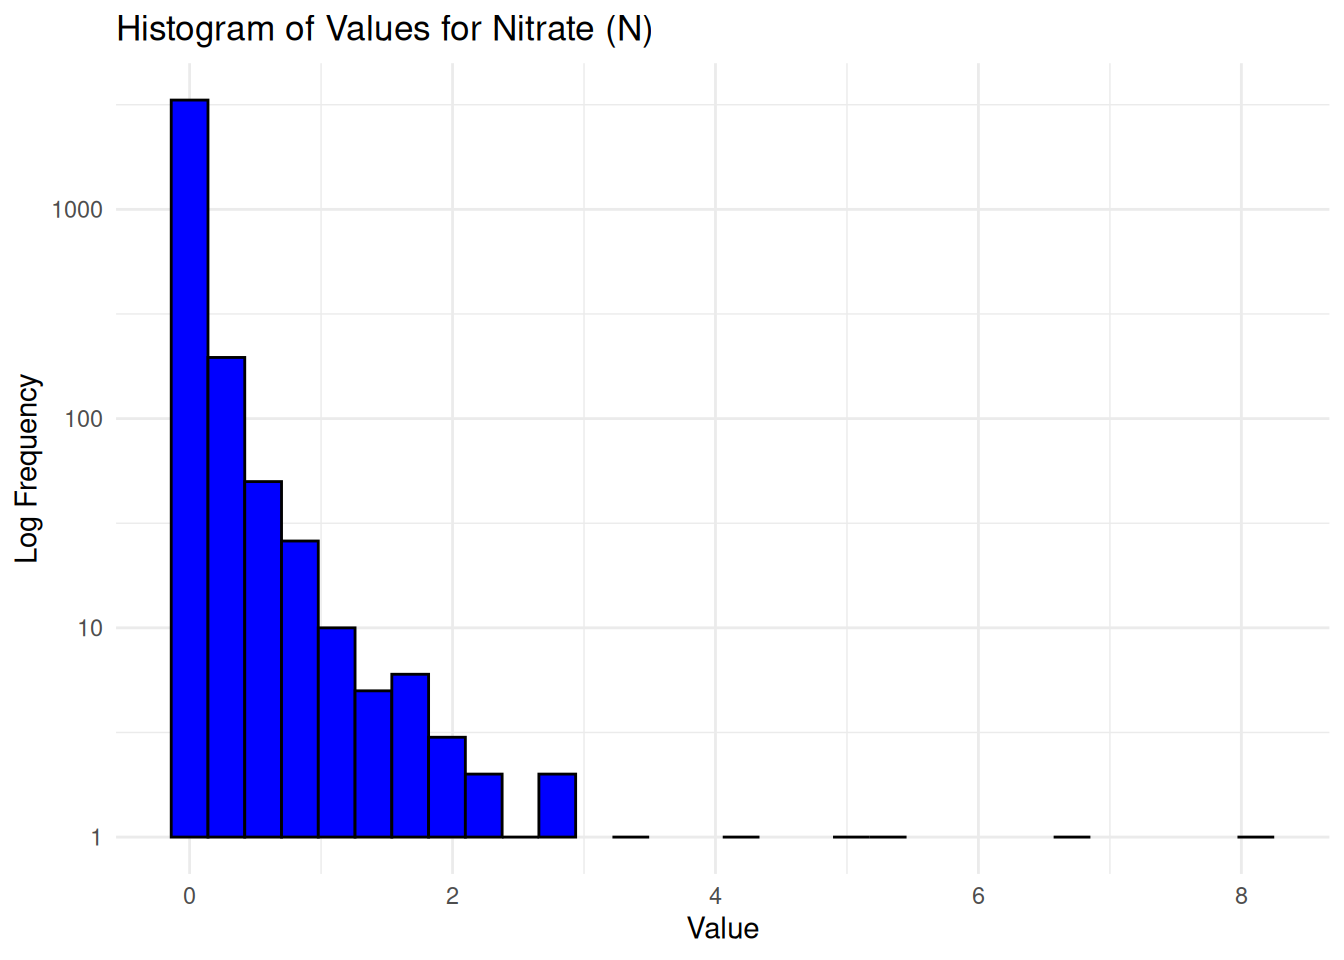
2 Nitrate (N) 0 10.0
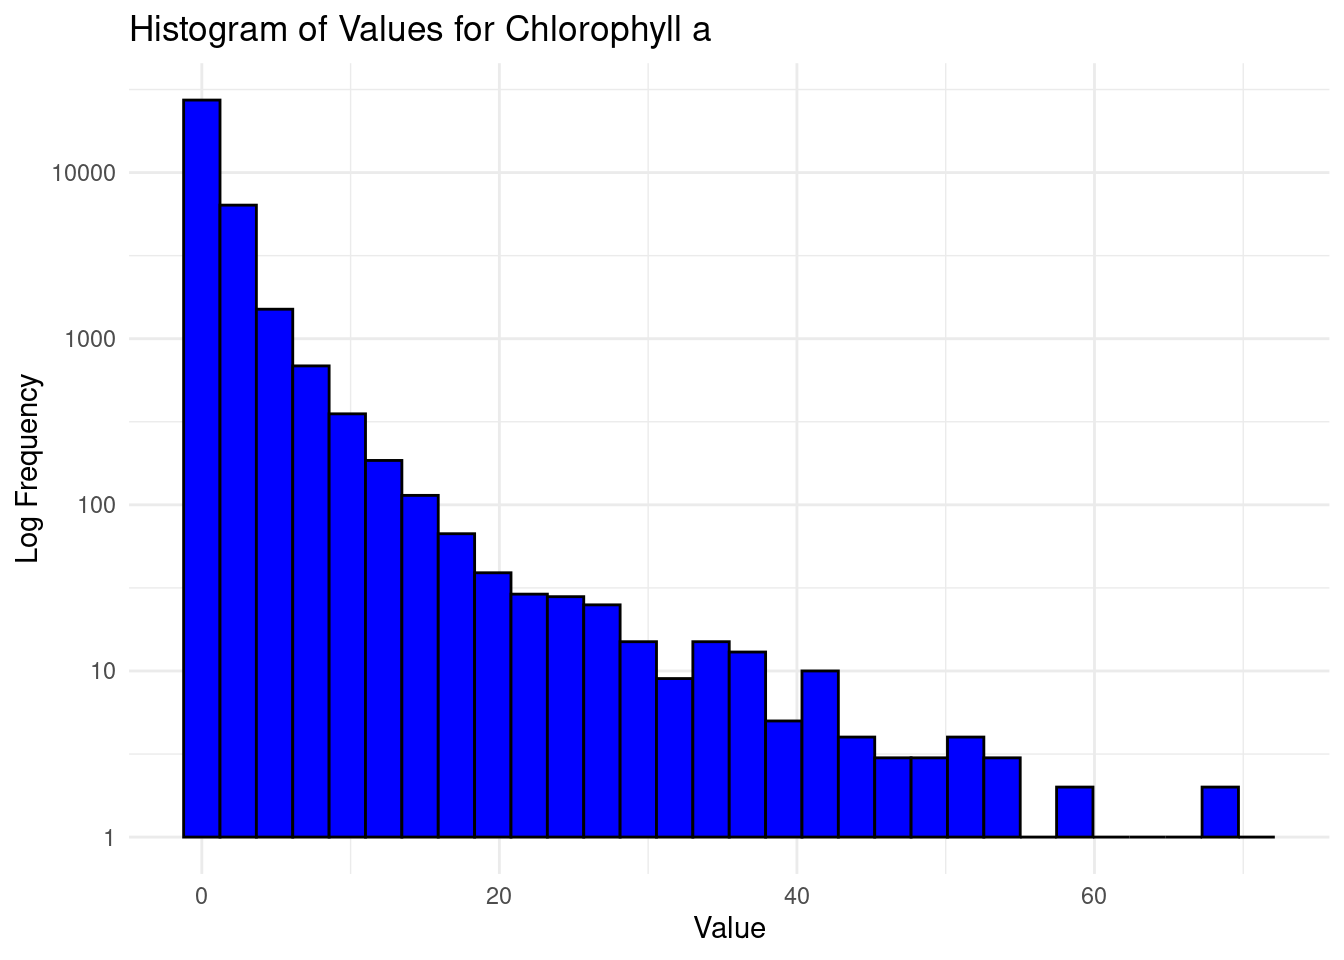
3 Chlorophyll a 0 75.0
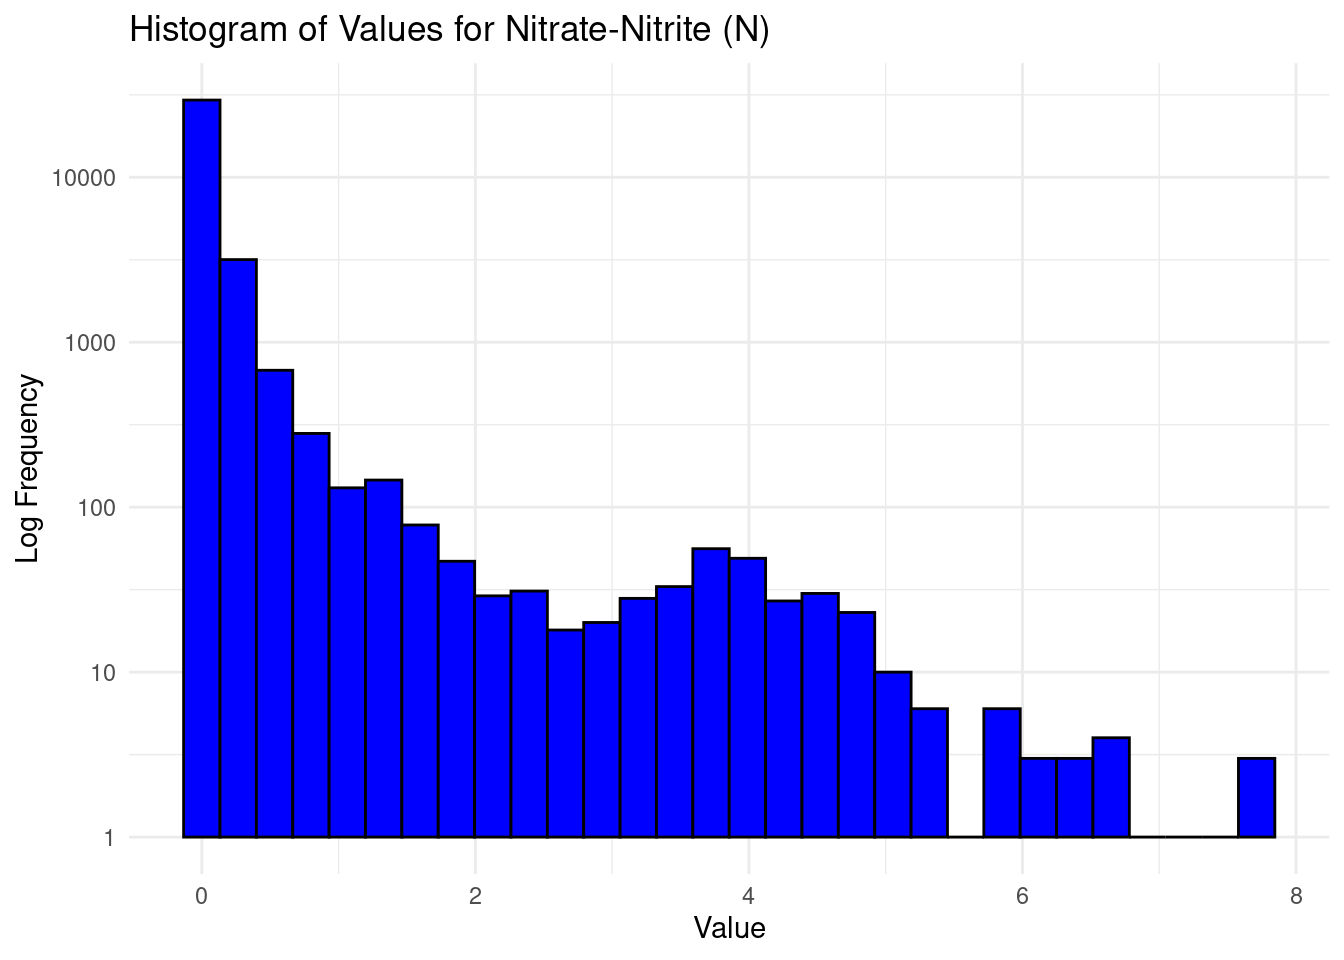
4 Nitrate-Nitrite (N) 0 8.0
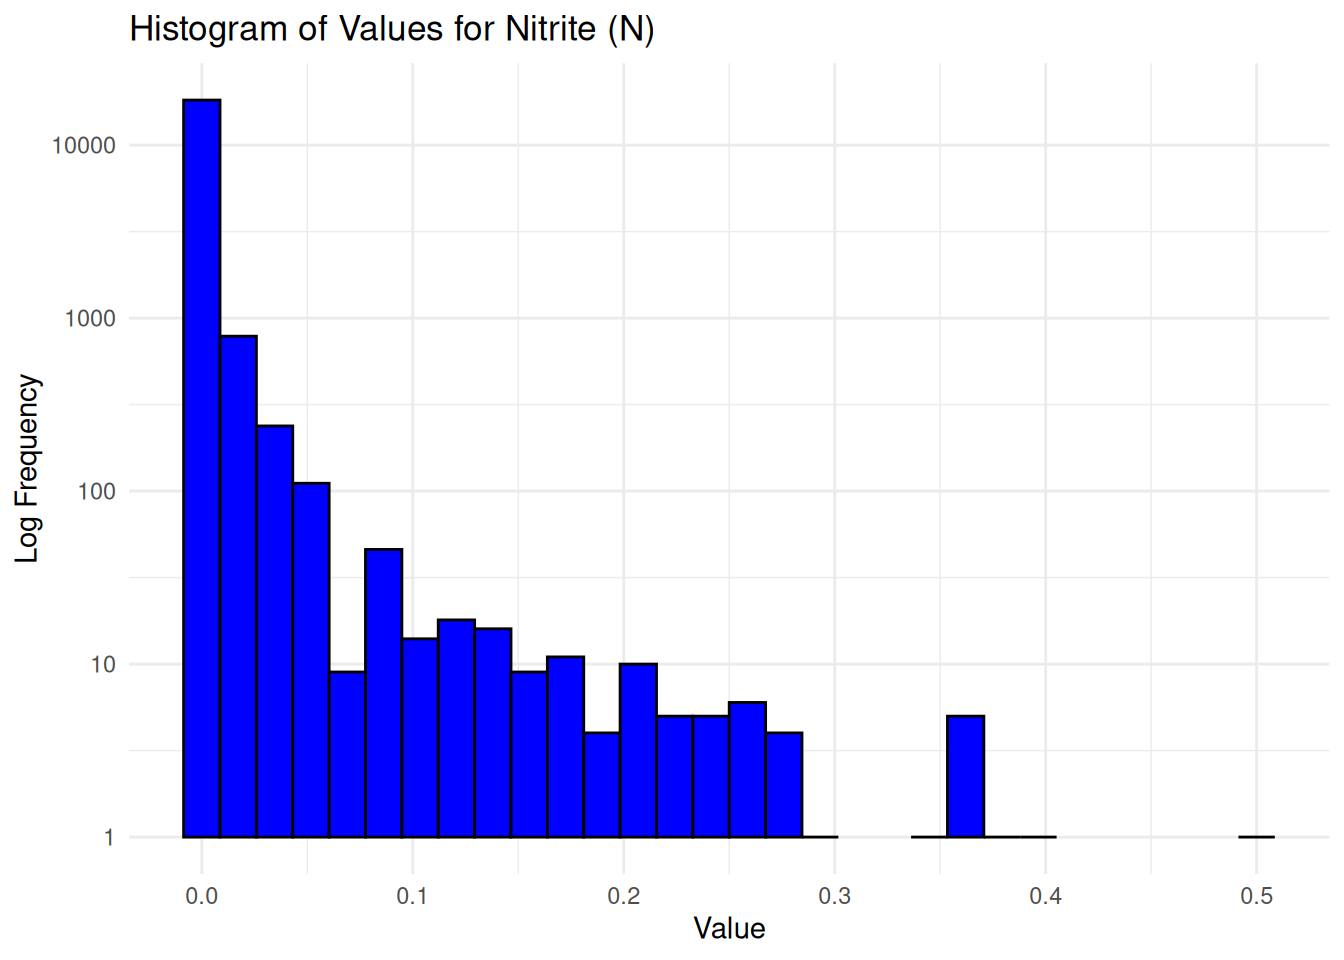
5 Nitrite (N) 0 0.5
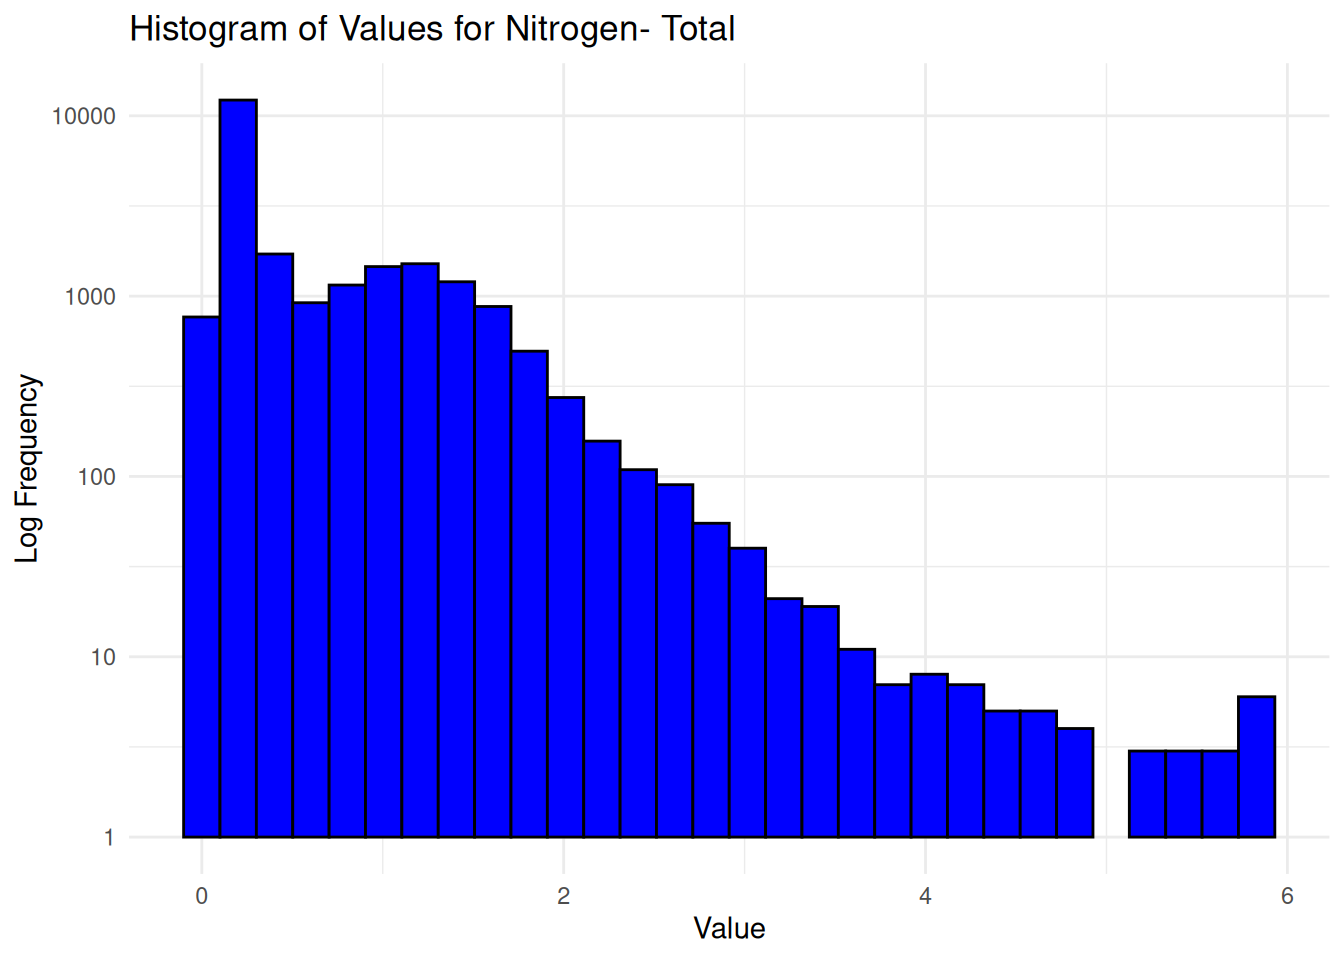
6 Nitrogen- Total 0 6.0
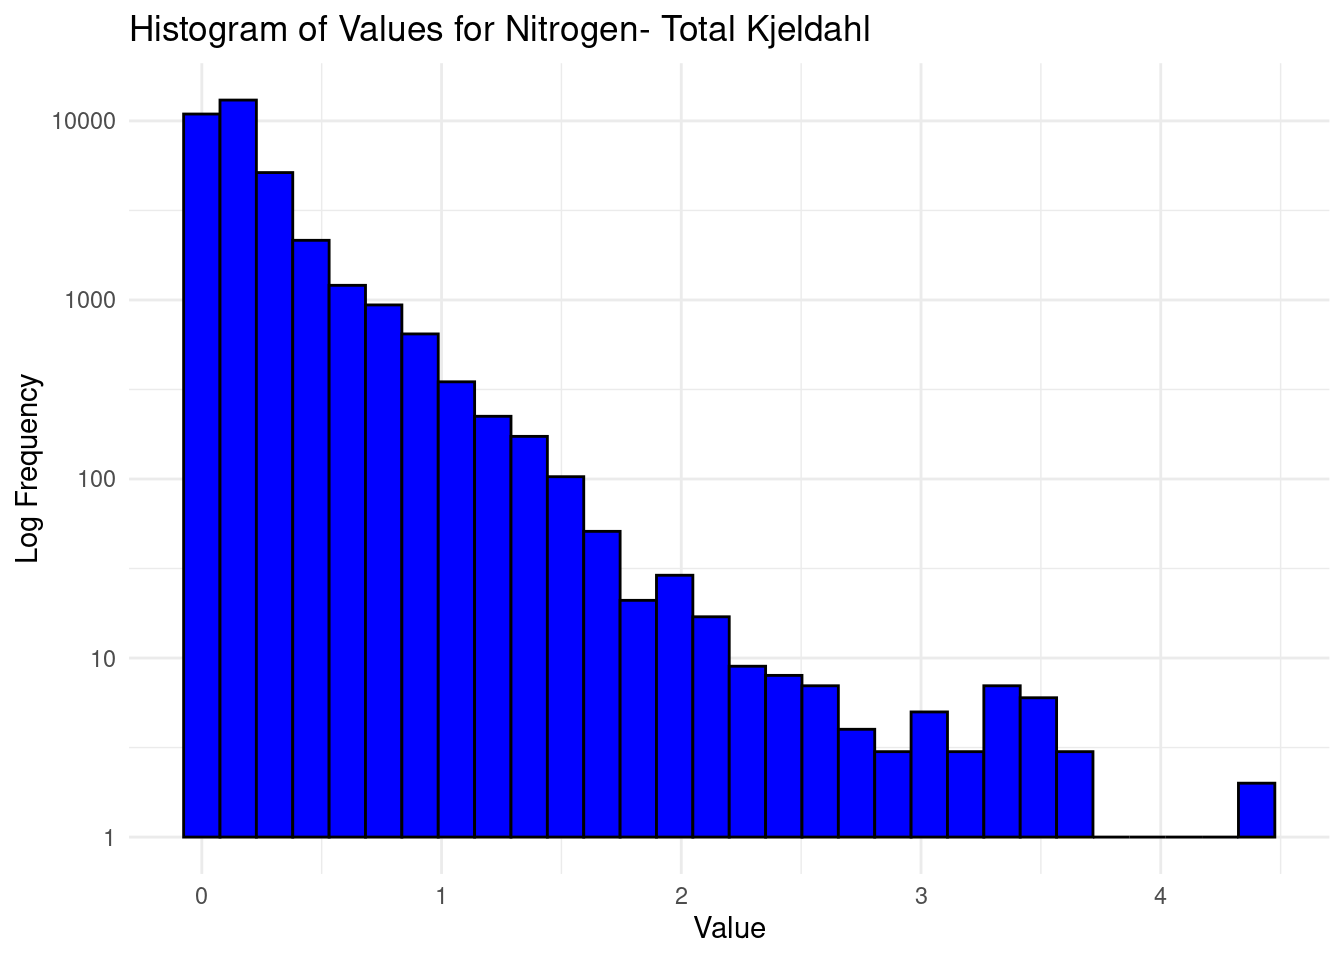
7 Nitrogen- Total Kjeldahl 0 5.0
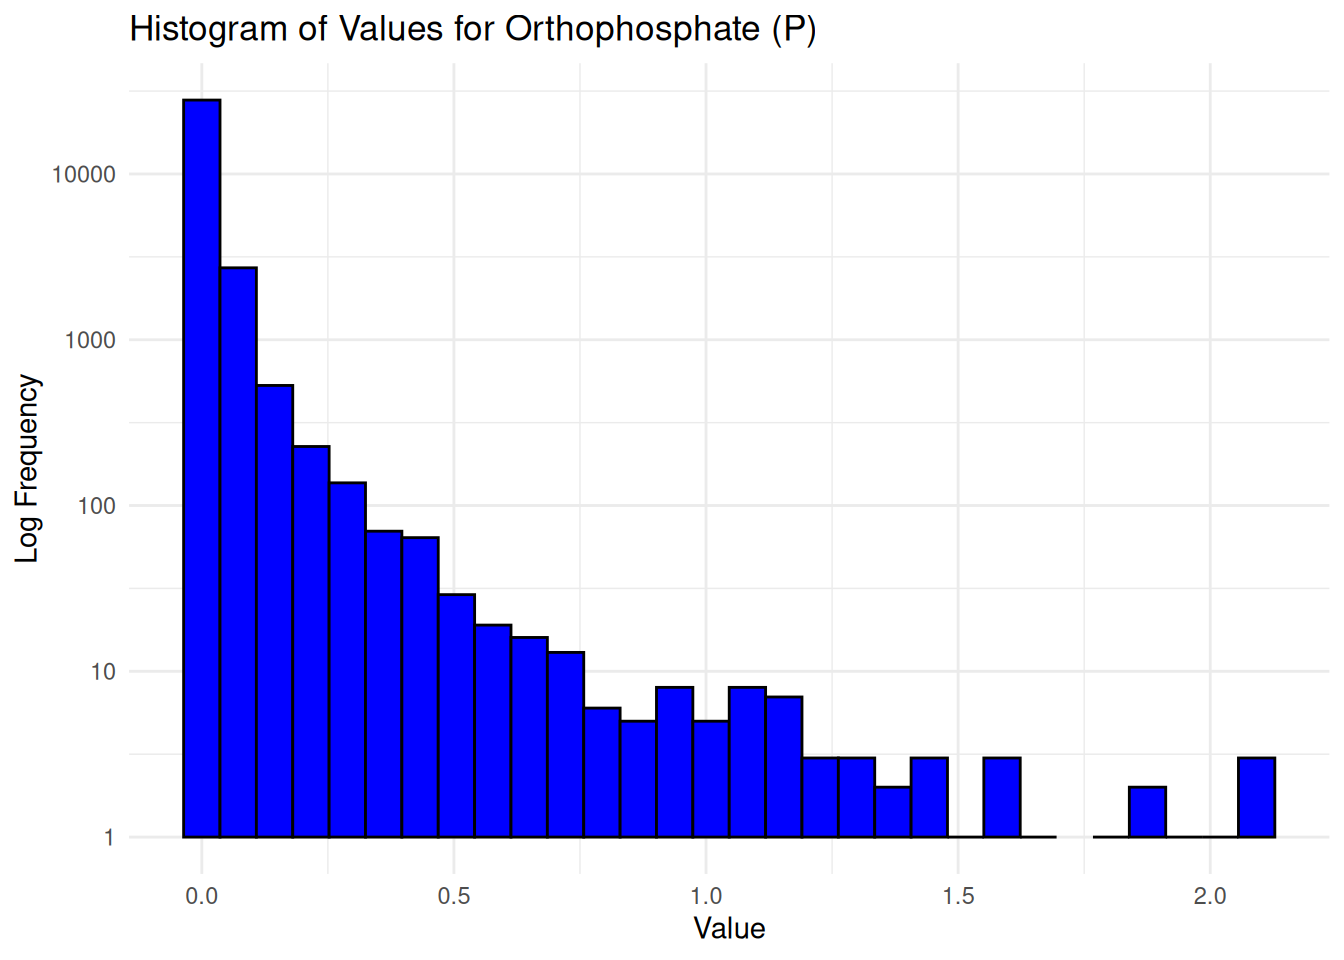
8 Orthophosphate (P) 0 10.0
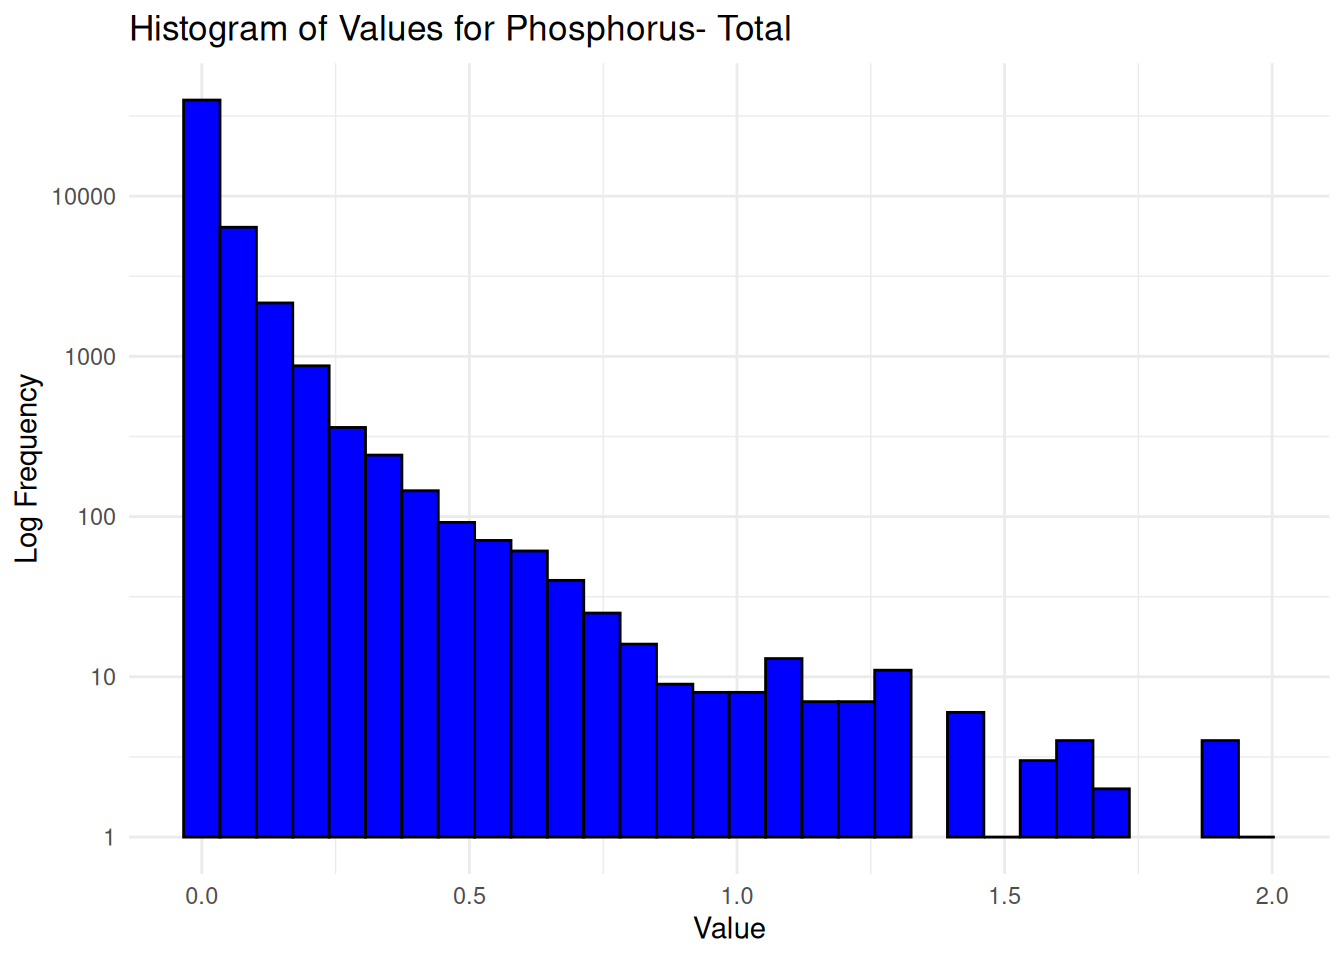
9 Phosphorus- Total 0 2.0
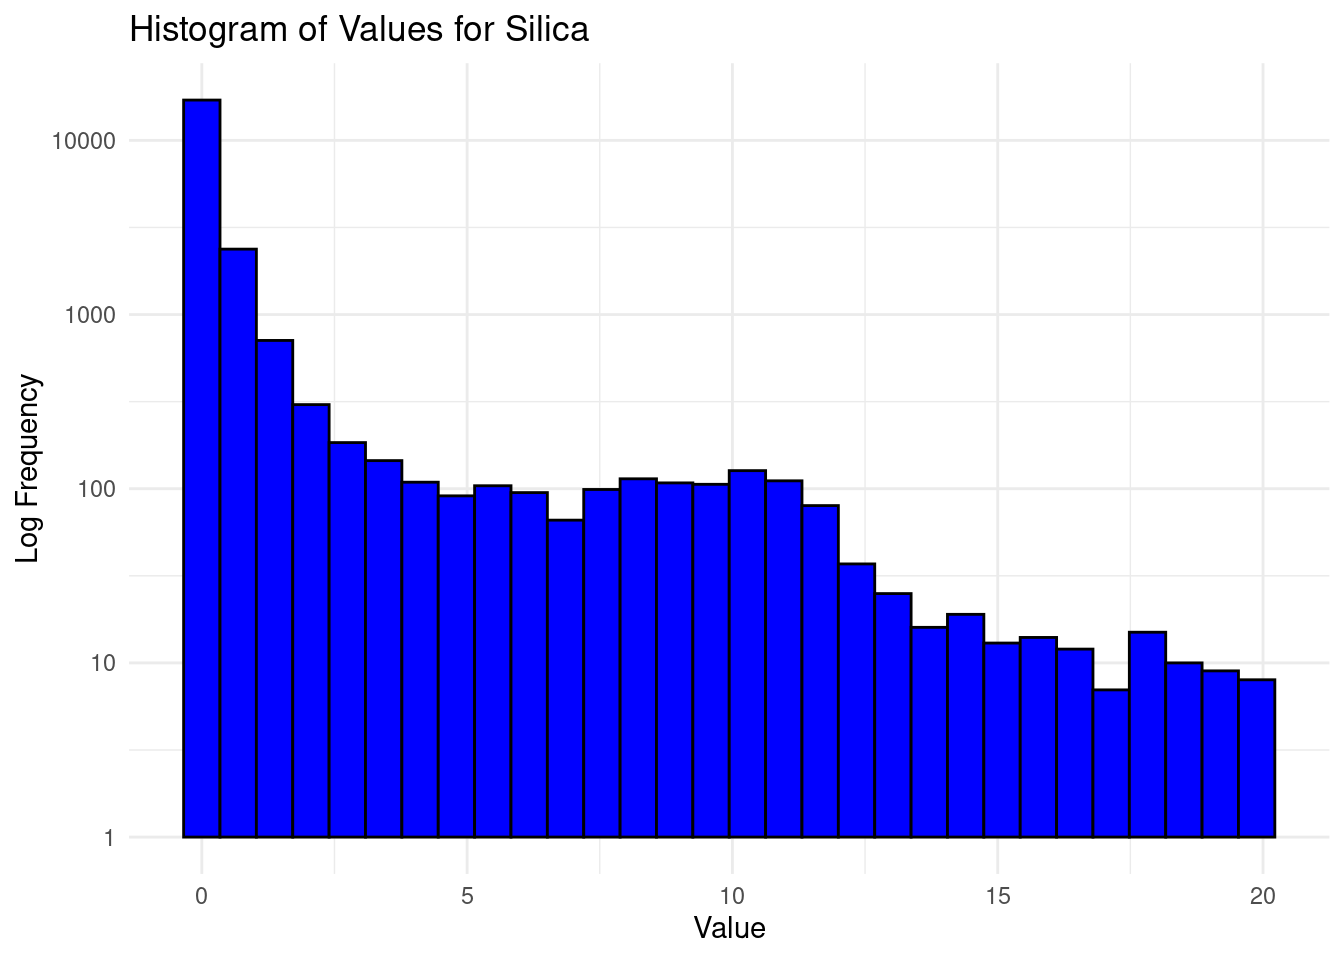
10 Silica 0 20.0
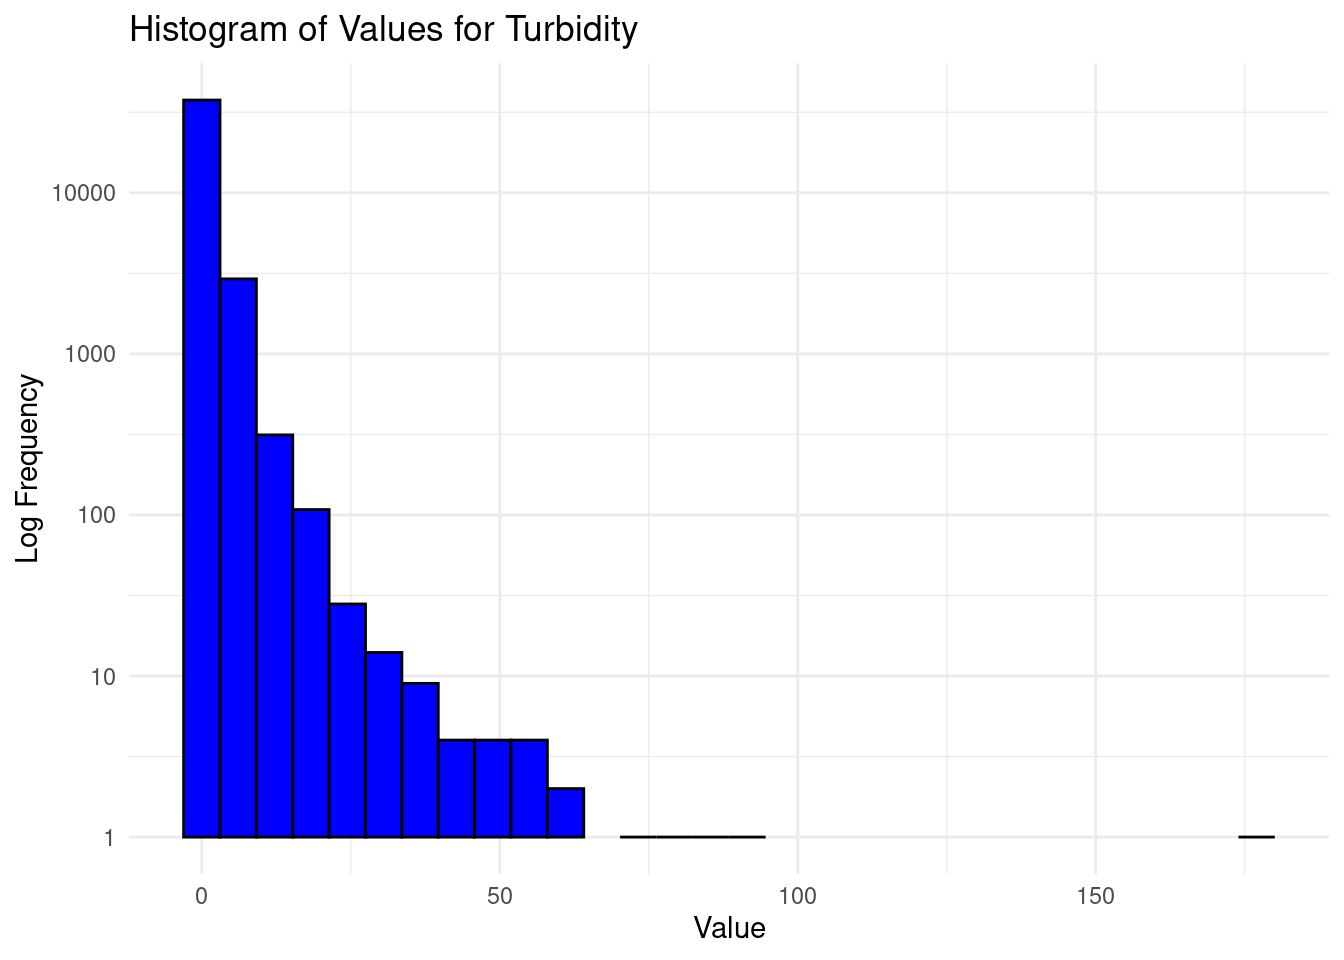
11 Turbidity 0 200.0Details on bound filtering and more info are in each parameter report listed below.