A drilldown into a set of random parameter+program+site combinations.
Code
library(here)library(dplyr)source(here("SEACARProgramCompare/mapProgramNameToShortName.R"))# === new datasetdf_SEACAR <- readr::read_delim(here("data/Discrete WQ - 10006.txt"),delim ="|") %>%# align programName between datasetsmutate(ProgramName =mapProgramNameToShortName(ProgramName))# === previous year's datasetdf_OLD <- readr::read_delim(here::here("data/allDataSEACAR.csv"), delim=",") %>%# align programName between datasetsmutate(ProgramName =mapProgramNameToShortName(ProgramName))# === keep only columns of interest to avoid coltype errorscols_of_interest <-c("ProgramName", "ParameterName","ResultValue", "SampleDate","ProgramLocationID")df_SEACAR <- df_SEACAR %>%select(all_of(cols_of_interest))df_OLD <- df_OLD %>%select(all_of(cols_of_interest))# === Combine dataframes with a source columndf_combined <-bind_rows( df_SEACAR %>%mutate(source ="SEACAR_STD"), df_OLD %>%mutate(source ="OLD_STD"))
Random Sample Comparisons
The following is visualization of a random sample of program+parameter combinations.
plot a few random programs and parameters
library(ggplot2)# === 3 parameters from one programrandom_program <-sample(unique(df_combined$ProgramName), 1)program_parameters <-unique(df_combined$ParameterName[df_combined$ProgramName == random_program])random_parameters <-sample(program_parameters, min(3, length(program_parameters)))# Select a random location ID from the programprogram_locations <-unique(df_combined$ProgramLocationID[df_combined$ProgramName == random_program])random_location <-sample(program_locations, 1)cat("=== Program:", random_program, "===\n")
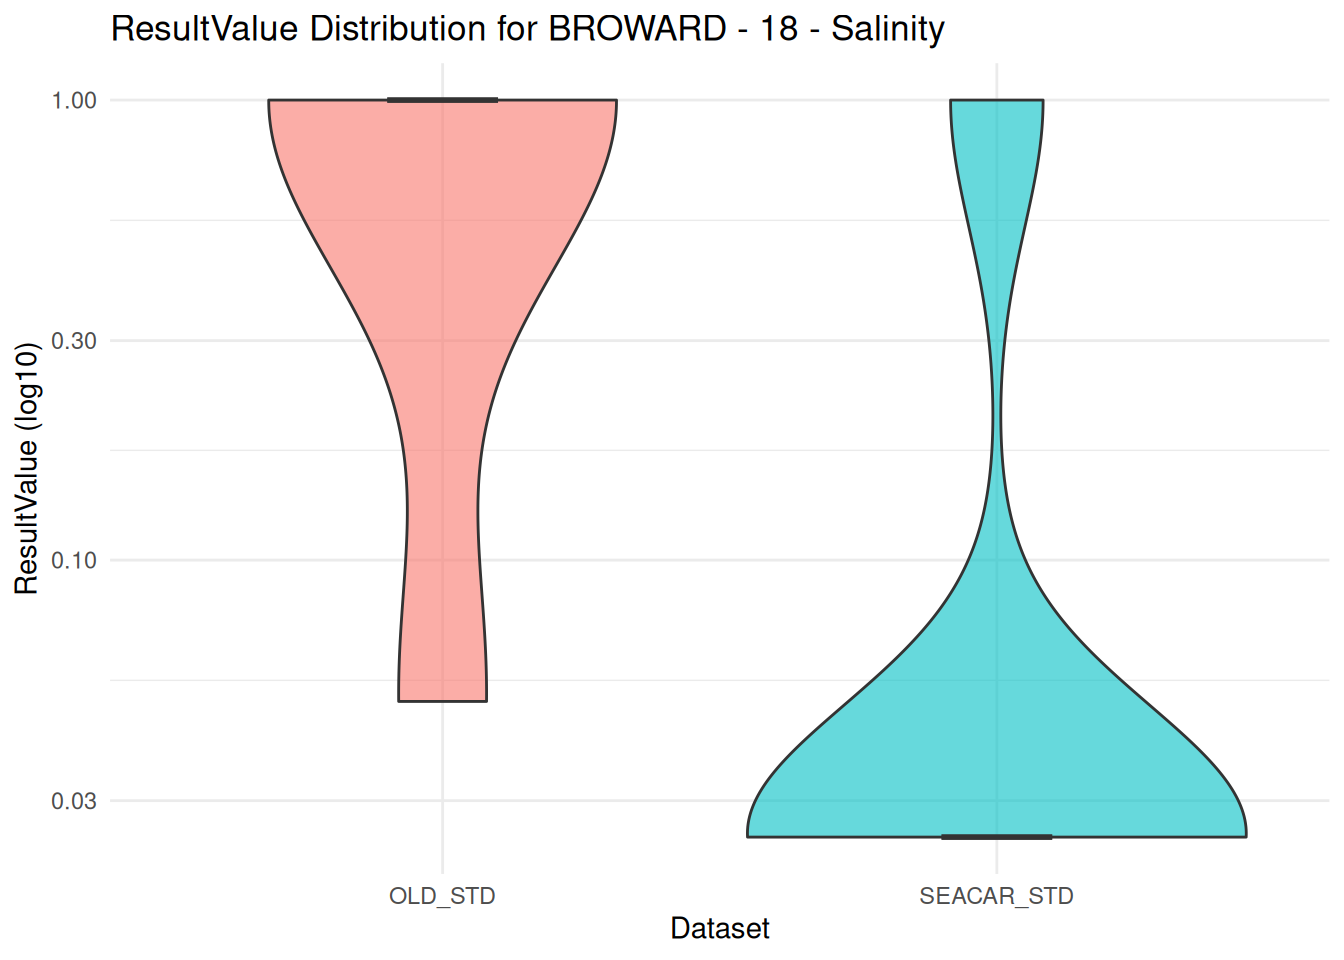
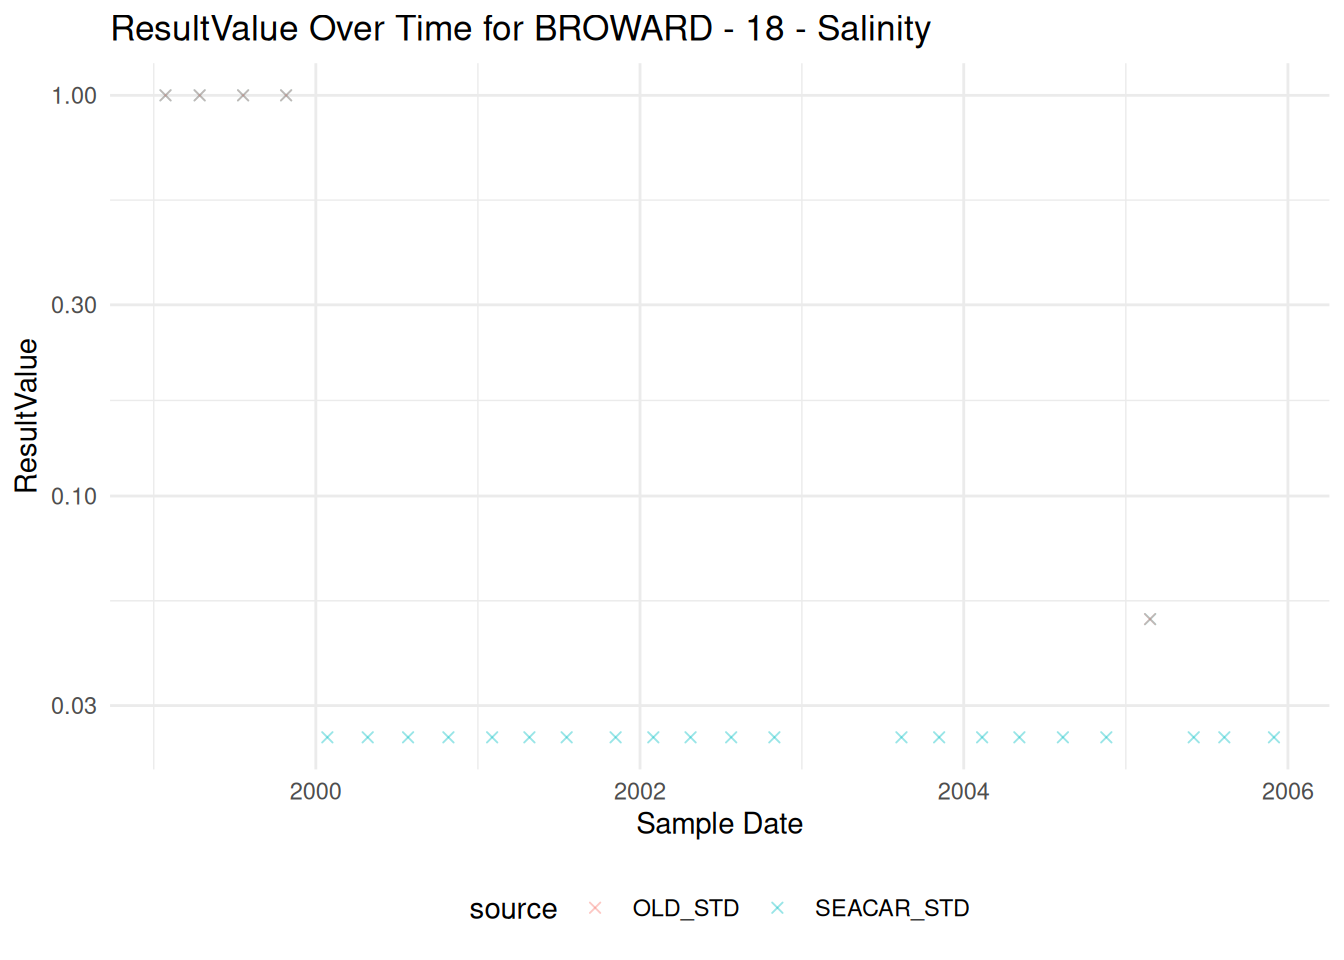
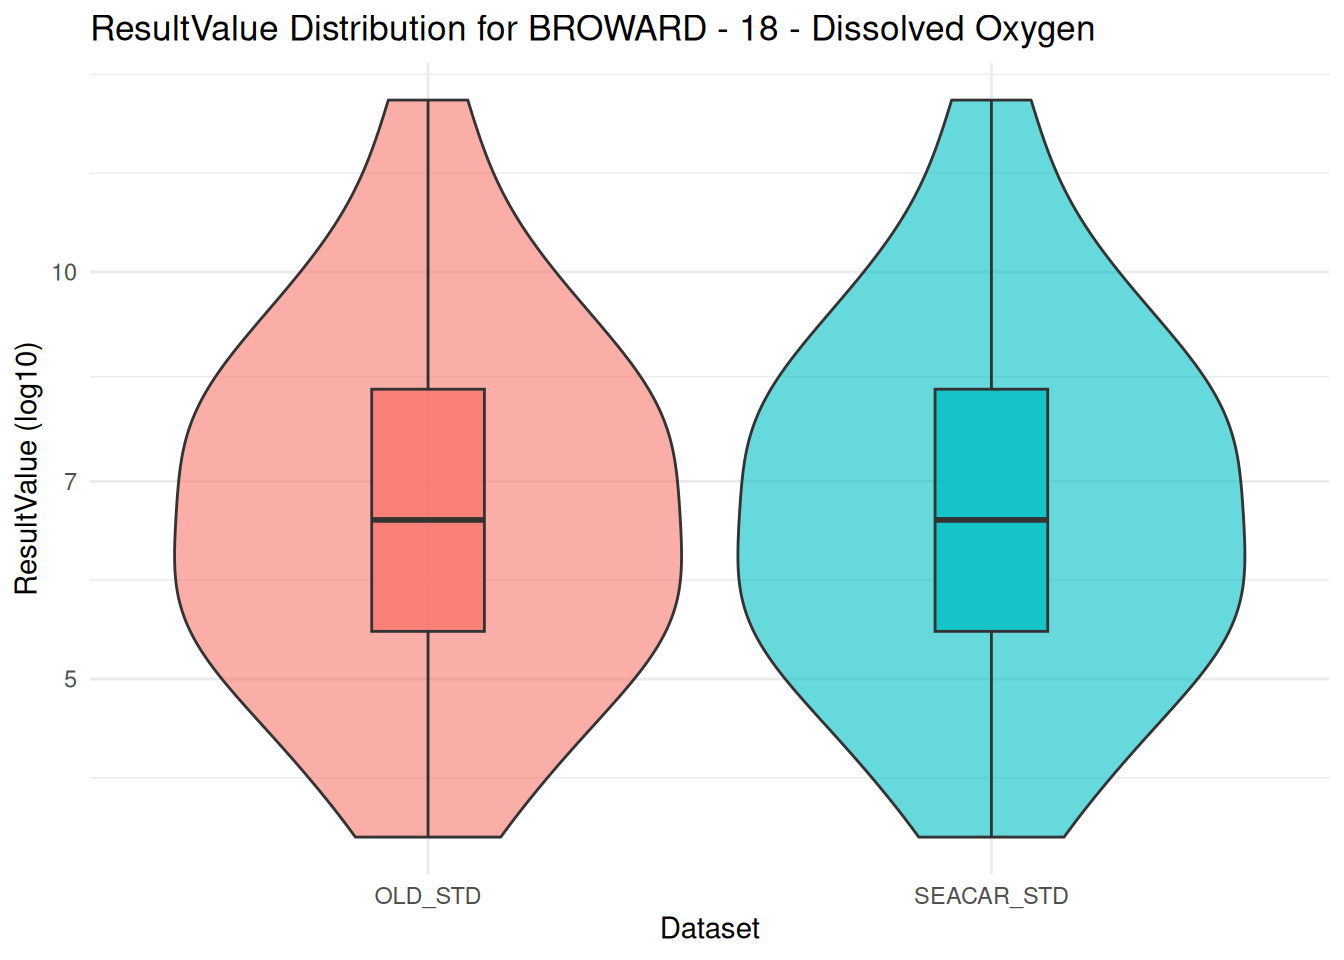
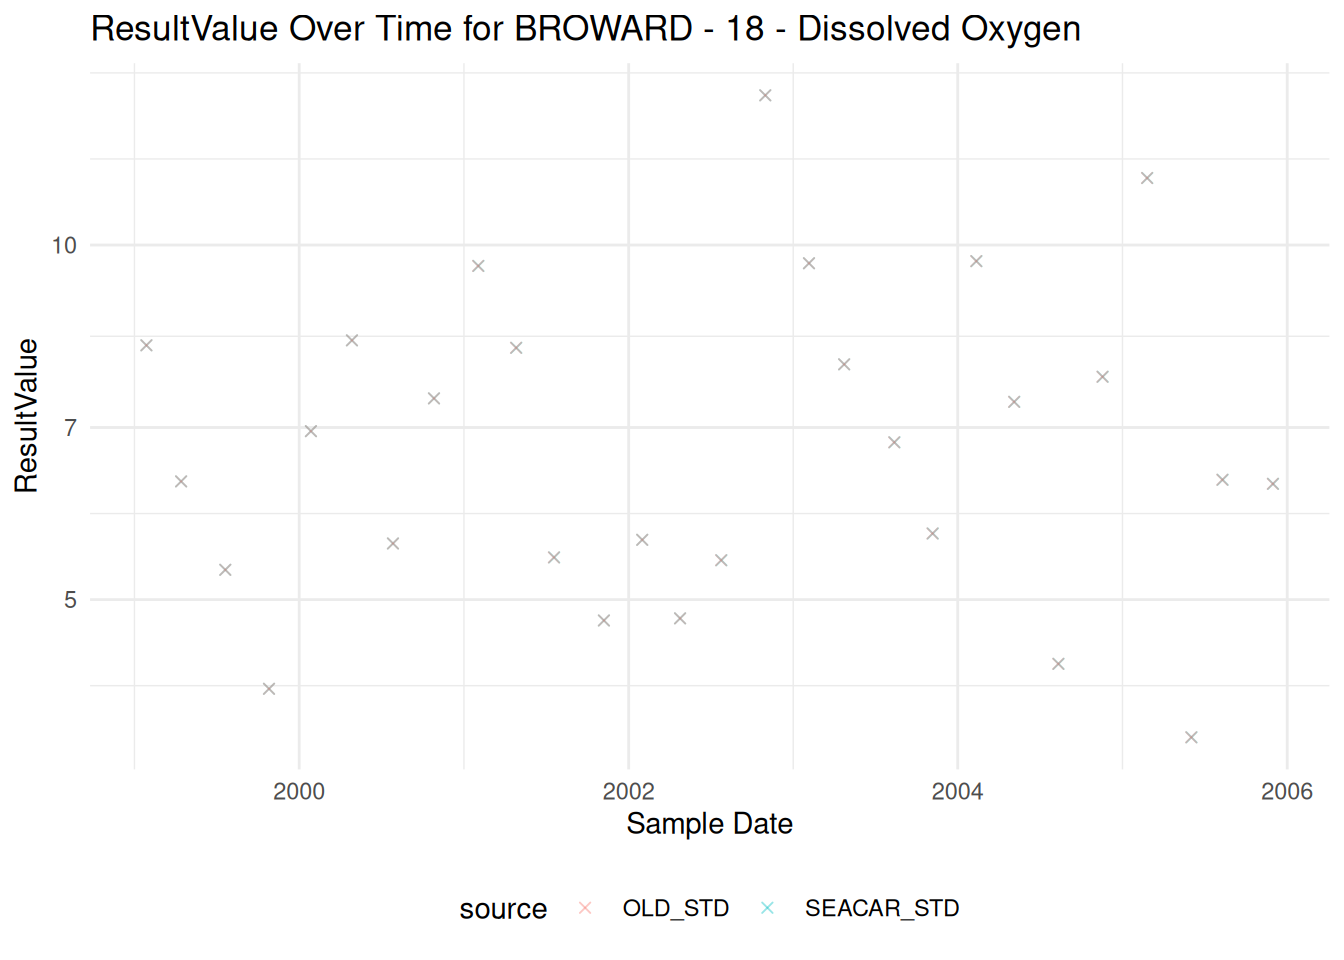
=== Program: DERM ===
plot a few random programs and parameters
cat("Location:", random_location, "===\n")
Location: LSC8 ===
plot a few random programs and parameters
for (i in1:length(random_parameters)) { random_parameter <- random_parameters[i] df_subset <- df_combined %>%filter(ProgramName == random_program, ParameterName == random_parameter, ProgramLocationID == random_location)cat("Parameter:", random_parameter, "\n")# === violin plot p1 <-ggplot(df_subset, aes(x = source, y = ResultValue, fill = source)) +geom_violin(alpha =0.6) +geom_boxplot(width =0.2, alpha =0.8, outlier.shape =NA) +scale_y_log10() +labs(title =paste("ResultValue Distribution for", random_program, "-", random_location, "-", random_parameter),x ="Dataset",y ="ResultValue (log10)" ) +theme_minimal() +theme(legend.position ="none")print(p1)# === time series plot p2 <-ggplot(df_subset, aes(x = SampleDate, y = ResultValue, color = source)) +geom_point(shape =4, alpha =0.4) +scale_y_log10() +labs(title =paste("ResultValue Over Time for", random_program, "-", random_location, "-", random_parameter),x ="Sample Date",y ="ResultValue" ) +theme_minimal() +theme(legend.position ="bottom")print(p2)}