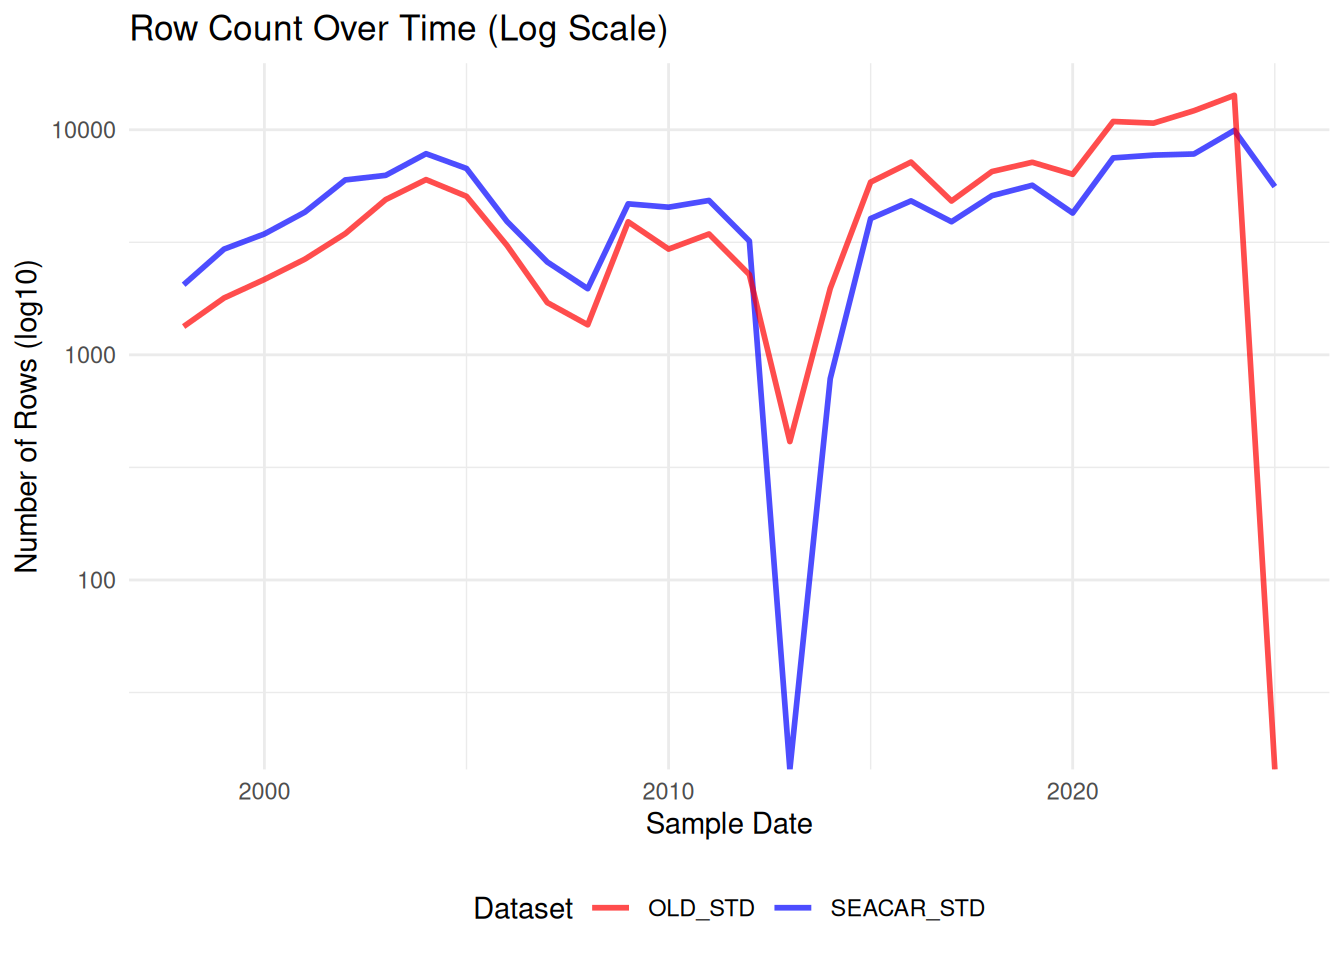
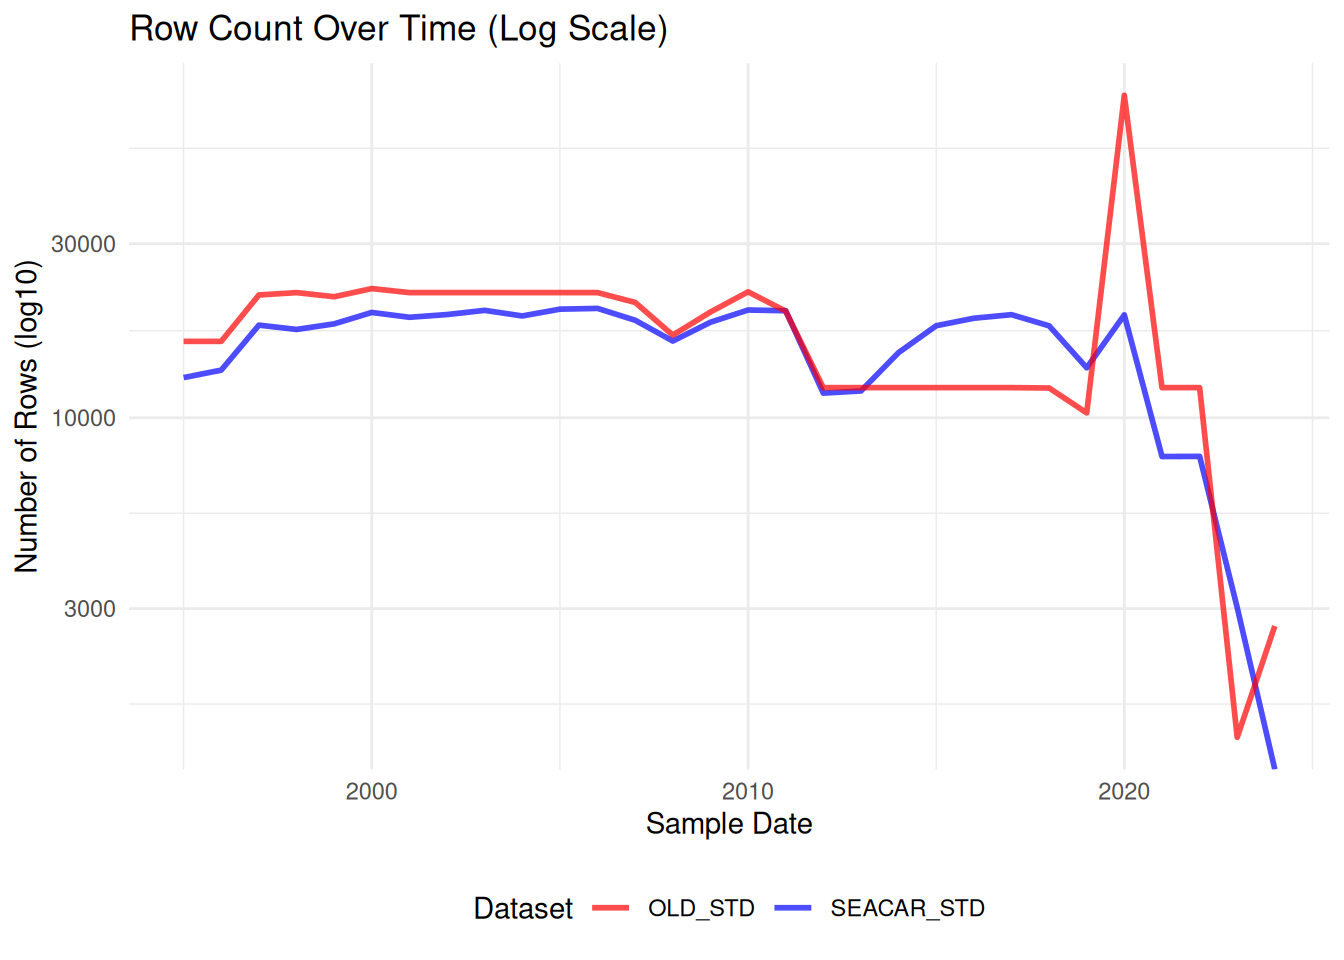
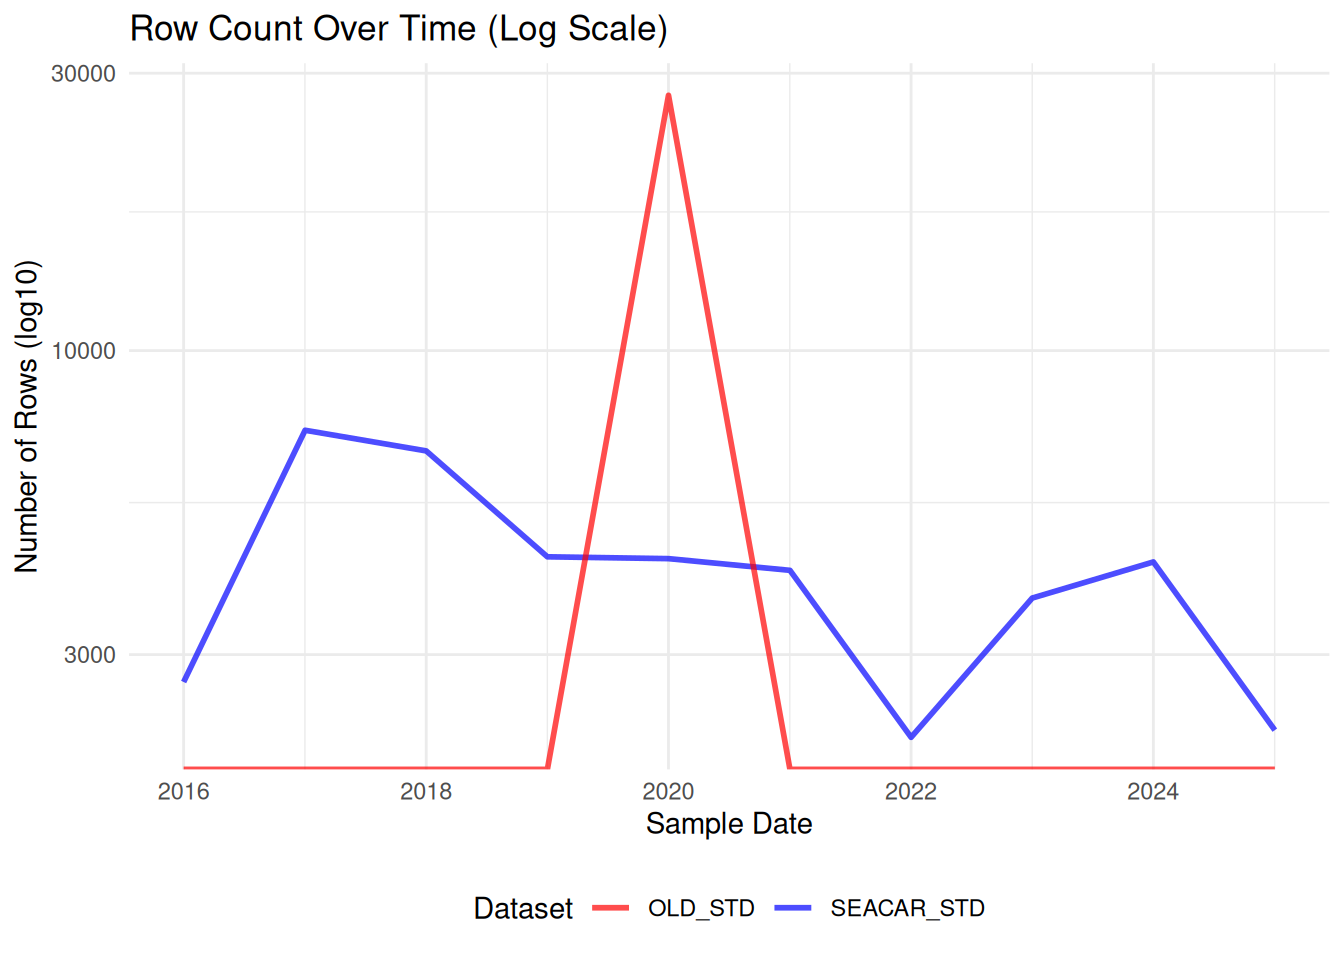
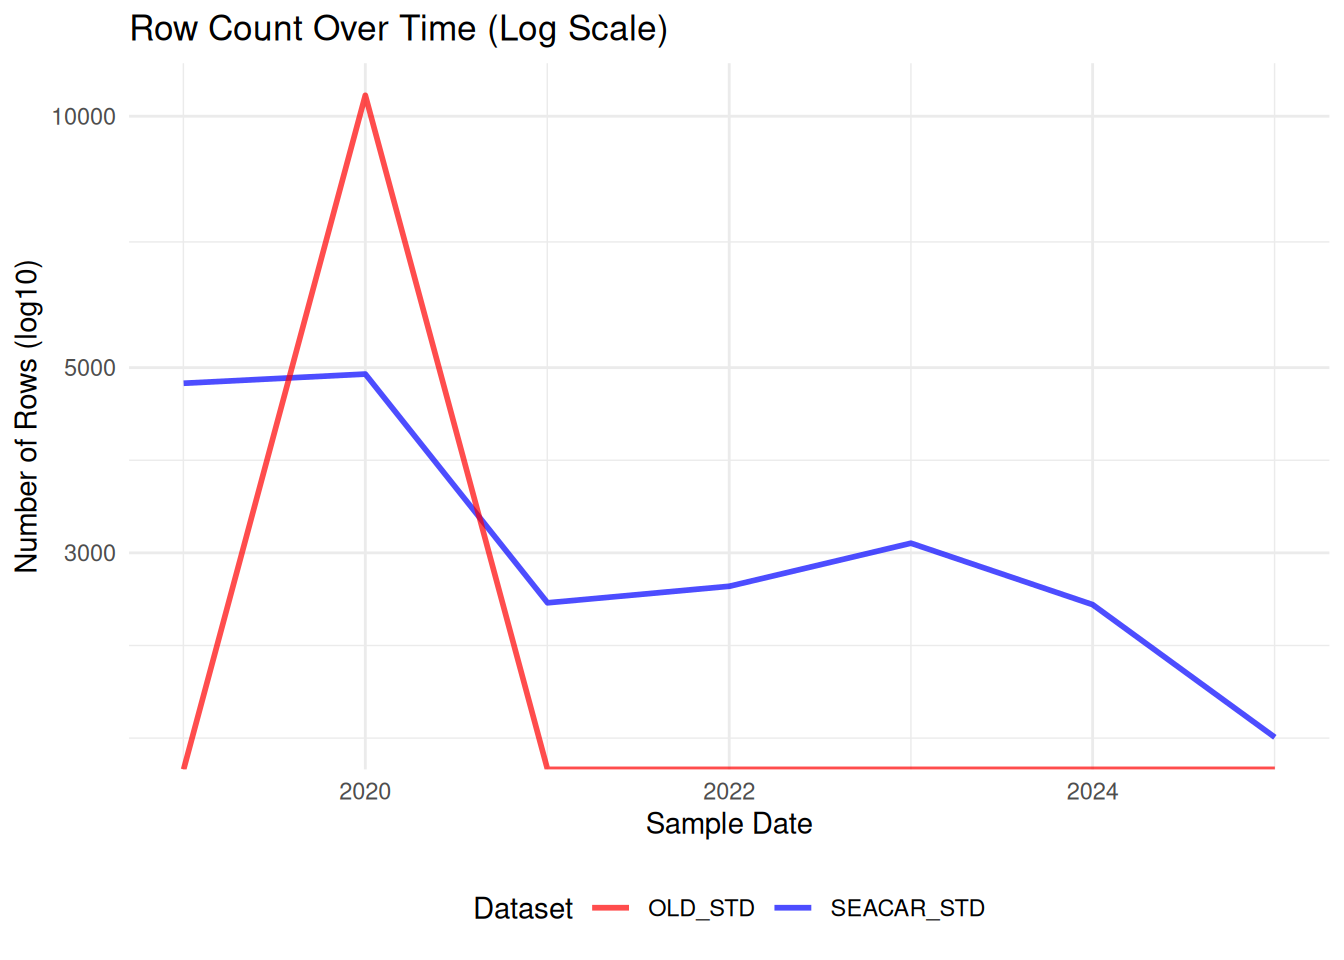
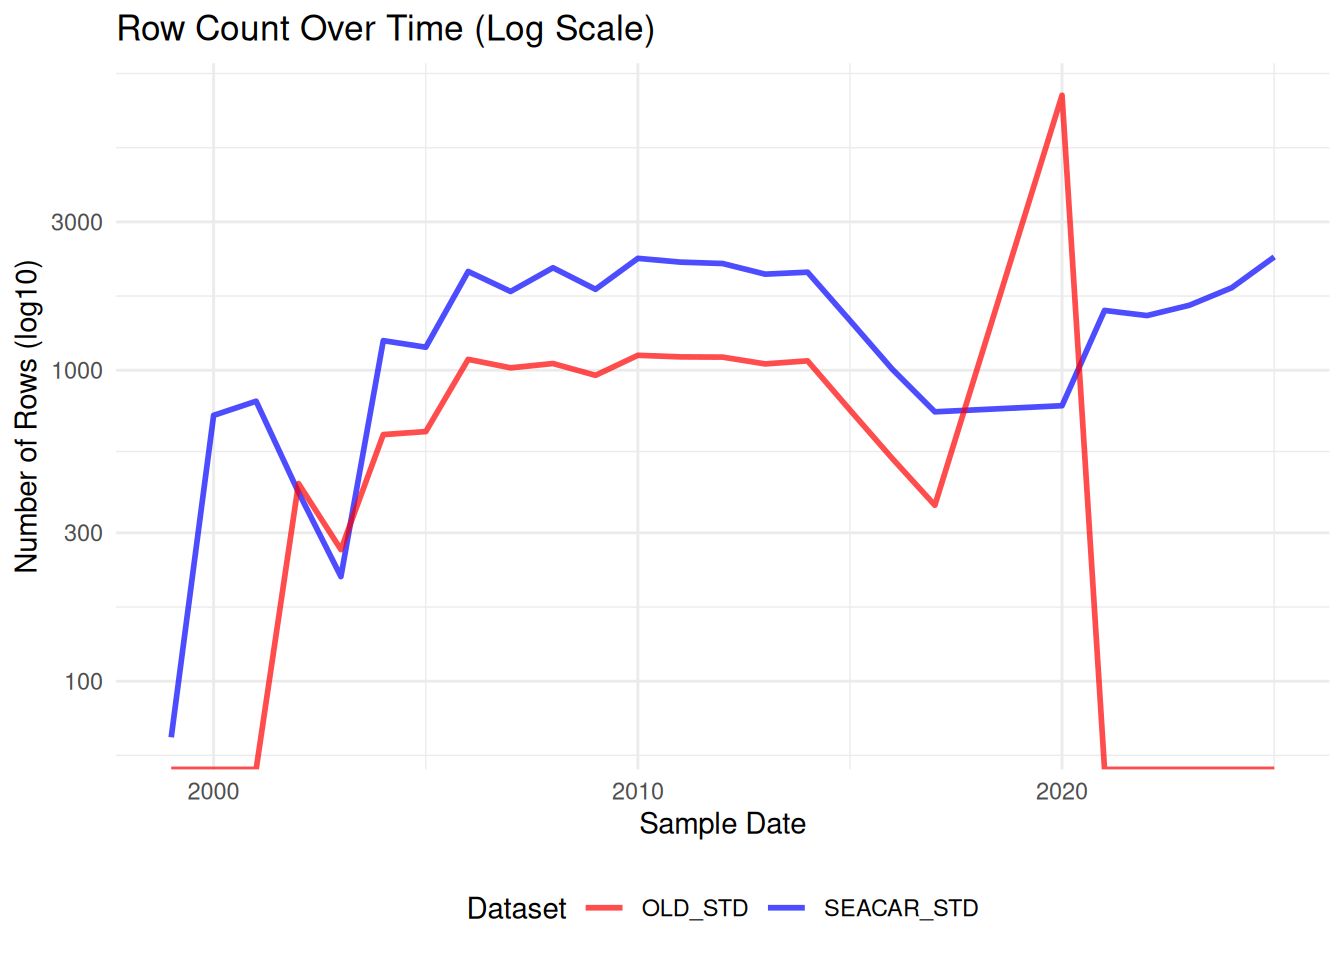
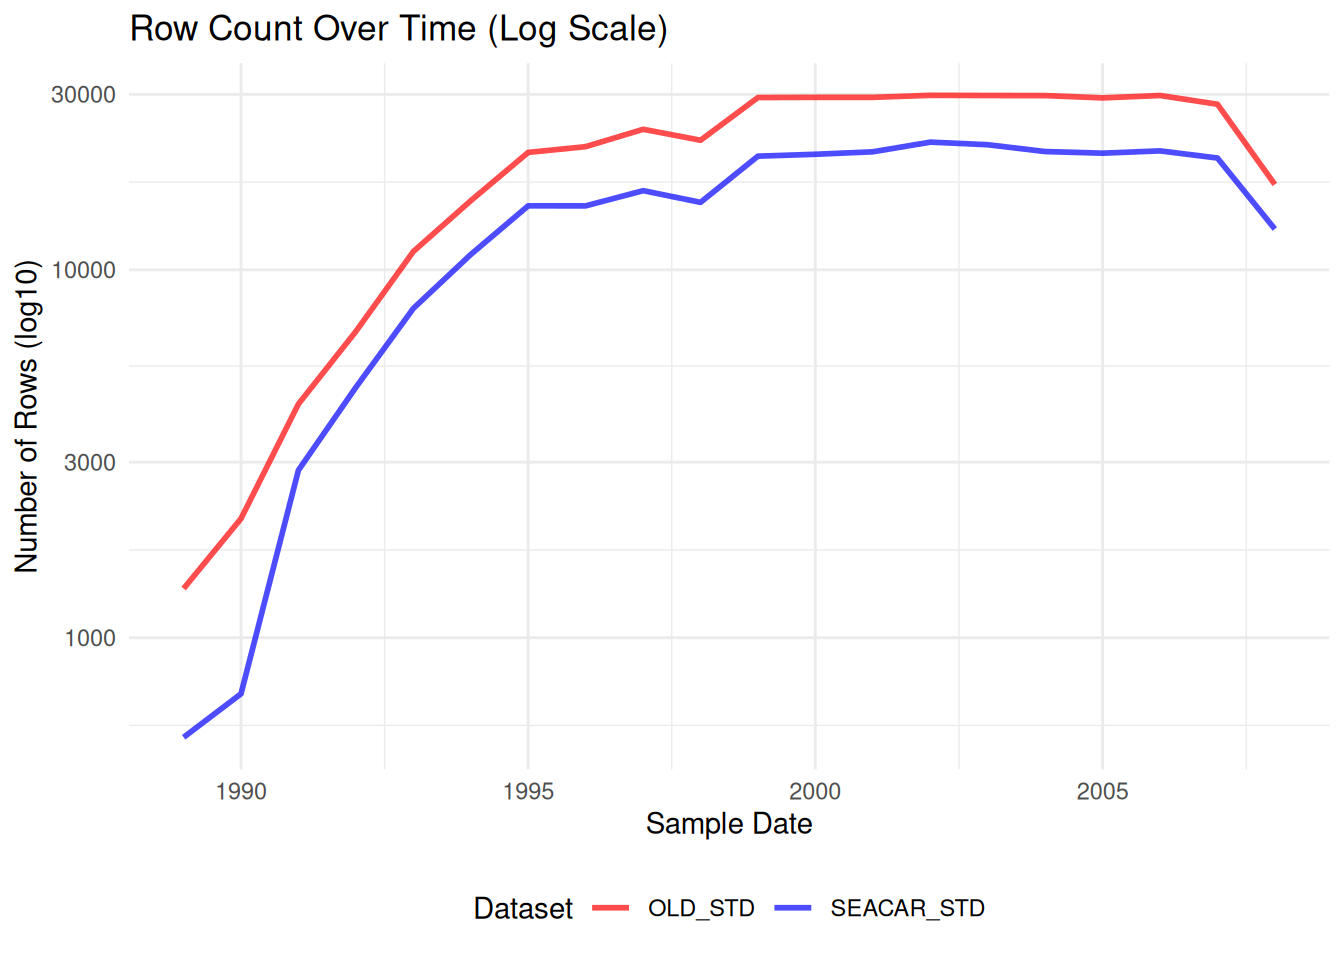
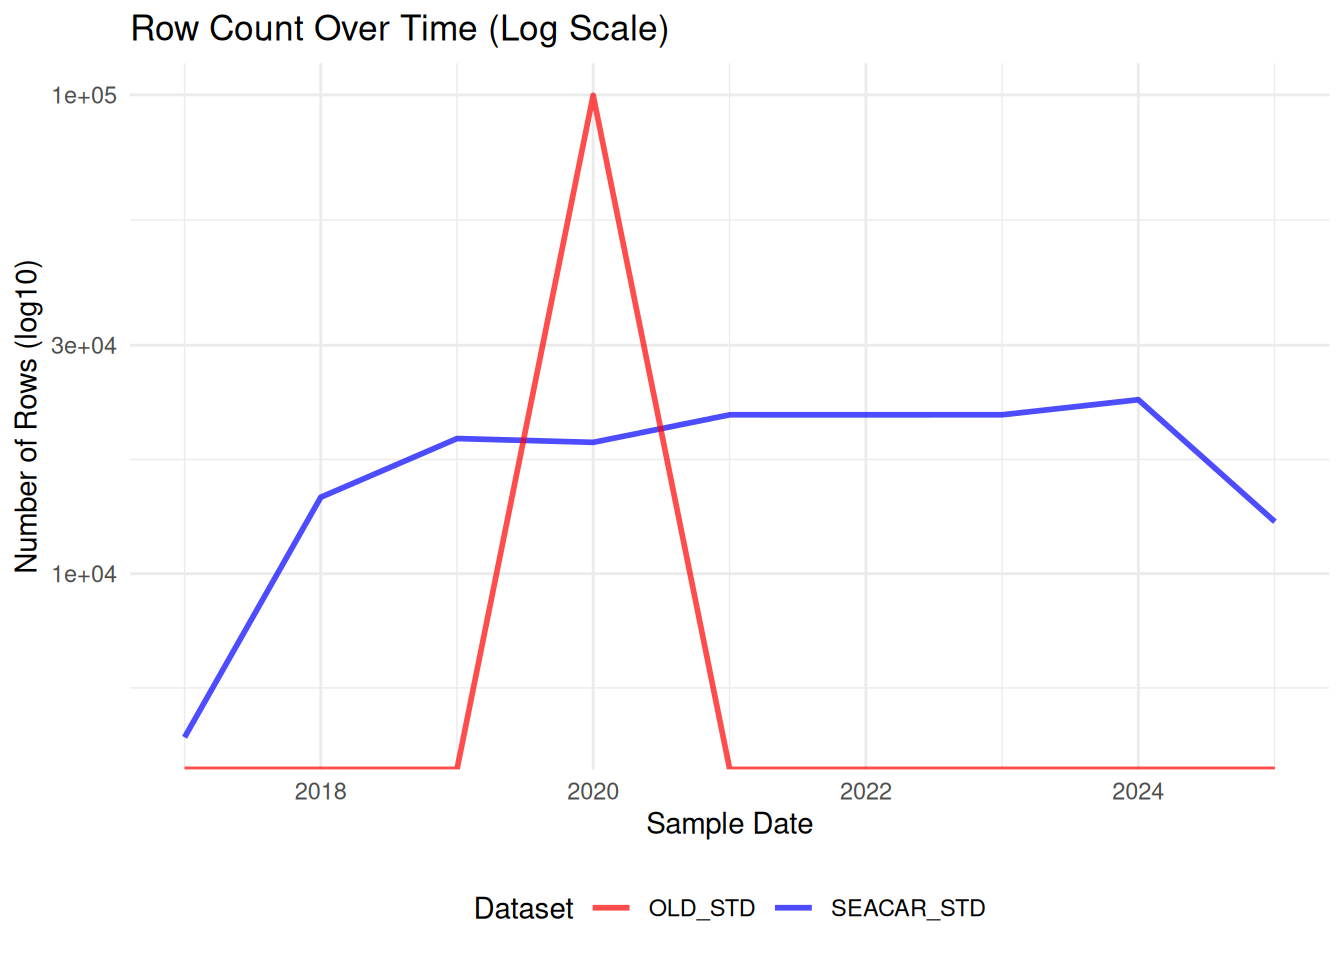
SEACARProgramCompare

Reports for each value in the batch.

Click on any element for more details.

Code
# load each dataset and map ProgramNames to common "shortName" vocabulary
library(here)
library(dplyr)
source(here("SEACARProgramCompare/mapProgramNameToShortName.R"))

df_SEACAR <- readr::read_delim(
  here("data/Discrete WQ - 10006.txt"),
  delim = "|"
) %>%
  mutate(ProgramName = mapProgramNameToShortName(ProgramName))

df_OLD <- readr::read_delim(here::here("data/allDataSEACAR.csv"), delim=",") %>%
  mutate(ProgramName = mapProgramNameToShortName(ProgramName))

library(dplyr)
compare programs in dataset
# Compares the unique program names between SEACAR and OLD datasets to show overlaps and differences)
u1 <- unique(df_SEACAR$ProgramName)
u2 <- unique(df_OLD$ProgramName)

comparison <- tibble(value = union(u1, u2)) %>%
  mutate(
    in_SEACAR = value %in% u1,
    in_OLD    = value %in% u2
  )

print(comparison, n=100)
# A tibble: 10 × 3
   value       in_SEACAR in_OLD
   <chr>       <lgl>     <lgl> 
 1 AOML_SFPSSS TRUE      TRUE  
 2 FKNMS       TRUE      TRUE  
 3 SERC        TRUE      TRUE  
 4 DERM        TRUE      TRUE  
 5 BBWW        TRUE      TRUE  
 6 MiamiBeach  TRUE      TRUE  
 7 NBB_DWQP    TRUE      TRUE  
 8 SE_FL_WQAS  TRUE      TRUE  
 9 PalmBeach   TRUE      TRUE  
10 BROWARD     TRUE      TRUE  
show bar plot of row count grouped by ProgramName
library(ggplot2)
library(tidyr)
library(plotly)

# Count rows by ProgramName for SEACAR dataset
seacar_program_counts <- df_SEACAR %>%
  group_by(ProgramName) %>%
  count(name = "SEACAR_Count") %>%
  arrange(desc(SEACAR_Count))

# Count rows by ProgramName for OLD dataset
old_program_counts <- df_OLD %>%
  group_by(ProgramName) %>%
  count(name = "OLD_Count") %>%
  arrange(desc(OLD_Count))

# Create combined dataframe for plotting
combined_program_counts <- full_join(
  seacar_program_counts,
  old_program_counts,
  by = "ProgramName"
) %>%
  mutate(
    SEACAR_Count = replace_na(SEACAR_Count, 0),
    OLD_Count = replace_na(OLD_Count, 0)
  ) %>%
  # Reshape to long format for dodged bars
  pivot_longer(
    cols = c(SEACAR_Count, OLD_Count),
    names_to = "source",
    values_to = "count"
  ) %>%
  mutate(source = ifelse(source == "SEACAR_Count", "SEACAR_STD", "OLD"))

# Create interactive bar plot
p <- ggplot(combined_program_counts, aes(x = ProgramName, y = count, fill = source, 
                                         text = paste("Program:", ProgramName, "<br>",
                                                      "Dataset:", source, "<br>",
                                                      "Count:", count))) +
  geom_bar(stat = "identity", position = "dodge") +
  labs(
    title = "Row Count by ProgramName (Hover for details)",
    x = "",  # Remove x-axis label
    y = "Number of Rows",
    fill = "Dataset"
  ) +
  theme_minimal() +
  theme(
    axis.text.x = element_blank(),  # Hide x-axis text
    axis.ticks.x = element_blank(),  # Hide x-axis ticks
    plot.margin = margin(20, 20, 20, 20)
  )

# Convert to interactive plotly
ggplotly(p, tooltip = "text") %>%
  layout(hoverlabel = list(bgcolor = "white", font = list(size = 12)))